Monitor Edge Threat Management
The Edge Threat Management dashboard displays the Monitor screen by default.
Security Overview
The Monitor Security Overview screen provides a quick review of the security health of the user's network. This helps the security administrator identify Edges that lack the latest Security Profile and prioritize urgent security events.
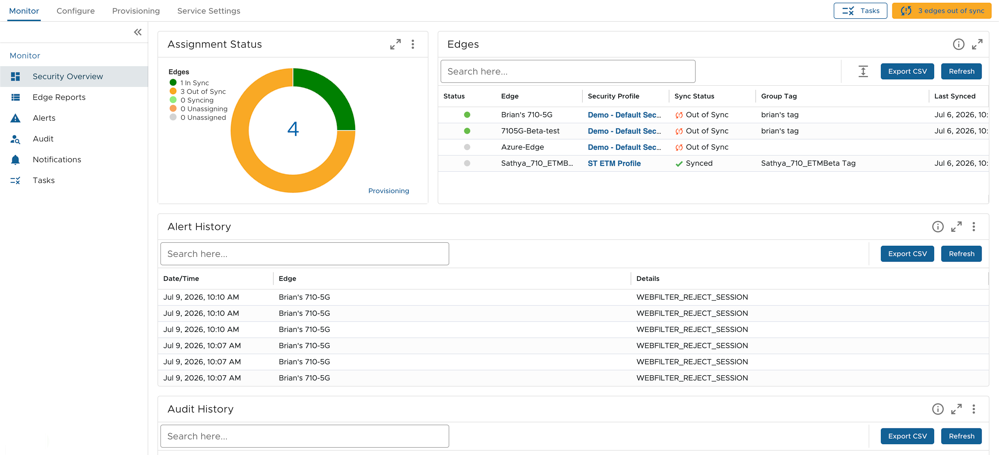
| Feature | Description |
|---|---|
| Assignment Status | Displays the Edge assignment status. Example: In Sync, Out of Sync, Syncing, Unassigned, and so on.
Users can directly access the Provisioning screen from this section. |
| Edges | Displays the list of Edges along with their Security Profiles, Sync details, Group Tag, Serial Numbers, and Locations.
Clicking on a Security Profile directs users to the screen. |
| Alert History | Displays the list of alerts generated by the Edges along with Date/Time details. Similar alerts are grouped into 15-minute intervals.
Select an entry to view additional information. |
| Audit History | Displays the list of account activities.
Select an entry to view additional information. |
| Policy Analytics | Displays the analytics information for the security policy. Users can view the Issue, Severity, Recommendation, and Date Created. Clicking the Review arrow in the Action column opens the Edit Rule screen. Click the delete icon to remove an issue from the list.
To initiate the analysis, click the Analyze button. To check the status of the analysis, click the Tasks option located at the top right of the Monitor screen. |
Click the double arrow located at the top right of each section to expand it for a better view.
Edge Reports
The Monitor Edge Reports screen monitors consolidated bandwidth usage, web activities, and security events across all managed networks. It helps analyze aggregated data from all Edges or review site-specific reports to evaluate precise network flows.

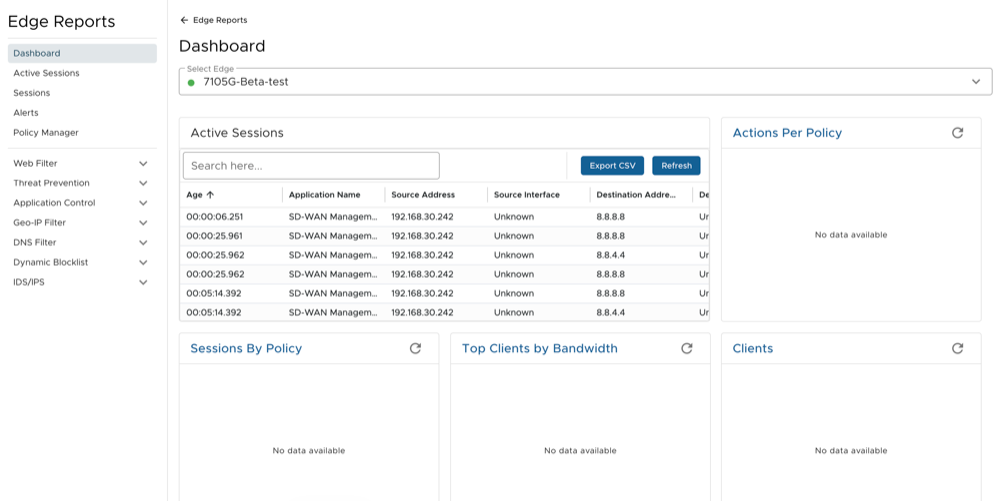
- Active Sessions: Displays the details for active Edge sessions only.
- Sessions: Displays the details for all the sessions. Select the From and To dates, and then click Apply to retrieve data from a particular time period for all sessions. Users can also refine this data based on Reject, Block, and Alert action filters.
- Alerts: Select the From and To dates, and then click Apply to retrieve alert details from a particular time period.
- Policy Manager: Select the From and To dates, and then click Apply to retrieve Security Policy details from a particular time period.
| Filter Type | Subtype | Description |
|---|---|---|
| Web Filter | Summary | Displays the list of Clients, Sites, and Categories. Users can also refine this data based on Reject, Block, and Alert action filters. |
| Visited Sites | Select a reason (Block Category, Block List, Pass Category, Pass List, or All) from the Reason drop-down menu to display site information such as Time Stamp, Site, Source and Destination Addresses, Verdict, Action, and Category. Users can also refine this data based on Reject, Block, and Alert action filters. | |
| IP Reputation | Summary | Displays the list of IP addresses by Time and the top addresses by Count. Users can also refine this data based on Reject, Block, and Alert action filters. |
| Sessions | Select a direction (All, Inbound or Outbound) from the Direction drop-down menu to display session information such as Time Stamp, Direction, Source and Destination Addresses, Host, Reputation Score, Verdict, Reason, and Action. Users can also refine this data based on Reject, Block, and Alert action filters. | |
| URL Threat Prevention | Blocked Summary | Displays the list of Blocked IP addresses / Domains by Time and Top Addresses By Blocked Count. |
| Blocked Addresses | Displays information such as Time Stamp, Direction, Source Address, Blocked Address, and Reputation Score. | |
| Rejected Summary | Displays the list of Rejected IP addresses by Time and Top Addresses By Rejected Count. | |
| Application Control | Applications | Displays information such as Time Stamp, Name, Verdict, Action, Source and Destination Addresses, Source Port, and Destination Port. Users can also refine this data based on Reject, Block, and Alert action filters. |
| Geo-IP Filter | Sessions | Select a direction (All, Inbound, or Outbound) from the Direction drop-down menu to display session information such as Time Stamp, Direction, Source and Destination Addresses, Source and Destination Countries, Destination DNS Cache, Verdict, and Action. Users can also refine this data based on Reject, Block, and Alert action filters. |
| Outbound Blocked Countries | Displays the list of Blocked Countries by Time and Countries by Blocked Count. | |
| Inbound Blocked Countries | Displays the list of Blocked Countries by Time and Countries by Blocked Count. | |
| Distribution Map | Displays the Distribution Map, Outbound Blocked Sessions, and Inbound Blocked Sessions. | |
| DNS Filter | Summary | Displays DNS Filter Top Blocked Domains, DNS Filter Top Visited Domains, DNS Filter Top Clients by Blocked Domains, and DNS Filter Top Clients by Visited Domains. |
| Visited Domains | Displays information such as Time Stamp, Verdict, Action, Domain, Source and Destination Addresses. Users can also refine this data based on Reject, Block, and Alert action filters. | |
| Dynamic Blocklist | Blocked Summary | Displays Blocked IP addresses / Domains by Time, Top Addresses By Blocked Count, and Top Domains By Blocked Count. |
| Blocked Addresses | Displays information such as Time Stamp, Verdict, Action, Source and Destination Addresses, Host, and Blocklist Entry. Users can also refine this data based on Reject, Block, and Alert action filters. | |
| IDS/IPS | Summary | Displays Signature information, Total IDPS Triggers, IDPS Events by Time, IDPS Events by Client, and IDPS Triggers by Class Type. |
| IDS/IPS Events | Displays information such as Time Stamp, Verdict, Action, Source and Destination Addresses, Client and Server Ports, Severity, Signature, SID, and IPS Action. |
Alerts
The Monitor Alerts screen displays activities from Edge Threat Management appliances connected to the user's account.
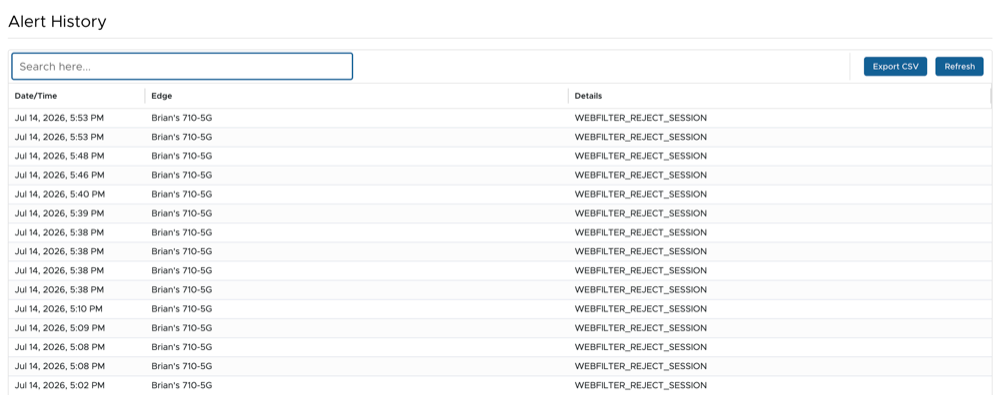
The Alert History provides a log of security events and other types of built-in ETM processing activities. For example, a blocked session due to Geo-IP Filtering or Web Filter may generate an alert. Security Rules and Templates have individual settings to enable alerting for related events.
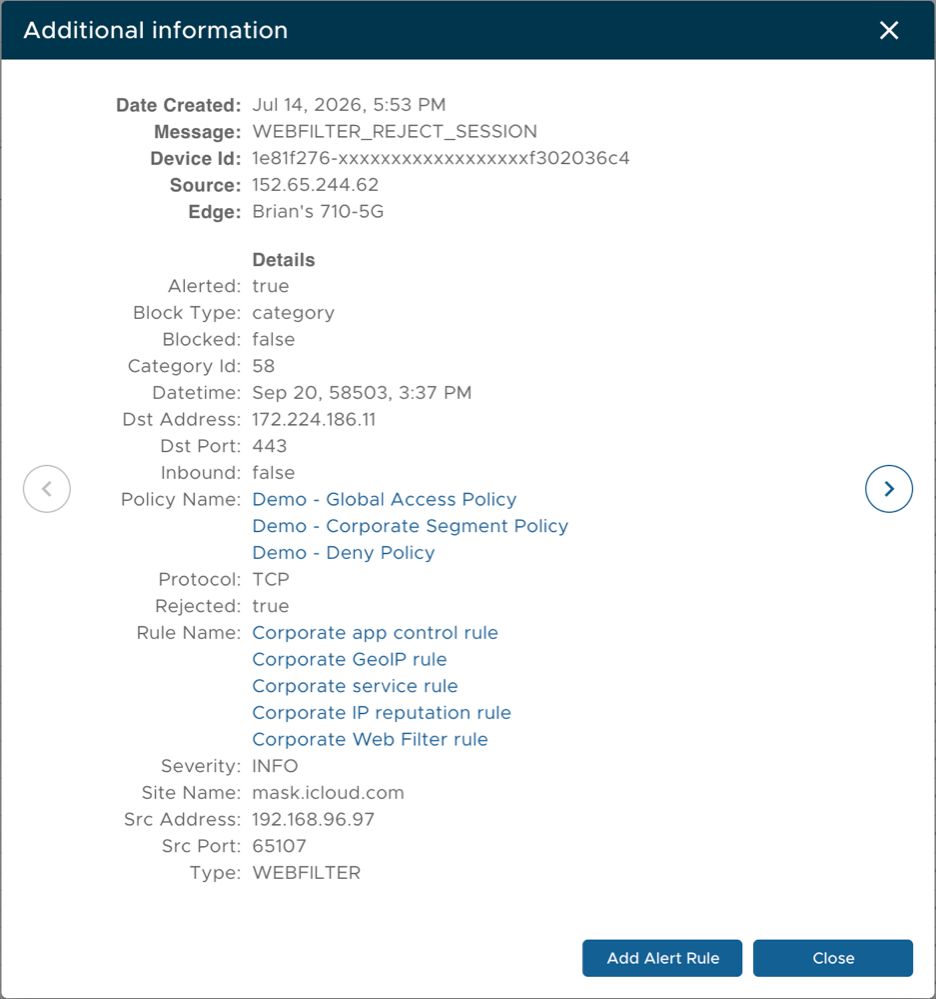
The Add Alert Rule button creates rules for receiving alerts. This helps in determining which events route to the selected Notification Profiles. For more information, see Service Settings. Click Close to close the Additional Information window.
Audit
The Monitor Audit screen displays activities such as logins or configuration changes to appliances. This allows other users to manage appliances in the account and enables auditing of their activities.
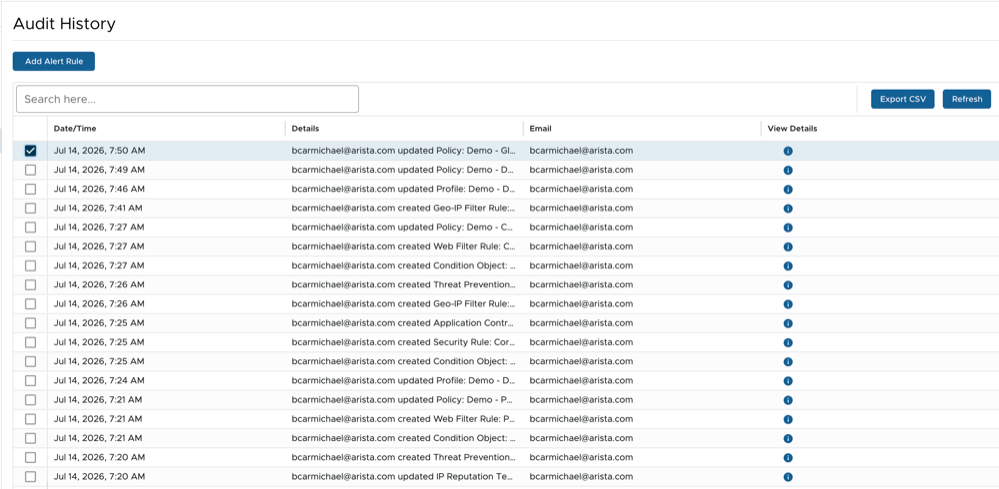
The Audit History provides a log of ETM audit events, such as template updates or policy assignments to Security Profiles.
Select an audit event and click Add Alert Rule to configure custom notifications for that event. For more information, see Service Settings.
Click the link under the View Details column to view additional audit information.
Notifications
The Monitor Notifications screen displays a list of all processed notifications.
To access the Notifications screen, select on the ETM dashboard.
The Notification Log reports when each alert message occurs and which Notification Profile it uses. This information confirms whether the account sends alerts and delivers them successfully.
Tasks
The Monitor Tasks screen displays a list of user-initiated tasks, along with information such as Date, Status, Error Message, Number of Attempts, and more.
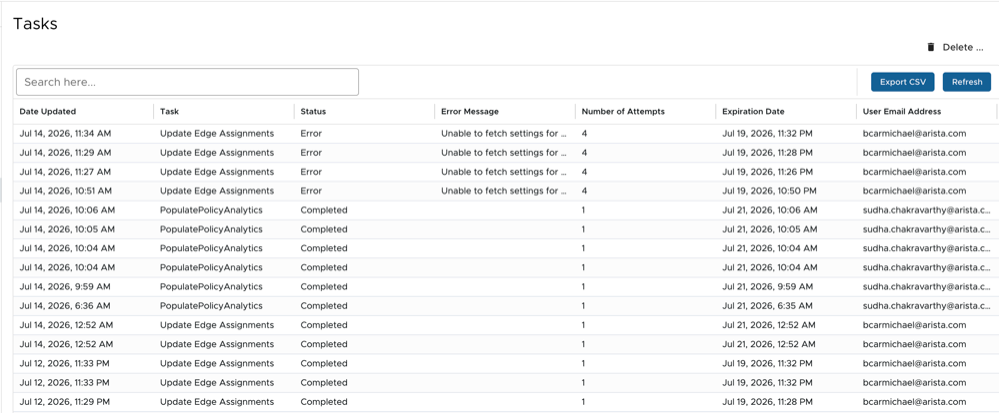
Click the Delete button to delete one or more tasks.