Monitor Gateways using Telegraf
Telegraf is a plugin-driven server agent that collects and sends metrics and events from systems. Users can configure Telegraf to collect the counters and statistics from an Input plugin and to send the data to an Output plugin.
To integrate Telegraf with Gateways to collect and export the counters to a third party plugin, see Configure Telegraf Integration.
Configure Telegraf Integration
The Input plugin is /etc/telegraf/vcg_metrics.py, a file that contains the counters to be added. The Output plugin can be either Wavefront or Prometheus.
Telegraf collects the metrics from the declared Inputs and sends the details to the declared Outputs.
The following image shows an example output displayed in the wavefront dashboard. The Graph illustrates Enterprise level information of flow count, NAT count, route count, and throughput details.
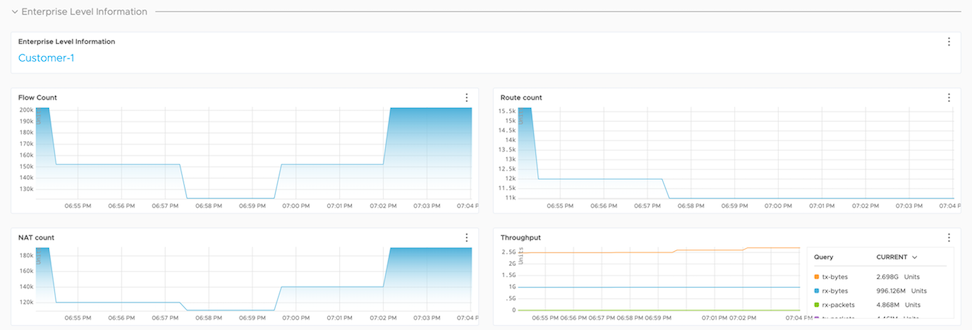
For the list of the counters that are exported by the input plugin script /etc/telegraf/vcg_metrics.py, see Supported Counters.
Configure Telegraf as Syslog Receiver
To configure Telegraf as syslog receiver:
- On the Overview tab, scroll down to the Syslog Settings section and configure the Loopback IP address as the syslog receiver.
Figure 2. Syslog Settings 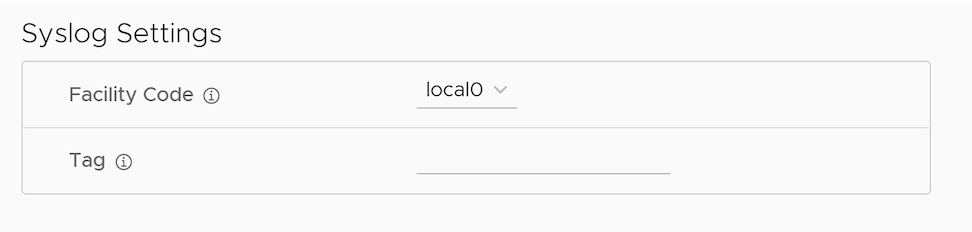
Supported Counters
After integrating Telegraf with a Gateway, you can collect counters from the configured Input and export the data to the configured Output plugin.
The following table lists the supported counters exported from a Gateway.
| Counter Name | Description | Availability | Minimum Supported SD-WAN Version |
|---|---|---|---|
| active_NAT_entries | Number of active NAT entries per peer. | Global | 4.3.0 |
| auto_rate_limit_drop | Packets dropped on the Gateway due to the auto rate-limit to restore the Gateway from over capacity condition. | Global | 5.2.0 |
| capacity_metric_edge_count_value | Number of Edges connected to the Gateway. | Global | 5.2.0 |
| capacity_metric_edge_count_warning_threshold | Recommended threshold value (2250) for setting warning alerts based on the Edge count. | Global | 5.2.0 |
| capacity_metric_edge_count_critical_threshold | Recommended threshold value (2375) for setting critical alerts based on the Edge count. | Global | 5.2.0 |
| capacity_metric_tunnel_count_value | Number of tunnels associated with the Gateway. | Global | 5.2.0 |
| capacity_metric_tunnel_count_warning_threshold | Recommended threshold value (3600) for setting warning alerts based on the tunnel count. | Global | 5.2.0 |
| capacity_metric_tunnel_count_critical_threshold | Recommended threshold value (3800) for setting critical alerts based on the tunnel count. | Global | 5.2.0 |
| capacity_metric_pki_enabled_tunnel_count_value | Number of tunnels (with certificate) associated with the Gateway. | Global | 5.2.0 |
| capacity_metric_pki_enabled_tunnel_count_warning_threshold | Recommended threshold value (3600) for setting warning alerts based on the count of tunnels with a certificate. | Global | 5.2.0 |
| capacity_metric_pki_enabled_tunnel_count_critical_threshold | Recommended threshold value (3800) for setting critical alerts based on the count of tunnels with a certificate. | Global | 5.2.0 |
| capacity_metric_flow_count_value | Number of flows in the Gateway. | Global | 5.2.0 |
| capacity_metric_flow_count_warning_threshold | Recommended threshold value (475410) for setting warning alerts based on the flow count. | Global | 5.2.0 |
| capacity_metric_flow_count_critical_threshold | Recommended threshold value (713115) for setting critical alerts based on the flow count. | Global | 5.2.0 |
| capacity_metric_nat_count_value | Number of NAT entries in the Gateway. | Global | 5.2.0 |
| capacity_metric_nat_count_warning_threshold | Recommended threshold value (475410) for setting warning alerts based on the NAT count. | Global | 5.2.0 |
| capacity_metric_nat_count_critical_threshold | Recommended threshold value (713115) for setting critical alerts based on the NAT count. | Global | 5.2.0 |
| capacity_metric_pktq_wmark_value | Number of packet queue watermark in the Gateway. | Global | 5.2.0 |
| capacity_metric_pktq_wmark_warning_threshold | Recommended threshold value (2000) for setting warning alerts based on the packet queue watermark count. | Global | 5.2.0 |
| capacity_metric_pktq_wmark_critical_threshold | Recommended threshold value (6000) for setting critical alerts based on the packet queue watermark count. | Global | 5.2.0 |
| capacity_metric_pkt_drop_value | Number of packet drops in the Gateway. | Global | 5.2.0 |
| capacity_metric_pkt_drop_warning_threshold | Recommended threshold value (500) for setting warning alerts based on the packet drops. | Global | 5.2.0 |
| capacity_metric_pkt_drop_critical_threshold | Recommended threshold value (2000) for setting critical alerts based on the packet drops. | Global | 5.2.0 |
| capacity_metric_edge_count_congestion_threshold | Recommended threshold value for setting congestion alerts based on the Edge count. | Global | 5.2.0 |
| capacity_metric_tunnel_count_congestion_threshold | Recommended threshold value for setting congestion alerts based on the Tunnel count. | Global | 5.2.0 |
| capacity_metric_pki_enabled_tunnel_count_congestion_threshold | Recommended threshold value for setting congestion alerts based on the count of tunnels with certificates. | Global | 5.2.0 |
| capacity_metric_flow_count_congestion_threshold | Recommended threshold value for setting congestion alerts based on the Flow count. | Global | 5.2.0 |
| capacity_metric_nat_count_congestion_threshold | Recommended threshold value for setting congestion alerts based on the NAT count. | Global | 5.2.0 |
| capacity_metric_pktq_wmark_congestion_threshold | Recommended threshold value for setting congestion alerts based on the packet queue watermark count. | Global | 5.2.0 |
| capacity_metric_pkt_drop_congestion_threshold | Recommended threshold value for setting congestion alerts based on the packet drop. | Global | 5.2.0 |
| crypto_drop | Number of packet drops observed due to crypto failures. | Global | 4.3.0 |
| dce_info_check_new_cnt | Number of times a Hub's DCE info was not found for an Enterprise, indicating no Hub endpoint information exists yet, and a fresh DCE info population is required. | Per Enterprise | 4.3.0 |
| dce_info_check_zero_cnt | Number of times a Hub's DCE info was found but contained zero endpoint entries, indicating the assigned Hub has stale or empty endpoint information and requires repopulation. | Per Enterprise | 4.3.0 |
| dce_info_check_nz_cnt | Number of times a Hub's DCE info was found with valid non-zero endpoint entries, indicating the assigned Hub has active endpoint information, and no repopulation is needed. | Per Enterprise | 4.3.0 |
| dpdk_mbuf_pending | Number of buffers that are already processed and waiting to be freed. | Global | 4.3.0 |
| dpdk_mbuf_locked_fail | Number of times the GET buffer operation fails while retrieving a buffer from the locked pool. | Global | 4.3.0 |
| dpdk_mbuf_locked_free | Number of free buffers present in the locked pool. | Global | 4.3.0 |
| dpdk_mbuf_pool_free | Number of free buffers. | Global | 4.3.0 |
| dpdk_xstats_<interface name>_tx_pps_<histogram bin counter range> | Histogram counters to monitor Gateway utilization based on egress packets per second.
For packets per second (pps) monitoring, the defined histogram bin counter ranges are:
|
Per DPDK Interface | 6.0.0 |
| dpdk_xstats_<interface name>_rx_pps_<histogram bin counter range> | Histogram counters to monitor Gateway utilization based on ingress packets per second. | Per DPDK Interface | 6.0.0 |
| dpdk_xstats_<interface name>_tx_mbps_<histogram bin counter range> | Histogram counters to monitor Gateway utilization based on egress throughput usage. For Megabits per second (Mbps) throughput monitoring, the defined histogram bin counter ranges are:
|
Per DPDK Interface | 6.0.0 |
| dpdk_xstats_<interface name>_rx_mbps_<histogram bin counter range> | Histogram counters to monitor Gateway utilization based on ingress throughput usage. | Per DPDK Interface | 6.0.0 |
| flow_count | Total number of active flows per Enterprise. | Per Enterprise | 4.3.0 |
| flow_drop | Packets dropped due to flow lookup failure and flow creation failure. | Global | 4.3.0 |
| flow_over_capacity_drop | Packets dropped due to the Gateway's flow table reaching its maximum capacity and being unable to allocate new flows. | Global | 4.3.0 |
| frag_drop | Packet dropped due to fragmentation related issues. | Global | 4.3.0 |
| free_NAT_entries | Number of free shared memory entries assigned for NAT. | Global | 4.3.0 |
| invalid_pkt_drop | Packets dropped due to invalid checksum, TTL, and invalid packet size. | Global | 4.3.0 |
| interface_over_capacity_drop | Packets dropped at the interface level due to over-capacity. | Global | 4.3.0 |
| ipfrag_current_cnt | Number of buffers allocated for storing fragmented packets. | Global | 4.3.0 |
| link_drop | Number of packet drops observed due to link specific issues. | Global | 4.3.0 |
| link_sch_cosq_pkt_cnt | Number of buffers used by Link Cos Scheduler. | Global | 4.3.0 |
| link_sch_pkt_cnt | Number of buffers used by Link Scheduler. | Global | 4.3.0 |
| misc_drop | Packets dropped due to other errors and exceptions. | Global | 4.3.0 |
| misc_over_capacity_drop | Packets dropped due to internal handoff queue limit drops and due to low packet buffers in the system. | Global | 4.3.0 |
| mp_rt_pkts_stored | Number of buffers used by VCMP retransmit store. | Global | 4.3.0 |
| mp_reseq_qlen | Number of buffers used for VCMP resequencing. | Global | 4.3.0 |
| mp_jitter_pkt_bufs | Number of buffers used for VCMP jitter management. | Global | 4.3.0 |
| nat_cnt | Number of active NAT entries per Enterprise. | Per Enterprise | 4.3.0 |
| nat_drop | Packets dropped due to NAT lookup failure and NAT creation failure. | Global | 4.3.0 |
| nat_over_capacity_drop | NAT over capacity drops due to port assignment failures. | Global | 4.3.0 |
| net_sch_pkt_cnt | Number of buffers used by Net Scheduler. | Global | 4.3.0 |
| netif_<interface>_pktsize_0_63 | Number of packets with size 0-63 bytes transmitted/received in a Gateway. | Per Interface | 4.5.0 |
| netif_<interface>_pktsize_64_127 | Number of packets with size 64-127 bytes transmitted/received in a Gateway. | Per Interface | 4.5.0 |
| netif_<interface>_pktsize_128_255 | Number of packets with size 128-255 bytes transmitted/received in a Gateway. | Per Interface | 4.5.0 |
| netif_<interface>_pktsize_256_511 | Number of packets with size 256-511 bytes transmitted/received in a Gateway. | Per Interface | 4.5.0 |
| netif_<interface>_pktsize_512_1023 | Number of packets with size 512-1023 bytes transmitted/received in a Gateway. | Per Interface | 4.5.0 |
| netif_<interface>_pktsize_1024_1499 | Number of packets with size 1024-1499 bytes transmitted/received in a Gateway. | Per Interface | 4.5.0 |
| netif_<interface>_pktsize_1500 | Number of packets with size above 1500 bytes transmitted/received in a Gateway. | Per Interface | 4.5.0 |
| netif_queue<core>_len | The current number of packets in the network interface that receive a queue for the specified dataplane core. | Global | 5.0.0 |
| netif_queue<core>_wmark | Maximum number of packets enqueued in the network interface that receive a queue for the specified dataplane core at any point in time. | Global | 6.2.0 |
| netif_queue<core>_wmark_1s | The maximum number of packets enqueued in the network interface that receive a queue for the specified dataplane core in the last second. | Global | 6.2.0 |
| netif_queue<core>_wmark_1min | The maximum number of packets enqueued in the network interface that receive a queue for the specified dataplane core in the last one minute. | Global | 6.2.0 |
| netif_queue<core>_wmark_5min | The maximum number of packets enqueued in the network interface that receive a queue for the specified dataplane core in the last 5 minutes. | Global | 6.2.0 |
| nombuf | Total number of RX mbuf allocation failures. | Global | 4.3.0 |
| number_of_edges | Number of Edges connected to the Gateway. | Global | 4.3.0 |
| number_of_tunnels | Number of tunnels associated with the Gateway. | Global | 4.3.0 |
| number_of_tunnels_v4
number_of_tunnels_v6 |
Number of IPv4/IPv6 tunnels associated with the Gateway | IPv4, IPv6 | 4.5.0 |
| number_of_routes | Number of routes installed in the Gateway. | Global | 4.3.0 |
| number_of_flows | Total number of active flows in the Gateway. | Global | 4.3.0 |
| num_nsd_paths_up/down | Number of NSD tunnels in UP/DOWN state in the Gateway. | Global | 4.3.0 |
| num_paths_INITIAL | Number of tunnels in INITIAL state.
INITIAL state indicates that the Edge just initiated a tunnel request to the Gateway. |
Global | 4.3.0 |
|
num_pathsv4_INITIAL num_pathsv6_INITIAL |
IPv4, IPv6 | 4.5.0 | |
| num_paths_MEASURING_TX_BW
num_paths_MEASURING_RX_BW |
After initiating a tunnel request, tx and rx bandwidth will be measured for the tunnels from Edge to Gateway before moving to STABLE state. The number of tunnels for which tx and rx bandwidth is measured is tracked under the respective counters. | Global | 4.3.0 |
| num_pathsv4_MEASURING_TX_BW
num_pathsv4_MEASURING_RX_BW num_pathsv6_MEASURING_TX_BWnum_pathsv6_MEASURING_RX_BW |
IPv4, IPv6 | 4.5.0 | |
| num_paths_PATH_STABLE | Number of tunnels in STABLE state.
STABLE state indicates that the tunnel is established between Edge and Gateway and is stable. To find the percentage of stable tunnels, multiply the number of stable tunnels by 100 and then divide that value by the total number of tunnels. |
Global | 4.3.0 |
| num_pathsv4_STABLE
num_pathsv6_STABLE |
IPv4, IPv6 | 4.5.0 | |
| num_paths_UNSTABLE | Number of tunnels in UNSTABLE state.
If the loss, latency, and jitter values exceed the defined threshold, the tunnel moves to the UNSTABLE state. To find the percentage of unstable tunnels, multiply the number of unstable tunnels by 100 and then divide that value by the total number of tunnels. |
Global | 4.3.0 |
| num_pathsv4_UNSTABLE
num_pathsv6_UNSTABLE |
IPv4, IPv6 | 4.5.0 | |
| num_paths_QUIET | If no packets are received in the path for a defined time interval, the path transitions to the QUIET state, and the number of such paths is tracked here. | Global | 4.3.0 |
| num_pathsv4_QUIET
num_pathsv6_QUIET |
IPv4, IPv6 | 4.5.0 | |
| num_paths_active | Number of Tunnels in the ACTIVE state. | Global | 4.3.0 |
| num_pathsv4_active | Number of Tunnels in the ACTIVE state. | IPv4 | 4.5.0 |
| num_pathsv6_active | Number of Tunnels in the ACTIVE state. | IPv6 | 4.5.0 |
| num_pathsv4_BW_UNMEASURABLE
num_pathsv6_BW_UNMEASURABLE |
Number of VCMP tunnel paths where bandwidth measurement has been attempted but failed. Paths in this state will automatically retry bandwidth measurement after 30 minutes. | IPv4, IPv6 | 4.5.0 |
| num_pathsv4_WAITING_FOR_LINK_BW
num_pathsv6_WAITING_FOR_LINK_BW |
Number of VCMP tunnel paths that have completed initial set up but are waiting for another path on the same link to finish its bandwidth measurement first. The path remains in this state until the link's TX and RX bandwidth values are populated by another path's measurement, at which point it inherits those values and transitions toward a stable state. | IPv4, IPv6 | 4.5.0 |
| over_capacity_drop | Packets dropped due to internal handoff queue limit drops and low packet buffers in the system. | Global | 4.3.0 |
| over_capacity_status | Indicates if a Gateway is running into over-capacity state due to internal handoff queue limit drops and low packet buffers in the system. | Global | 5.1.0 |
| per_core_queue<core>_len | The current number of packets in the per-core processing queue for the specified dataplane core. | Global | 5.0.0 |
| per_core_queue<core>_wmark | The maximum number of packets enqueued in the per-core processing queue for the specified dataplane core at any point in time. | Global | 6.2.0 |
| per_core_queue<core>_wmark_1s | The maximum number of packets enqueued in the per-core processing queue for the specified dataplane core in the last one second. | Global | 6.2.0 |
| per_core_queue<core>_wmark_1min | The maximum number of packets enqueued in the per-core processing queue for the specified dataplane core in the last one minute. | Global | 6.2.0 |
| per_core_queue<core>_wmark_5min | The maximum number of packets enqueued in the per-core processing queue for the specified dataplane core in the last 5 minutes. | Global | 6.2.0 |
| red_factor | Rate limit factor set on VCMP peers based on RED applied. | Per Edge Tunnel | 5.2.0 |
| route_count | Number of route entries installed in the Gateway per Enterprise. | Per Enterprise | 4.3.0 |
| route_drop | Packets dropped due to route lookup failure and route sanity failure. Routing control packets that are dropped due to exceptions are also accounted. | Global | 4.3.0 |
| rx_bytes | Number of bytes received by the Gateway. | Per Enterprise | 4.3.0 |
| Per Non SD-WAN Destination | 4.5.0 | ||
| Per Edge Tunnel | 5.0.1 | ||
| Per Interface | 5.0.1 | ||
| rx_packets | Number of packets received by the Gateway. | Per Enterprise | 4.3.0 |
| Per Non SD-WAN Destination | 4.5.0 | ||
| Per Edge Tunnel | 5.0.1 | ||
| stale_NAT_entries | Number of stale NAT entries in the system. This tracks only the stale entries due to ref count leak. | Global | 4.3.0 |
| stale_tunnel_entries | Number of stale tunnel entries in the Gateway. | Global | 4.3.0 |
| stale_peer_objects | Number of stale peer objects in the Gateway. | Global | 4.3.0 |
| stale_flow_entries | Number of stale flow entries in the Gateway. | Global | 4.3.0 |
| sched_drop | Packets dropped by the scheduler due to bandwidth limits. | Global | 4.3.0 |
| tx_bytes | Number of bytes transmitted from the Gateway. | Per Enterprise | 4.3.0 |
| Per Edge Tunnel | 5.0.1 | ||
| Per Interface | 5.0.1 | ||
| Per Non SD-WAN Destination | 4.5.0 | ||
| tx_packets | Number of packets transmitted from the Gateway. | Per Enterprise, | 4.3.0 |
| Per Edge Tunnel | 5.0.1 | ||
| Per Non SD-WAN Destination | 4.5.0 | ||
| vcmp_drop | VCMP control and data packet dropped due to VCMP sanity checks and exceptions. | Global | 4.3.0 |
| vc_queue_<queue_name>_len | Number of packets enqueued in each handoff queues listed in Capacity of Gateway Components. | Global | 4.3.0 |
| vc_queue_<queue_name>_drops | Number of drops in each handoff queues listed in Capacity of Gateway Components. | Global | 4.3.0 |
| vc_queue_<queue_name>_wmark | Maximum number of packets enqueued in the respective queue at any point in time. | Global | 4.5.1 |
| vc_queue_<queue_name>_wmark_1s | Maximum number of packets enqueued in the respective queue in the last one second. | Global | 6.2.0 |
| vc_queue_<queue_name>_wmark_1min | Maximum number of packets enqueued in the respective queue in the last one minute. | Global | 4.5.1 |
| vc_queue_<queue_name>_wmark_5min | Maximum number of packets enqueued in the respective queue in the last 5 minutes. | Global | 4.5.1 |