Solution Brief
Network Visibility Latency Analyzer (LANZ)
Table of Contents
– Why is LANZ Required?
– Granularity
– Significance
– Awareness
– A Closer Look at LANZ
– Collecting the Right Data
– Highly Granular Updates
– Integrating the Application Layer
– Configuring and Using LANZ
– LANZ Ahead
– Summary
A New Dimension in Network Visibility
High Performance Monitoring for High Performance Networks
- Traditional utilization based monitoring does not meet the needs of high performance networks
- Latency sensitive environments require granular and proactive feedback about network conditions
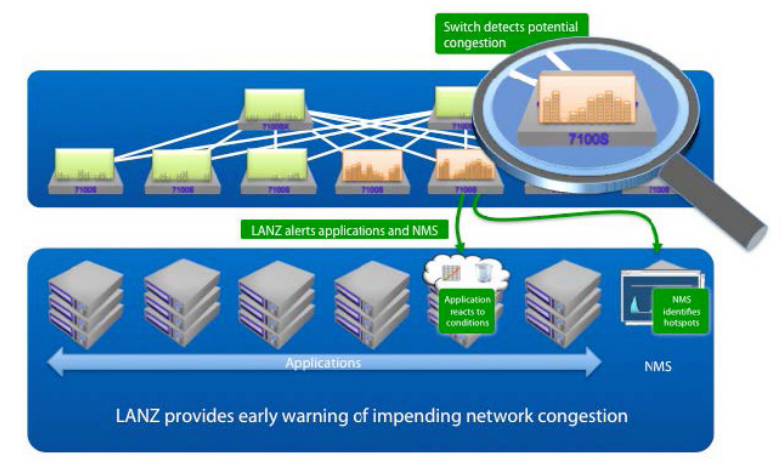
Arista Networks’ Latency Analyzer (LANZ) represents a revolution in integrated network visibility performance monitoring. For the first time, administrators and applications gain near real-time visibility into congestion conditions as experienced by the network itself.
Rather than simply waiting for congestion to occur, LANZ provides granular notification of impending congestion events detected at the network layer directly to the application layer. This enables close integration with applications and administrative workflows.
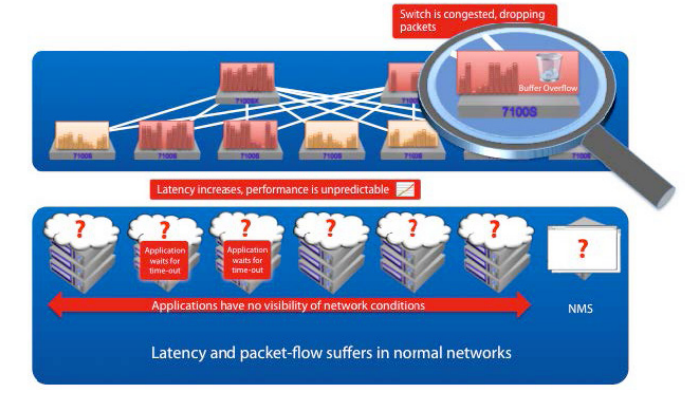
Today’s systems often detect congestion when someone complains, “The network seems slow.” The network team gets a trouble ticket, and upon inspection can see packet loss on critical interfaces. Compounding this, the best solution available to the network team today is to mirror the problematic port to a packet capture device and hope the congestion problem repeats itself. This is not optimal for anyone.
With LANZ’s proactive congestion detection and alerting capability both human administrators and integrated applications can:
- Preempt network conditions that induce latency or packet loss
- Adapt application behavior based on prevailing conditions
- Isolate potential bottlenecks early, enabling pro-active capacity planning
- Maintain forensic data for post-process correlation and backtesting
Why is LANZ Required?
While monitoring technologies have continued to evolve to meet the demands of common line-of-business applications, such as e-mail, intranet, file and database, there has been a bias towards addressing information security and intrusion concerns through deeper packet inspection and protocol decode.However, high-end computing applications, especially electronic trading systems, have very different requirements to common enterprise networking.
Administrators engineer their networks to provide an optimal foundation of deterministic, wire-speed, ultralow latency switching. Maintaining this performance and understanding changing network conditions during unprecedented traffic loads or unusual events is crucial to preserving application performance and competitive advantage while minimizing risk.
Unfortunately traditional link-layer flow control techniques and the relatively basic utilization statistics available through RMON and SNMP fall short in helping to achieve these goals in a number of areas.
Granularity
Even when aggressively polling SNMP utilization counters, the underlying hardware interface utilization statistics are typically retrieved at most once per second, often at significantly longer intervals.At 10Gb, a single interface could go from idle to forwarding over 28 million packets and back to idle within a one second window - with once per second polling, such a burst may go completely unnoticed.
This is especially critical in monitoring ‘micro-burst’ sensitive financial transactions.
Significance
Even assuming timely and accurate data acquisition, the relevance of utilization data is questionable - simply knowing that an interface is busy does not necessarily infer that latency has increased or packets are being dropped. It is clear that utilization alone cannot reveal the most fundamental barrier to consistent performance - congestion.Awareness
The traditional answer to congestion has been to rely on 802.3x link-layer flow control or the more recent 802.1Qbb standard for priority based flow control.While both of these mechanisms help to create a lossless environment, they exhibit two fundamental flaws. Firstly, neither mechanism provides any prior warning of impending congestion nor, crucially, supplies any indication to the application itself that traffic may be delayed and latency may increase.
It is clear that existing utilization monitoring and link management technologies are not well suited to high performance, latency sensitive environments. Fundamentally, the isolation of applications from underlying infrastructure prevents pro-active management of congestion.
A Closer Look at LANZ
LANZ addresses the weaknesses of traditional monitoring and queueing mechanisms in three specific ways: systems.Collecting the Right Data
LANZ monitors and exports live queue length information from each switch port based on user configured utilization triggers. Increasing or repeated queue consumption is the primary indication of switch port congestion. Congested ports are forced to buffer traffic, increasing latency and if unchecked, resulting in dropped packets.LANZ allows high and low watermarks to be configured enabling alerts to be triggered before queues become saturated, providing early warning of impending performance issues.
Providing Highly Granular Updates
Monitoring and alerting at a resolution measured in microseconds, rather than seconds, makes it possible to detect previously invisible short lived traffic bursts (microbursts) which may lead to packet loss - an essential tool for understanding performance in trading environments. On a larger datacenter scale, the same data can be used to reveal transient network hotspots, enabling pro-active capacity management.Integrating at the Application Layer
By delivering this data to the application layer, applications are able to factor network behavior into decision making. Instead of continually waiting for a protocol to time-out, an application may adapt itself to prevailing conditions.For maximum versatility, latency data is presented in a number of open standard formats for both live and historical usage including:
- Threshold based alerting via Syslog
- CLI output for instantaneous and continuous data
- CSV format stored on flash, USB, SSD or external file system (FTP, TFTP, NFS)
- Programmatic interface for direct application
Configuring and Using LANZ
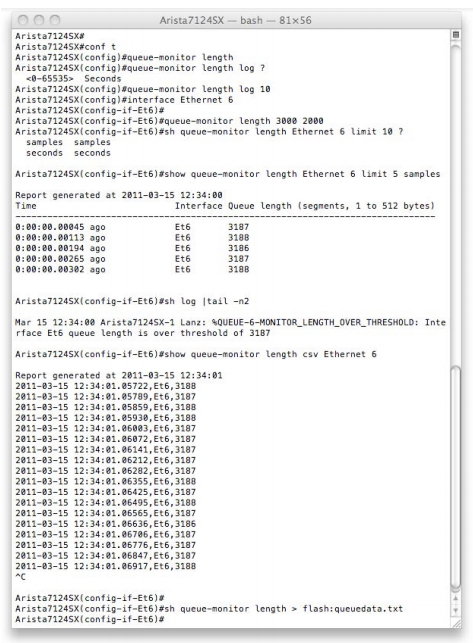
Enabling LANZ with its default parameters requires a single command “queue-monitor length”, from here each interface can be configured with its own alerting threshold and a variety of data can be captured directly from the CLI.To begin, LANZ is enabled globally and a Syslog logging rate is selected.
Next we configure optional high and low watermarks for logging queue length on one or more interfaces.
Simple show commands allow queue length to be displayed via the CLI and logging can be easily verified.
LANZ reporting is available in CSV format for easy import into a variety of applications, both as a live stream of data and also as a snapshot of recently logged events, accessed using standard linux semantics.
Snapshot data can be copied to flash, USB drive, onboard SSD or remote destinations from the CLI with other mounts available via the bash shell.
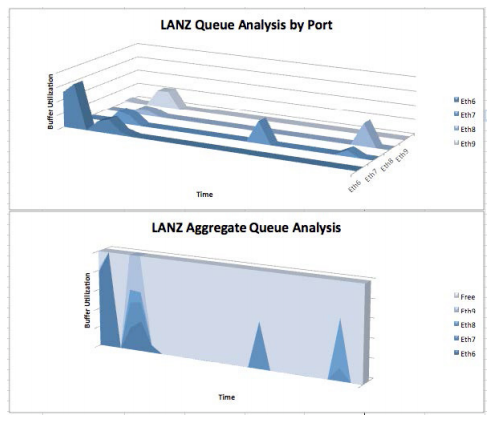
Configuring LANZ on uplink interfaces, enables monitoring of traffic spikes and congestion events over extended periods. Time-stamped data makes it straightforward to retrospectively correlate network conditions with reported events, revealing previously invisible hot-spots and choke points.
LANZ Ahead
From initial release in EOS 4.7, LANZ functionality becomes available on all Arista Networks 7100 family devices. As we expand our portfolio, we will continue to extend LANZ capabilities to other device families while integrating synergistic technologies such as Precision Time Protocol control- and data-plane (IEEE 1588, PTP) for both synchronization and accurate time stamping, ensuring that network administrators are provided with proactive visibility into both congestion events and sources of that congestion.The Arista Networks Advantage
Arista Networks designs solutions for highly demanding network environments. Where performance and latency are crucial to application and business needs, the ability to instrument and understand network conditions is key to sustaining competitive advantage and minimizing risk.LANZ is one of many unique solutions in Arista Networks’ high performance portfolio which includes our Extensible Operating System (EOS), VMTracer virtual machine integration, Zero Touch Provisioning (ZTP) and Multi-Chassis Link Aggregation (MLAG).
For further information please contact your Arista sales and engineering team or click the Contact Arista button above.
Copyright © 2017 Arista Networks, Inc. All rights reserved. CloudVision, and EOS are registered trademarks and Arista Networks is a trademark of Arista Networks, Inc. All other company names are trademarks of their respective holders. Information in this document is subject to change without notice. Certain features may not yet be available. Arista Networks, Inc. assumes no responsibility for any errors that may appear in this document. 05-0020-01