Watcher Alerts
The following appendix describes the procedure for creating Watcher alerts for machine learning jobs, emails, and remote Syslog servers.
Watcher Alert
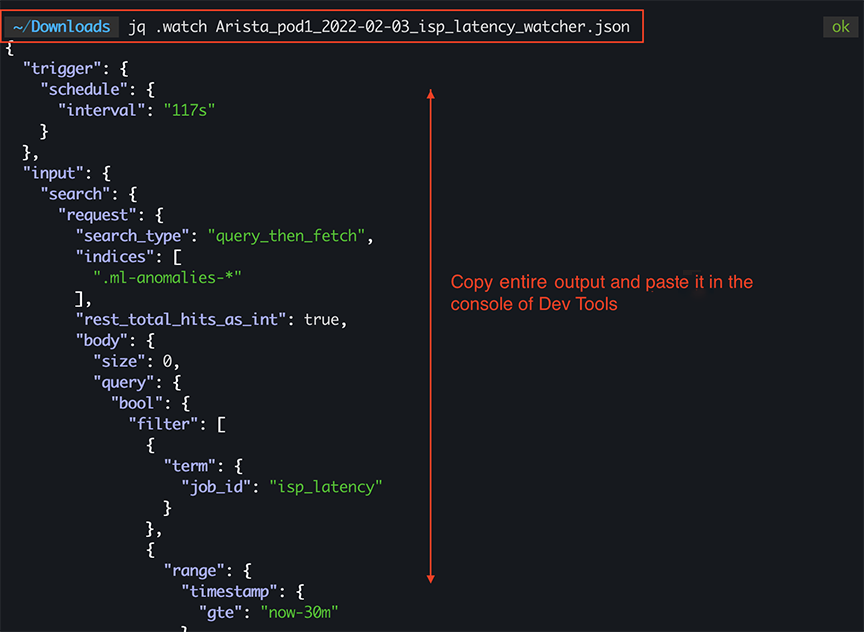
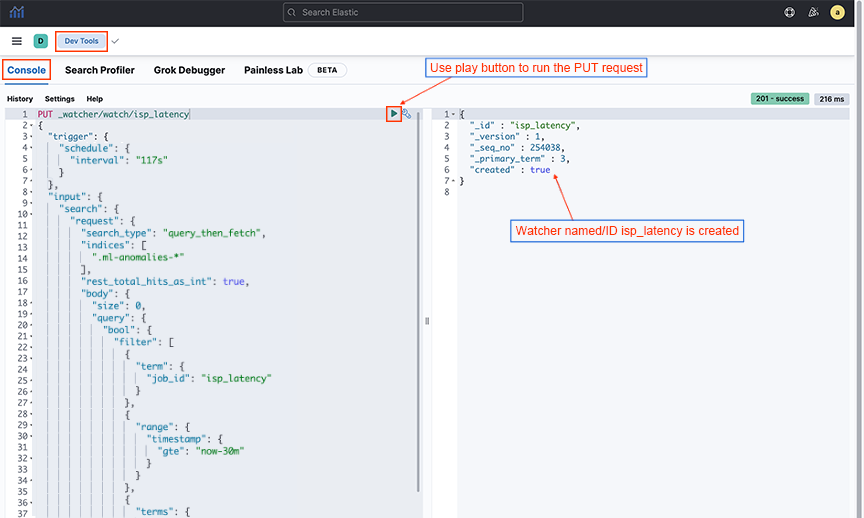
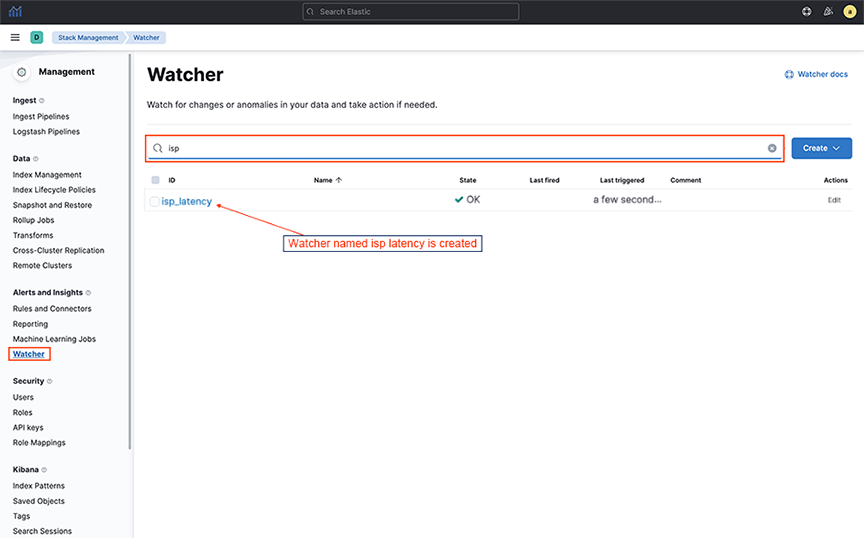
- Create a Watcher manually using the provided template.
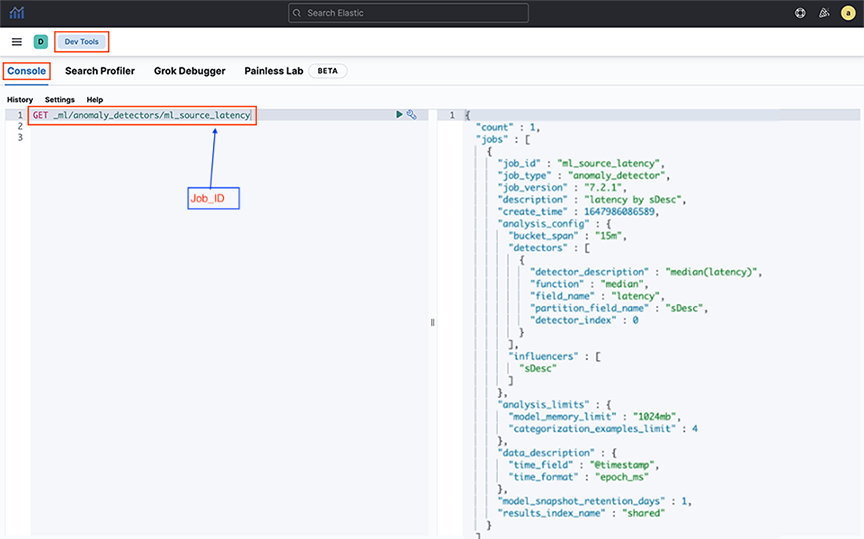
- Configure the Watcher to select the job ID for the ML job that needs to send alerts.
- Select ‘webhook’ as the alerting mechanism within the Watcher to send alerts to 3rd party tools like ‘Slack.’
Kibana Watcher for Webhook Connector
This document specifically describes how to configure Watcher for Webhook-type connectors.
Kibana connectors in the provide seamless integration between the Elasticsearch alerting engine and external systems.
They enable automated notifications and actions to be triggered based on defined conditions, enhancing monitoring and incident response capabilities. Webhook connectors allow alerts to be forwarded to platforms like Slack and Google Chat, delivering customizable payloads to notify relevant teams when critical events occur.
Configuring a Kibana Email Connector
- Gmail via the Email Connector
- Google Chat and Slack via the Webhook Connector.
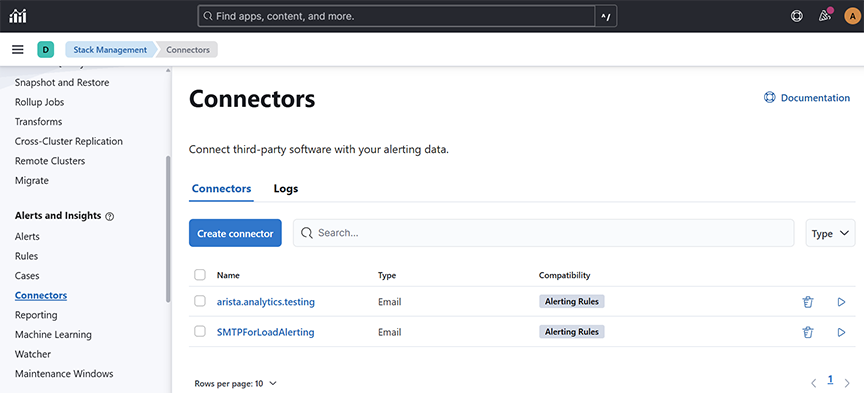
Select an existing Kibana email connector to send email alerts or create a connector by navigating to . Complete the following steps:
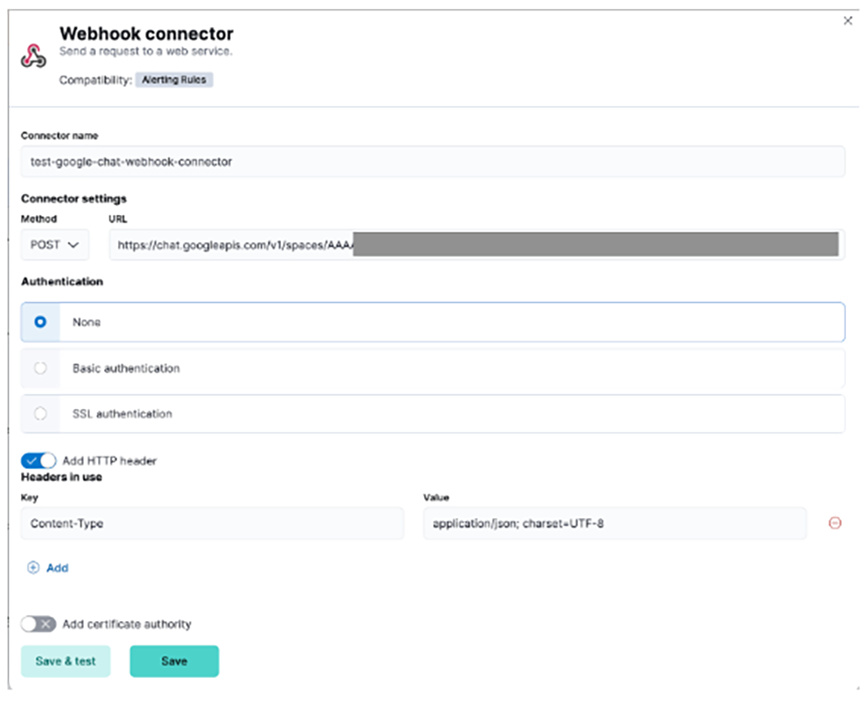
Google Chat Webhook Connector
{"text": "Message from Kibana Connector"}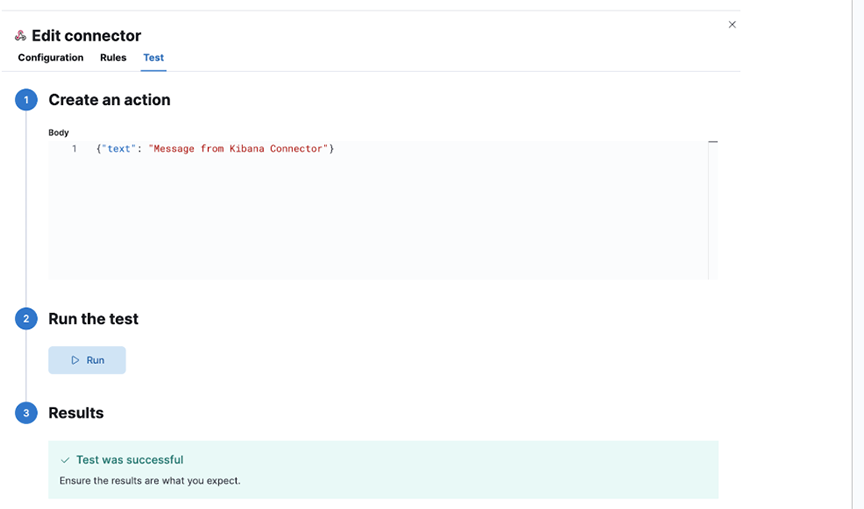

For any additional details, refer to https://developers.google.com/workspace/chat/quickstart/webhooks#create-webhook.
Slack Webhook Connector
{"text": "Message from Kibana Connector"}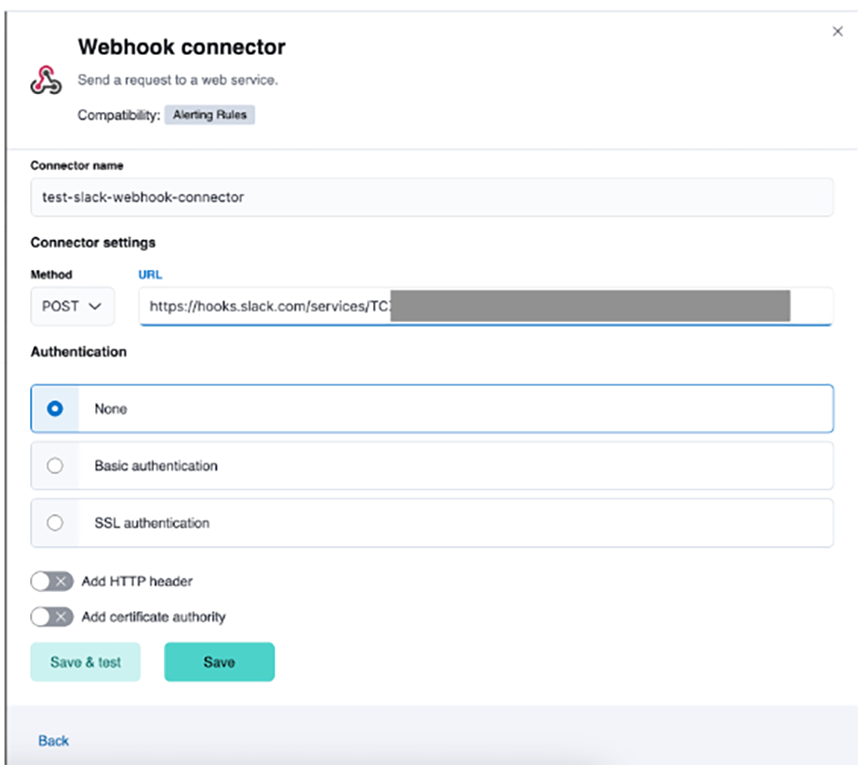

For any additional details, refer to https://api.slack.com/messaging/webhooks#getting_started.
Configuring a Watch
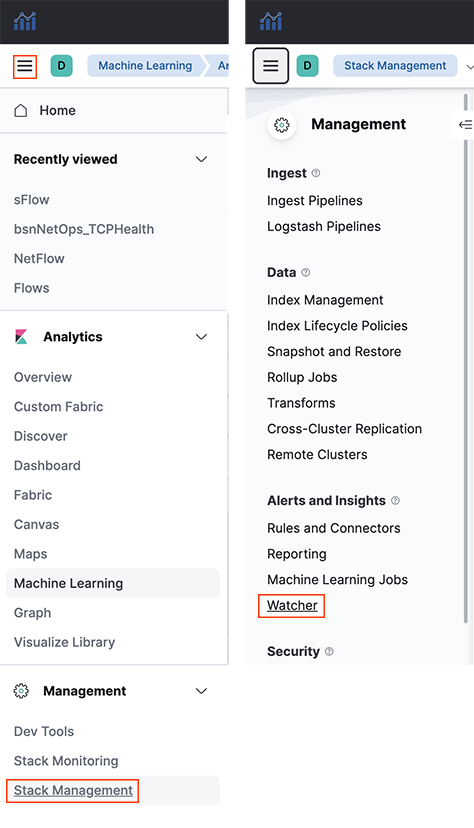
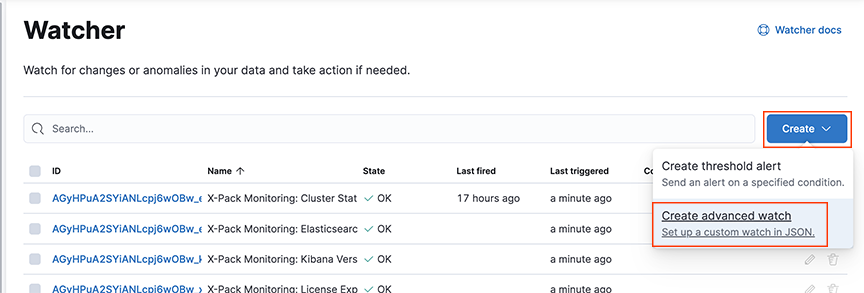
Configure a Watch using the Watcher or option.
"webhook_googlechat": {
 "webhook": {
 "scheme": "http",
 "host": "169.254.16.1",
 "port": 8000,
 "method": "post",
 "params": {},
 "headers": {},
 "body": """{"request_body": "{\"text\": \"The Elasticsearch cluster status is {{ctx.payload.status}}.\"}","kibana_webhook_connector": "<google-chat-webhook-connector-name>"}"""
 }
- Add a webhook action with the following fields to select Google Chat and Slack Webhook Connectors.
- Method: POST
- Scheme: HTTP
- Host: 169.254.16.1
- Port: 8000
- Specify the Body field as follows:
- kibana_webhook_connector: The name of the Kibana connector (of type webhook) in string format. It is case-sensitive.
- request_body: Enter the required fields: The connector gets the HTTP request body (in string format as text).
Note: request_body value is specific to the connector’s specification.
Click the Save button.
Google Chat Watcher configuration
"{\"text\": \"The Elasticsearch cluster status is {{ctx.payload.status}}.\"}"{
"trigger": {
"schedule": {
"interval": "1h"
}
},
"input": {
"http": {
"request": {
"scheme": "https",
"host": "10.10.10.10",
"port": 443,
"method": "get",
"path": "/es/api/_cluster/health",
"params": {},
"headers": {
"Content-Type": "application/json"
},
"auth": {
"basic": {
"username": "admin",
"password": "::es_redacted::"
}
}
}
}
},
"condition": {
"script": {
"source": "ctx.payload.status != 'green'",
"lang": "painless"
}
},
"actions": {
"webhook_googlechat": {
"webhook": {
"scheme": "http",
"host": "169.254.16.1",
"port": 8000,
"method": "post",
"params": {},
"headers": {},
"body": """{"request_body": "{\"text\": \"The Elasticsearch cluster status is {{ctx.payload.status}}.\"}","kibana_webhook_connector": "BSN-Analytics-AppTest-GH-connector"}"""
}
}
}
}Slack Watcher configuration
- text: (mandatory)
- channel : (optional) The channel name must match the same Slack channel for which the webhook is enabled.
- username: (optional) You can select any username.
"{\"channel\": \"test-channel\", \"username\": \"webhookbot\", \"text\": \"The Elasticsearch cluster status is {{ctx.payload.status}}.\"}"{
"trigger": {
"schedule": {
"interval": "1m"
}
},
"input": {
"http": {
"request": {
"scheme": "https",
"host": "10.10.10.1",
"port": 443,
"method": "get",
"path": "/es/api/_cluster/health",
"params": {},
"headers": {
"Content-Type": "application/json"
},
"auth": {
"basic": {
"username": "admin",
"password": "::es_redacted::"
}
}
}
}
},
"condition": {
"script": {
"source": "ctx.payload.status != 'green'",
"lang": "painless"
}
},
"actions": {
"webhook_slack": {
"webhook": {
"scheme": "http",
"host": "169.254.16.1",
"port": 8000,
"method": "post",
"params": {},
"headers": {},
"body": """{"request_body": "{\"channel\": \"test-webhook\", \"username\": \"webhookbot\", \"text\": \"The Elasticsearch cluster status is {{ctx.payload.status}}.\"}","kibana_webhook_connector": "test-slack-webhook-connector"}"""
}
}
}
}
Troubleshooting
- Check Kibana Connector, which is a type of Webhook.
- Check that the Kibana Connector is properly configured by running tests from UI. Check connector-specific configurations.
- Check for properly configured Watcher’s trigger conditions.
- Make sure all required parameters are present in the connector's watcher configuration.
- To debug execution in CLI:
- SSH to AN node
- Log in to CLI mode command: debug bash
- Review logs in /var/log/analytics/webhook_listener.log for any clues. Command: tail -f /var/log/analytics/webhook_listener.log
- To execute service in debug mode:
- Login as root command: sudo su
- Stop service command: service webhook-listener stop.
- Edit web-service in your preferred editor and set the logger to debug mode command: vi /usr/lib/python3.9/site-packages/webhook_listener/run_webhook_listener.py Change Line: LOGGER.setLevel(logging.INFO) to LOGGER.setLevel(logging.DEBUG).
- Start service command: service webhook-listener start.
You will see debug messages in the log file.
Limitations
None.
Enabling Secure Email Alerts through SMTP Setting
Refresh the page to view the updated SMTP Settings fields.
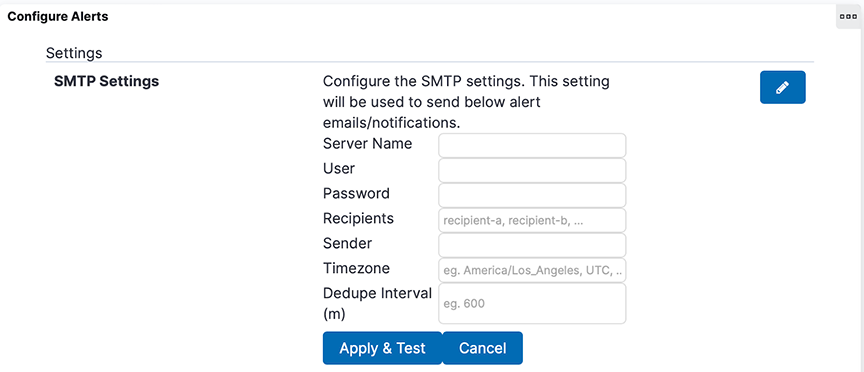
- Server Name, User, Password, Sender, and Timezone no longer appear in the SMTP Settings.
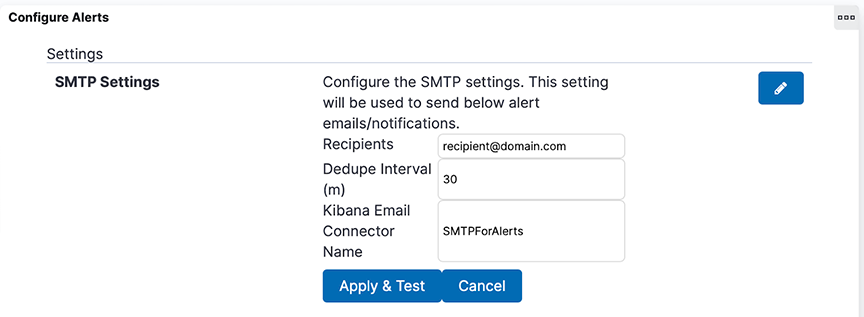
- A new field, Kibana Email Connector Name, has been added to SMTP Settings.
- The system retains Recipients and Dedupe Interval and their respective values in SMTP Settings.
- If previously configured SMTP settings exist:
- The system automatically creates a Kibana email connector named SMTPForAlerts using the values previously specified in the fields Server Name, User (optional), Password (optional), and Sender.
- The Kibana Email Connector Name field automatically becomes SMTPForAlerts.
Troubleshooting
When Apply & Test, do not send an email to the designated recipients; verify the recipient email addresses are comma-separated and spelled correctly. If it still doesn’t work, verify the designated Kibana email connector matches the name of an existing Kibana email connector. Test that connector by navigating to , selecting the connector's name, and sending a test email in the Test tab.
TACACS+ and RADIUS Control
This appendix describes using TACACS+ and RADIUS servers to control administrative access to the Analytics Node.
Using AAA Services with Arista Analytics
Select remote Authentication, Authorization, and Accounting (AAA) services using TACACS+ or RADIUS servers to control administrative access to the Analytics Node CLI.
| Attributes | Values |
|---|---|
| BSN-User-Role | admin
read-only bigtap-admin bigtap-read-only |
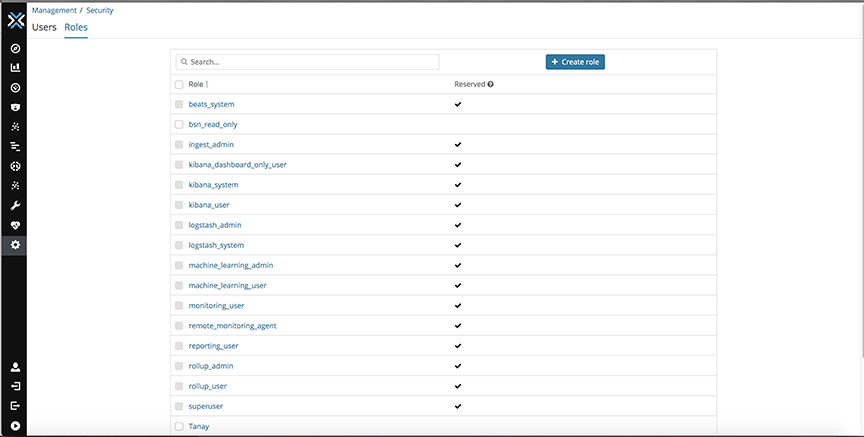
A remotely authenticated admin user has full administrative privileges. Authenticate the read-only users on the switch remotely. Read-only access is not configurable for locally authenticated user accounts.
- TACACS, SNMP, and user configuration are not visible to the read-only user in the output from the show running-config command.
- show snmp, show user, and show support commands are disabled for the read-only user.
Note: Local authentication and authorization take precedence over remote authentication and authorization.
- Supported attribute name: BSN-User-Role
- Supported attribute values: admin, read-only
Select a TACACS+ server to maintain administrative access control instead of using the Analytics Node local database. However, it is a best practice to keep the local database as the secondary authentication and authorization method in case the remote server becomes unavailable.
DMF TACACS+ Configuration
The DANZ Monitoring Fabric (DMF) requires the following configuration on TACACS+ servers and the configuration required on the Analytics Node.
Authentication Method
- Configure the TACACS+ server to accept ASCII authentication packets. Do not select the single connect-only protocol feature.
- The DMF TACACS+ client uses the ASCII authentication method. It does not use PAP.
Device Administration
- Configure the TACACS+ server to connect to the device administration login service.
- Do not use a network access connection method, such as PPP.
Group Memberships
- Create a bigtap-admin group. Make all DANZ Monitoring Fabric users part of this group.
- TACACS+ group membership is specified using the BSN-User-Role AV Pair as part of TACACS+ session authorization.
- Configure the TACACS+ server for session authorization, not for command authorization.
Note: The BSN-User-Role attribute must be specified as Optional in the tac_plus.conf file to use the same user credentials to access ANET and non-ANET devices.
Enabling Remote Authentication and Authorization on the Analytics Node
analytics-1# tacacs server host 10.2.3.201
analytics -1# aaa authentication login default group tacacs+ local
analytics -1# aaa authorization exec default group tacacs+ local
All users in the bigtap-admin group on TACACS+ server 10.2.3.201 have full access to the Arista Analytics Node.
User Lockout
(config)#aaa authentication policy lockout failure F window W duration D
max-failures = F = [1..255] duration = D = [1..(2^32 - 1)] window = W = [1..(2^32 - 1)]
Adding a TACACS+ Server
analytics -1(config-switch)# show run switch BMF-DELIVERY-SWITCH-1 tacacs override-enabled
tacacs server host 1.1.1.1 key 7 020700560208
tacacs server key 7 020700560208
analytics -1(config-switch)#
It displays the TACACS+ key value as a type7 secret instead of plaintext.
Complete the following steps to configure the Analytics Node with TACACS+ to control administrative access to the switch.
tacacs server <server> [key {<plaintext-key> | 0 <plaintext-key> | 7 <encrypted-key>}analytics -1(config-switch)# tacacs server 10.1.1.1 key 0 secretIn case of a missing key, it uses an empty key.
Each TACACS+ server connection can be encrypted using a pre-shared key.
analytics -1# tacacs server host <ip-address> key <plaintextkey>
analytics -1# tacacs server host <ip-address> key 0 <plaintextkey>
analytics -1# tacacs server host <ip-address> key 7 <plaintextkey>
Replace plaintextkey with a password up to 63 characters in length. This key can be specified either globally or for each host. The first two forms accept a plaintext (literal) key, and the last form accepts a pseudo-encrypted key, such as that displayed with show running-config.
It uses the global key value when no key is specified for a given host. An empty key is assumed when no key is specified globally or specified for a given host.
analytics-1(config-switch)# tacacs server 10.1.1.1 key 7 0832494d1b1c11Setting up a TACACS+ Server
After installing the TACACS+ server, complete the following steps to set up authentication and authorization for Analytics Node with the TACACS+ server:
Credentials for the Analytics Node and Other Devices
To use the same user credentials for the Analytics Node and other devices, a specific setting in the tac_plus.conf file is necessary. Configure the BSN-User-Role attribute within the tac_plus.conf file as "Optional".
group = group-admin {
default service = permit
service = exec {
optional BSN-User-Role = "admin"
}
}
RBAC-based Configuration for Non-default Group User
Using RADIUS for Managing Access
RADIUS does not separate authentication and authorization. Be careful when authorizing a user account with a remote RADIUS server to use the password configured for the user on the remote server.
- admin: Administrator access, including all CLI modes and debug options.
- read-only: Login access, including most show commands.
The admin group provides complete access to all network resources, while the read-only group provides read-only access to all network resources.
- Accounting: local, local and remote, or remote.
- Authentication: local, local then remote, remote then local, or remote.
- Authorization: local, local then remote, remote then local, or remote.
Note: Fallback to local authentication occurs only when the remote server is unavailable, not when authentication fails.
| Supported attribute names | Supported attribute values |
|---|---|
| BSN-User-Role | admin
read-only bigtap-admin bigtap-read-only |
The BSN-AV-Pair attribute sends CLI command activity accounting to the RADIUS server.
Adding a RADIUS Server
radius server host <server-address> [timeout {<timeout>}][key {{<plaintext>} | 0 {<plaintext>} | 7 {<secret>}}]analytics-1(config)# radius server host 192.168.17.101 key adminYou can enter this command up to five times to specify multiple RADIUS servers. The Analytics Node tries to connect to each server in the order they are configured.
Setting up a FreeRADIUS Server
Backup and Restore
Elasticsearch Snapshot and Restore
Elasticsearch provides a mechanism to snapshot data to a network-attached storage device and to restore from it.
Import and Export of Saved Objects
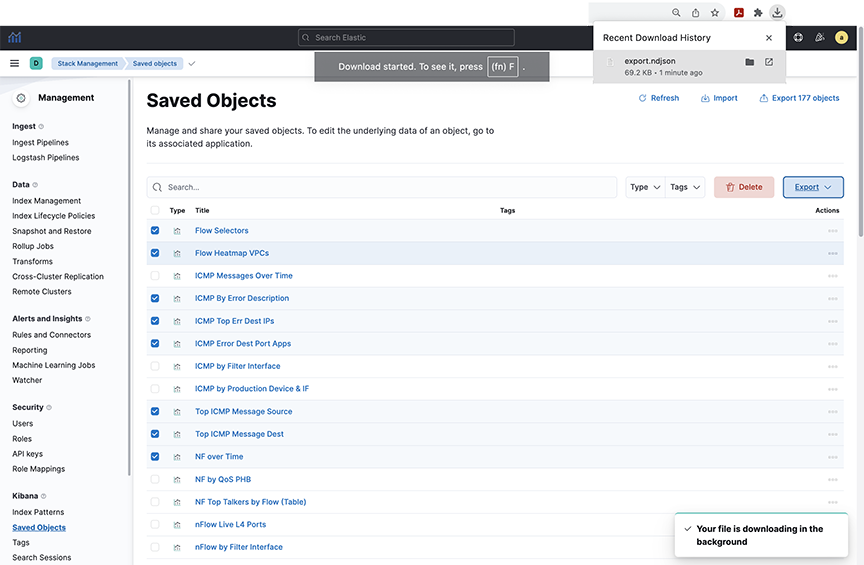
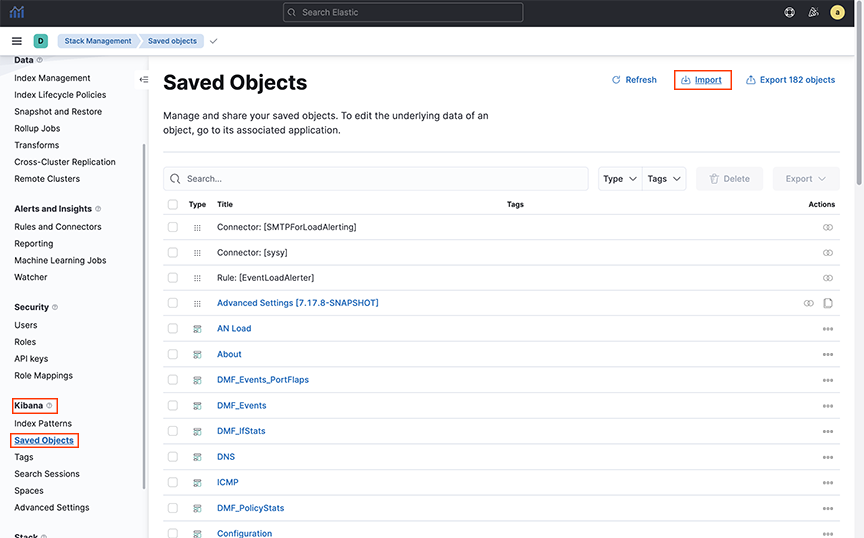
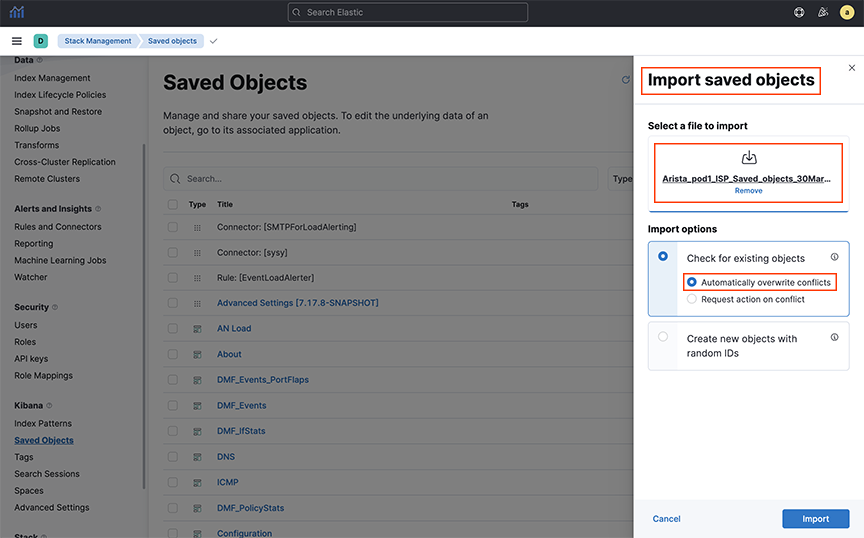
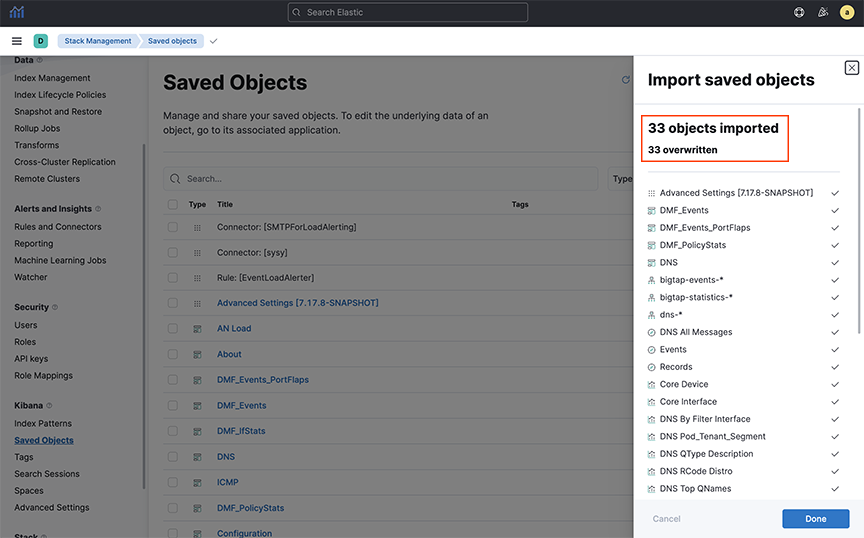
The Saved Objects UI helps keep track of and manage saved objects. These objects store data for later use, including dashboards, visualization, searches, and more. This section explains the procedures for backing up and restoring saved objects in Arista Analytics.
Exporting Saved Objects
Importing Saved Objects
Import and Export of Watchers
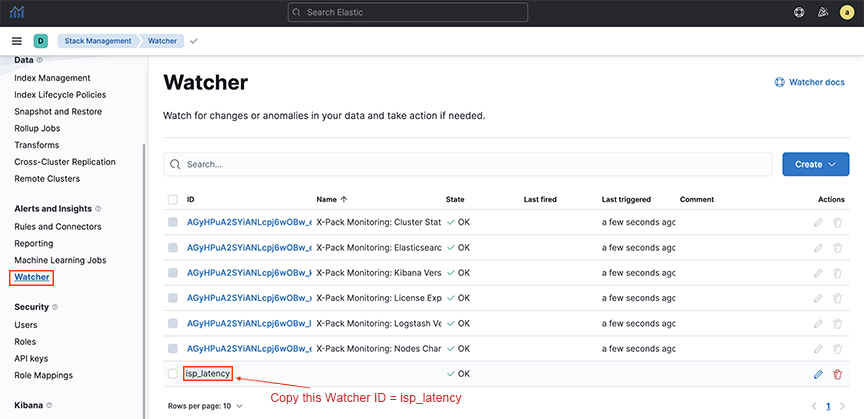
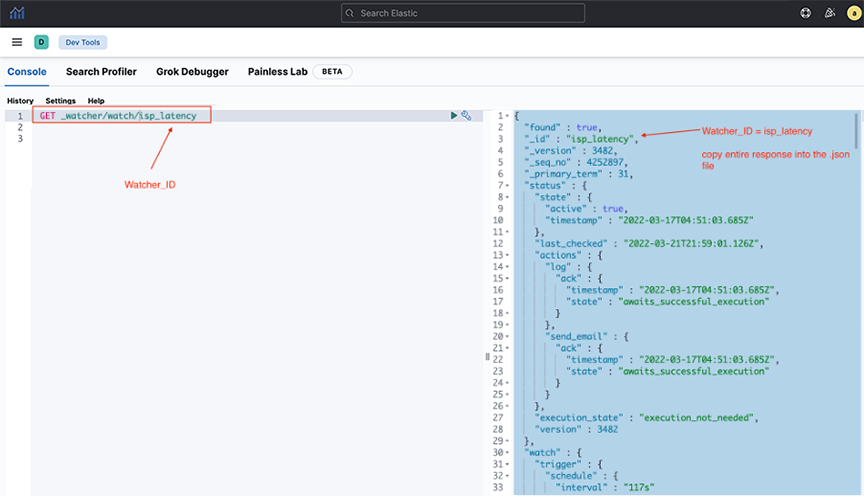
Select the Watcher feature to create actions and alerts based on certain conditions and periodically evaluate them using queries on the data. This section explains how to back up and restore the Watchers in Arista Analytics.
Exporting Watchers
Importing Watchers
Import and Export of Machine Learning Jobs
Machine Learning (ML) automates time series data analysis by creating accurate baselines of normal behavior and identifying anomalous patterns. This section explains ways to back up and restore the Machine Learning jobs in Arista Analytics.
Exporting Machine Learning Jobs
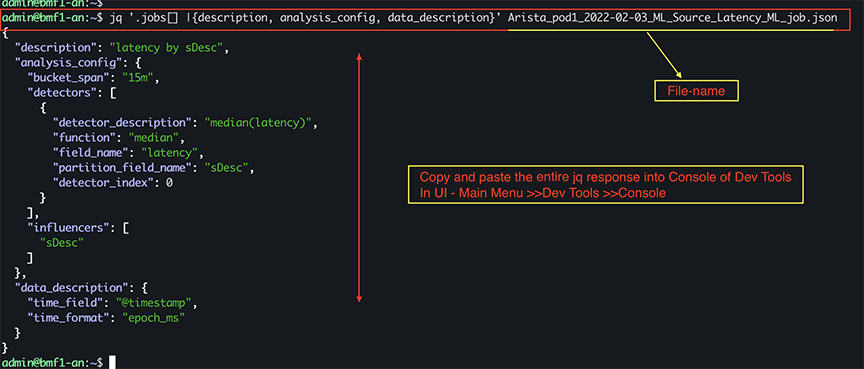
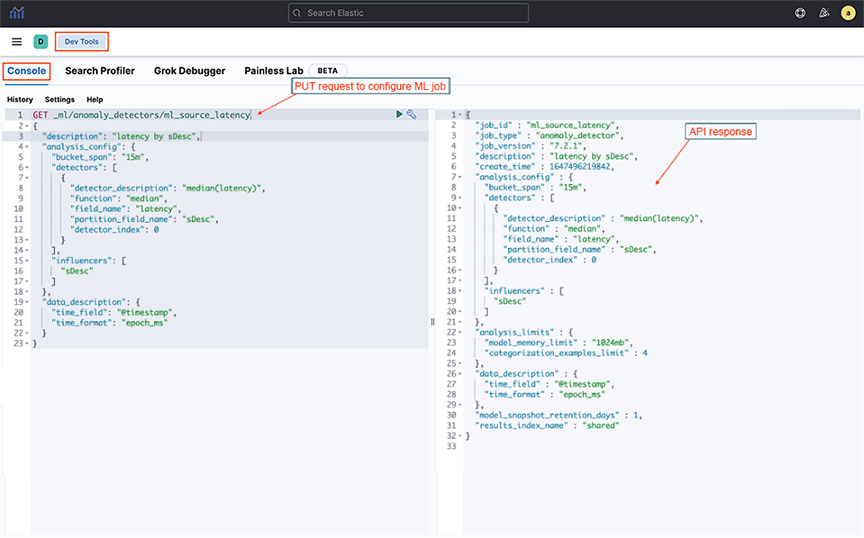
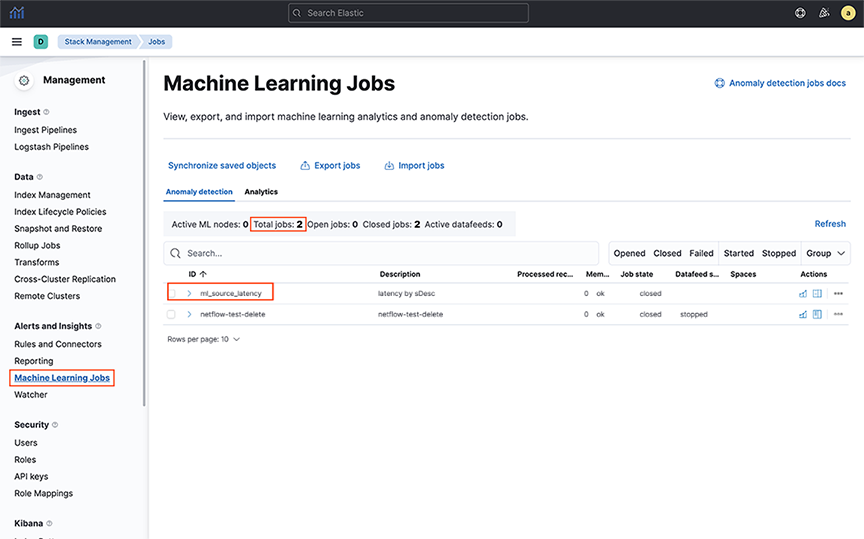
Importing Machine Learning Jobs
Machine Learning and Anomaly Detection
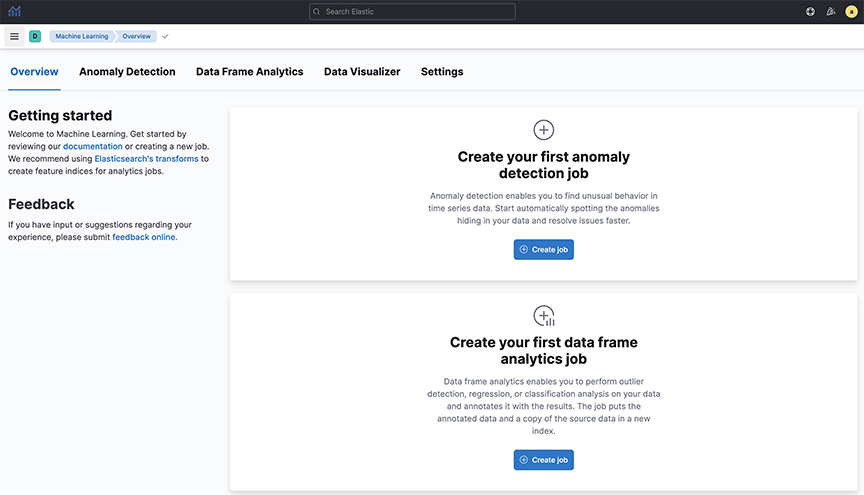
Machine Learning
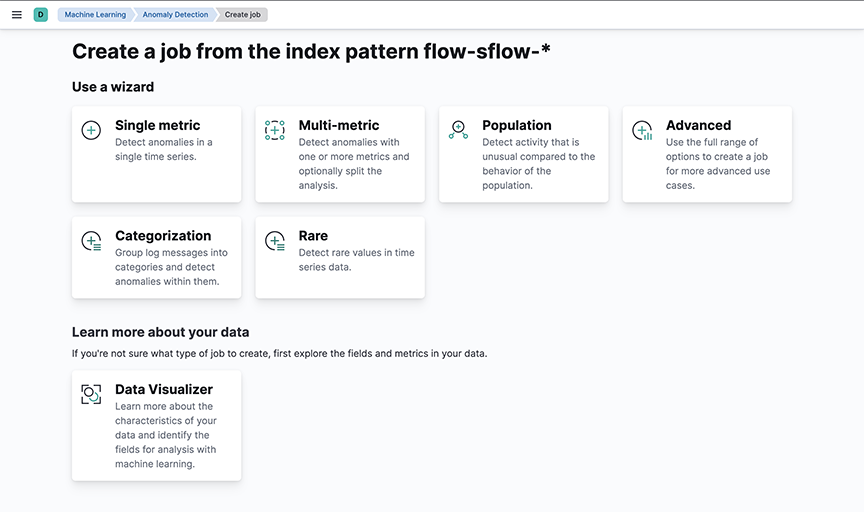
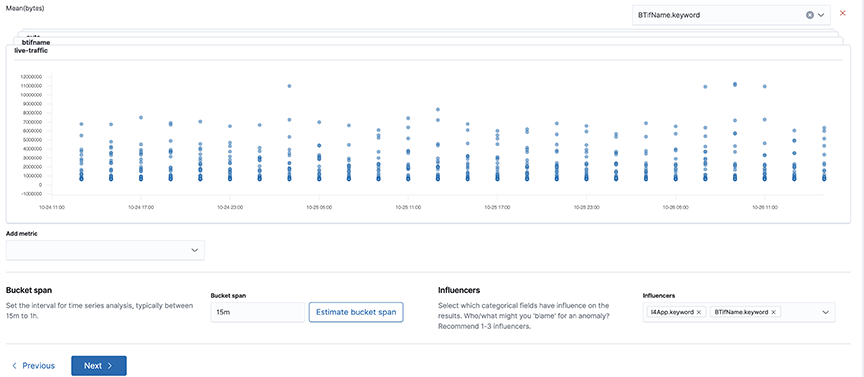
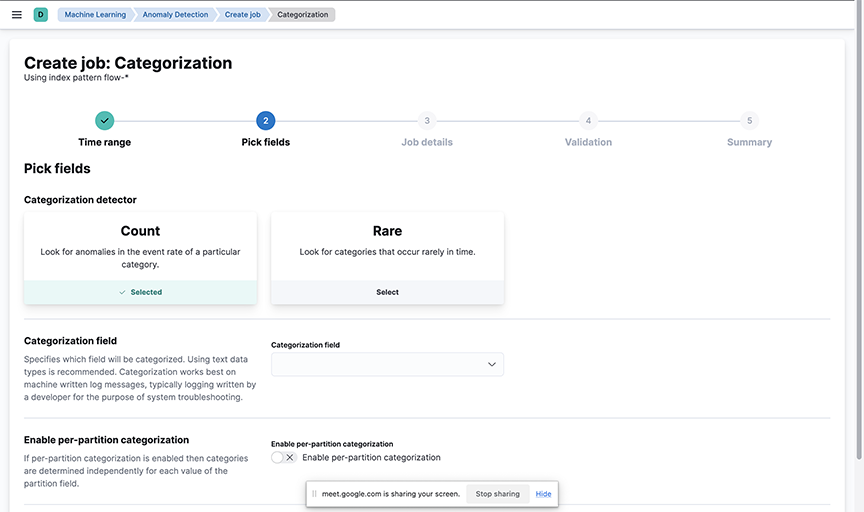
- Single-metric anomaly detection
- Multimetric anomaly detection
- Population
- Advanced
- Categorization
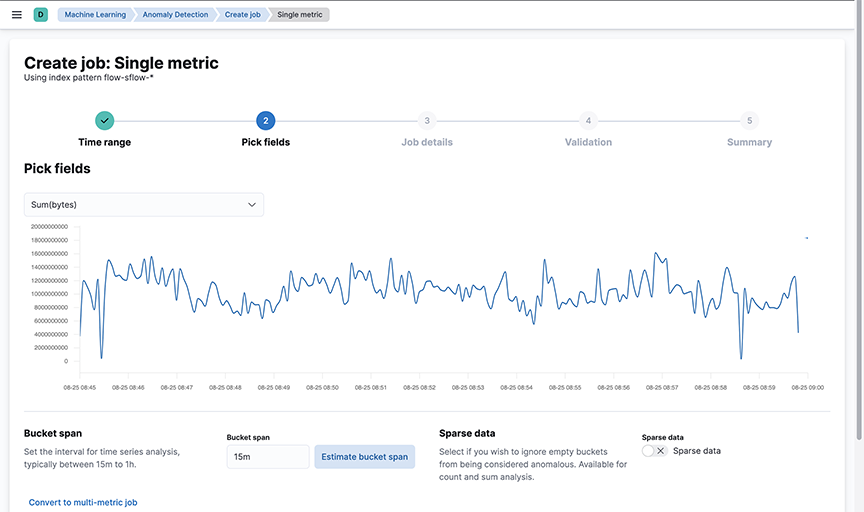
- Select the time range
- Select the appropriate metric
- Enter details: job ID, description, custom URLs, and calendars to exclude planned outages from the job
Single-metric anomaly detection uses machine learning on only one metric or field.
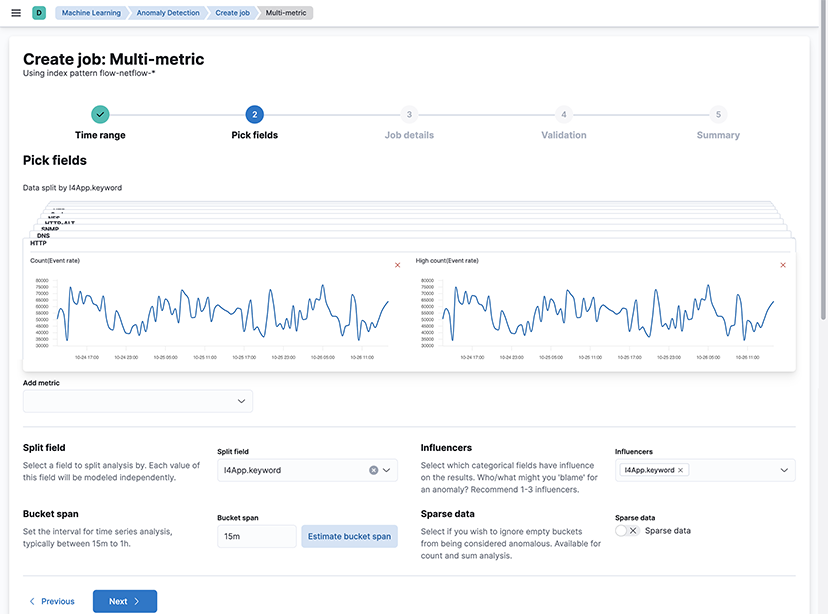
Anomalies
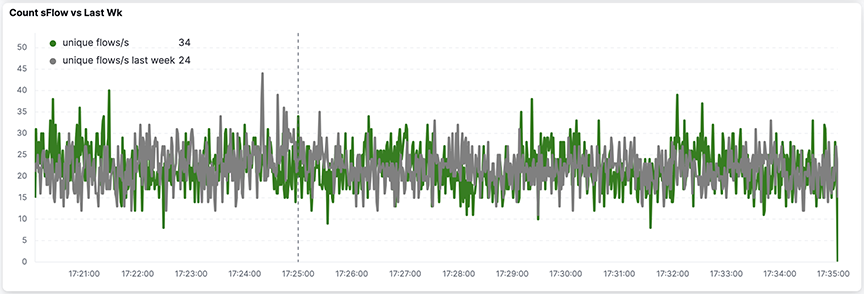
- Comparing dashboards and visualization over time
- sFlow®* > Count sFlow vs Last Wk
- New Flows & New Hosts
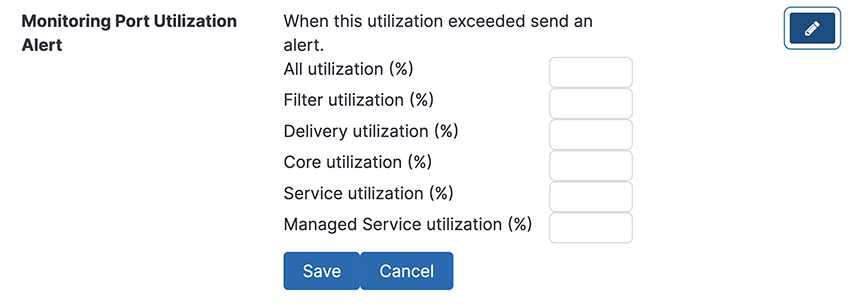
- Utilization alerts
- Machine Learning
Identify any unusual activity by comparing the same dashboard over the past 1 hour to the same time last week's data. For example, the bar visualization of traffic over time shows changing ratios of internal to external traffic, which can highlight an abnormality.

- Filter
- Delivery
- Core
- Services
- The percentage of outbound traffic exceeds the usual thresholds.
- New hosts appear on the network every 24 hours.


Application Data Management
Application Data Management (ADM) helps users govern and manage data in business applications like SAP ERP. To use Arista Analytics for ADM, perform the following steps:
- Pick a service IP address or block of IP addresses.
- Identify the main body of expected communication with adjacent application servers.
- Filter down to ports that need to be communicating.
- Expand the time horizon to characterize necessary communication completely.
- Save as CSV.
- Convert the CSV to ACL rules to enforce in the network.
Monitoring Active Directory Users
NetFlow Dashboard Management
NetFlow and IPFIX
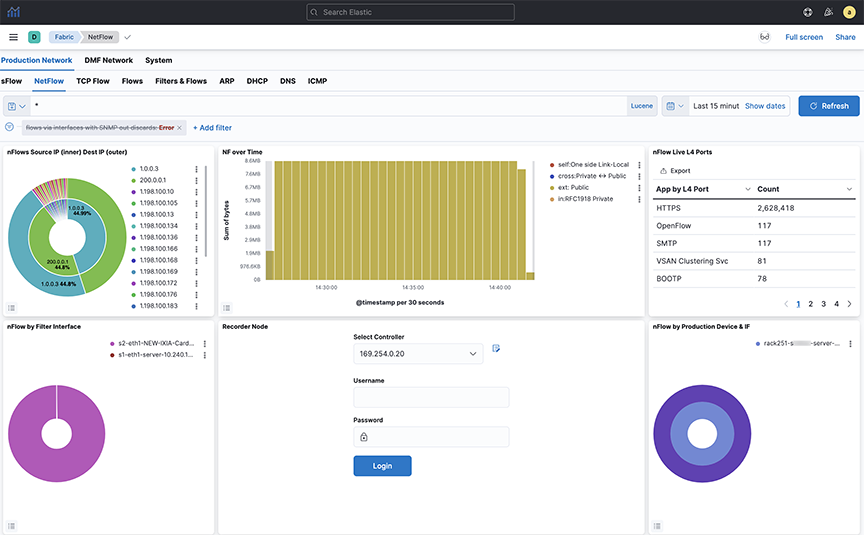
Configure the NetFlow collector interface on the Arista Analytics Node to obtain NetFlow packets.
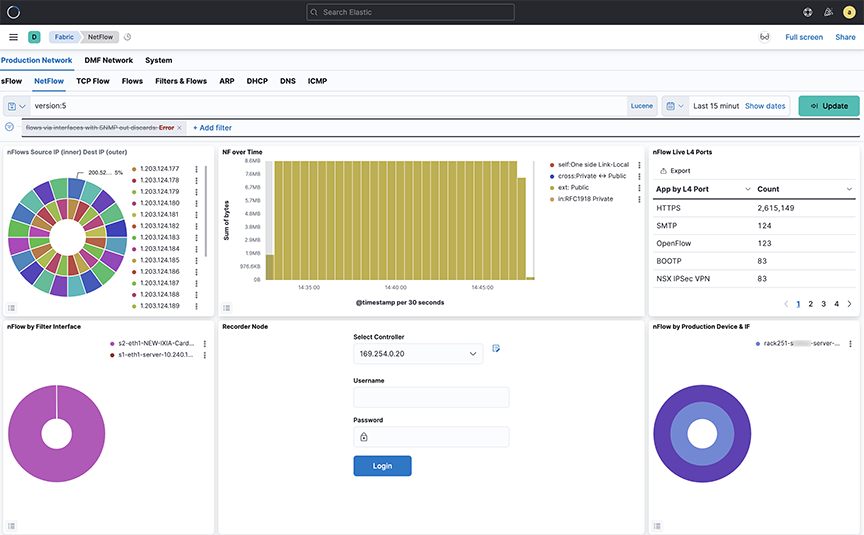
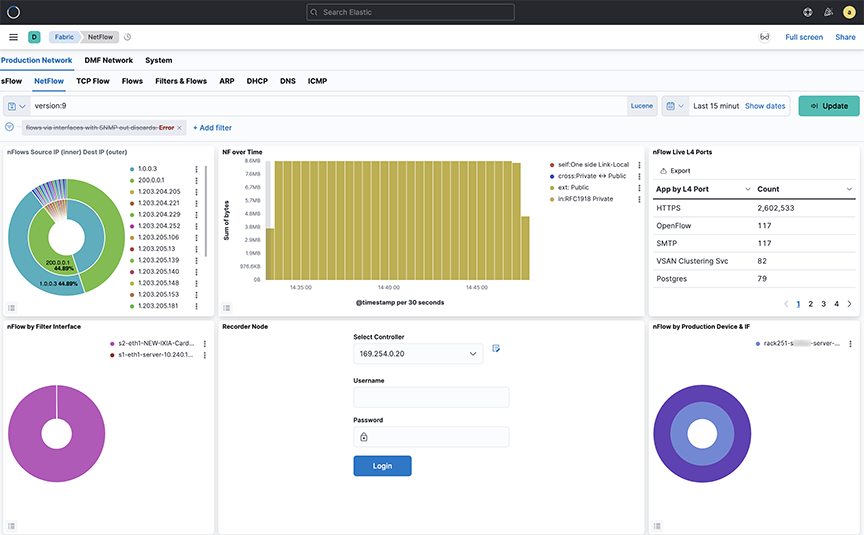
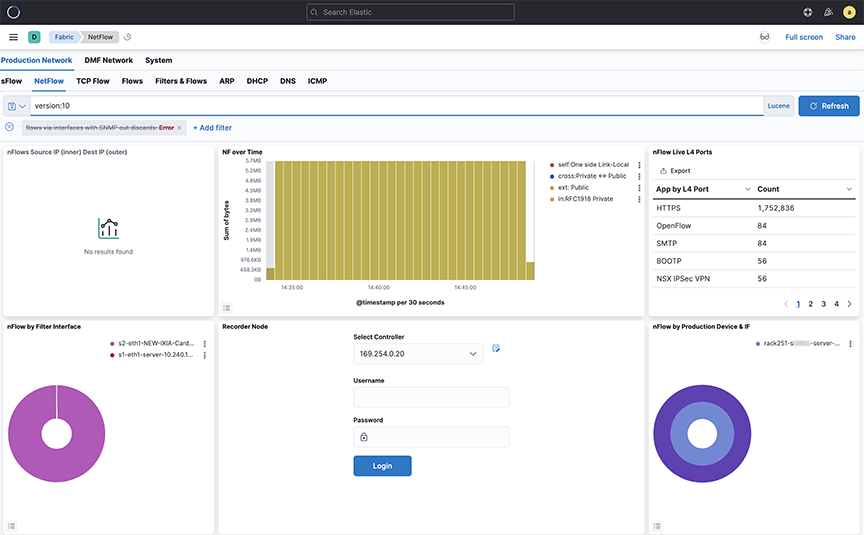
- The Arista Analytics Node cluster listens to NetFlow v9 and IPFIX traffic on UDP port 4739. NetFlow v5 traffic learn on UDP port 2055.
- Refer to DANZ Monitoring Fabric 8.4 User Guide for NetFlow and IPFIX service configuration.
- Analytics Node capability augments in support of the following Arista Enterprise-Specific Information Element IDs:
- 1036 -AristaBscanExportReason
- 1038 -AristaBscanTsFlowStart
- 1039 -AristaBscanTsFlowEnd
- 1040 -AristaBscanTsNewLearn
- 1042 -AristaBscanTagControl
- 1043 -AristaBscanFlowGroupId
Netflow v9/IPFIX Records
You can consolidate NetFlow v9 and IPFIX records by grouping those with similar identifying characteristics within a configurable time window. This process reduces the number of documents published in Elasticsearch, decreases hard drive usage, and improves efficiency. It is particularly beneficial for long flows, where consolidations as high as 40:1 also happen. However, enabling consolidation is not recommended for environments with low packet flow rates, as it may cause delays in the publication of documents.
cluster:analytics# config
analytics(config)# analytics-service netflow-v9-ipfix
analytics(config-controller-service)# load-balancing policy source-hashing
- Source hashing: forwards packets to nodes statistically assigned by a hashtable of their source IP address. Consolidation operations are performed on each node independently in source hashing.
- Round-robin: distributes the packets equally between the nodes if source-hashing results in significantly unbalanced traffic distribution. Round-robin is the default behavior.
Kibana Setup
To perform the Kibana configuration, select the tab on the Fabric page and open the panel:
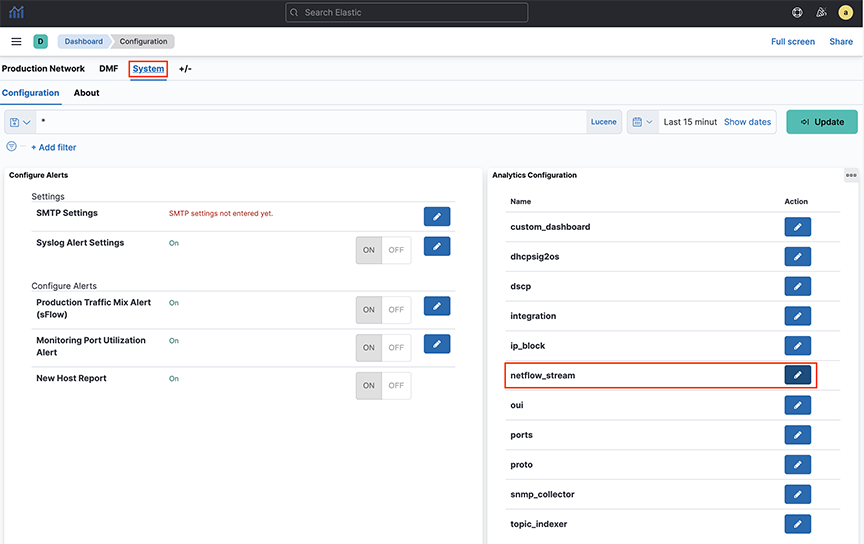

- enable: turn consolidation on or off.
- window_size_ms: adjust window size using the Netflow v9/IPFIX packet rate per second the analytics node receives. The default window size is 30 seconds but measured in milliseconds.
- mode: There are three supported modes:
- ip-port: records with the same source IP address, destination IP address, and IP protocol number. It also consolidates the lower numerical value of the source or destination Layer 4 port number with others.
- dmf-ip-port-switch: records from common DMF Filter switches that meet ip-port criteria.
- src-dst-mac: records with the same source and destination MAC addresses.
Note:It uses the mode when Netflow v9/IPFIX templates collect only Layer 2 fields.

Consolidation Troubleshooting
If consolidation is enabled but does not occur, Arista Networks recommends creating a support bundle and contacting Arista TAC.
Load-balancing Troubleshooting
If there are any issues related to load-balancing, Arista Networks recommends creating a support bundle and contacting Arista TAC.
NetFlow and IPFIX Flow with Application Information
Arista Analytics combines Netflow and IPFIX records containing application information with Netflow and IPFIX records containing flow information.
It improves the data visibility per application by correlating flow records with applications identified by the flow exporter.
It supports only applications exported from Arista Networks Service Nodes. In a multi-node cluster, you must configure load balancing in the Analytics Node CLI command.
Configuration
analytics# config
analytics(config)# analytics-service netflow-v9-ipfix
analytics(config-an-service)# load-balancing policy source-hashingKibana Configuration
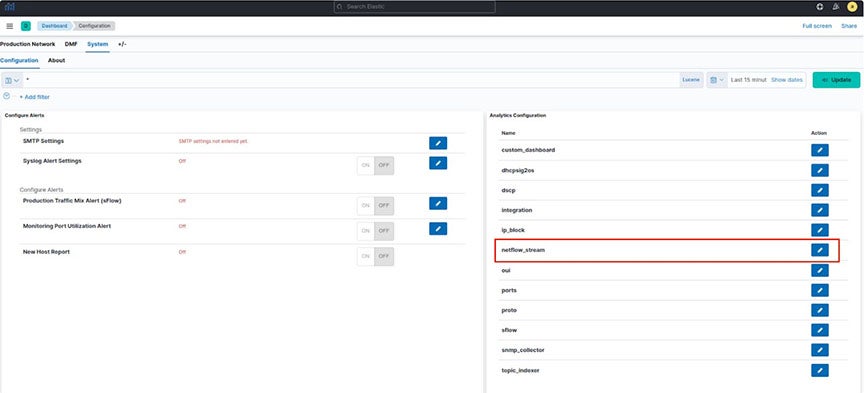
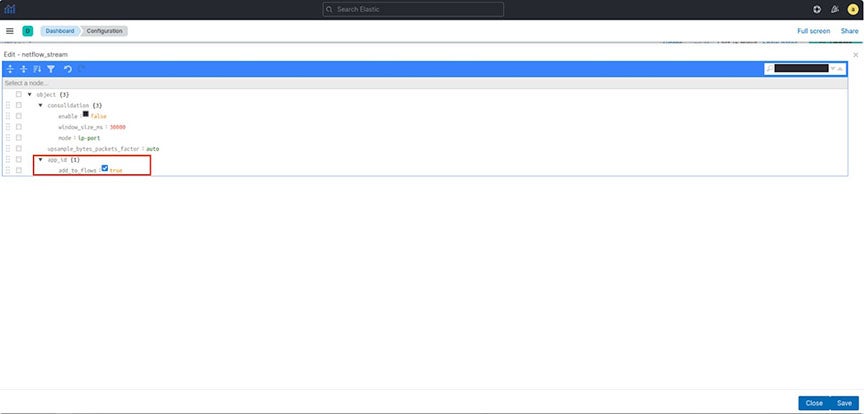
- add_to_flows: Enables or turns off the merging feature.
ElasticSearch Documents
Three fields display the application information in the final NetFlow/IPFIX document stored in ElasticSearch:
- appScope: Name of the NetFlow/IPFIX exporter.
- appName: Name of the application. This field is only populated if the exporter is NTOP.
- appID: Unique application identifier assigned by the exporter.
Troubleshooting
If merging is enabled but does not occur, Arista Networks recommends creating a support bundle and contacting Arista TAC.
Limitations
- Some flow records may not include the expected application information when configuring round-robin load balancing of Netflow/IPFIX traffic. Arista Networks recommends configuring the source-hashing load-balancing policy and sending all Netflow/IPFIX traffic to the Analytics Node from the same source IP address.
- Application information and flow records are correlated if the application record is available before the flow record.
- Arista Networks only supports collecting application information from Netflow/IPFIX exporters: NTOP, Palo Alto Networks firewalls, and Arista Networks Service Node.
- This feature isn’t compatible with the consolidation feature documented in the Netflow v9/IPFIX Records. When merging with application information is enabled, consolidation must be disabled.
NetFlow and sFlow Traffic Volume Upsampling
Arista Analytics can upsample traffic volume sampled by NetFlow v9/IPFIX and sFlow. This feature provides better visibility of traffic volumes by approximating the number of bytes and packets from samples collected by the NetFlow v9/IPFIX or sFlow sampling protocols. It gives those approximation statistics along with the Elasticsearch statistics. The feature bases the approximations on the flow exporter’s sampling rate or a user-provided fixed factor.
The Analytic Node DMF 8.5.0 release does not support the automated approximation of total bytes and packets for Netflow v9/IPFIX. If upsampling is needed, Arista Networks recommends configuring a fixed upsampling rate.
NetFlow/IPFIX Configuration
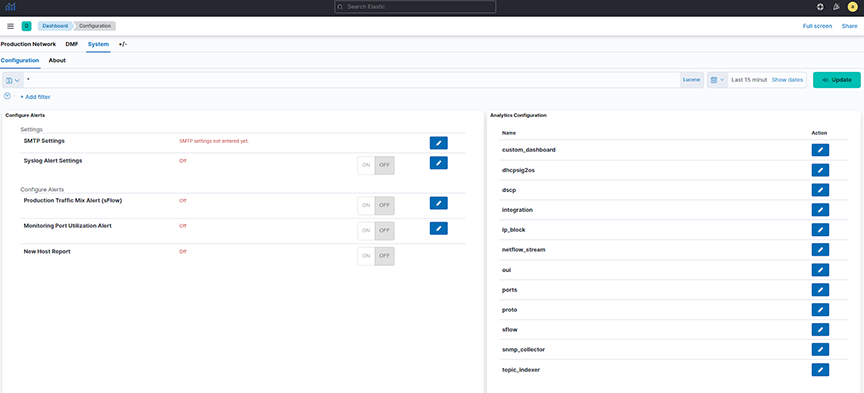
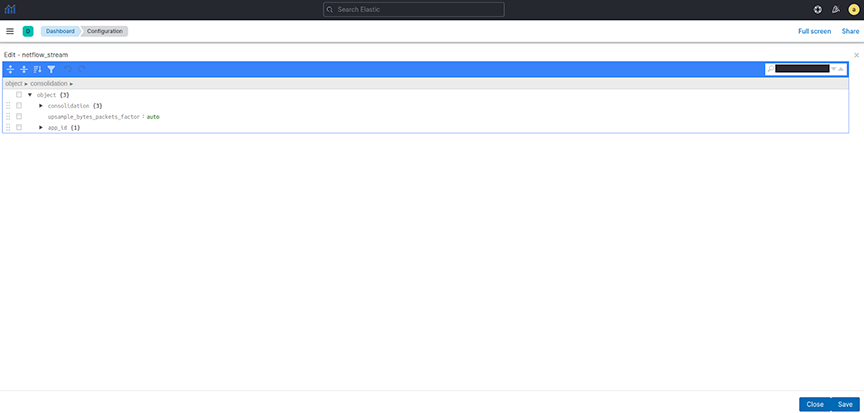
- Auto: This is the default option. Arista Networks recommends configuring an integer if upsampling is needed.
- Integer: Multiply the number of bytes and packets for each collected sample using this configured number.
sFlow Configuration

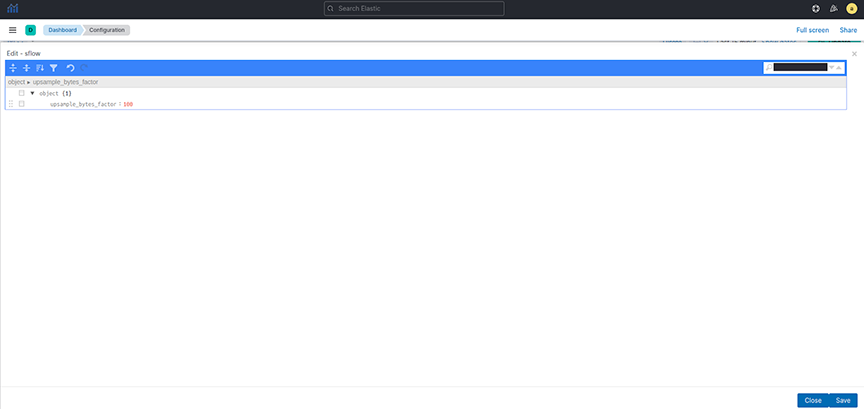
- Auto: Approximate the bytes and packets for each collected sample based on the collector’s sampling rate. Auto is the default option.
- Integer: Multiply the number of bytes and packets for each collected sample using this configured number.
Troubleshooting
Arista Networks recommends creating a support bundle and contacting Arista Networks TAC if upsampling isn’t working correctly.
Non-standard Ports Support for IPFIX and NetFlow v5
- NetFlow v5 (Standard Port: 2055): Alternates 1 and 2 are UDP ports 9555 and 9025.
- NetFlow v9/IPFIX (Standard Port: 4739): Alternates 1 and 2 are UDP ports 9995 and 9026.
Configuration
The alternate ports do not require special configuration; DMF automatically configures them to allow Netflow from any subnet, as illustrated in the following show command outputs.
Show Commands
ana1ytics(config-cluster-access)# show this
! cluster
cluster
access-control
access-list active-directory
!
access-list api
1 permit from ::/0
2 permit from 0.0.0.0/0
!
access-list gui
1 permit from ::/0
2 permit from 0.0.0.0/0
!
access-list ipfix
1 permit from ::/0
2 permit from 0.0.0.0/0
!
access-list ipfix-alt1
1 permit from ::/0
2 permit from 0.0.0.0/0
!
access-list ipfix-alt2
1 permit from ::/0
2 permit from 0.0.0.0/0
!
access-list netflow
1 permit from ::/0
2 permit from 0.0.0.0/0
!
access-list netflow-alt1
1 permit from ::/0
2 permit from 0.0.0.0/0
!
access-list netflow-alt2
1 permit from ::/0
2 permit from 0.0.0.0/0
access-list redis
!
access-list replicated-redis
!
access-list snmp
1 permit from ::/0
2 permit from 0.0.0.0/0
!
access-list ssh
1 permit from ::/0
2 permit from 0.0.0.0/0
Displaying Flows with Out-Discards
The NetFlow dashboard allows displaying flows with out-discards when the NetFlow packets come from third-party devices. To display this information, select the flows via interfaces with SNMP out-discards tab at the top of the Arista Analytics NetFlow dashboard.
To display the flows with out-discards, click the flows via interfaces with SNMP out-discards tab and click the Re-enable button. This window displays the flows with out-discards. This capability is valuable for network monitoring and troubleshooting as out-discards on interfaces can indicate potential issues such as congestion, rate limiting, errors or configuration issues.
Latency Differ and Drop Differ Dashboard
The DANZ Monitoring Fabric (DMF) Latency Differ Dashboard and Drop Differ Dashboard feature provides a near real-time visual representation of latency and drops in the DMF Analytics Node (AN) dedicated to NetFlow Records.
For a given flow, it reports the latency and drop of packets over time between two existing tap points (A, B), with network flows traversing the managed network from A towards B.
This feature introduces the concept of DiffPair, defined as a flow from A towards B.
The Dashboards provide comprehensive information about the flows. The data helps determine which applications are running slow and identifies peak times. A configurable mechanism alerts on abnormal drops and latency.
Introducing DiffPair
When identifying the flows between two tap points or filter interfaces, the aggregation occurs as A towards B pairs. It implies that point B receives a flow originating from point A. The term DiffPair is employed to visualize this flow as a cohesive set. This newly introduced field in the flow data selects the ingress and egress tap points encompassing a flow in between. The utilization of this DiffPair facilitates tap point filtering and comparison.
Latency Differ Dashboard
Locate the Latency Differ dashboard by searching for the term Latency Differ.

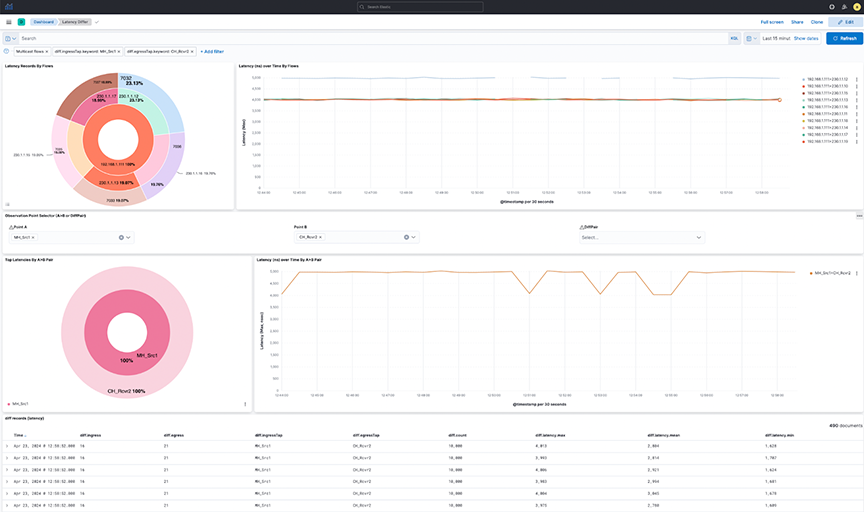
- Latency Records By Flows: The pie chart represents the proportions of flow latency summed. The inner circle displays source IP addresses, the middle circle displays destination IP addresses, and the outermost circle displays destination ports.
- Latency over time By Flows: The line chart represents the maximum Latency in nanoseconds (ns) over time, split by each flow between source IP and destination IP addresses.
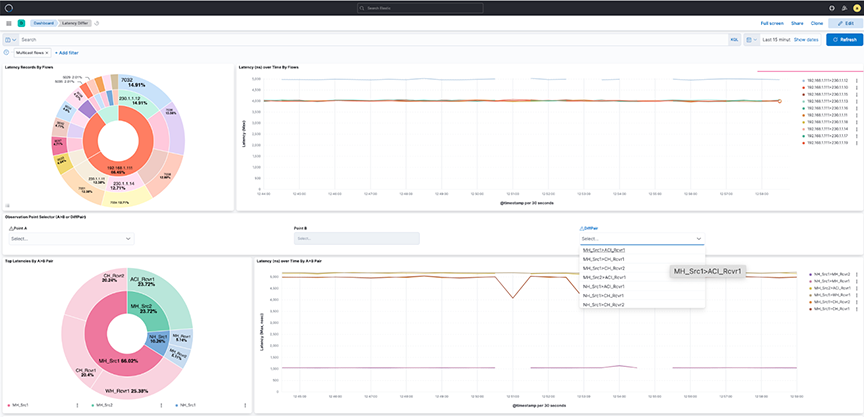
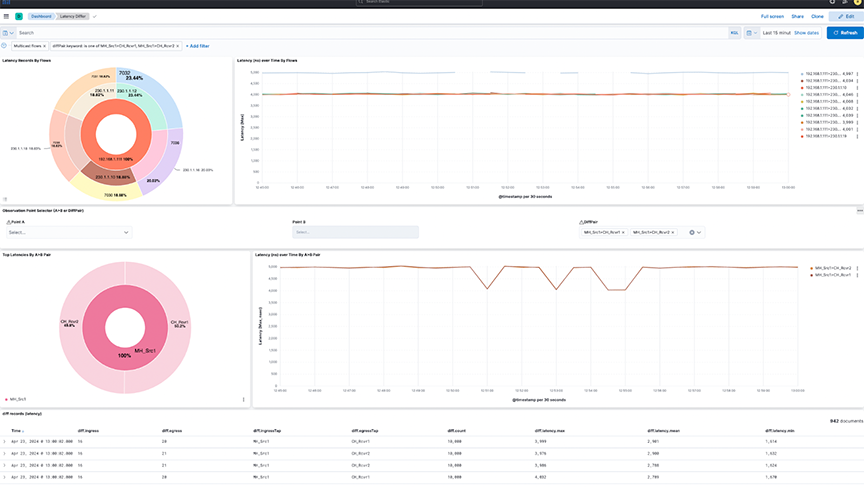
- Observation Point Selector ( or DiffPair): Use the drop-down menus to filter by pair or DiffPair. The point B selector is dependent on point A.
- Top Latencies By Pair: The pie chart shows the Latency max summed by Points. The inner circle displays the source A tap point, while the outer circle displays the B destination tap point.
- Latency over time By Pair: The line chart represents the maximum Latency in nanoseconds (ns) over time, split by each pair between the source tap point and destination tap point.
Figure 15. Latency Record by Flows 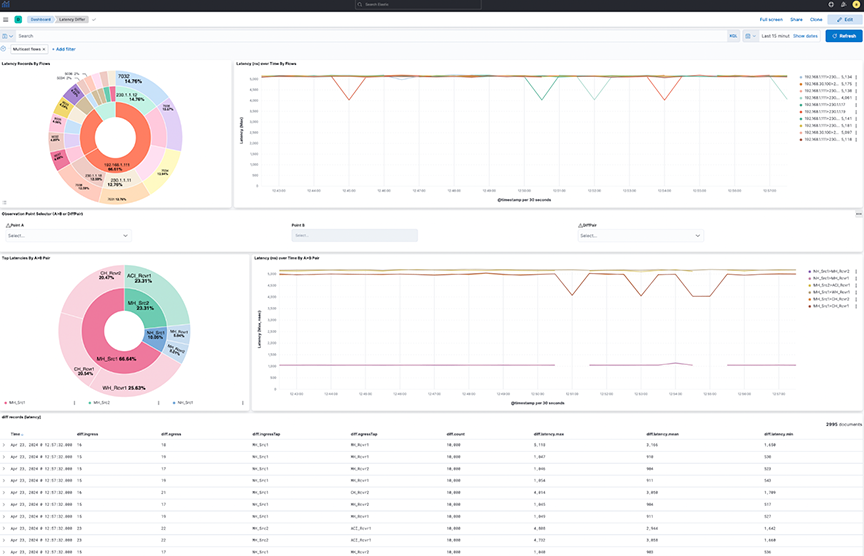

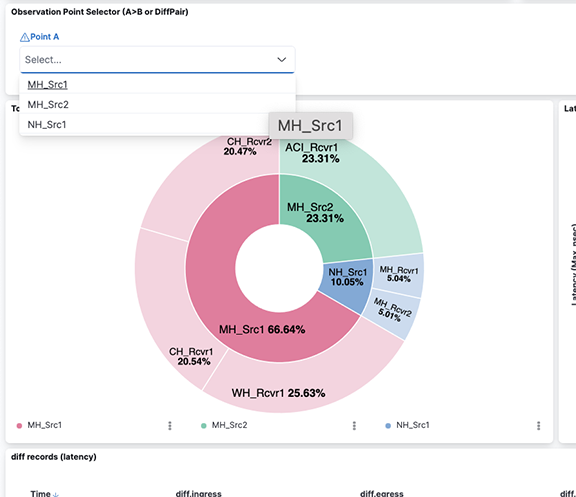
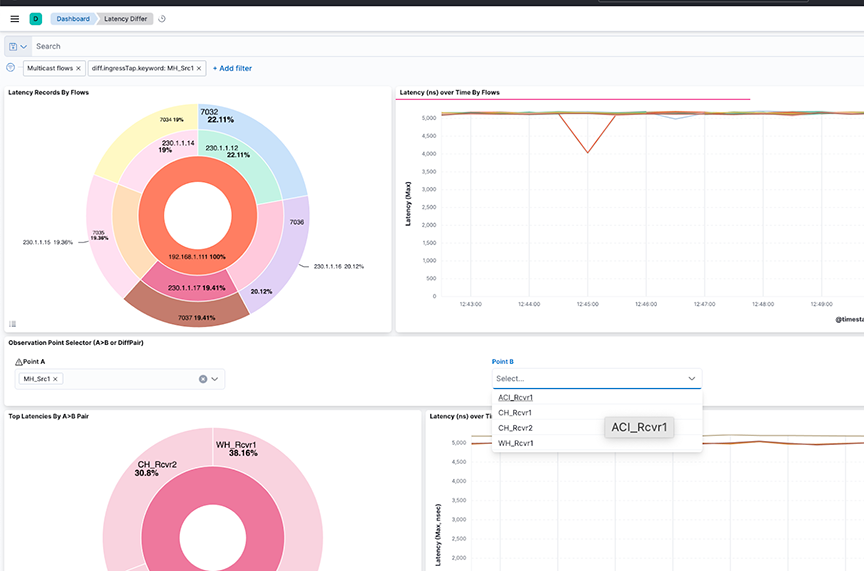
The dashboard displays the latency between points A and B(s), separated by flows between the points in the upper view or filtered by the pairs in the lower view. The diff records appear on the lower dashboard.
Select individual data points in the visualization for further analysis.
Drop Differ Dashboard
Locate the Drop Differ dashboard by searching for the term Drop Differ.

- Drop Records By Flows: The pie chart represents the proportions of drop packets for each flow summed. The inner circle displays source IP addresses, the middle circle displays destination IP addresses, and the outermost circle displays destination ports.
- Max Drops By Flows: The line chart represents the maximum number of drop packets, separated by each flow between source IP and destination IP addresses. If fewer data points exist, the chart displays them as individual points instead of complete lines.
- Observation Point Selector (A>B or DiffPair): Use the drop-down menus to filter by pair or DiffPair. The point B selector is dependent on point A.
- Top Drop A>B: The heat map displays the drop of packets summed by Points. The map plots the source tap point, A, on the vertical axis and the destination tap point, B, on the horizontal axis.
- Top Dropping A>B Pairs: The bar chart represents the sum of drop packets over time, separated by each pair between the source and destination. It shows the Top 10 available dropping pairs.
Figure 23. Top Dropping A>B Pairs 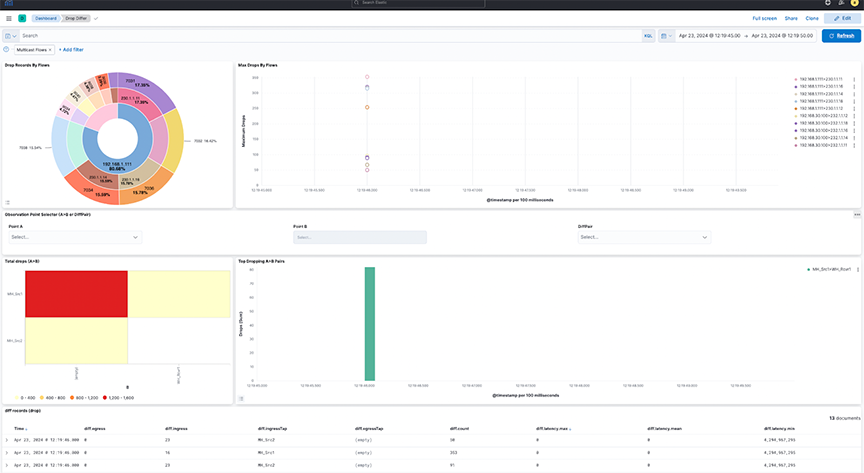
Select selection or DiffPair to visualize the data types.
Filter the data using Points by selecting a single source (A) and one or more receivers (B).
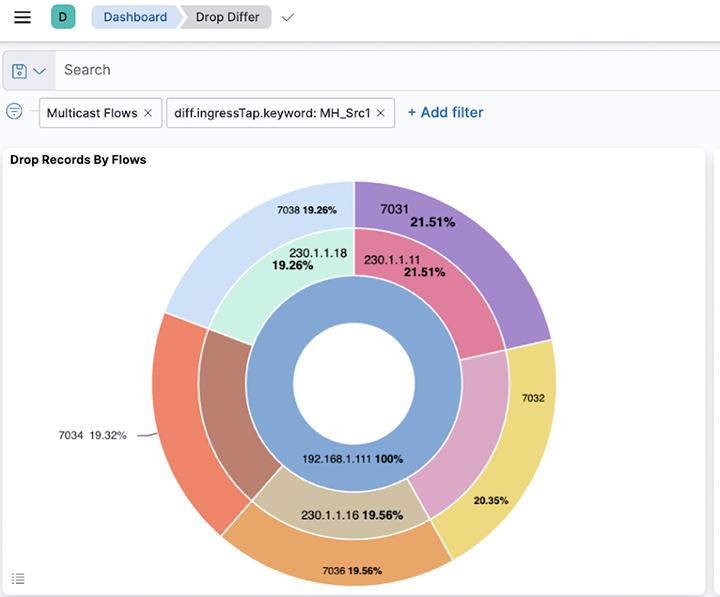
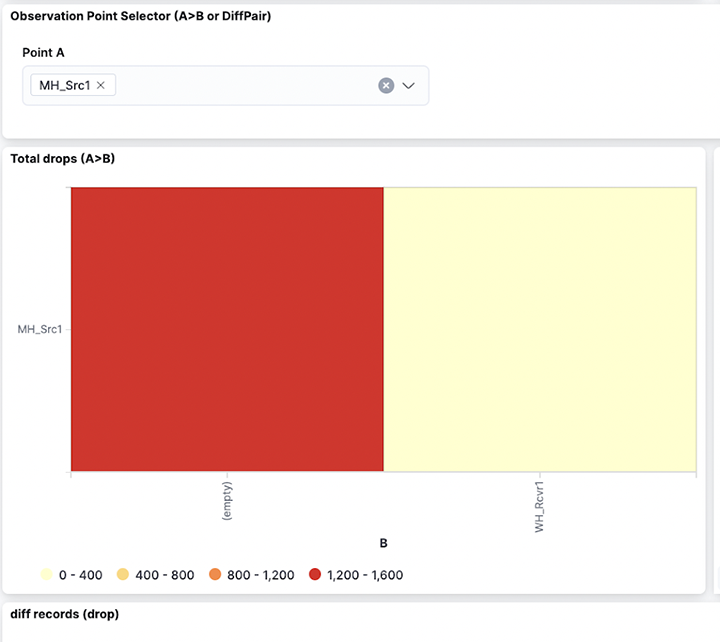
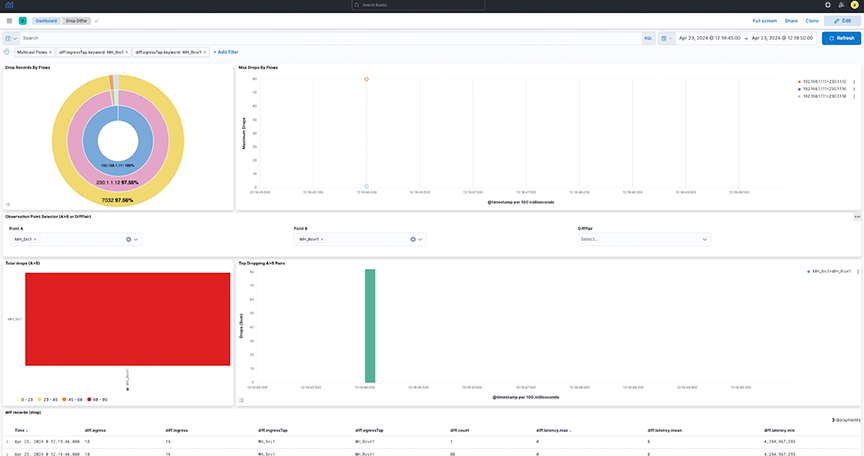
- It provides a dashboard for packet drops between points A and B(s), either split by flows in between those points (Top) or filtered by pairs (bottom) as selected. View the diff records at the bottom of the dashboard.
- Select individual data points in the visualization for further analysis.
- Selecting DiffPairs can provide a similar visualization perspective. Choose one or more DiffPairs for analysis.
Figure 27. DiffPair Analysis for Drop Differ 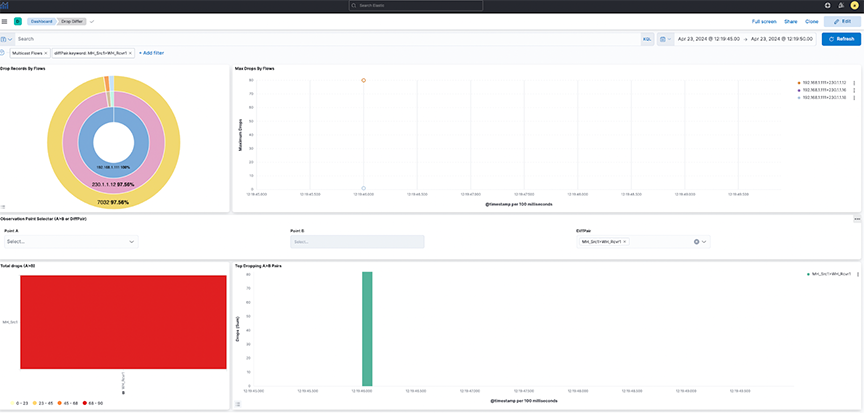
Configuring Watcher Alerts
Watcher is an elastic search feature that supports the creation of alerts based on conditions triggered at set intervals. For more information, refer to the https://www.elastic.co/guide/en/kibana/8.15/watcher-ui.html.
- Arista_NetOps_Drop_Differ_Watch
- arista_NetOps_Latency_Differ_Watch
By default, it disables the templates and requires manual configuration before use.
- Navigate to .
- Under Configuration for the SMTPForAlerts Connector, specify the Senderand Service field values.
- Email alerts may require authentication based on the type of mail service selected.
- Test and validate the settings using the Test tab.
Figure 28. Testing SMTP Connector 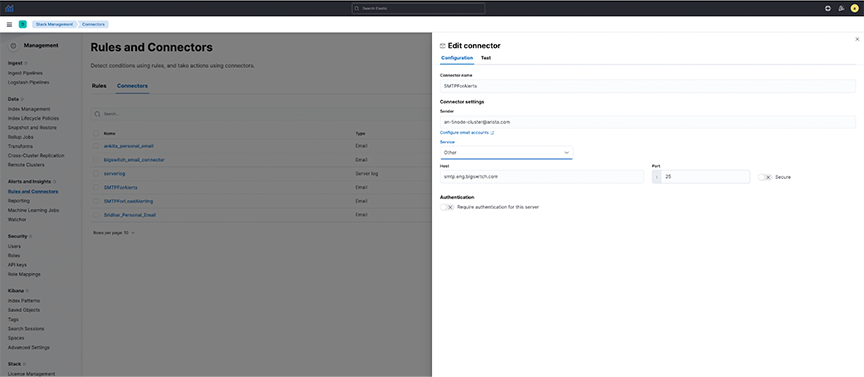
- arista_NetOps_Drop_Differ_Watch:
- It configures the watcherto send an alert when the maximum drop count of packets in NetFlow in the last 5-minute interval exceeds the historical average (last 7-day average) of drop of packets by a threshold percentage.
- By default, it configures the watcher to be triggered every 10 minutes.
- As this may be incorrect for all flows combined, configure it for a particular Flow and Destination Port.
- Search for CHANGE_ME in the watcher and specify the flow and destination port value (introduced to correctly compare each flow and destination port individually instead of comparing all flows together).
- Specify the percentage_increase parameter in the condition using a positive value between 0-100.
- Enter the recipient's email address receiving the alert.
- Select Save watch.
Figure 29. NetOps_Drop_Differ_Watch-1 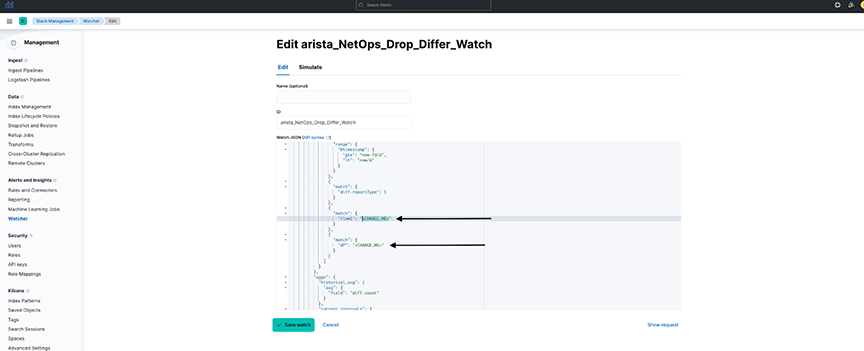
Figure 30. NetOps_Drop_Differ_Watch-2 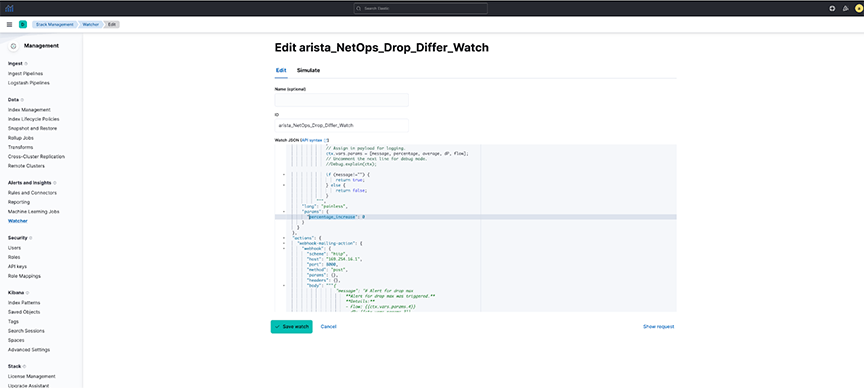
Figure 31. Editing NetOps_Drop_Differ_Watch 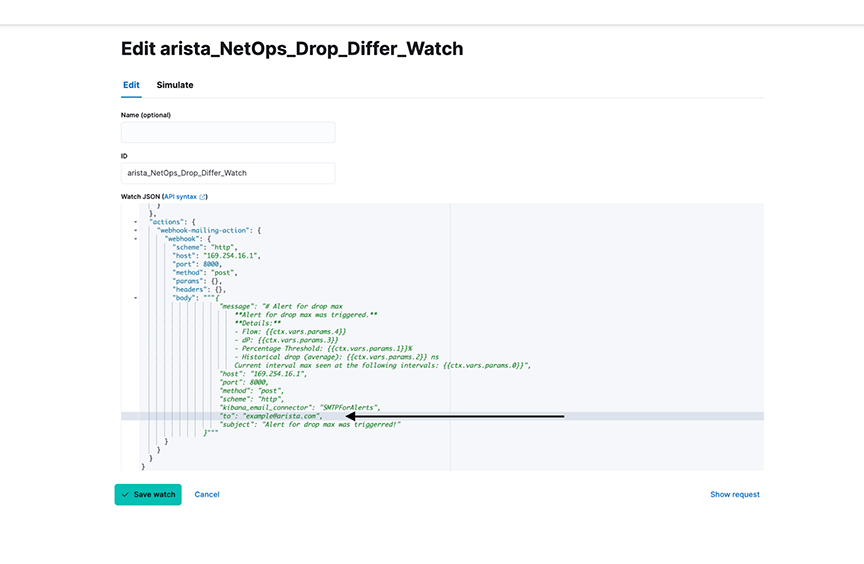
- arista_NetOps_Latency_Differ_Watch:
- It configures the watcher to send an alert when NetFlow's maximum latency (or lag) in the last 5-minute interval exceeds the historical average (last 7-day average) latency by a threshold percentage.
- By default, it configures the watcher to be triggered every 10 minutes.
- As this may be incorrect for all flows combined, configure it for a particular Flow and Destination Port.
- Search for CHANGE_ME in the watcher and specify the flow and destination port value (introduced to correctly compare each flow and destination port individually instead of comparing all flows together).
- Specify the percentage_increase parameter in the condition using a positive value between 0-100.
- Enter the recipient's email address receiving the alert.
- Select Save watch.
Considerations
- Default Watchers are disabled and modified with user-configured alert settings before being enabled.
Figure 32. Arista_NetOps_Drop_Differ_Watch 
Troubleshooting
- The dashboard obtains its data from the flow-netflow index. If no data is present in the dashboard, verify there is sufficient relevant data in the index.
- Watchers trigger at a set interval. To troubleshoot issues related to watchers, navigate to . Select the requisite watcher and navigate to Action statuses to determine if there is an issue with the last trigger.
Figure 33. Watcher Action Status 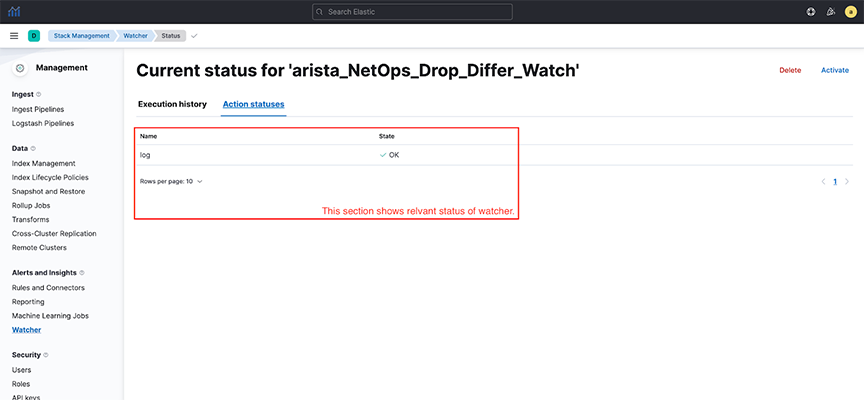
Usage Notes
- The dashboards only show partial and not full drops during a given time and are configured with filtering set to the egress.Tap value as empty.
- A full drop occurs when the flow of packets is at the source tap point, but no packet is at the destination tap point. The dashboards are configured to filter out full drop flows.
- A partial drop is a scenario in which the flow of packets at the source tap point and some, if not all, packets are observed at the destination tap point. The dashboards clearly show partial drop flows.
VoIP
SIP
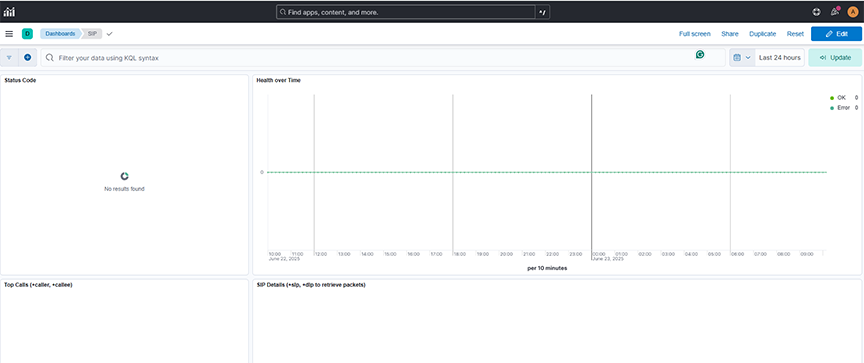
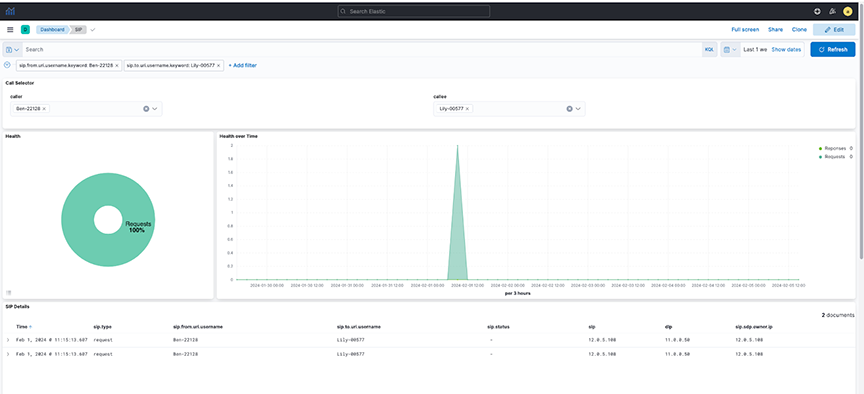
The SIP dashboard provides information about SIP responses, call attempts and call events.
- Status Code: Displays a pie chart of SIP response code distribution over a selected time range, using counts of each sip.code value to highlight the most frequent responses.
- Health Over Time: Displays the count of SIP transactions labeled as OK and Error over a selected time range, helping monitor SIP responses' success and failure trends based on filtered query strings.
- Top Calls (+caller, +callee): Displays the number of SIP call attempts grouped by caller and callee over a selected time range, allowing you to analyze the top calling pairs based on activity volume.
- SIP Details (+sip, +dip to retrieve packets): Displaysa detailed table of SIP call events over a selected time range, showing fields such as timestamp, caller, callee, SIP status, and IP information to help analyze SIP request and response activity.
Analyzing SIP and RTP
This feature describes how Session Initiation Protocol (SIP) packets are parsed in a DANZ Monitoring Fabric (DMF) Analytics Node deployment and presented in a dashboard to allow the retrieval of data packets conveying voice traffic (RTP) from the DMF Recorder Node (RN). DMF accomplishes this by showing logical call information such as the call ID, phone number, and username. After retrieving the SIP record, the associated IP addresses are used to retrieve packets from the RN and opened in Wireshark for analysis.
DMF Preconditions
- Policy configured to filter for SIP traffic (UDP port 5060) such that low-rate traffic (< 1Gbps) is delivered to AN via collector interface with a filter on the Layer 4 port number or User Defined Field (UDF).
- LAG will send SIP Control Packets to 1, 3, and 5 AN Nodes with symmetric hashing enabled and without hot-spotting.
- Recorder Node to receive SIP and Control packets recorded with standard key fields.
Configuration
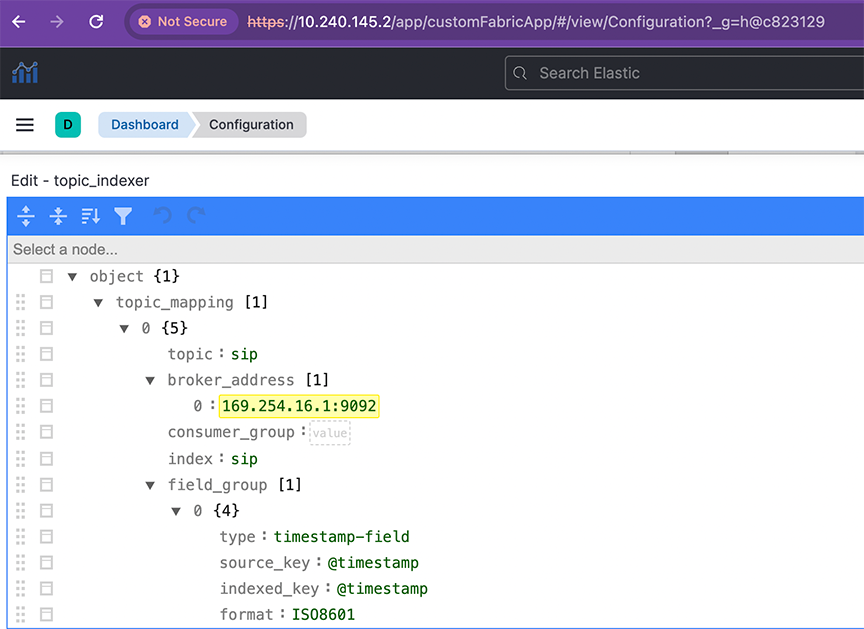
Configure SIP using the broker_address, timestamp-field, and field_group to enable the feature. Refer to Topic Indexer for more information on broker_address.
Limitations
- There is no toggle switch to turn this feature on or off.
Network
Rates
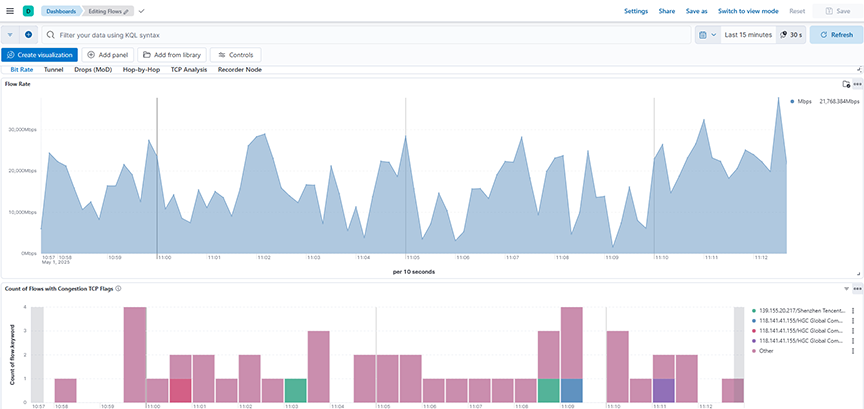
The Network → Rates dashboard summarizes information aboutthe analysis of the rates, congestion, and packets in Wireshark and provides the following panels:
- Flow Rate: Calculates and displays the flow rate in Mbps over a selected time range by summing the upsampledByteCount field and applying a mathematical transformation to derive the bit rate per second.
- Count of Flows with Congestion TCP Flags: Displays the count of flows with congestion TCP flags over a selected time range, grouping and stacking the results based on the top flow identifiers.
Tunnel
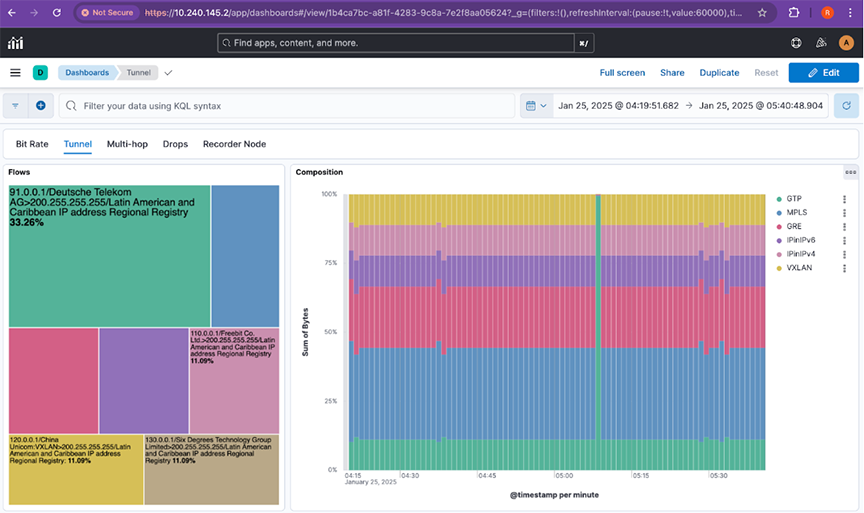
The Network → Tunnel dashboard summarizes information about flows and its composition for the bytes and data and provides the following panels:
- Flows: Displays the distribution of flows based on the sum of bytes across the top flow types over a selected time range, using a treemap for easy comparison.
- Composition: Displays the percentage composition of different Tunnel flow types based on the sum of bytes over a selected time range, using a vertically stacked bar chart for comparison.
Troubleshooting
- Verify records are arriving for sFlow® on the home page of the Analytical Node.
- In Kibana Discover, select data-view flow-sflow-* to determine if any records are arriving.
- Check the agt field to see if the switch sends sFlow, and the AN parses and shows records.
- Verify the records contain fields proto, eType, dP, sP. These are the fields required by this feature to categorize tType to MPLS, GRE, GTP, IPinIPv4, IPinIPv6, and VXLAN.
Drop (MoD)
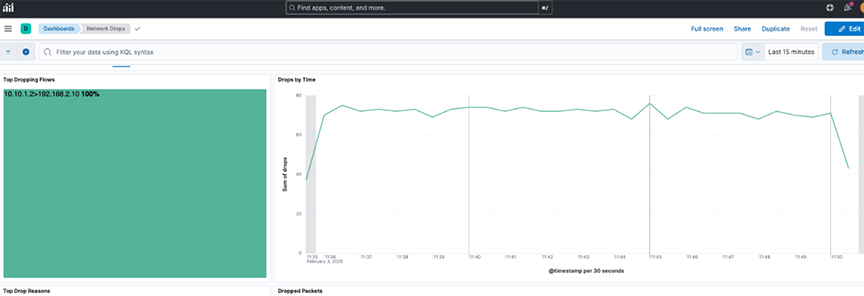
The Network → Drop (MoD) dashboard provides reasons by analyzing overall drops and drops by flow for dropped packets as a Mirror on Drop (MoD) Flow sFlow collector.
- Top Dropping Flows: Displays the top flows experiencing the highest packet drops, grouped by flow name and based on the sum of drops over a selected time range.
- Drops by Time: Displays the trend of packet drops over a selected time range, plotting the sum of drops against time to highlight when network congestion or loss events occurred.
- Top Drop Reasons: Displays the top reasons for packet drops over a selected time range by counting the occurrences of different discard reasons.
- Dropped Packets: Displays the detailed records of dropped packets over a selected time range, including fields like flow information, drop count, and discard reason.

Troubleshooting
- Verify records are arriving for sFlow® on the home page of the Analytical Node.
- In Kibana Discover, select data-view flow-sflow-* to determine if any records are arriving.
- Check the agt field to see if the switch sends sFlow, and the AN parses and shows records.
- Verify the records contain field drops & discard_reason.
Hop-by-Hop
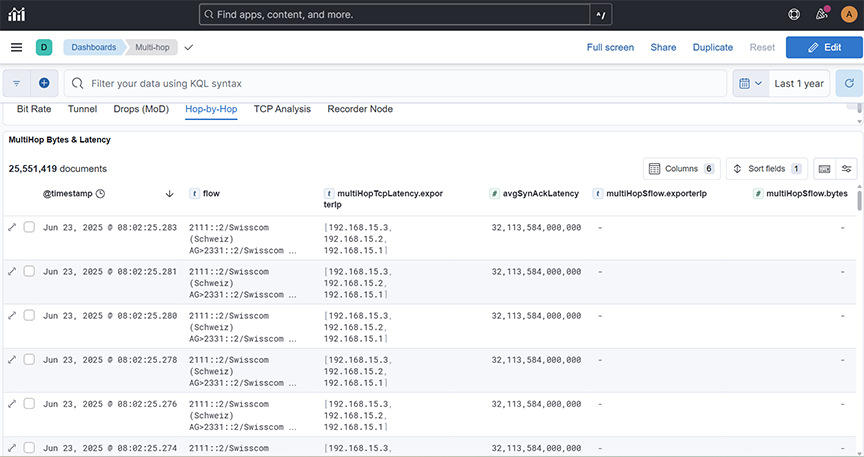
The Network → Hop-by-Hop dashboard provides information about multihop bytes and data.
- MultiHop Bytes & Latency: Displays the distribution of flows based on the multiple hopping of the bytes across the top flow types.
TCP Analysis
The TCP Analysis dashboard provides information about multihop bytes and data.
- TCP Health Flows: Displays the count of TCP health flows observed through Dapper for different flow types over a selected time range, helping monitor network performance and detect anomalies.
- TCP Window LineChart: Displays the average TCP window size and flight size metrics over a selected time range to monitor flow control behavior and congestion trends as part of TCP Analysis (Dapper).
- Incidence TCP Network Loss: Displays the number of TCP retransmissions over a selected time range to monitor packet loss and network reliability as part of TCP Analysis (Dapper).
- Incidence of Zero TCP Window: Displays the number of Zero TCP Window events over a selected time range to monitor periods when receivers are unable to accept more data, helping assess congestion and flow control issues as part of TCP Analysis (Dapper).
- Timings LineChart: Plots the average Round-Trip Time (RTT) and Sender Reaction Time across a selected time range to help monitor network latency and transmission responsiveness as part of TCP Analysis (Dapper).
DMF Recorder Node
This section describes Arista Analytics to use with the DANZ Monitoring Fabric Recorder Node. It includes the following sub-sections.
Overview
- Querying packets across multiple recorders.
- Viewing recorder status, statistics, errors, and warnings.
DANZ Monitoring Fabric Policy determines matching packets to one or more recorder interfaces. The DMF Recorder Node interface defines the switch and port where the recorder connects to the fabric. A DANZ Monitoring Fabric policy treats these as delivery interfaces.
The recorder node visualization is present in both NetFlow and TCPflow dashboards.
General Operation
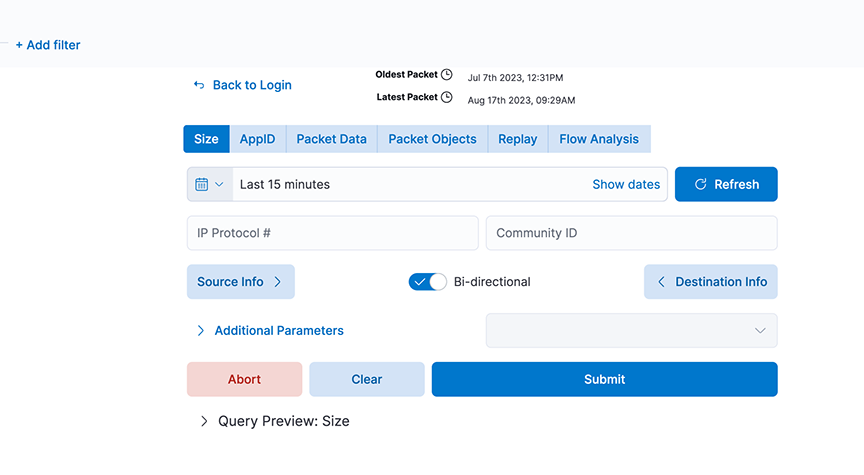
The Recorder Node window can compose and submit a query to the DMF Recorder Node. Select any of the fields shown to create a query and click Submit. The Switch Controller link at the bottom of the dialog can log in to a different DMF Recorder Node.
Select the Recorder Summary query to determine the number of packets in the recorder database. Then, apply filters to retrieve a reasonable number of packets with the most interesting information.
You can modify the filters in the recorder query until a Size query returns the most beneficial number of packets.
Query Parameters
- Query Type
- Size: Retrieve a summary of the matching packets based on the contents and search criteria stored in the recorder node. Here, Size refers to the total frame size of the packet.
- AppID: Retrieve details about the matching packets based on the contents and search query in the recorder node datastore, where the packets are stored. Use this query to see what applications are in encrypted packets.
- Packet Data: Retrieve the raw packets that match the query. At the end of a search query, it generates a URL pointing to the location of the pcap if the search query is successful.
- Packet Objects: Retrieve the packet objects that match the query. At the end of a search query, it generates a URL pointing to the location of the objects (images) if the search query is successful.
- Replay: Identify the Delivery interface in the field that appears, where the replayed packets are forwarded.
- FlowAnalysis: Select the flow analysis type (HTTP, HTTP Request, DNS, Hosts, IPv4, IPv6, TCP, TCP Flow Health, UDP, RTP Streams, SIP Correlate, SIP Health).
- Time/Date Format: Identify the matching packets' time range as an absolute value or relative to a specific time, including the present.
- Source Info: Match a specific source IP address/MAC Address/CIDR address.
- Bi-directional: Enabling this will query bi-directional traffic.
- Destination Info: Match a specific destination IP address/MAC Address/CIDR address.
- IP Protocol: Match the selected IP protocol.
- Community ID: Flow hashing.
- VLAN: Match the VLAN ID.
- Outer VLAN: Match the outer VLAN ID when multiple VLAN IDs exist.
- Inner/Middle VLAN: Match the inner VLAN ID of two VLAN IDs or the middle VLAN ID of three VLAN IDs.
- Innermost VLAN: Match innermost VLAN ID of three VLAN IDs.
- Filter Interfaces: Match packets received at the specified DANZ Monitoring Fabric filter interfaces.
- Policy Names: Match packets selected by the specified DANZ Monitoring Fabric policies.
- Max Size: Set the maximum size of the query results in bytes.
- Max Packets: Limits the number of packets the query returns to this set value.
- MetaWatch Device ID: Matches on device ID/serial number found in the trailer of the packet stamped by the MetaWatch Switch.
- MetaWatch Port ID: Matches on application port ID found in the trailer of the packet stamped by the MetaWatch Switch.
- Packet Recorders: Query a particular DMF Recorder Node. Default is none or not selected; all packet recorders configured on the DANZ Monitoring Fabric receive the query.
- Dedup: Enable/Disable Dedup.
- Query Preview: After expanding, this section provides the Stenographer syntax used in the selected query. You can cut and paste the Stenographer query and include it in a REST API request to the DMF Recorder Node.
Using Recorder Node with Analytics
For interactive analysis, any set of packets exceeding 1 GB becomes unwieldy. To reduce the number of packets to a manageable size, complete the following steps:
System
Configuration
- Configure Alerts
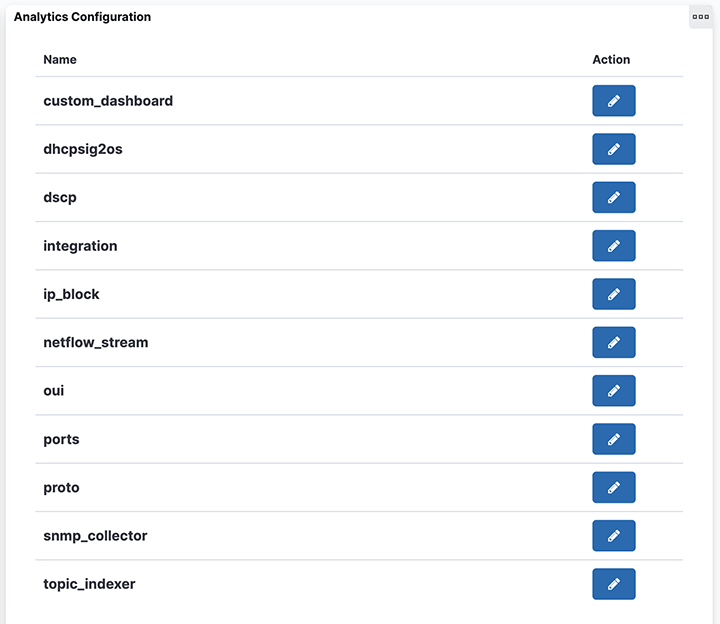
- Analytics Configuration
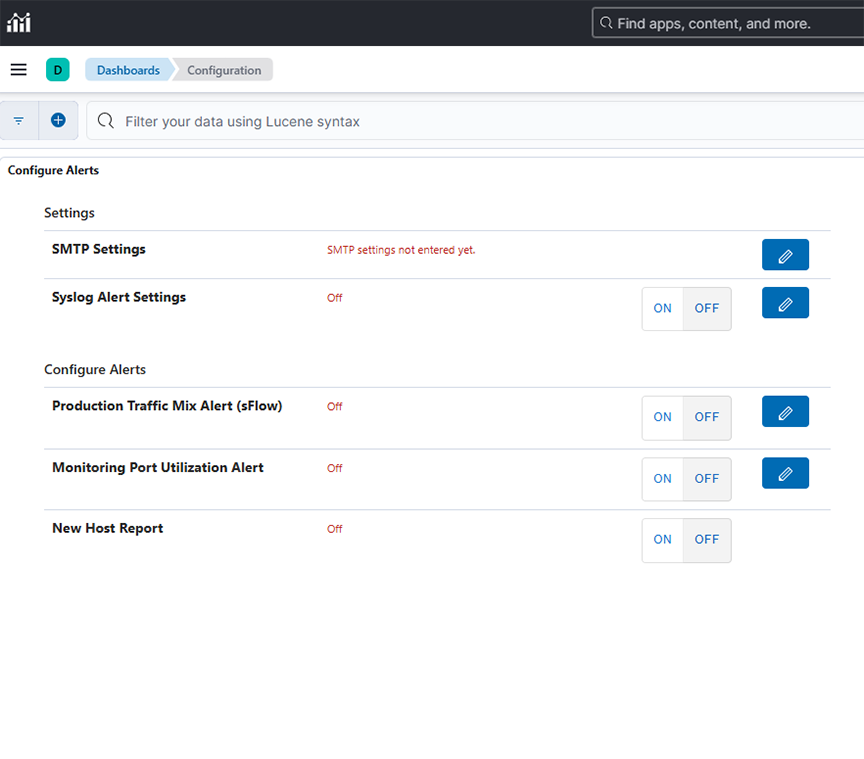
Configure Alerts
- SMTP Settings
- Syslog Alert Settings
- Production Traffic Mix Alert (sFlow)
- Monitoring Port Utilization Alert
- New Host Report
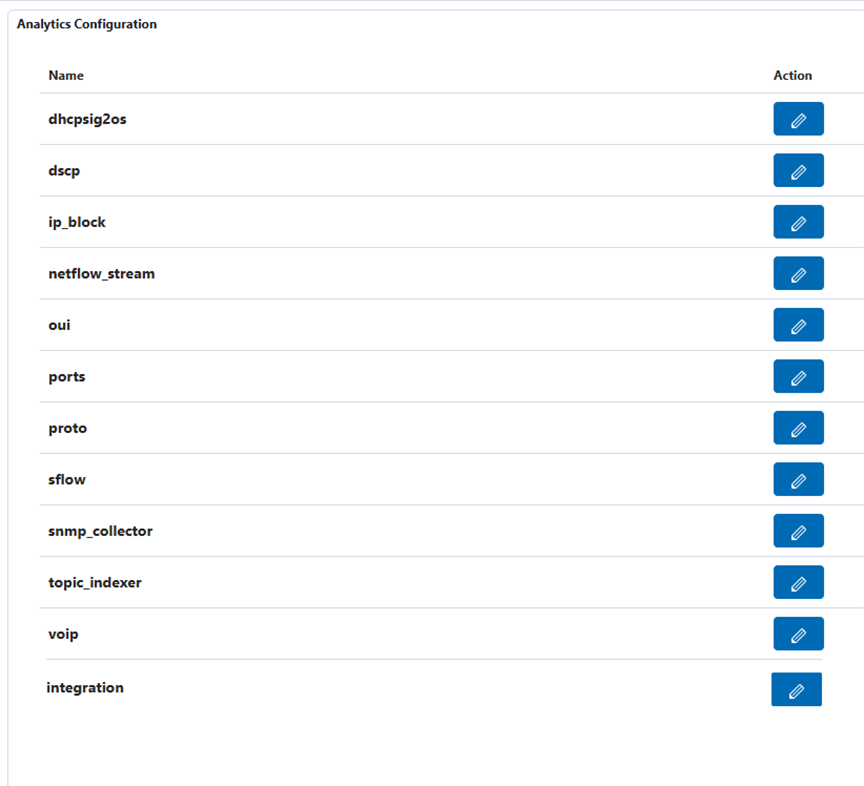
Analytics Configuration
- DHCP to OS
- IP Address Blocks
- NetFlow Stream
- OUI
- Ports
- Protocols
- SNMP Collector
- Topic Indexer
- Integration
DHCP to OS
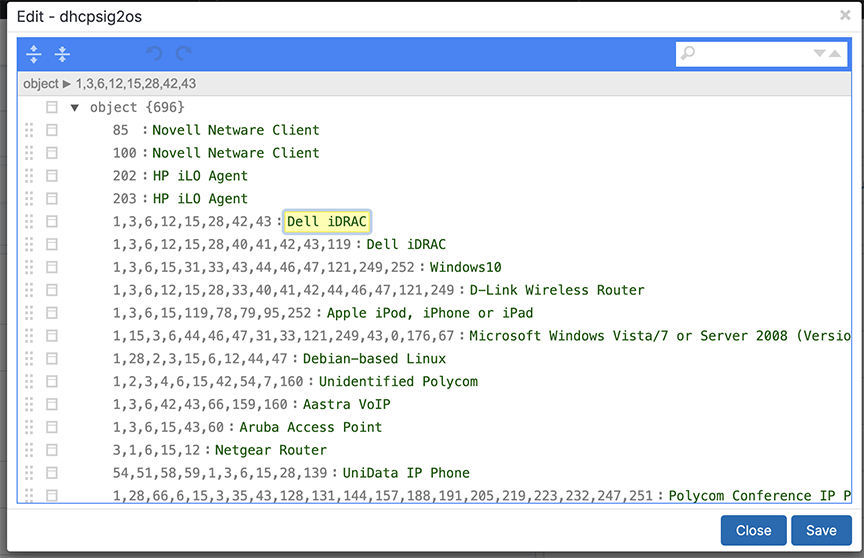
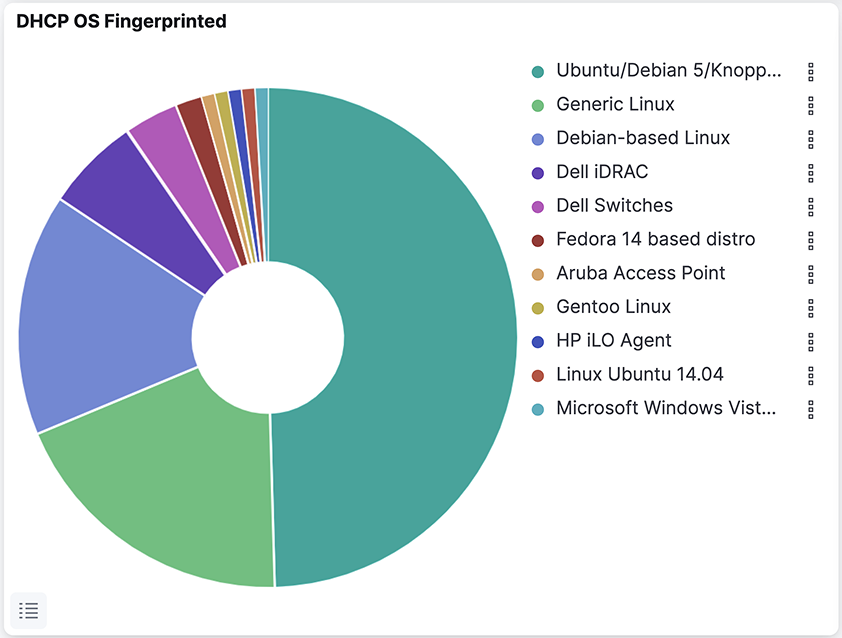
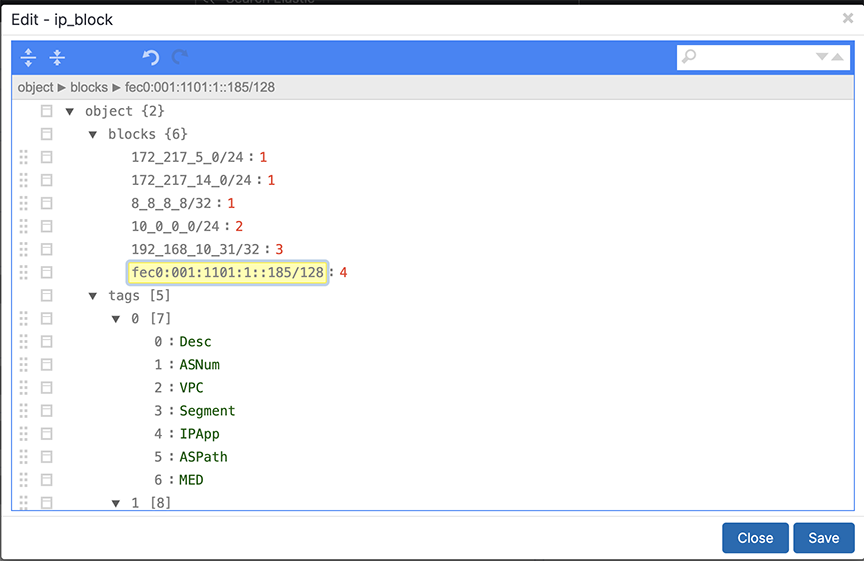
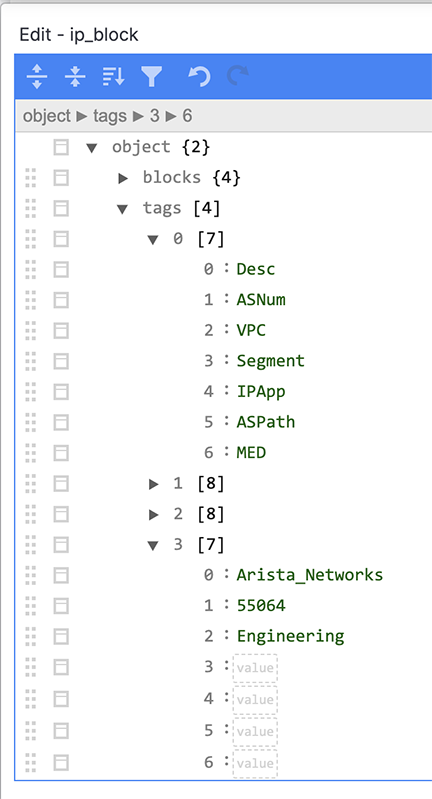
IP Address Blocks
Complete the following steps to assign a single IP address or a block of IP addresses to a tool, group, or organization.
NetFlow Stream
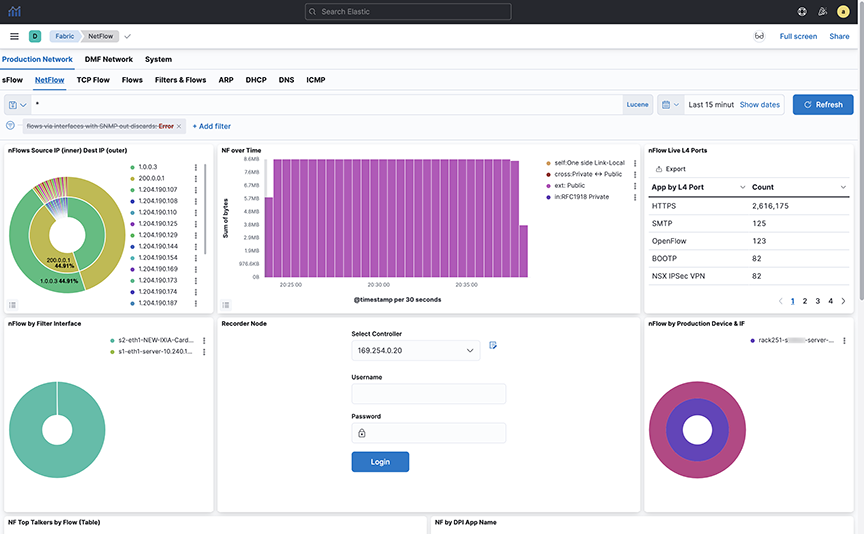
Arista Analytics may consolidate NetFlow records to improve performance.
The Analytics server/cluster consolidates flows received within two seconds into a single flow when the source and destination IP addresses are the same, or the source or destination L4 protocol port is the same.
For example, ten flows received by the Analytics server within 30 seconds are consolidated into a single flow if the source and destination IP addresses and destination port are the same for all the flows and only the source ports are different or if the source and destination IP addresses and source port are the same for all the flows and only the destination ports are different. This consolidated flow displays as a single row.
By default, the NetFlow Optimization is enabled for Netflow v5 and disabled for Netflow v9 and IPFIX. To allow the Netflow Optimization for Netflow v9 and IPFIX, refer to the Netflow v9/IPFIX Records section.
This consolidation improves Analytics NetFlow performance, allowing more efficient indexing and searching of NetFlow information.
NetFlow Traffic from Third-party Devices
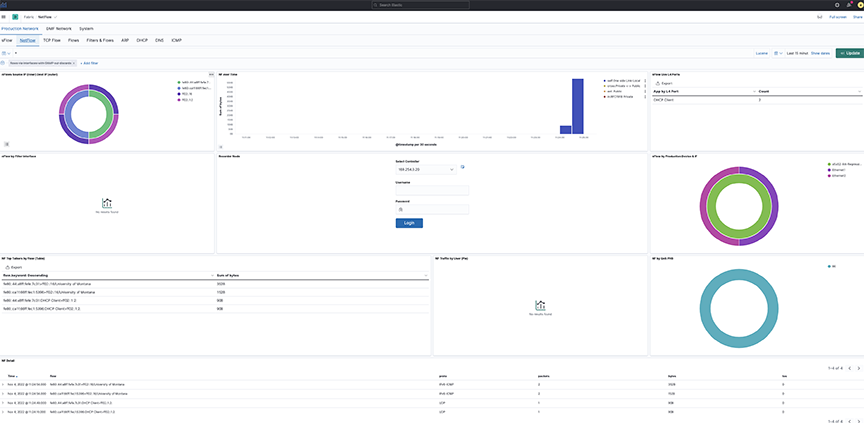
Arista Analytics can act as a NetFlow collector for third-party devices. In this case, Arista Analytics displays third-party device management IP addresses and the interface index (iFindex) of the interface for each NetFlow-enabled third-party device.
For example, the nFlow by Production Device & IF window shows that 10.8.39.198 is the third-party device that forwards NetFlow traffic. The iFindex of the interface on that device where NetFlow is enabled is 0, 2, 3, 4.
Arista Analytics then performs SNMP polling and displays the third-party device name and the actual interface name in the nFlow by Production Device & IF window.
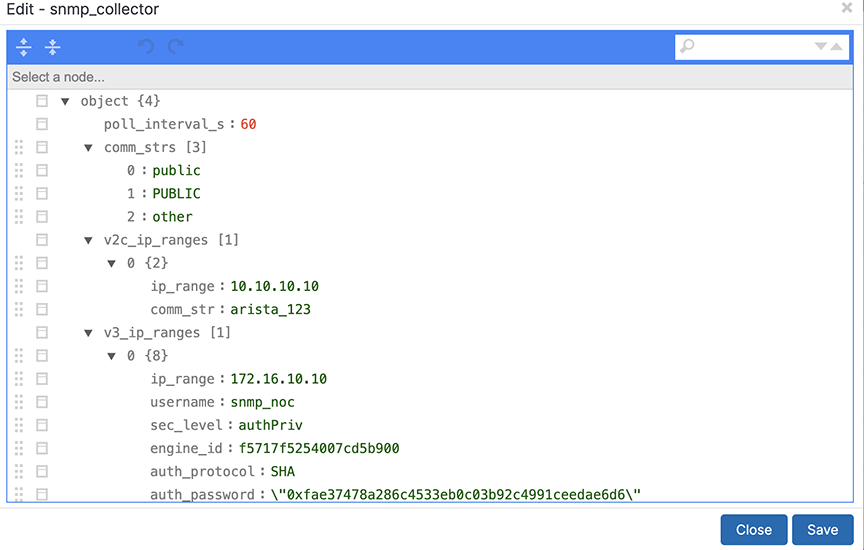
To perform the SNMP configuration, complete the following steps:
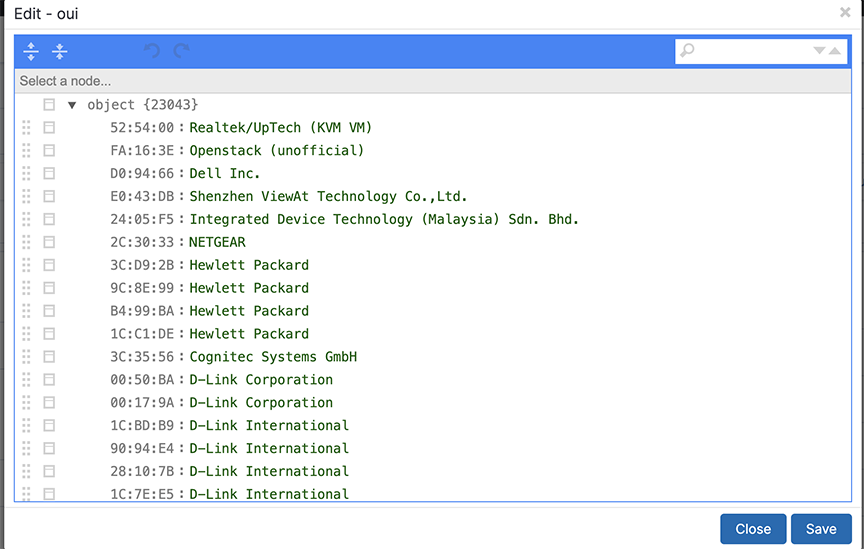
OUI
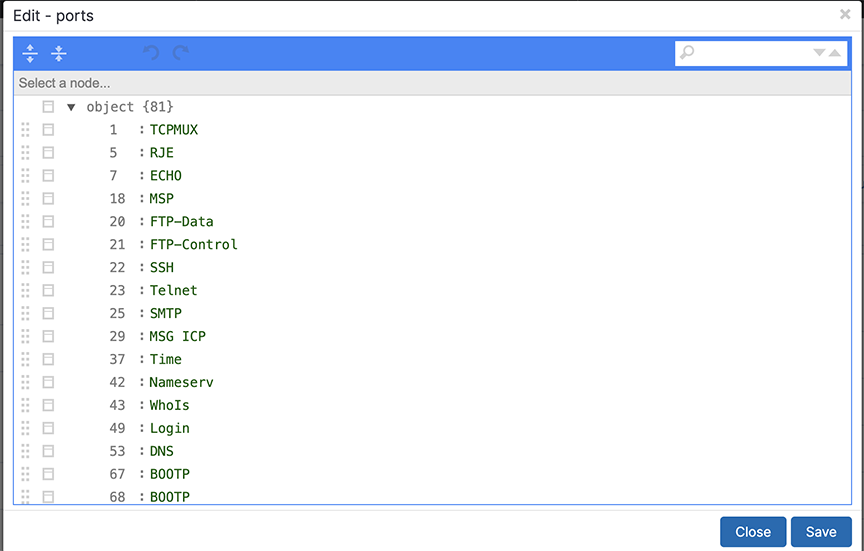
Ports
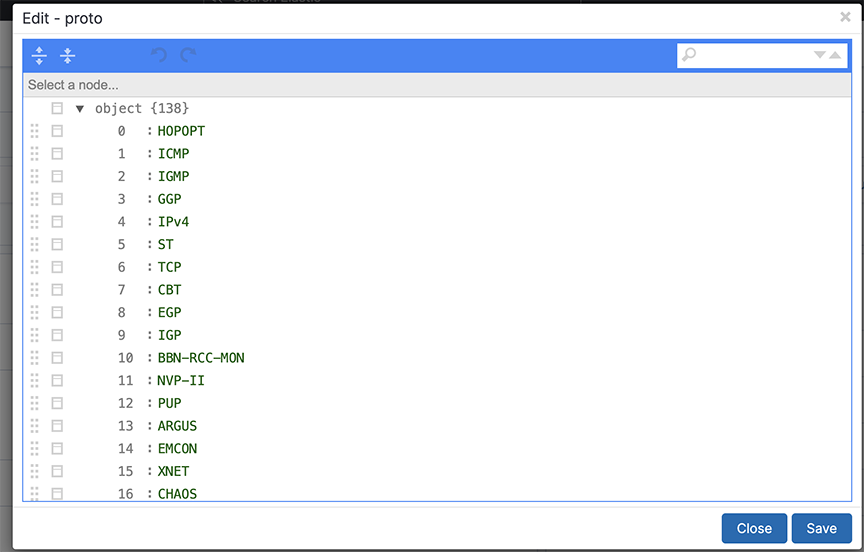
Protocols
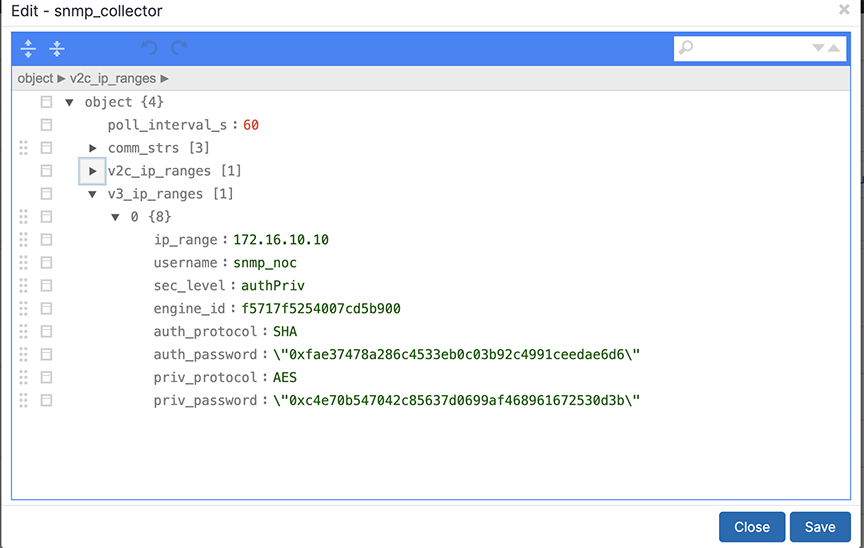
SNMP Collector
Topic Indexer
Description
The Analytics Node (AN) incorporates a feature known as topic_indexer, designed to facilitate data ingestion from customer Kafka topics and its subsequent storage into Elasticsearch indices.
This process involves modifying field names and specifying the supported timestamp field during the ingestion phase. The renaming of field names enables the creation of dashboards used to visualize data across multiple streams, including DNS and Netflow.
The resulting indices can then be leveraged as searchable indices within the Kibana user interface, providing customers with enhanced search capabilities.
- Configure a stream job using topic_indexer. Access the setting via the Kibana dashboard in the analytics node.
- Locate the topic_indexer configuration on the Fabric Dashboard: , as shown in the following screenshots.
-
Figure 16. Analytics > Fabric 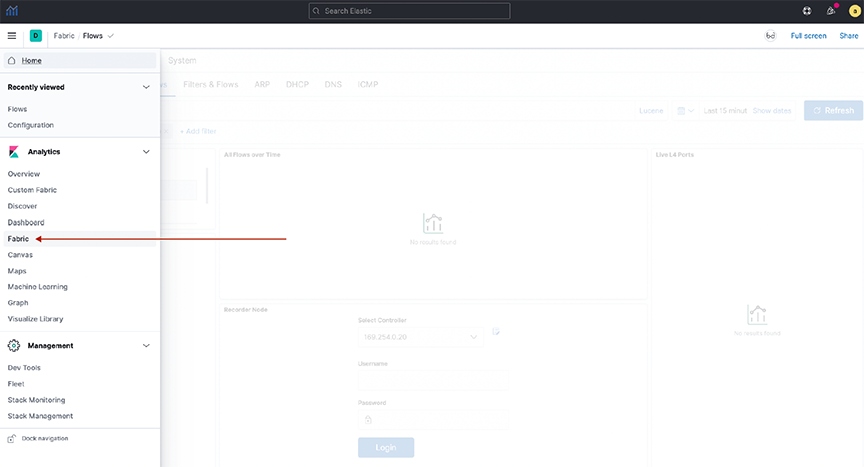
- Another view:
Figure 17. System > Analytics Configuration 
- The design section shows the configuration for a topic.
-
Figure 18. Node selection 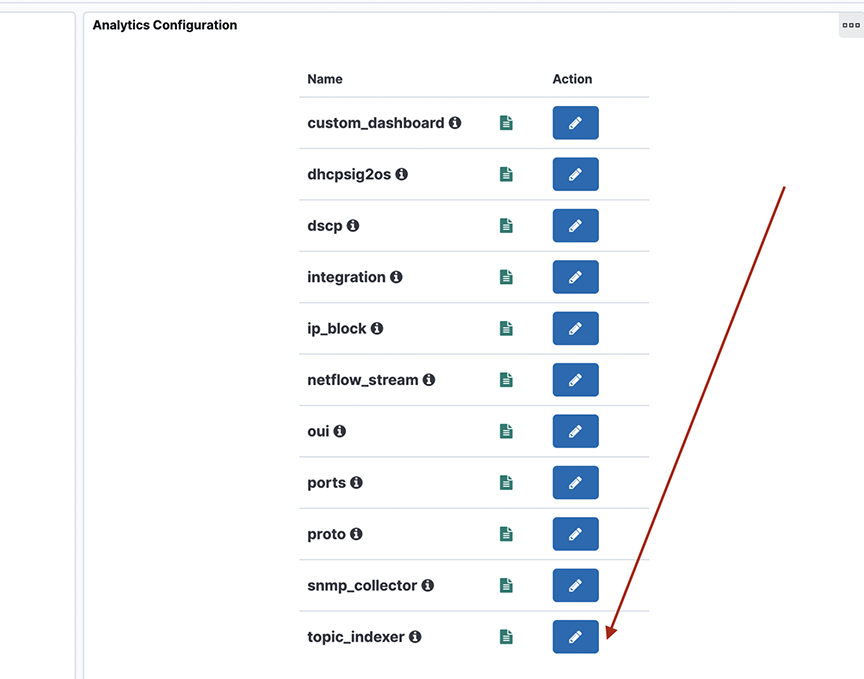
- To perform the topic_indexer configuration, select the page and open the Analytics Configuration panel:
Figure 19. System > Configuration 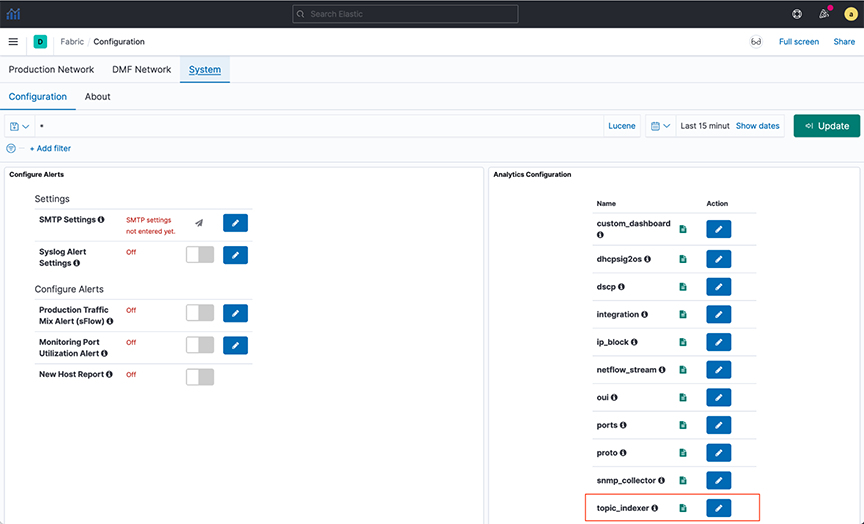
-
Figure 20. Topic_indexer configuration 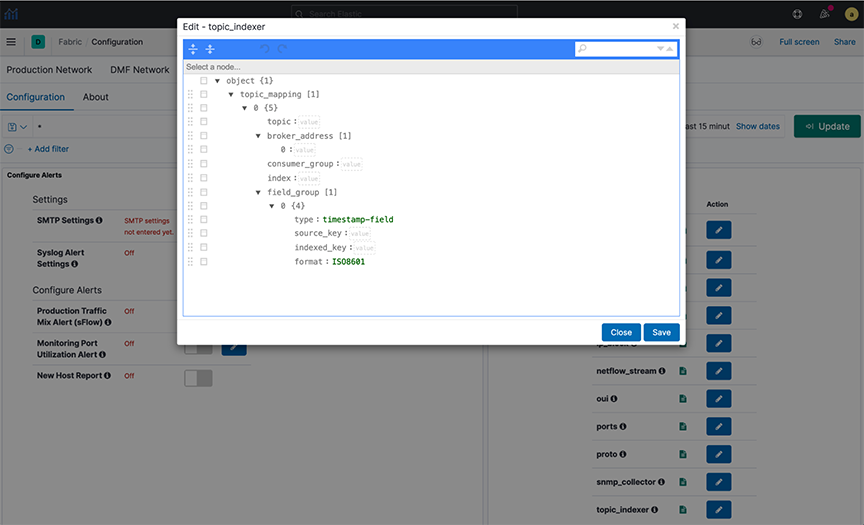
Field Details
- topic: Kafka topic name; type string and is a mandatory field.
- broker_address: Broker address(es), this is of type array; this will be of format [IPv4|hostname:Port number] and is a mandatory field.
- consumer_group: This is an optional field; however, there is always a consumer group if not specified explicitly in the configuration. It is topic_name + index_name. Setting this field is particularly useful when ingesting multi-partitioned topics from the client's end.
- index: A dedicated index name for the topic; type string. In Elastic Search (ES), it is created as topic_indexer_<index_name> and is a mandatory field.
- field_group: An optional JSON field mapping to specify any column rename/format transformations. It specifies the format for modifications to incoming data.
- type: To set the timestamp field as the type.
- source_key: The source field name in the incoming data.
- indexed_key: The destination field name inserted in the outgoing ES index.
The indexed_key may be a @timestamp field of an ES index. If you do not specify a @timestamp field, topic_indexer automatically picks the received time of the message as the @timestamp of that message.
- format: Data format for the field (ISO8601).
Standards and Requirements
Input fields naming convention:
- Kafka allows all ASCII Alphanumeric characters, periods, underscores, and hyphens to name the topic. Intopic_indexer, legal characters include: a-z0-9\\._\\-
- Note that the only restriction topic_indexer has is on capitalizing topic names. topic_indexer does not support case-sensitive names. By default, topic_indexer treats the name as a lowercase topic. Hence, topic names should be lowercase only.
- All numeric names are also invalid field text.
Examples of names:
- my-topic-name
- my_topic_name
- itlabs.mytopic.name
- topic123
- 123topic
- my-index-name
- myTopicName
- ITLabs-Website-Tracker
- 12435
- MY-Index-name
- A broker address in Kafka comprises two values: IPv4 address and Port Number.
- When entering the broker address, select the format IPv4:PORT.
Application Scenario
Querying Across DataStream using runtime-fields
POST <stream-name>/_rollover - Cross-index visualization - two data streams that need cross-querying:
-
Figure 21. Cross index visualization 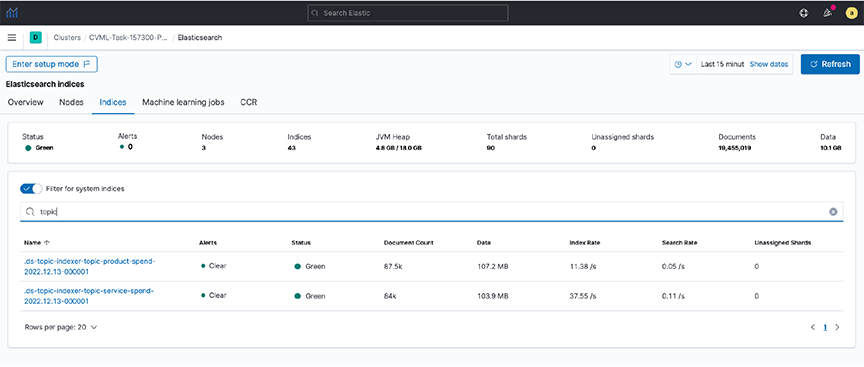
- Step 1. To view the documents in these indexes, create an index pattern (e.g., topic*spend) in Kibana.
- Step 2. View the data in the Discover dashboard.
Figure 22. Discover dashboard 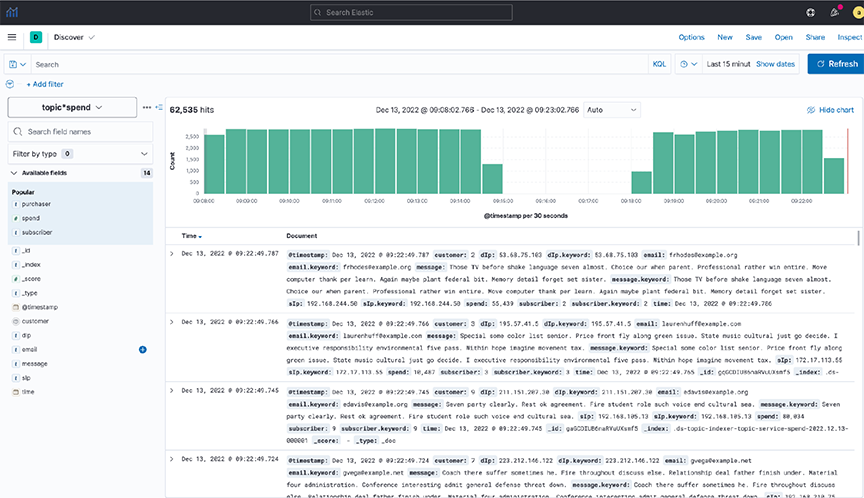
- Step 3. Create a common field (runtime field) between the two data streams by applying an API in Dev Tools.
Figure 23. Dev Tools 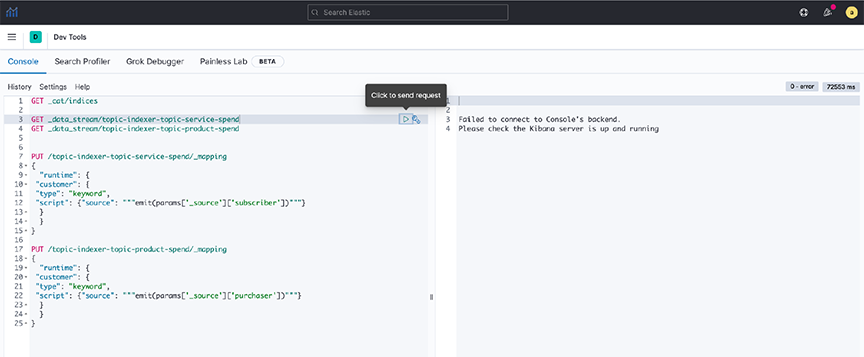 Note: Setting rollover policy on runtime fields can also be done in Dev Tools, as shown in the following examples:
POST /topic-indexer-service-spend/_rollover
POST /topic-indexer-product-spend/_rollover
Note: These changes are not persistent. Reapply is a must after any restart of AN. - Step 4. Finally, create a visualization using this common field, for example, Customer. The following illustration shows the Top 5 customers with the highest spending across products and services.
Figure 24. Visualization 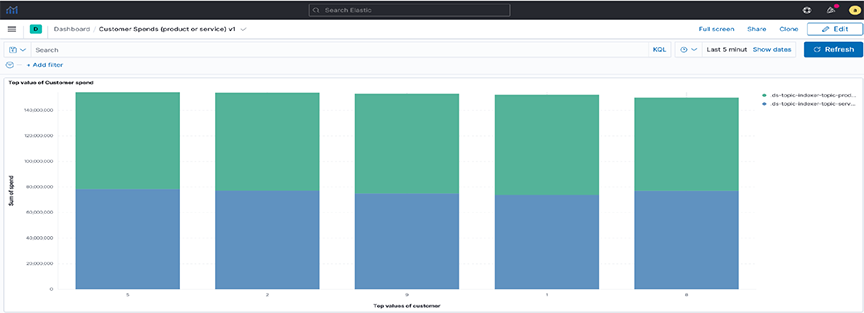
Syslog Messages
an> debug bash
admin@an$ cd /var/log/analytics/
admin@an:/var/log/analytics$
admin@an:/var/log/analytics$ ls -ls topic_indexer.log
67832 -rw-rwxr-- 1 remoteuser root 69453632 Apr 27 11:05 topic_indexer.log
Troubleshooting
- The Save button in the topic_indexer config is disabled.
When editing the configurations of topic_indexer in the Kibana User interface, default validations appear to ensure the correctness of the values entered in the fields. Specific standards and requirements are associated with filling in the configuration for topic_indexer, as stated in the earlier section. It may encounter validation errors when entering an invalid value in the configuration field as follows.
Figure 25. Validation errors 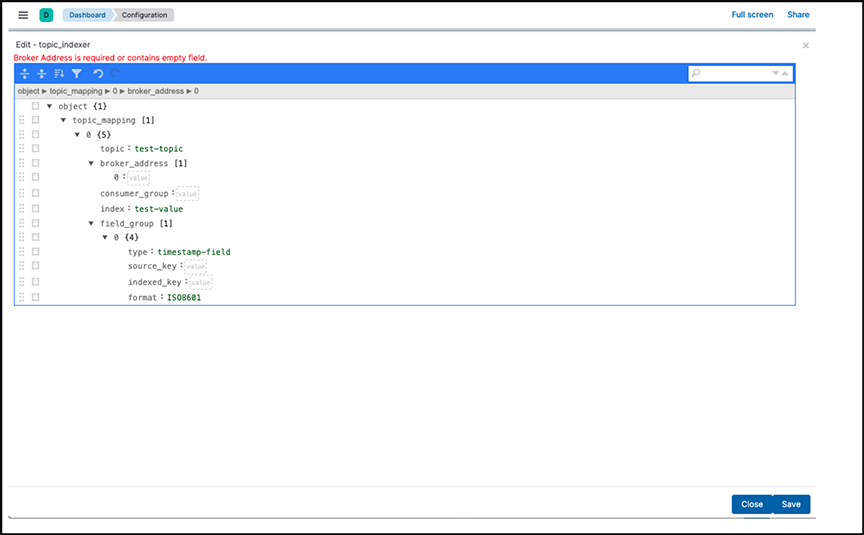
In such an event, the edited configuration will not save. Therefore, before saving the configuration, validate the fields and ensure there is no visible validation error in the topic_indexer configuration editor.
- The index for the topic_indexer has not been created.
After entering the correct fields in the topic_indexer configuration, the topic_indexer service will start to read the Kafka topic as documented in the configuration and load its data into the ElasticSearch index entered by the index field. The topic_indexer_ prefixes the name of the index.
There is a wait time of several minutes before the index is created and loaded with the data from the Kafka topic. In the event the index is not created, or there is no index shown with the name topic_indexer_<index_name> value, Arista Networks recommends using the following troubleshooting steps:- Check the configurations entered in the topic_indexer editor again to see whether the spellings of the topic name, broker address configuration, and index name are correct.
- Verify the broker address and the port for the Kafka topic are open on the firewall. Kafka has a concept of listeners and advertised.listeners . Validate if the advertised.listeners are entered correctly into the configuration. Review the following links for more details:
- If all the earlier steps are correct, check now for the logs in the Analytics Node for the topic_indexer.
Steps to reach the topic_indexer.log file in the AN node:
- Secure remote access into the AN using the command line: ssh <user>@<an-ip>
- Enter the password for the designated user.
- Enter the command debug bash to enter into debug mode.
- Use the sudo user role when entering the AN node, hence the sudo su command.
- topic_indexer logs reside in the following path: /var/log/analytics/topic_indexer.log
- Since this log file can be more extensive, you should use the tail command.
- Validate if the log file shows any visible errors related to the index not being created.
- Report any unknown issues.
- Data is not indexed as per the configuration.
- Data ingestion is paused.
When experiencing issues 3 or 4 (described earlier), use the topic_indexer log file to validate the problem.
- The index pattern for the topic_indexer is missing.
In the Kibana UI, it creates a default topic_indexer_* index pattern. If this pattern or a pattern to fetch the dedicated index for a topic is missing, create it using the Kibana UI as described in the following link:
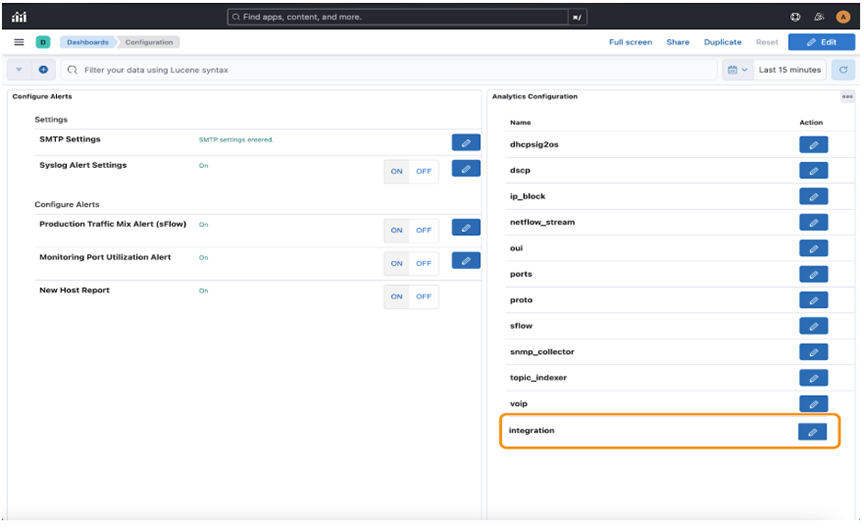
Integration
This section identifies specific applications or operating systems running on network hosts.
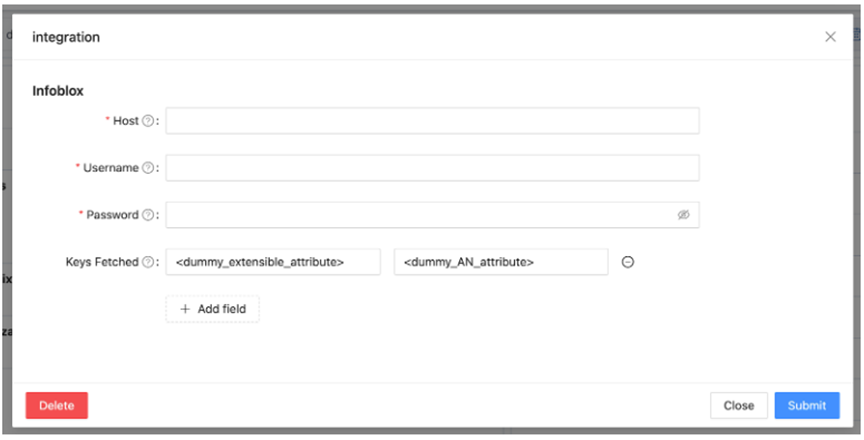
Integrating Analytics with Infoblox
Infoblox provides DNS and IPAM services that integrate with Arista Analytics. To use, associate a range of IP addresses in Infoblox with extensible attributes, then configure Analytics to map these attributes for the associated IP addresses. The attributes assigned in Infoblox appear in place of the IP addresses in Analytics visualizations.
Configuring Infoblox for Integration
Troubleshooting
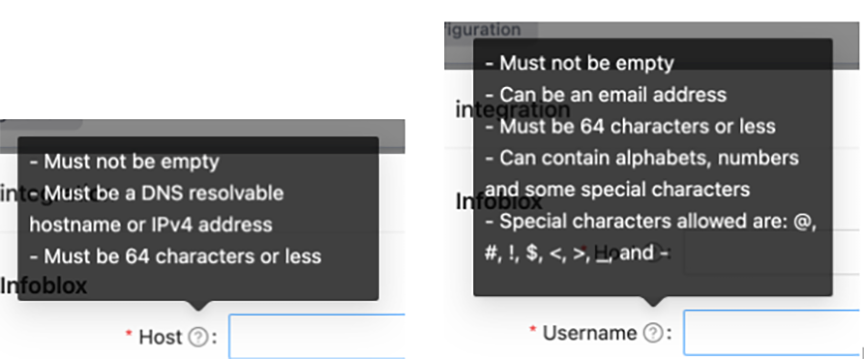
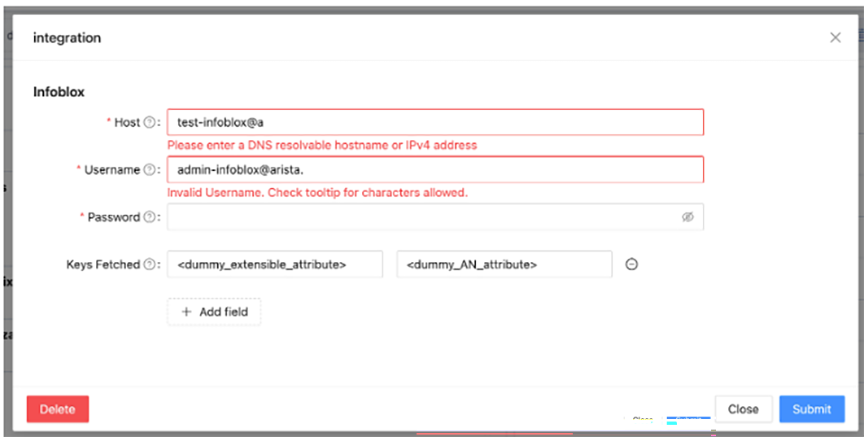
When the flow records augmented with Infoblox extensible attributes are missing these attributes, verify that the Infoblox credentials you provided in the integration configuration are correct. After confirming the credentials and the relevant flow records are still missing the Infoblox extensible attributes, generate a support bundle and contact Arista Networks TAC.
Status
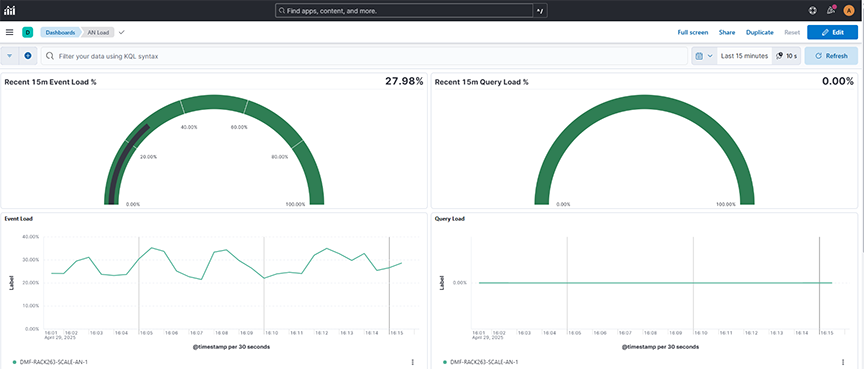
Selecting System → Status displays the status of the data transmitted on the Analytic Node.
- Recent 15m Event Load %: Displays the analytics node's recent event processing load percentage over a selected time range, helping monitor system performance.
- Recent 15m Query Load%: Displays the analytics node's recent query processing load percentage over a selected time range, helping monitor system performance
- Event Load: Displays the event processing load across analytics nodes over a selected time range, helping monitor node performance and traffic handling capacity.
- Query Load: Displays the query processing load across analytics nodes over a selected time range, helping monitor query activity and node utilization.
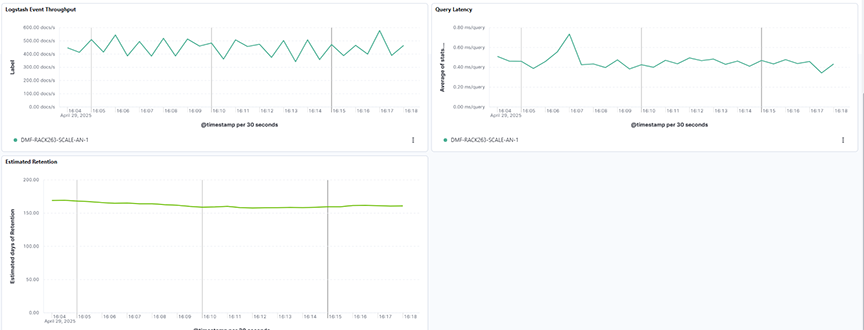
- Logstash Event Throughput: Displays the volume of events processed by Logstash nodes over a selected time range, helping monitor analytics node ingestion performance.
- Query Latency: Displays the average query response time across analytics nodes over a selected time range, helping monitor query performance and system responsiveness.
- Estimated Retention: Displays the estimated retention capacity of the analytics nodes over a selected time range, helping monitor storage trends and plan for data management.
About
Selecting System → About displays the information about the Analytic Node.


