This appendix provides information about composing Stenographer queries and submitting them through REST API.
Stenographer Query Syntax
The DANZ Monitoring Fabric (DMF) Recorder Node accepts Stenographer queries using a syntax based on the Berkeley Packet Filter (BPF) syntax. When entering a malformed BPF string, the recorder node will respond with an error. The entire BPF grammar is not supported, but query strings can be composed using the predicates in the following table.
match the specified VLAN tag (outer, inner, or inner inner)
outer vlan value
VLAN ID
match the specified outer VLAN tag
inner vlan value
VLAN ID
match the specified inner VLAN tag (or middle tag of triple-tagged packets)
inner vlan value
VLAN ID
match the specified innermost VLAN tag of triple-tagged packets
src mac value
MAC address
match the specified MAC address in typical colon-delimited form (e.g. 11:22:33:44:55)
dst mac value
MAC address
match the specified MAC address in typical colon-delimited form (e.g. 11:22:33:44:55)
mpls value
MPLS label
match the specified MPLS label
src host value
IPv4/v6 address
match the specified source address exactly
dst host value
IPv4/v6 address
match the specified destination address exactly
src net value
IPv4/v6 address
match the specified source address with an optional CIDR mask. All octets of address must be specified, e.g. good → 1.2.3.0/24, bad → 1.2.3/24
src net value mask value
IPv4/v6 address
match the specified source address with masked with the specified address
dst net value
IPv4/v6 address
match the specified destination address with an optional CIDR mask. All octets of address must be specified, e.g. good → 1.2.3.0/24, bad → 1.2.3/24
dst net value mask value
IPv4/v6 address
match the specified destination address with masked with the specified address
ip proto value
protocol number
match the specified IP protocol number
icmp
match ICMP packets (shortcut for “ip proto 1”)
tcp
match TCP packets (shortcut for “ip proto 6”)
udp
match UDP packets (shortcut for “ip proto 17”)
src port value
transport port number
match the specified transport port number
dst port value
transport port number
match the specified transport port number
cid value
Community ID
match the provided community ID in standard version:base-64 encoded form (e.g. 1:hO+sN4H+MG5MY/8hIrXPqc4ZQz0=)
policy value
DMF policy name
match the forwarding VLAN(s) of the specified DMF policy. Only supported through the DMF Controller. Not supported when using a Recorder Node REST API directly.
filter-interface value
DMF filter interface name
match the forwarding VLAN of the specified filter interface. Only supported through the DMF Controller. Not supported when using a Recorder Node REST API directly.
event value
Recorder Node event name
match the time range of the specified event. Only supported through the DMF Controller. Not sup- ported when using a Recorder Node REST API directly.
and
logical “and”
&&
logical “and”
or
logical “or”
||
logical “or”
(
begin grouping
)
end grouping
Example Stenographer Queries
Note:Arista Networks recommends always using a specific time range in each query.
After two hours ago but before one hour ago, search for all packets to or from Google DNS (8.8.8.8).
(after 2h ago and before 1h ago) and (src host 8.8.8.8 or dst host 8.8.8.8)
In the last twenty-four hours, search for all SSH (TCP port 22) packets destined for IP 10.4.100.200.
Note: This will not match any SSH packets from 10.4.100.200.
after 24h ago and dst host 10.4.100.200 and tcp and src port 22
Within the last five minutes, search for all packets to or from 10.1.1.100. And, in the five minutes before that, search for all packets to or from 10.1.100.101.
(after 5m ago and (src host 10.1.1.100 or dst host 10.1.1.100)) or (after 10m ago and before 5m ago
and (src host 10.1.1.101 or dst host 10.1.1.101))
Within the timespan of event abc and within the last hour, search for all SSH (TCP port 22) packets destined for IP 1.2.3.4.
(event abc or after 1h ago) and dst host 1.2.3.4 and tcp and dst port 22
Within the timespan defined by the intersection of events abc and def, search for all packets sent from any IP in subnet 1.2.3.0/24 seen on filter interface xyz.
(event abc and event def) and filter-interface xyz and src net 1.2.3.0/24
.. note::
To use the filter-interface predicate, the DMF Controller must be in the push-per-filter Auto
VLAN mode.
Within the last five minutes, search for all packets sent from IP 1.2.3.4 to the DANZ Monitoring Fabric (DMF) Recorder Node using DMF policy abc.
after 5m ago and policy abc and src host 1.2.3.4
.. note::
To use the policy predicate the DMF Controller must be in the push-per-policy or push-per-
filter Auto VLAN mode. When in push-per-policy auto-vlan-mode, the policy's forwarding tag will
be queried. When in push-per-filter mode, the forwarding tags of the filter interfaces used in
the policy are queried.
Within the last five minutes, search for all packets with any VLAN tag 100.
after 5m ago and vlan 100
Within the last five minutes, search for all packets with an outer VLAN tag 100.
after 5m ago and outer vlan 100
Within the last five minutes, search for all packets with an inner (or middle) VLAN tag 100.
after 5m ago and inner vlan 100
Within the last five minutes, search for all triple-tagged packets with innermost VLAN tag 100.
after 5m ago and inner inner vlan 100
Within the last five minutes, search for packets belonging to a flow with community ID of 1:hO+sN4H+MG5MY/8hIrXPqc4ZQz0=.
after 5m ago and cid 1:hO+sN4H+MG5MY/8hIrXPqc4ZQz0=
This matches packets in each direction of the flow, if applicable.
Within the last five minutes, search for all L2 broadcast packets originating from MAC address 11:22:33:44:55:66.
after 5m ago and src mac 11:22:33:44:55:66 and dst mac ff:ff:ff:ff:ff:ff
This chapter describes advanced features and use cases for DANZ Monitoring Fabric (DMF) policies.
Advanced Match Rules
Optional parameters of a match rule (such as src-ip, dst-ip, src-port, dst-port) must be listed in a specific order. To determine the permitted order for optional keywords, use the tab key to display completion options. Keywords in a match rule not entered in the correct order results in the following message:
Error: Unexpected additional arguments ...
Match Fields and Criteria
The following summarizes the different match criteria available:
src-ip, dst-ip, src-mac, and dst-mac are maskable. If the mask for src-ip, dst-ip, src-mac, or dst-mac is not specified, it is assumed to be an exact match.
For src-ip and dst-ip, specify the mask in either CIDR notation (for example, /24) or dotted-decimal notation (255.255.255.0).
For src-ip and dst-ip, the mask must be contiguous. For example, a mask of 255.0.0.255 or 0.0.255.255 is not supported.
For TCP, the tcp-flags option allows a match on the following TCP flags: URG, ACK, PSH, RST, SYN, and FIN.
The following match combinations are not allowed in the same match rule in the same DMF policy.
src-ip-range and dst-ip-range
src-ip address group and dst-ip address group
ip-range and ip address group
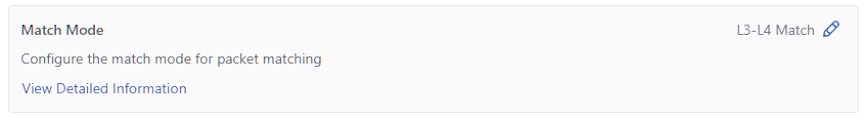
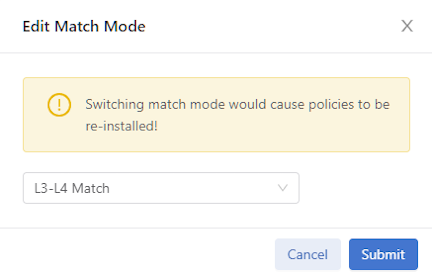
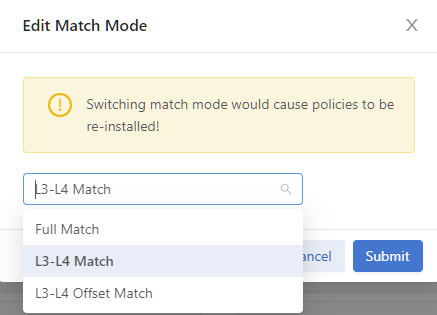
DANZ Monitoring Fabric (DMF) supports matching on user-defined L3/L4 offsets instead of matching on these criteria. However, it is not possible to use both matching packet methods in the same DMF. Switching between these match modes may cause policies defined under the previous mode to fail.
Apply match rules to the following fields in the packet header:
dscp-value Match on DSCP value. Value range is 0..63
dst-ip Match dst ip
dst-port Match dst port
is-fragment Match if the packet is IP fragmented
is-not-fragment Match if the packet is not IP fragmented
l3-offset Match on l3 offset
l4-offset Match on l4 offset
range-dst-ip Match dst-ip range
range-dst-port Match dst port ramge
range-src-ip Match src-ip range
range-src-port Match src port range
src-ip Match src ip
src-port Match src port
untagged Untagged (no vlan tag)
vlan-id Match vlan-id
vlan-id-range Match vlan-id range
<ip-proto> IP Protocol
Warning: Matching on untagged packets cannot be applied to DMF policies when in push-per-policy mode.
DMF uses a logical AND if a policy match rule has multiple fields. For example, the following rule matches if the packet has src-ip1.1.1.1 AND dst-ip2.2.2.2:
1 match ip src-ip 1.1.1.1 255.255.255.255 dst-ip 2.2.2.2 255.255.255.255
DMF uses a logical OR when configuring two different match rules. For example, the following matches if the packet has src-ip1.1.1.1 OR dst-ip2.2.2.2:
1 match ip src-ip 1.1.1.1 255.255.255.255
2 match ip dst-ip 2.2.2.2 255.255.255.255
A match rule with the any keyword matches all traffic entering the filter interfaces in a policy:
controller-1(config)# policy dmf-policy-1
controller-1(config-policy)# 10 match any
The following commands match on the TCP SYN and SYN ACK flags:
1 match tcp tcp-flags 2 2
2 match tcp tcp-flags 18 18
Note: In the DMF GUI, when configuring a match on TCP flags, the current GUI workflow also sets the hex value of the TCP flags for the mask attribute. When configuring a different value for the tcp-flags and tcp-flags-mask attributes in a rule via the DMF CLI, editing the rule in the GUI will override the tcp-flags-mask.
Match-except Rules
The following summarizes match-except rules with examples which allow a policy to permit packets that meet the match criteria, except packets that match the value specified using the except command.
Match-except only supports IPv4 source-IP and IPv4 destination-IP match fields.
Example - Permit src-ip network, except ip-address:
1 match ip src-ip 172.16.0.0/16 except-src-ip 172.16.0.1
Example - Permit dst-ip network, except subnet
1 match ip dst-ip 172.16.0.0/16 except-dst-ip 172.16.128.0/17
In a rule, the except condition can only be used with either src-ip or dst-ip, but not with src-ip and dst-ip together.
Example - Except being used with src-ip:
1 match icmp src-ip 172.16.0.0/16 except-src-ip 172.16.0.1 dst-ip 172.16.0.0/16
Example - Except being used with dst-ip:
1 match icmp src-ip 224.248.0.0/24 dst-ip 172.16.0.0/16 except-dst-ip 172.16.0.0/18
Except-src-ip or except-dst-ip can only be used after a match for src-ip or dst-ip, respectively.
Example - Incorrect match rule:
1 match icmp except-src-ip 192.168.1.10
Example - Correct match rule:
1 match icmp src-ip 192.168.1.0/24 except-src-ip 192.168.1.10
In a match rule, only one IP address, or one subnet (range of IP addresses) can be used with the except command.
Example - Deny a subnet:
1 match ip dst-ip 172.16.0.0/16 except-dst-ip 172.16.0.0/18
Example - Deny an IP Address:
1 match ip dst-ip 172.16.0.0/16 except-dst-ip 172.16.0.1
Matching with IPv6 Addresses
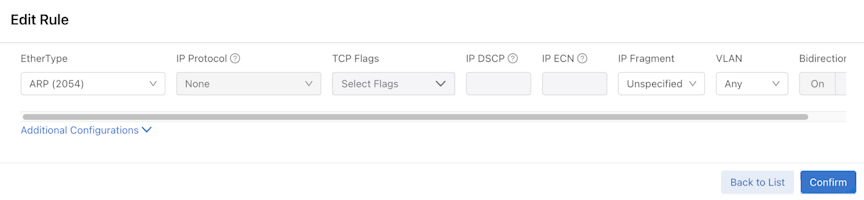
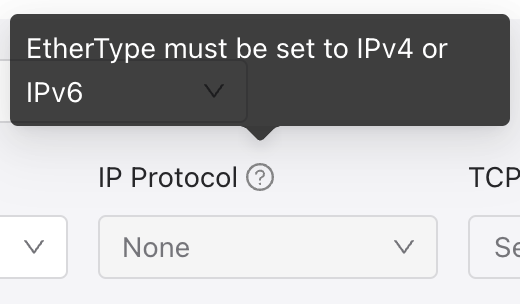
The value of the EtherType field determines whether the src-ip field to match is IPv4 or IPv6. The DANZ Monitoring Fabric (DMF) Controller displays an error if there is a mismatch between the EtherType and the IP address format.
DMF supports IPv6 address/mask matching, either on src-IP or dst-IP. Optionally, UDP/TCP ports can be used with the IPv6 address/mask match. Specify an address/mask or a group; DMF does not support ranges for IPv6 addresses.
Note: Match rules containing both MAC addresses and IPv6 addresses are not accepted and cause a validation error.
The preferred IPv6 address representation is as follows: xxxx:xxxx:xxxx:xxxx:xxxx:xxxx:xxxx:xxxx, where each x is a hexadecimal digit representing 4 bits.
IPv6 addresses range from 0000:0000:0000:0000:0000:0000:0000:0000 to ffff:ffff:ffff:ffff:ffff:ffff:ffff.
In addition to this preferred format, IPv6 addresses may be specified in two other shortened formats:
Omit Leading Zeros: Specify IPv6 addresses by omitting leading zeros. For example, write IPv6 address 1050:0000:0000:0000:0005:0600:300c:326b as 1050:0:0:0:5:600:300c:326b.
Double Colon: Specify IPv6 addresses using double colons (::) instead of a series of zeros. For example, write IPv6 address ff06:0:0:0:0:0:0:c3 as ff06::c3. Double colons may be used only once in an IP address.
DMF does not support the IPv4 address embedded in the IPv6 address format. For example, neither 0:0:0:0:0:0:101.45.75.219 nor ::101.45.75.219 can be used.
Both IPv4 and IPv6 masks must be in CIDR format. For example, FFFF:FFFF:FFFF:FFFF:0:0:0:0 is valid in DMF, but FFFF:0:0:FFFF:FFFF:0:0:0:0 is not a valid mask.
Both the colon-separated hexadecimal representation and the CIDR-style notation mask format are supported. The following example illustrates the correct format for IPv6 addresses and subnet masks:
controller-1(config)# policy dmf-ipv6-policy
controller-1(config-policy)# 10 match ip6 src-ip 2001::0 ffff:ffff:ffff:ffff:0:0:0:0
controller-1(config-policy)# 11 match ip6 dst-ip 2001:db8:122:344::/64
controller-1(config-policy)# filter-interface all
controller-1(config-policy)# action drop
Port and VLAN Range Matches
DANZ Monitoring Fabric (DMF) policy supports matching on source and destination port ranges with optimized hardware resource utilization. DMF uses efficient masking algorithms to minimize the number of flow entries in hardware for each VLAN range. For example, a VLAN range of 12-99 uses only five flows in hardware.
Note: Use the untagged keyword to match traffic without a VLAN tag.
Provide the IP protocol information when using source and destination port ranges, fully supported for IPv4 and IPv6 for TCP and UDP. These keywords have the following options:
range-dst-ip: Match dst-ip range.
range-dst-port: Match dst port range.
range-src-ip: Match src-ip range.
range-src-port: Match src port range.
Specify either src-port-range or dst-port-range or both in each match rule, as illustrated in the following example:
controller-1(config)# policy ip-port-range-policy
controller-1(config-policy)# 10 match tcp range-src-port 10 100
controller-1(config-policy)# 15 match udp range-dst-port 300 400
controller-1(config-policy)# 20 match tcp range-src-port 10 2000 range-dst-port 400 800
controller-1(config-policy)# 30 match tcp6 range-src-port 8 20
controller-1(config-policy)# 40 match tcp6 range-src-ip 1:2:3:4::/64 range-src-port 10 300
controller-1(config-policy)# filter-interface all
controller-1(config-policy)# delivery-interface all
controller-1(config-policy)# action forward
DMF policy supports matches for the VLAN ID range with optimized hardware resource utilization. Combining a VLAN ID range with a source or destination port range is supported, but not using all three ranges in a single match. The following example illustrates a valid use of the VLAN ID range option:
controller-1(config)# policy vlan-range-policy
controller-1(config-policy)# 10 match mac vlan-id-range 30 400
controller-1(config-policy)# 20 match full ether-type ip protocol 6 vlan-id-range 1000 3000 srcip 1.
1.1.1 255.255.255.255 src-port-range 100 500
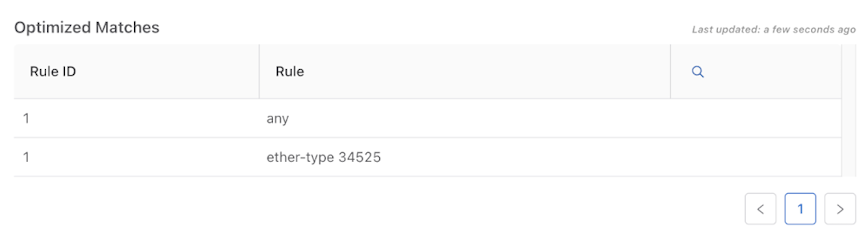
To determine the number of flow entries required for a range, use the optimized-match option, as shown in the following example:
Up to eight two-byte user-defined offsets are allowed on each switch. To view the currently defined offsets, select Monitoring > User Defined Offsets.
Note: The DANZ Monitoring Fabric (DMF) Controller must be in push-per-policy mode for a user-defined filter to work accurately.
Selecting the User Defined Offsets option when the L3-L4 Offset Match switching mode is not enabled, the system displays a message to enable the correct match mode.
After enabling the L3-L4 Offset Match mode and selecting Monitoring > User Defined Offsets, DMF displays a table listing the currently defined offsets.
Note:Matching on a user-defined offset is not recommended when forwarding traffic to a tunnel, because some packets may be dropped.
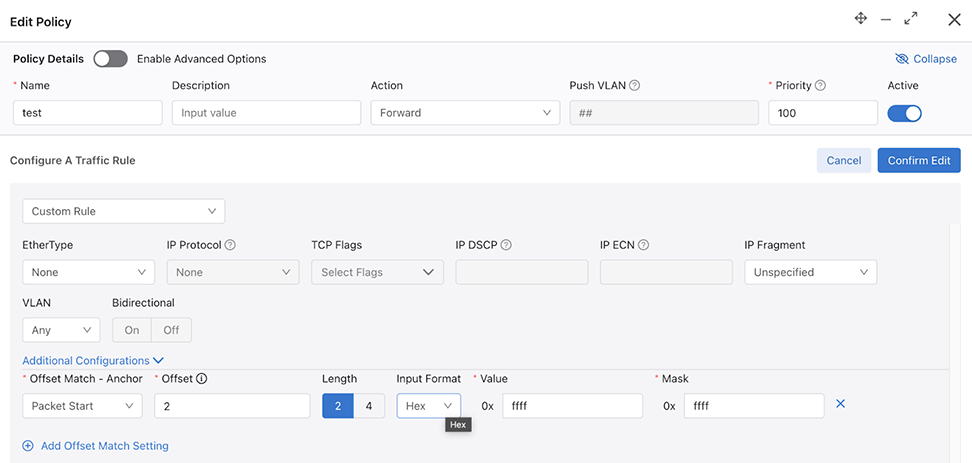
Each offset match has the following four components:
Anchor: Specified from where the user can define the matching criteria. There are three options: a) L3-start: Start of layer 3 header. b) L4-start: Start of layer 4 header. c) Packet-start: Start of the packet from layer 2 header.
Offset: The number of bytes from the specified anchor.
Length: The number of matching bytes, either 2 or 4 bytes.
Value: The matching value of the specified length in hexadecimal, decimal, or IPv4 format.
Mask: The value that is ANDed with the match value.
Note: DMF allows users to combine up to four 4-byte user-defined offsets or up to eight 2-byte offsets to match up to sixteen bytes in the same match condition. In this case, the multiple offset matching conditions in a single match statement will be considered ANDed. For example, to match on eight bytes, in a single match condition, define two user-defined offsets and configure two rules in an AND fashion so that the first rule matches on the first four bytes and the second rule matches on the remaining four bytes.
Configure each switch with a maximum of eight different offsets matching two bytes each, used in a single policy or any combination in different policies. In the example below, the policy matches on a value of 0x00001000 at offset 40 from the start of the L3-header and a value of 0x00002000 at offset 64 from the start of the L4-header.
controller-1(config-policy)# 1 match udp dst-port 2152 l3-offset 40 length 4 value 0x00001000 mask
0xffffffff l4-offset 64 length 4 value 0x00002000 mask 0xffffffff
Enter the show user-defined-offset command to display the values configured in the user-defined-offset table.
DMF supports user-defined filtering on Trident 3 switches. The following are the UDF limitations on a Trident 3 switch in comparison to a non-Trident 3 switch:
Table 1. UDF Limitations on a Trident 3 Switch
UDF Features
Non-Trident SWL Switch
Trident 3 SWL Switch
EOS Switches
Total UDF Length
16 bytes
12 bytes
12 bytes
Minimum Chunk Size
2 bytes
2 bytes
2 bytes
Packet Start (Layer 2 Anchor)
8 offsets
2 offsets
6 offsets
Layer 3 Anchor
8 offsets
6 offsets
6 offsets
Layer 4 Anchor
8 offsets
6 offsets
6 offsets
Layer 2 Offset Range
0 - 126 bytes
0 - 62 bytes
0 - 126 bytes
Layer 3 Offset Range
0 - 114 bytes
0 - 112 bytes
0 - 114 bytes
Layer 4 Offset Range
0 - 96 bytes
0 - 112 bytes
0 - 96 bytes
Note: Please refer to the DMF Hardware Compatibility List for a complete list of supported switches and their corresponding Network ASIC types.
Filter and Delivery Role with MAC Loopback for a Two-stage Policy
Use the Filter and Delivery role with a MAC (software) loopback to support monitoring as a service. This option uses a two-stage policy to replicate the incoming feed from one or more filter interfaces and send it to multiple intermediate interfaces (one per end customer or organization).
Define policies on the intermediate interface for forwarding to customer-specific tools. These intermediate interfaces must also be assigned the Filter and Delivery role enabled with the MAC loopback option. This method eliminates the need for a physical loopback cable and a second interface, simplifying monitoring deployment as a service.
When multiple user-defined policies with overlapping rules select traffic from the same filter interfaces for forwarding to different delivery interfaces, overlapping policies are automatically generated to replicate the requisite traffic to the delivery interfaces. The number of overlapping policies increases exponentially with the number of user-defined policies.
Switch hardware limits limit the total number of policies in the fabric. Using a Filter and Delivery role with a MAC loopback can also help eliminate scale and operational issues seen with overlapping policies.
To configure an interface with the Filter and Delivery role and enable the MAC (software) loopback option, use the loopback-mode mac command to assign an unused interface as a loopback. This command enables the physical interface without requiring a physical connection to the interface. Use a software loopback interface for copying traffic in any scenario where a physical loopback is required.
The user can also assign the Filter and Delivery role to a software loopback interface, which allows the use of a single interface for copying traffic to multiple destination interfaces. When assigning this role to an interface in loopback mode, use the interface as a delivery interface in relation to the original filter interface and as a filter interface in relation to the final destination interface.
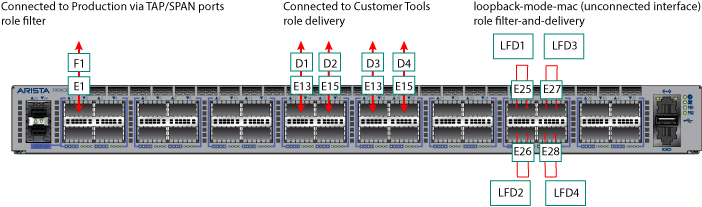
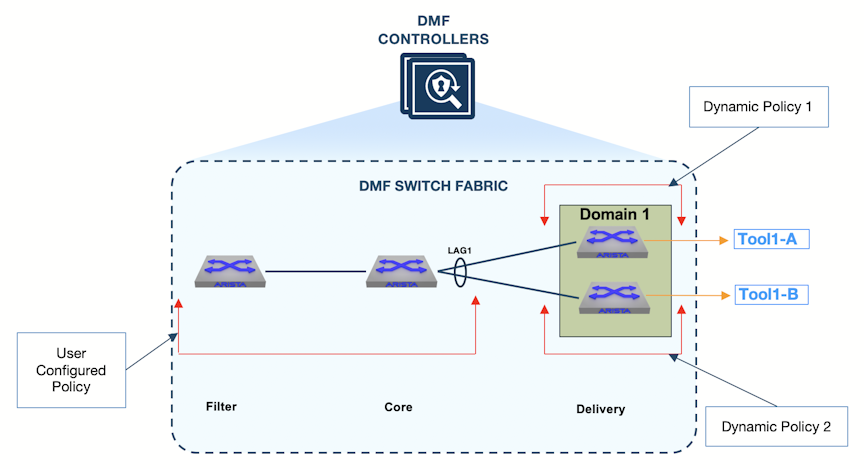
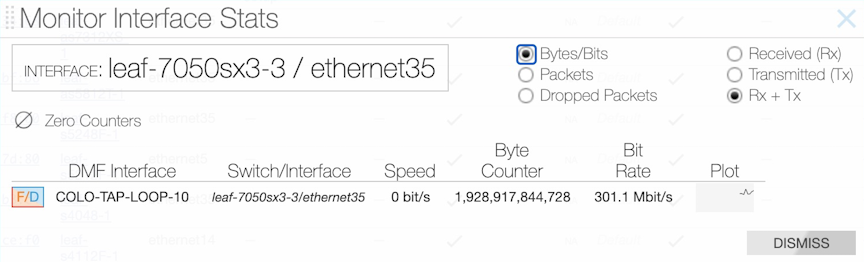
The following figure illustrates the physical configuration for a switch that uses four software loopback interfaces to copy traffic from a single filter interface to four different tools:
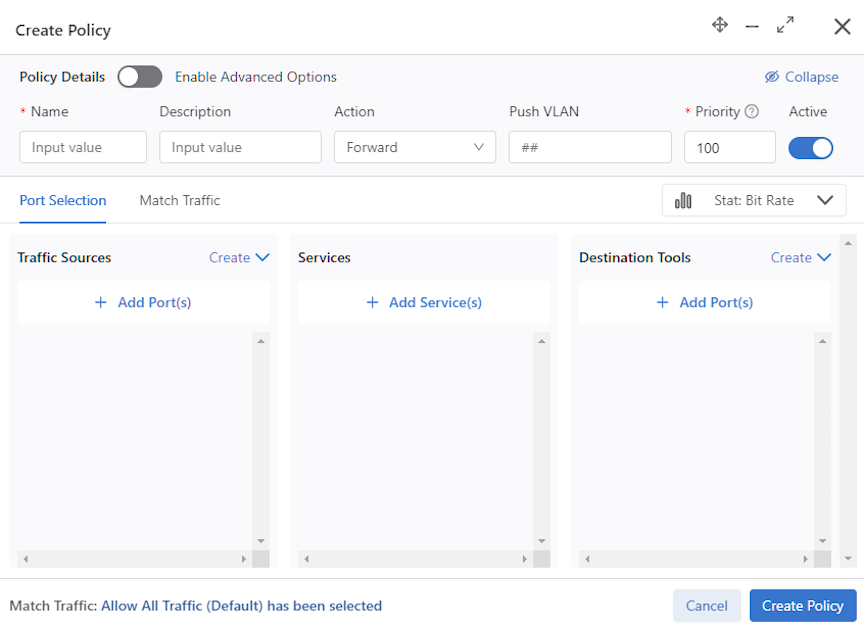
Figure 1. Using Software Loopback Interfaces to Avoid Overlapping Policies
Use this configuration to copy different types of traffic from a single filter interface (F1) to four delivery interfaces (D1 to D4). Assign the Filter and Delivery role to the software loopback interfaces (LFD1 through LFD4) using just four physical interfaces. Physical loopbacks would require twice as many interfaces.
Considerations
The SFP decides the Mac loopback speed. DMF uses the max port speed if there is no SFP (i.e., an empty port).
The port speed configuration (if any) will not impact the Mac loopback speed. The Mac loopback speed is set based on the SFP or the max port speed if there is no SFP.
The Rate-limit option limits the Mac loopback traffic at Rx side.
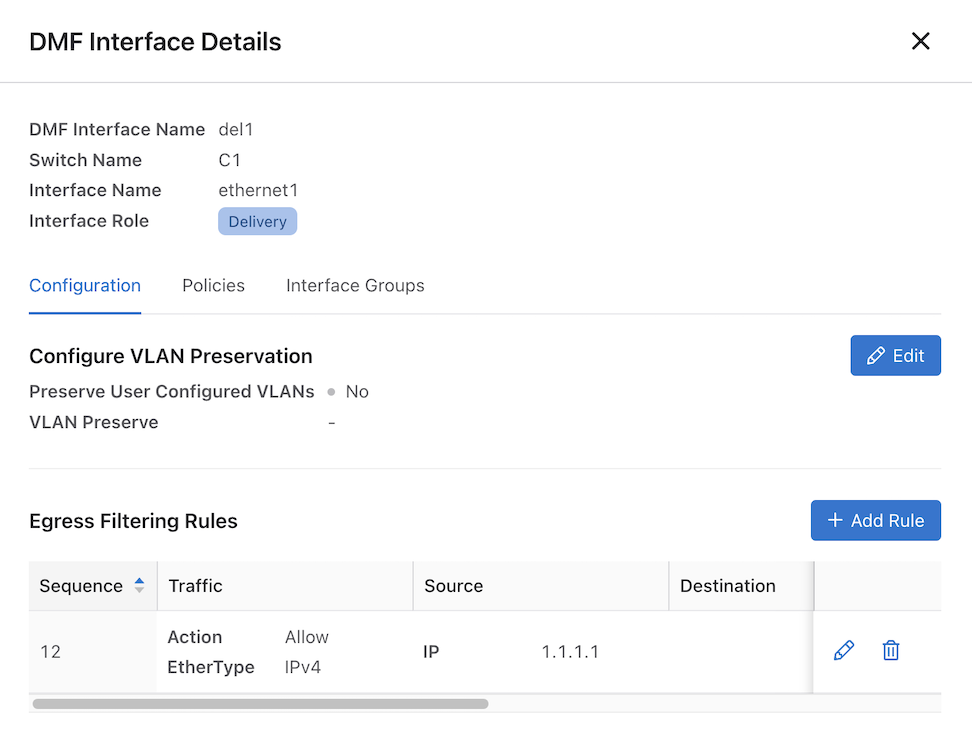
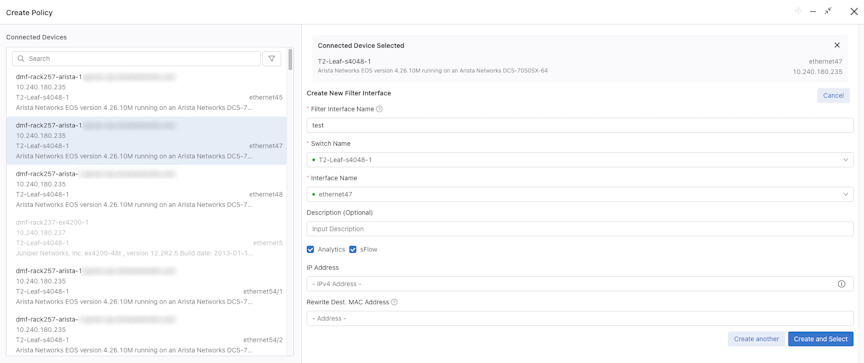
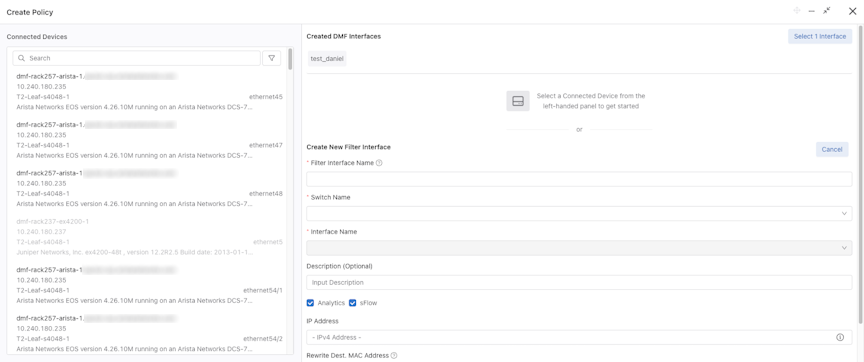
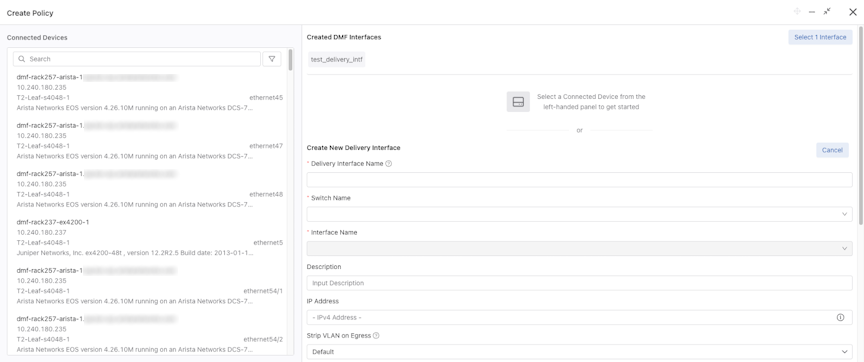
Configure Filter and Delivery Interfaces with MAC Loopback
To configure an interface with the Filter and Delivery role and enable the MAC (software) loopback option, perform the following steps:
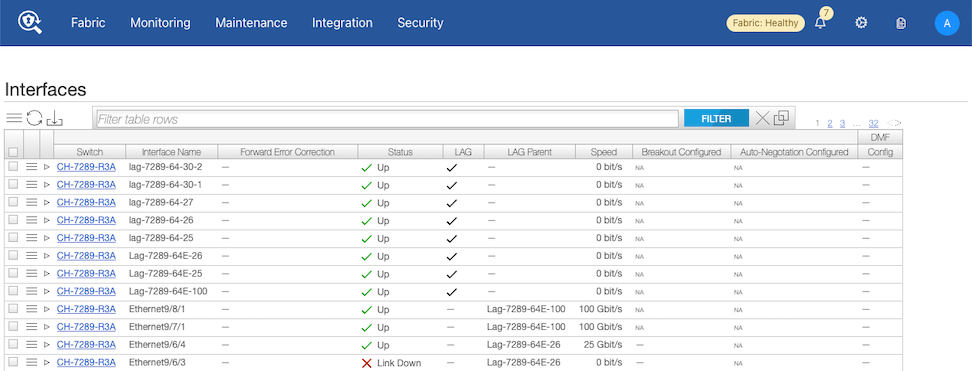
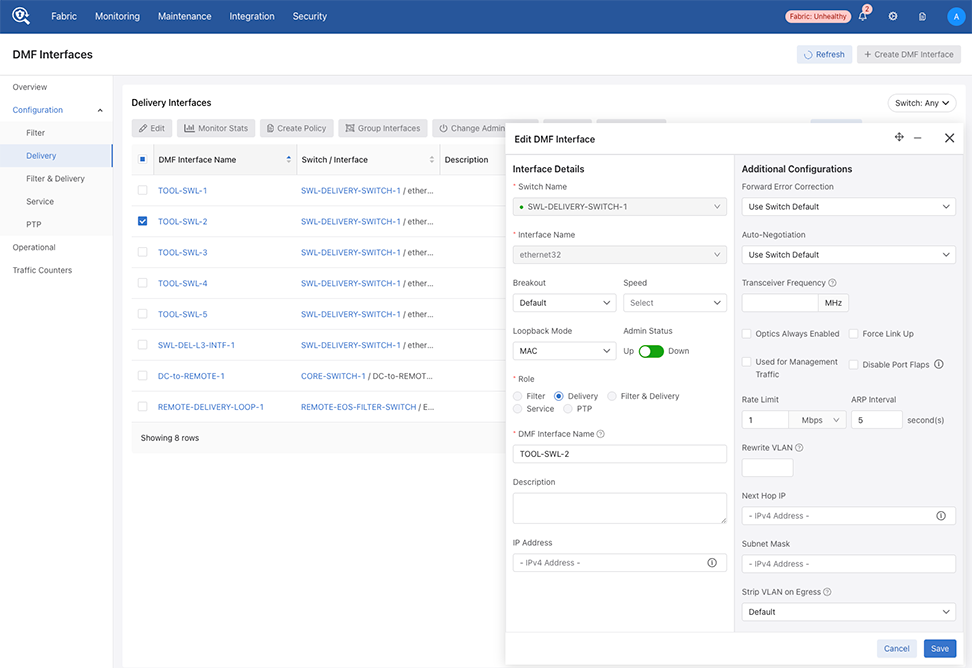
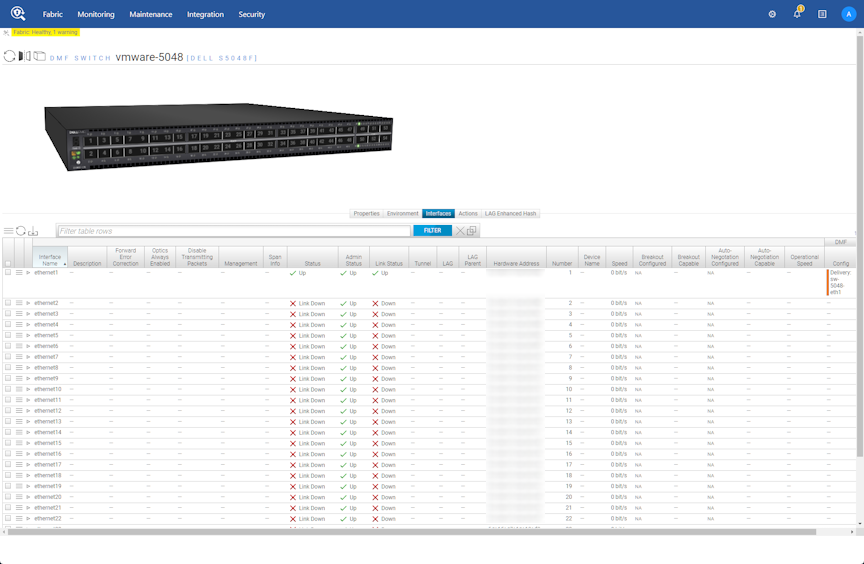
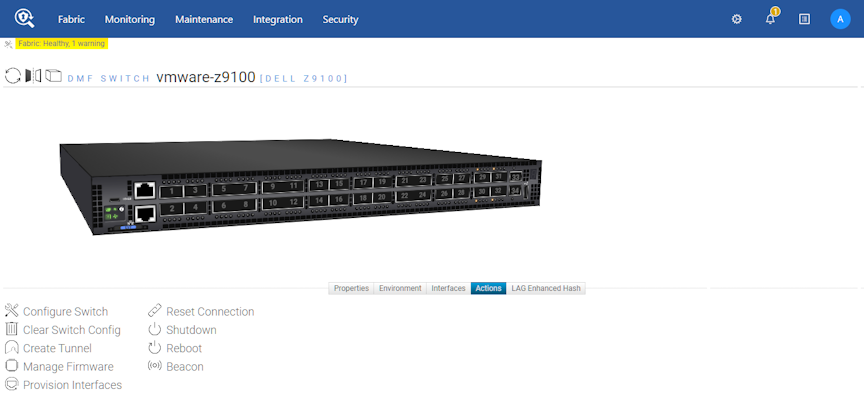
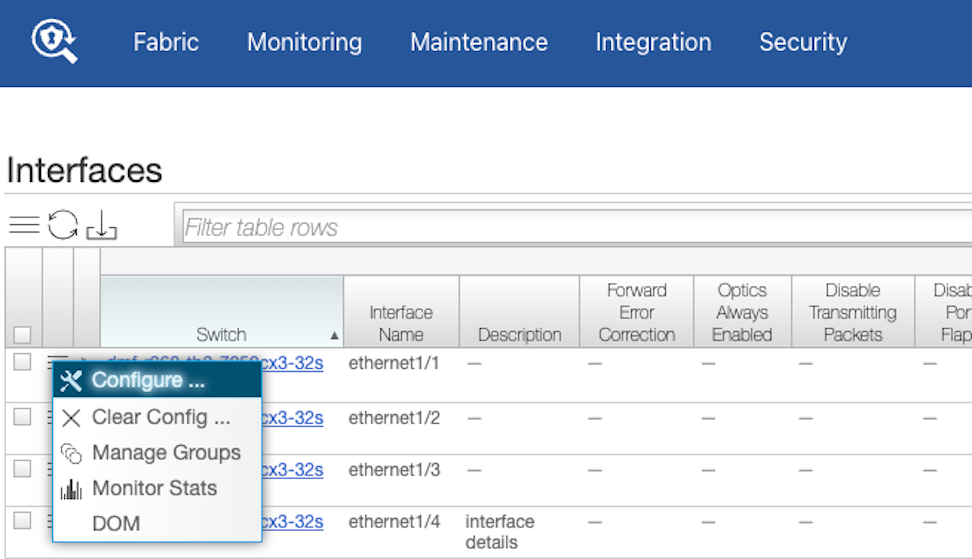
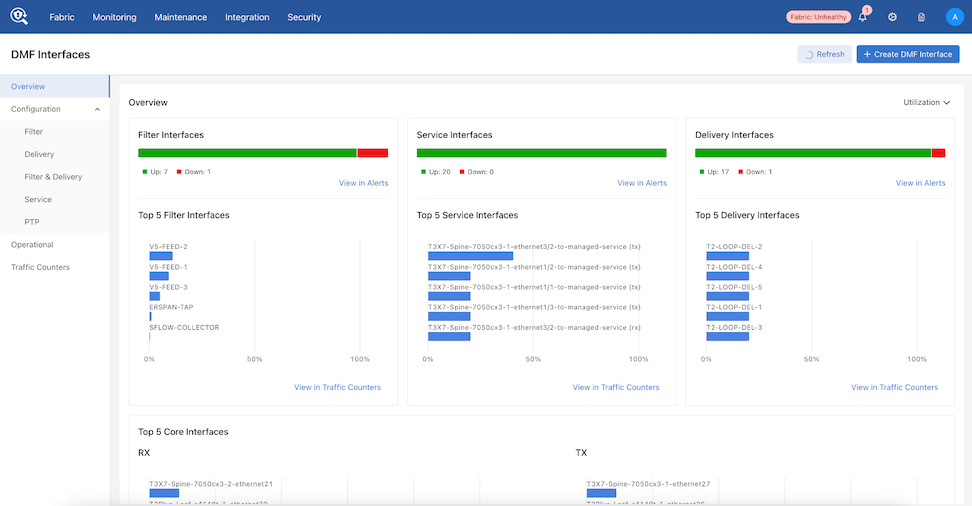
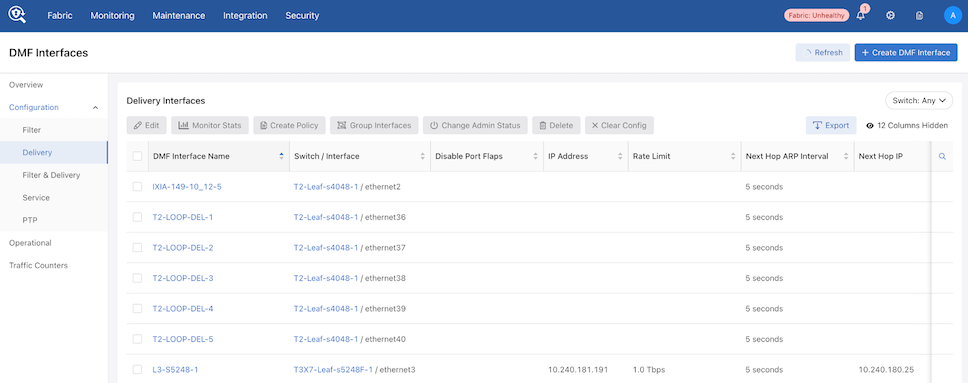
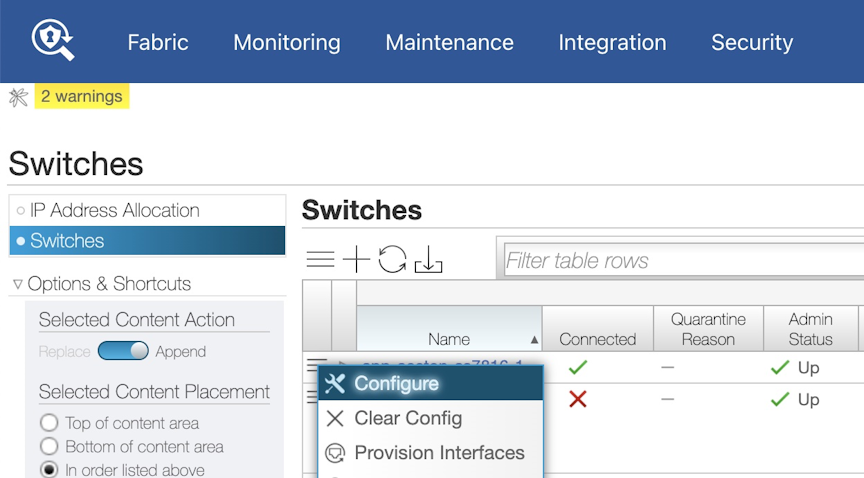
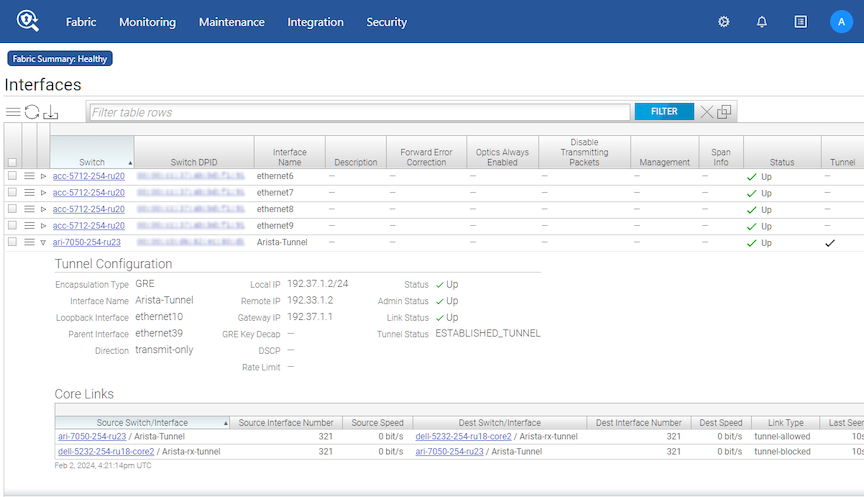
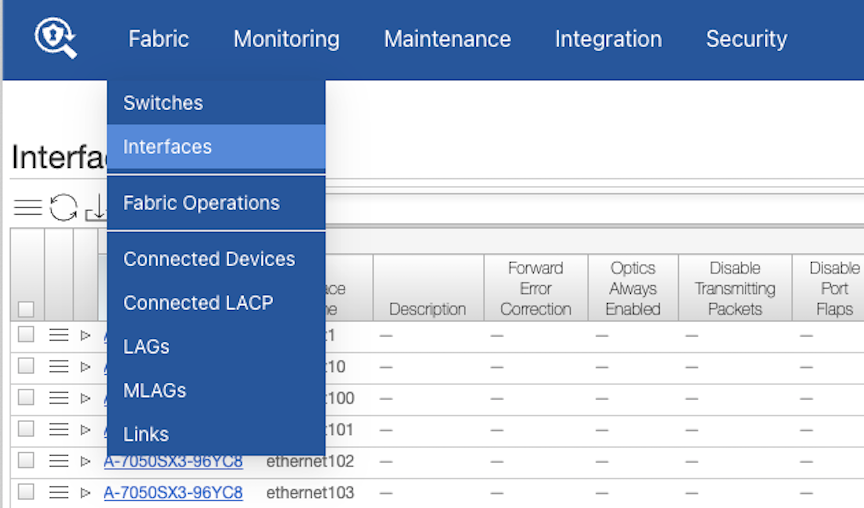
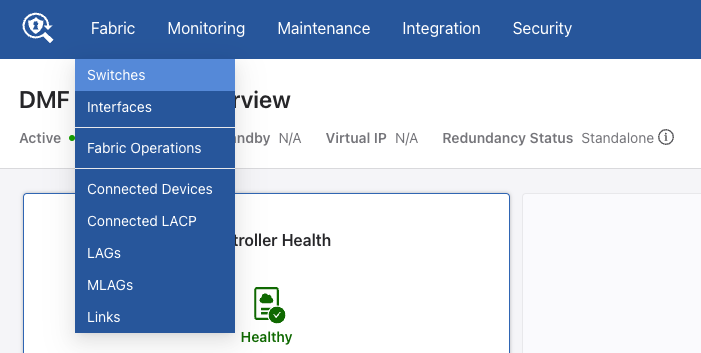
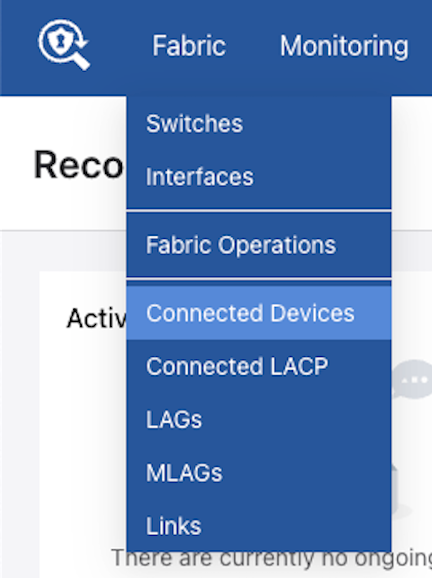
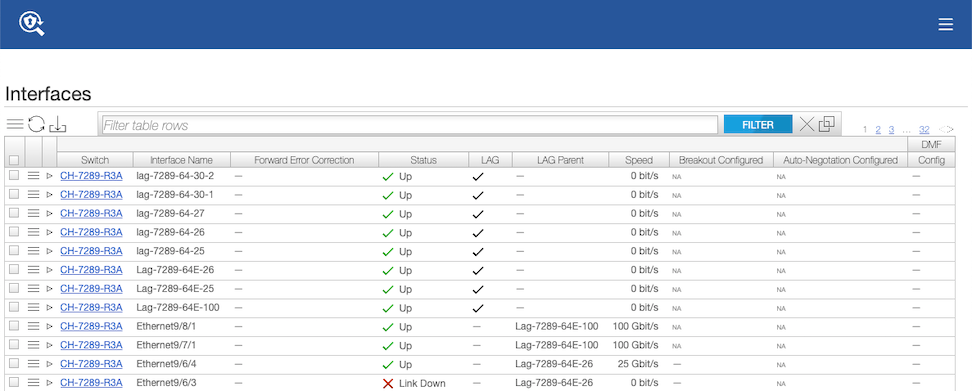
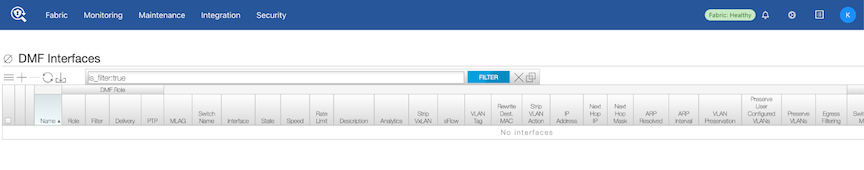
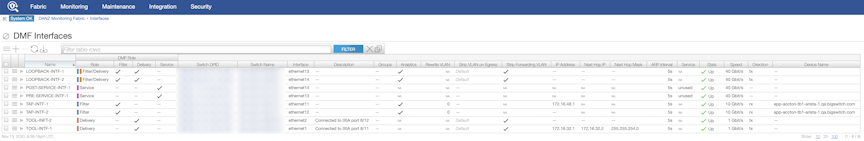
Display the available interfaces by selecting Fabric > Interfaces.
The system displays the Interfaces page, which lists the interfaces connected to the DANZ Monitoring Fabric (DMF) fabric.
Figure 2. Fabric Interfaces
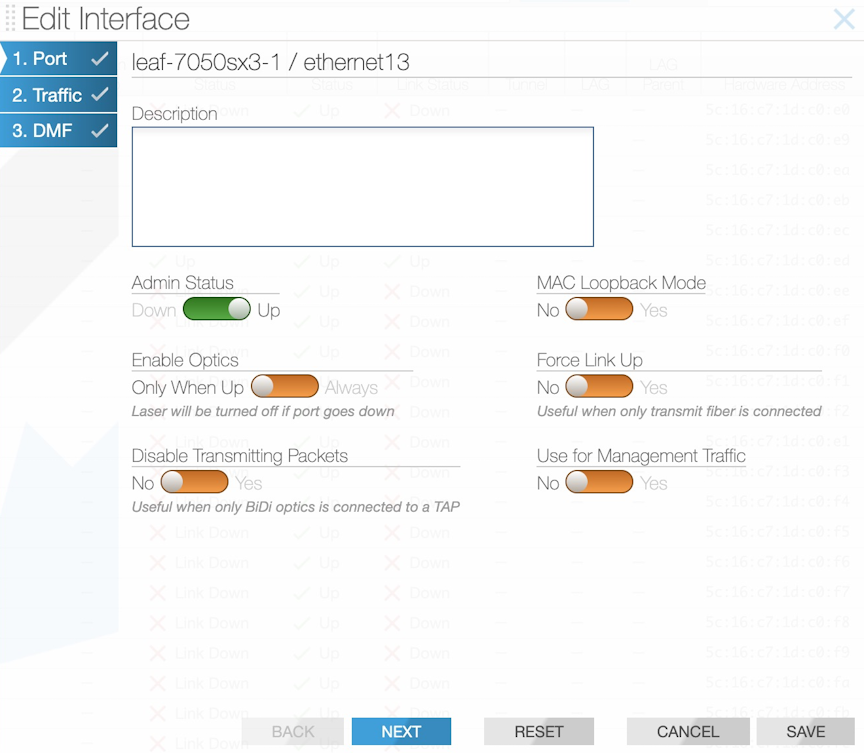
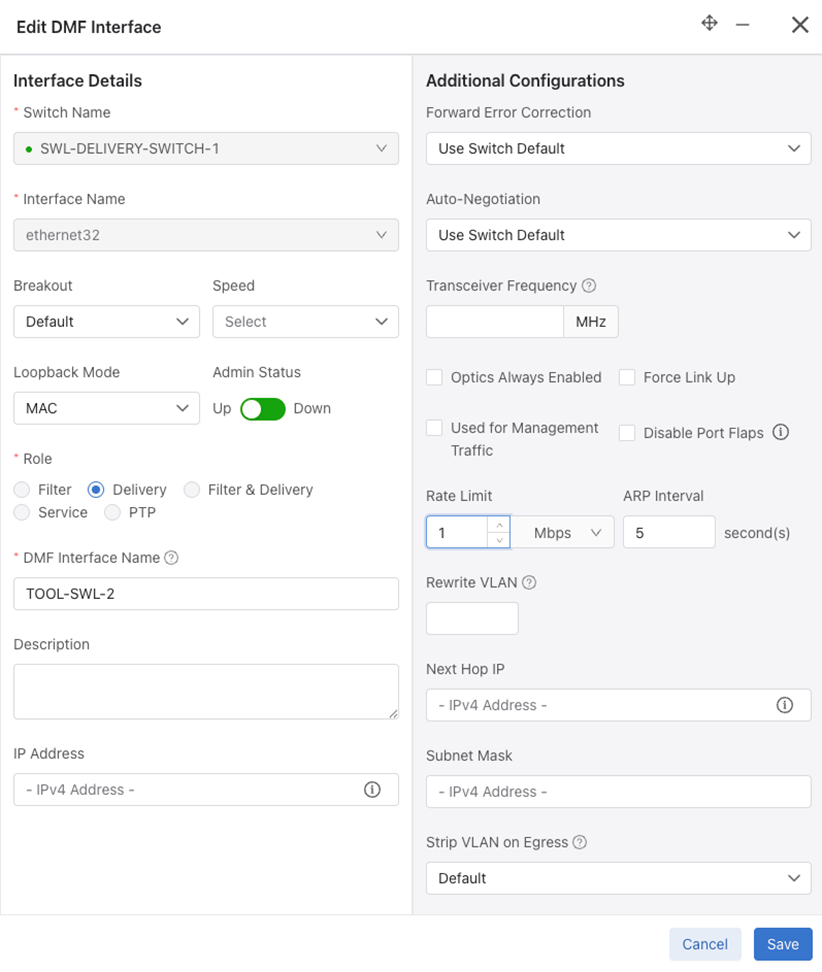
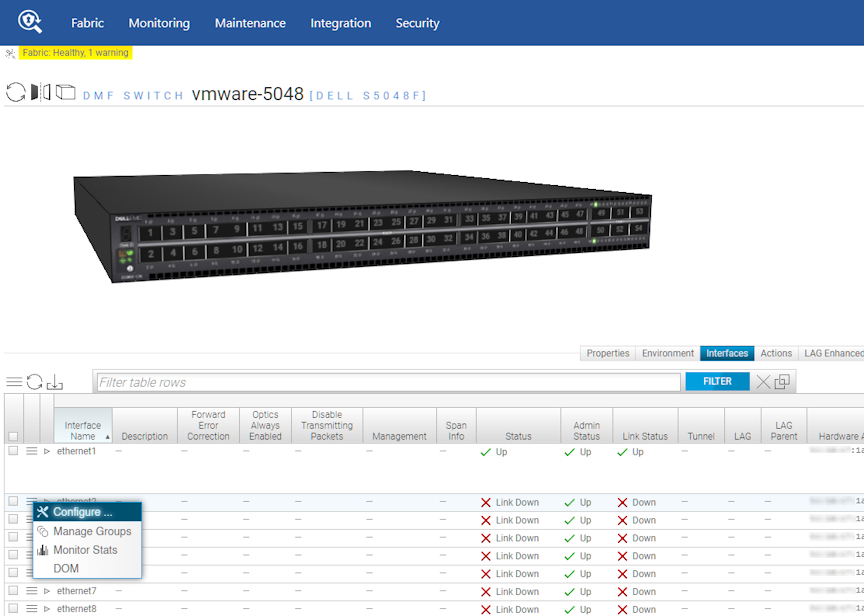
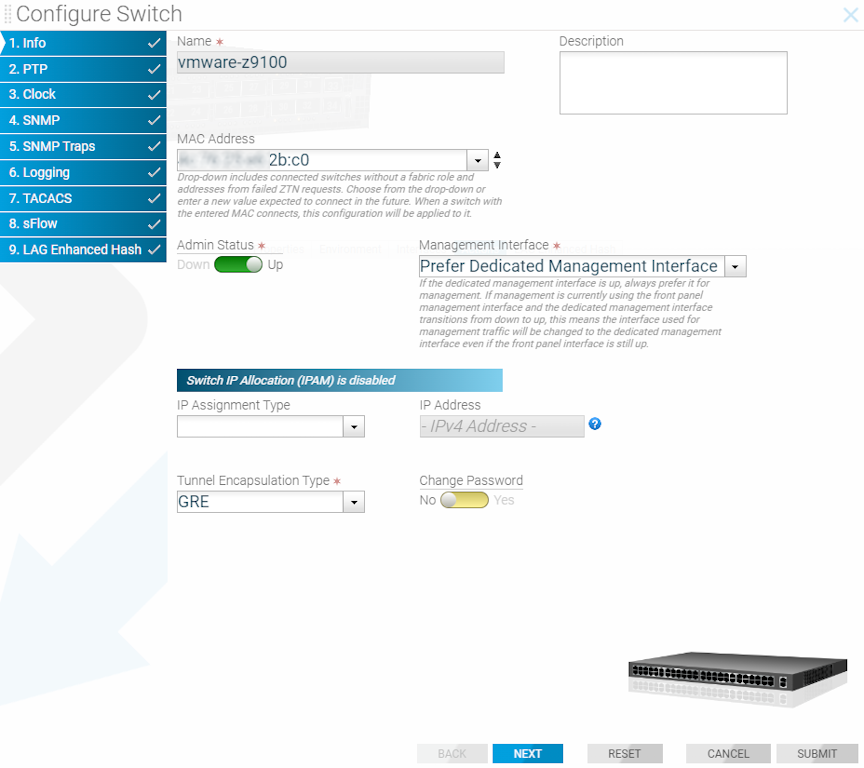
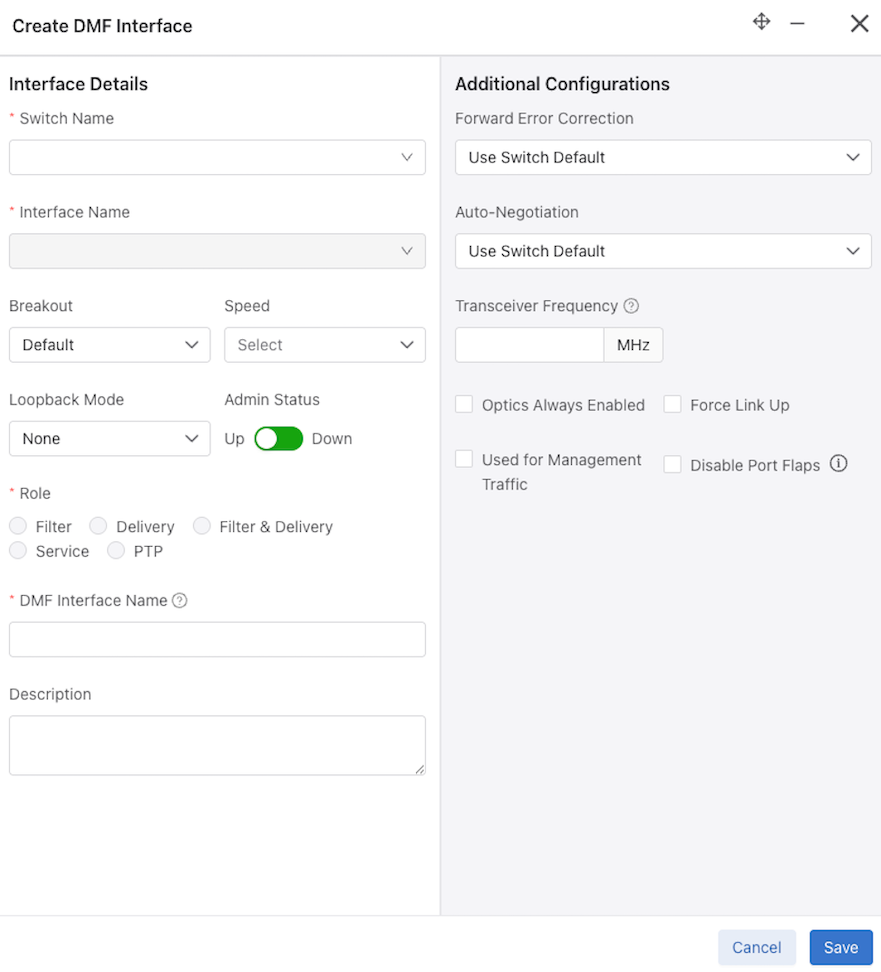
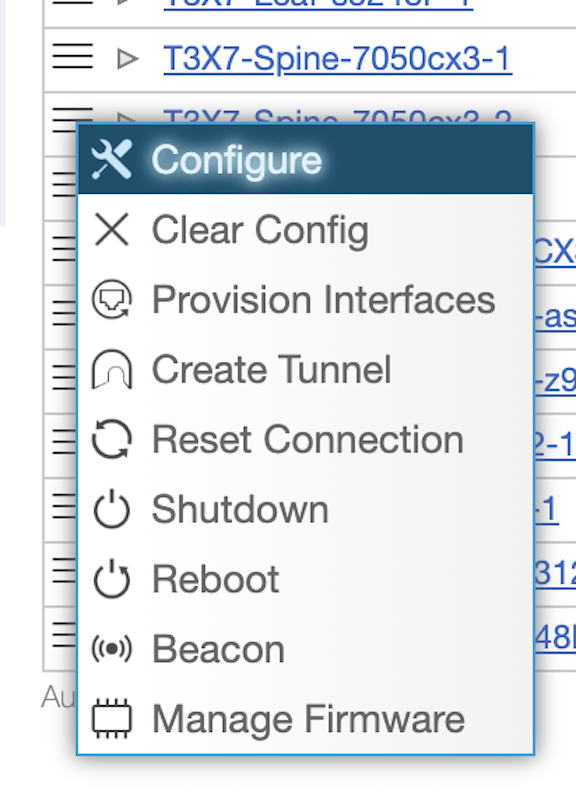
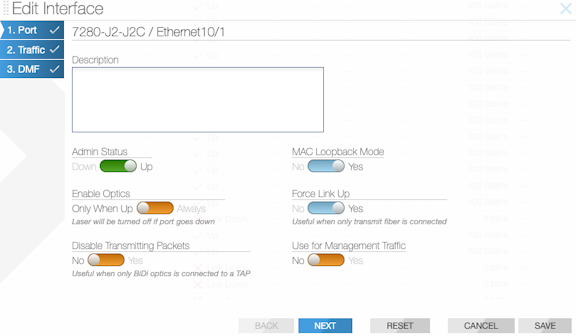
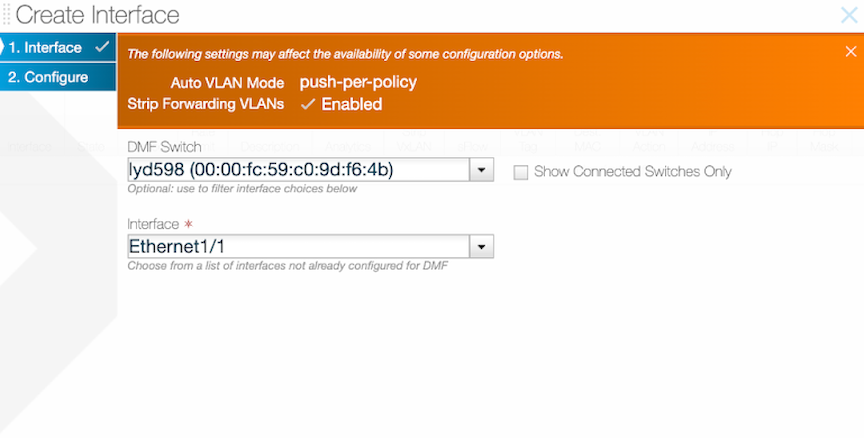
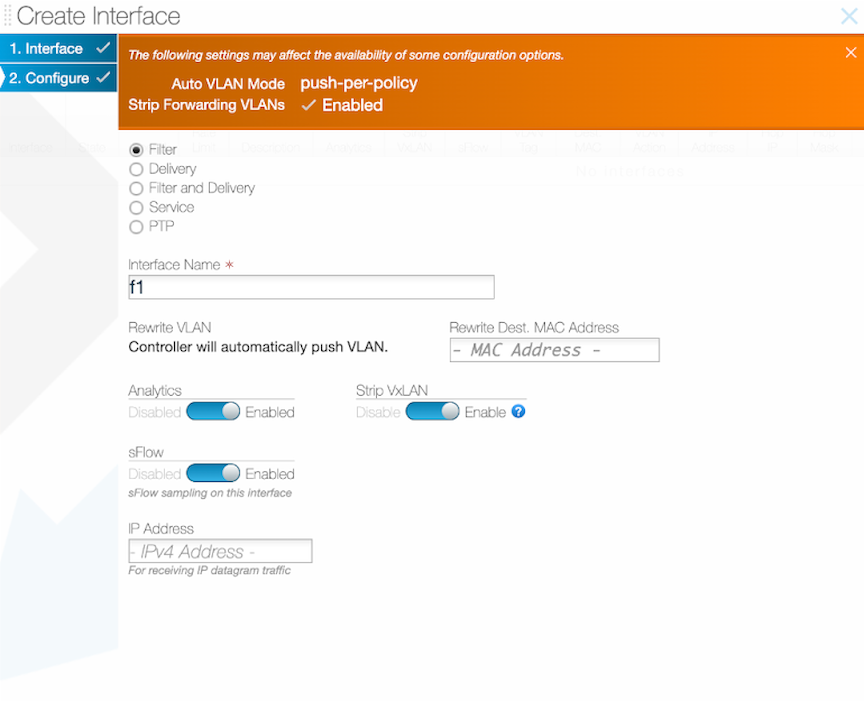
Select the Menu control for the interface to use and select Configure from the pull-down menu.
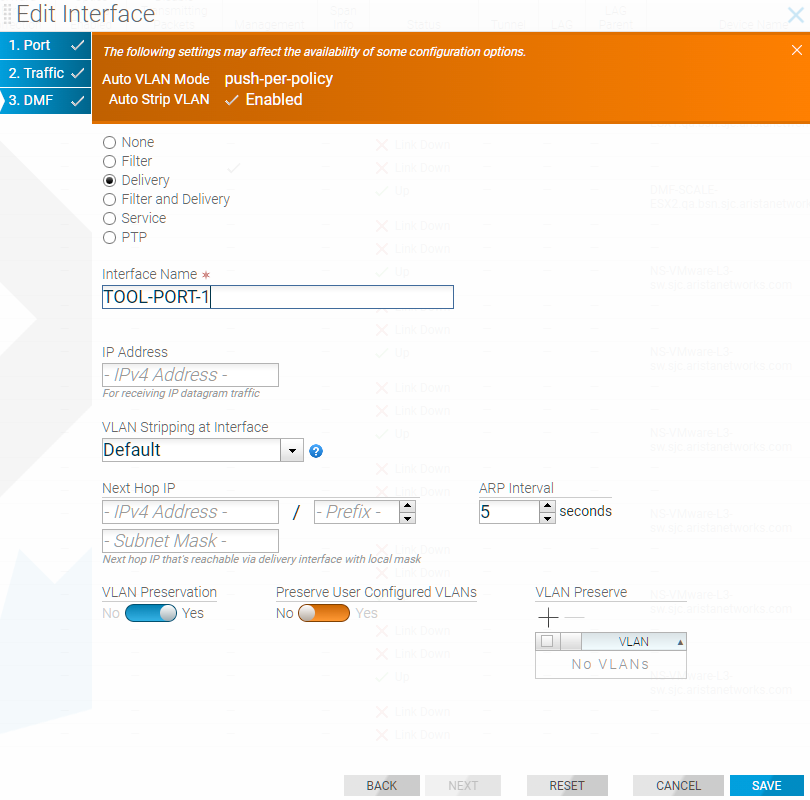
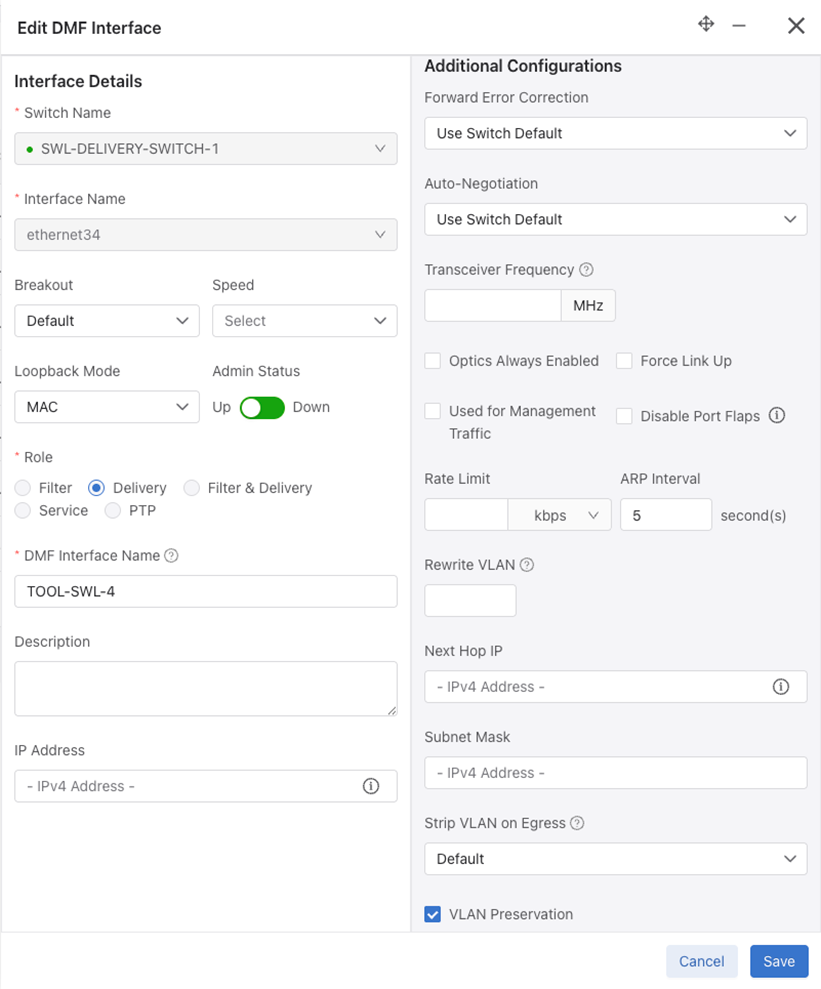
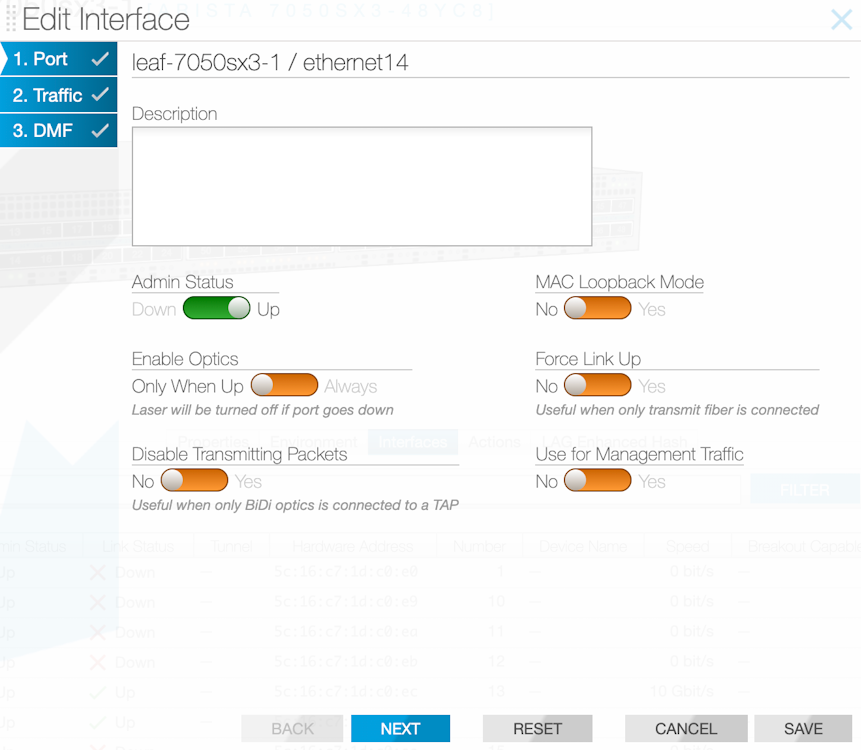
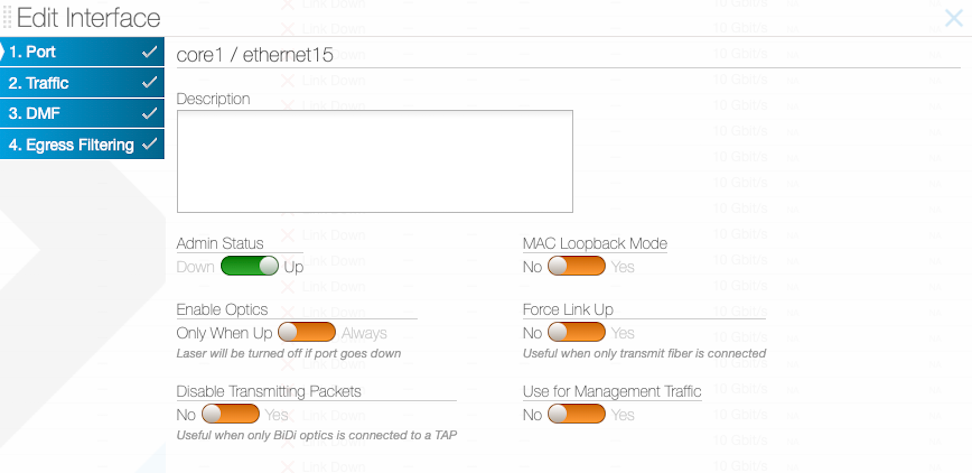
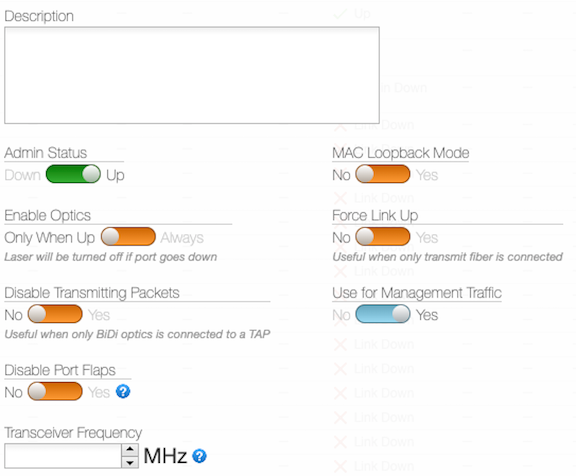
The system displays the following dialog:
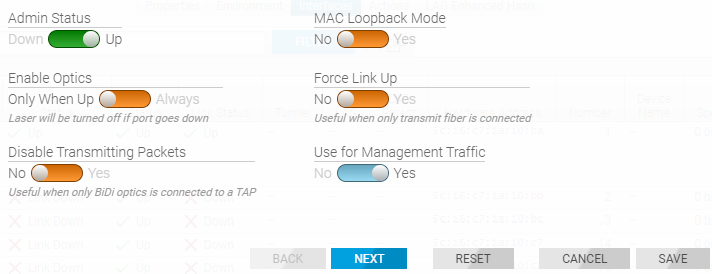
Figure 3. Fabric > Interfaces > Edit Interface > Port
Note: The rewrite VLAN ID feature cannot be used with tunneling.
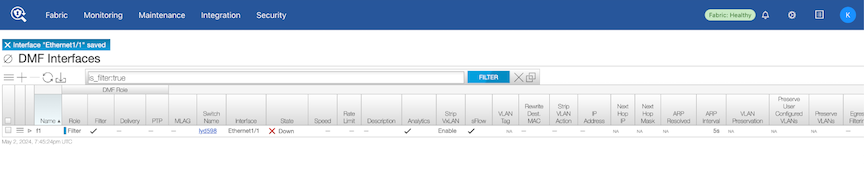
Select Save to complete and save the configuration.
Using the CLI To Configure a Filter and Delivery Interface with MAC Loopback
The CLI interface configuration for copying traffic to multiple delivery ports is shown in the following example:
switch DMF-FILTER-SWITCH-1
admin hashed-password
$6$5niT1gPm$Jc24qOMF.hxNPI20DvnKaFZKYD6lIo59IMp3O4xIdwVTu2hx0s8Djpvz9xXAXXndiSkKe5jH.9PKoHHrWviSl0
mac 70:72:cf:dc:99:5c
interface ethernet1
role filter interface-name TAP-PORT-1
interface ethernet13
role delivery interface-name TOOL-PORT-1
interface ethernet15
role delivery interface-name TOOL-PORT-1
interface ethernet17
role delivery interface-name TOOL-PORT-3
interface ethernet19
role delivery interface-name TOOL-PORT-4
interface ethernet25
loopback-mode mac
role both-filter-and-delivery interface-name LOOPBACK-PORT-1
interface ethernet26
loopback-mode mac
role both-filter-and-delivery interface-name LOOPBACK-PORT-2
interface ethernet27
loopback-mode mac
role both-filter-and-delivery interface-name LOOPBACK-PORT-3
interface ethernet28
loopback-mode mac
role both-filter-and-delivery interface-name LOOPBACK-PORT-4
The following example illustrates using five policies to implement this use case without creating overlapping policies. Otherwise, sixteen overlapping policies would be created without using the loopback interfaces to copy the traffic to separate filter interfaces.
! policy
policy TAP-NETWORK-1
action forward
delivery-interface LOOPBACK-PORT-1
delivery-interface LOOPBACK-PORT-2
delivery-interface LOOPBACK-PORT-3
delivery-interface LOOPBACK-PORT-4
filter-interface TAP-PORT-1
1 match any
!
policy DUPLICATED-TRAFFIC-1
action forward
delivery-interface TOOL-PORT-1
filter-interface LOOPBACK-PORT-1
1 match ip src-ip 100.1.1.1 255.255.255.252
!
policy DUPLICATED-TRAFFIC-2
action forward
delivery-interface TOOL-PORT-2
filter-interface LOOPBACK-PORT-2
1 match ip dst-ip 100.1.1.1 255.255.255.252
!
policy DUPLICATED-TRAFFIC-3
action forward
delivery-interface TOOL-PORT-3
filter-interface LOOPBACK-PORT-3
1 match tcp src-port 1234
!
policy DUPLICATED-TRAFFIC-4
action forward
delivery-interface TOOL-PORT-4
filter-interface LOOPBACK-PORT-4
1 match tcp dst-port 80
Use the show policy command to verify the policy configuration.
Rate Limiting Traffic to Delivery Interfaces
The option exists to limit the traffic rate on a delivery interface, which can be a regular interface, a port channel, a tunnel interface, or a loopback interface.
Use kbps to configure the rate-limit for the regular delivery interface. Arista Networks recommends configuring the rate limit in multiples of 64 kbps.
Rate Limiting Using the GUI
To use the GUI to set the rate limit for an interface, perform the following steps:
To view the configuration, enter the show this command, as in the following example:
CONTROLLER-1(config-switch-if)# show this
! switch
switch DMF-DELIVERY-SWITCH-1
!
interface ethernet1
rate-limit 10000
role delivery interface-name TOOL-PORT-1
CONTROLLER-1 (config-switch-if)#
Configure the rate limit for each member interface to rate limit a port channel. Configure individual rate limits for each member interface if the port channel has two member interfaces.
lag-interface lag1
hash-type l3
member ethernet43
member ethernet45
interface ethernet43
rate-limit 10000 <------ set the rate-limit to 10 Mbps
interface ethernet45
rate-limit 128000 <---------- set the rate-limit to 128 Mbps
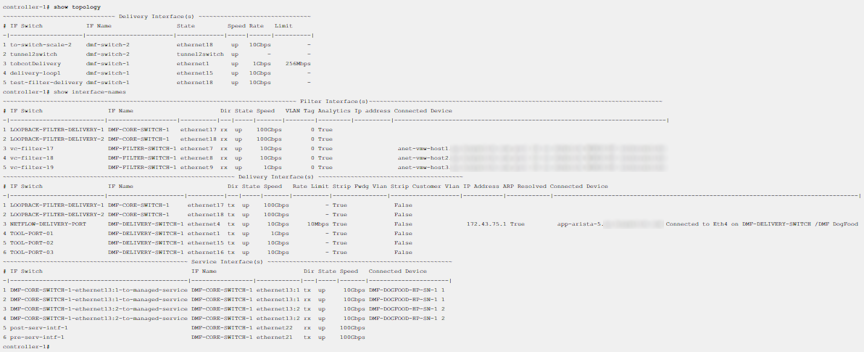
To display the configured rate limit, use the show topology and show interface-names commands, as in the following examples:
Note: In the current release, the Rate Limit column does not show the configured value for LAG and tunnel interfaces.
Configuring Overlapping Policies
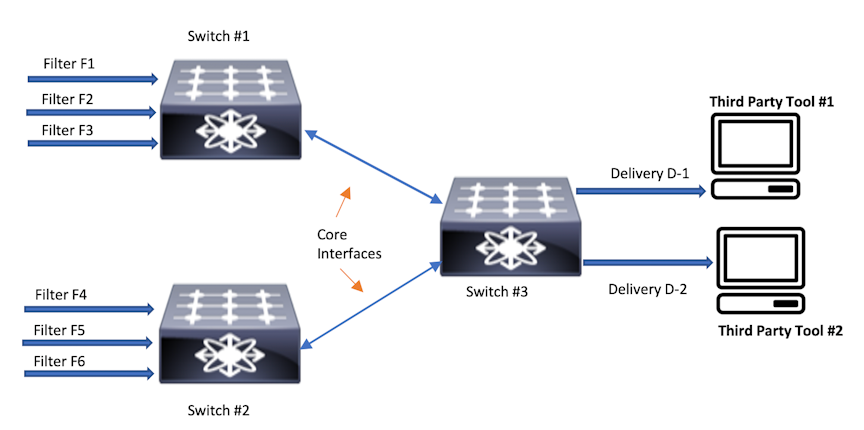
When two or more policies have one or more filter ports in common, the match rules in these policies may intersect. If the priorities are different, the policy with the higher priority takes effect. However, if the policies have the same priority, the policies overlap, as illustrated in the figure below:
Figure 8. Overlapping Policies
In the policy illustrated, packets received on interface Filter 1 with the source-IP address 10.1.1.x/24 are delivered to D1. In a separate policy, with the same priority, packets received at Filter 1 with the destination IP address 20.1.1.y/24 are delivered to D2. With both these policies applied, when a packet arrives at F1 with a source IP address 10.1.1.5/24 and a destination IP address 20.1.1.5/24, the packets are copied and forwarded to both D1 and D2. Enabled by default, the DANZ Monitoring Fabric (DMF) policy overlap feature causes this behavior.
DMF manages overlapping policies automatically by copying packets received on the same filter interface that match multiple rules but which the policy forwards to different delivery interfaces.
Two policies are said to be overlapping when meeting all of the following conditions:
Both policies have the same configured priority (or the same default priority).
At least one filter interface is shared.
At least one match rule in one policy intersects with at least one match rule in the other policy, which occurs when it is possible for a single packet to match both conditions simultaneously. For example, a rule matching src-ip 10.0.0.1 range-src-port 10 20 intersects with a rule matching dst-ip 10.0.0.2 range-src-port 15 25, since a packet could satisfy both rules (when the src-port is between 15 and 20, the src-ip is 10.0.0.1, and the dst-ip is 10.0.0.2).
Certain conditions will prevent an overlap policy from being installed even when overlapping policies are present. The system will not create an overlap policy or will invalidate the overlap policy when any of the following conditions apply:
Either component policy is already in an error state.
Either component policy has an action drop.
The number of overlapping policies sharing the same filter interface at the same priority exceeds the configured overlap limit.
The number of match rules required to cover the overlap between the two policies exactly exceeds the maximum allowed per policy.
Both policies use the same non-L3 managed service instance, but with different configurations (e.g., one marks it optional and the other does not).
Note: Automatically created dynamic policies are visible in the show policy command. However, they will not be visible in the running config, nor can they get deleted manually.
When overlapping policies are detected, by default, DMF performs the following operations:
Creates a new dynamic policy that aggregates the policy actions.
Assigns policy names, using this dynamic policy naming convention: _policy1_o_policy2_
Adds match combinations and configuration as appropriate.
Assigns a slightly higher priority to the new aggregated policy so that it overrules the overlapping policies, which, as a result, only applies to traffic that does not match the new aggregated policy. An incremental value of .1 is added to the original policy priority. For example, if the original policies have a priority of 100, the dynamic policy priority is 101.
Note: When changing the configurable parameters in an existing DMF out-of-band policy, any counters associated with the policy, including service-node-managed services counters, are reset to zero.
The overlap-limit-strict command, enabled by default, strictly limits the number of overlapping policies to the maximum configured using the overlap-policy-limit command. For example, the operation fails with a validation error when setting the maximum number of overlapping policies to four (the default) and attempting to create a fifth policy using the same filter interface. To disable strict enforcement, use the no overlap-limit-strict command.
Note: The overlap-strict-limit command is disabled and must be manually enabled to enforce configurable policy limits.
Configuring the Policy Overlap Limit Using the GUI
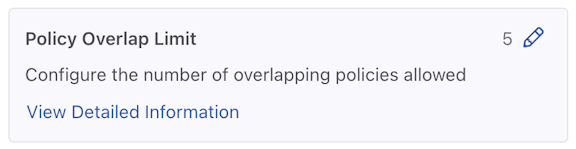
Policy Overlap Limit
Perform the following steps to configure the Policy Overlap Limit.
Control the configuration of this feature using Edit by locating the corresponding card and selecting the pencil icon.
Figure 9. Policy Overlap Limit
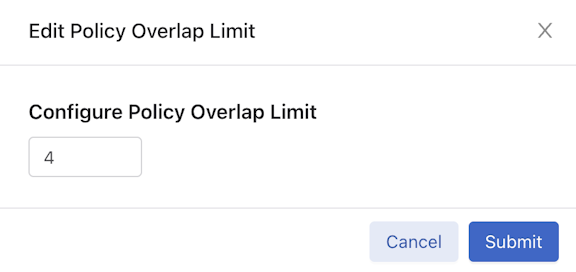
A configuration edit dialogue window pops up, displaying the corresponding prompt message. By default, the Policy Overlap Limit is 4.
Figure 10. Edit Policy Overlap Limit
Adjust the Value (minimum value: 0, maximum value: 10). There are two ways to adjust the value:
Directly enter the desired value in the input area.
Use the up and down arrow buttons in the input area to adjust the value accordingly. Pressing the up arrow increments the value by 1, while pressing the down arrow decrements it by 1.
Select Submit to confirm the configuration changes or Cancel to discard the changes.
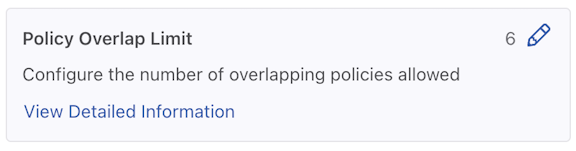
After successfully setting the configuration, the current configuration status displays next to the Pencil (edit) icon.
Figure 11. Policy Overlap Limit Change Success
Configuring the Overlapping Policy Limit Using the CLI
By default, the number of overlapping policies allowed is four. The maximum number to configure for overlapping policies is ten. Set the overlap policy limit to zero to disable the overlapping policy feature.
To change the default limit for overlapping policies, use the following command:
Replace integer with the maximum number of overlapping policies to support fabric-wide.
For example, the following command sets the number of overlapping policies supported to the maximum value (10):
controller-1(config)# overlap-policy-limit 10
The following command disables the overlapping policies feature:
controller-1(config)# overlap-policy-limit 0
Note: When setting the Policy Overlap Limit to zero, ensure the policies do not overlap. If active policies overlap after disabling this feature, the forwarding result may be unpredictable.
Using the CLI to View Overlapping Policies
Enter the show policy command to view statistics for dynamic (overlapping) policies. If an overlapping policy appears in the output, the parent policies are identified, as in the following example:
controller-1(config-policy)# show policy
# Policy Name Config Status         Runtime Status Action  Type       Priority Overlap Priority Rewrite VLAN Filter BW Delivery BW Services
-|-----------|---------------------|--------------|-------|----------|--------|----------------|------------|---------|-----------|--------|
1 _p2_o_p1    active and forwarding installed      forward Dynamic    100      1                0            -         -
2 p1          active and forwarding installed      forward Configured 100      0                0            -         -
3 p2          active and forwarding installed      forward Configured 100      0                0            -         -
In this example:
show overlap _P1_O_P2, lists component policies: source P1, P2.
show P1, lists dynamic policies: overlap _P1_O_P2.
To view the details for a specific overlapping policy, append the policy name to the show policy command, as in the following example:
controller-1(config-policy)# show policy _p1_o_p2
Policy Name : _p1_o_p2
Config Status : active and forwarding
Runtime Status : installed
Detailed Status : installed - installed to forward
Action : forward
Priority : 100
Overlap Priority : 1
Description : runtime policy
# of switches with filter interfaces : 1
# of switches with delivery interfaces : 1
# of switches with service interfaces : 0
# of filter interfaces : 1
# of delivery interfaces : 2
# of core interfaces : 4
# of services : 0
# of pre service interfaces : 0
# of post service interfaces : 0
Rewrite VLAN : 0
Total Ingress Rate : -
Total Delivery Rate : -
Total Pre Service Rate : -
Total Post Service Rate : -
Overlapping Policies : none
Component Policies : p2, p1,
Failed Overlap Policy Exceeding Max Rules :
Rewrite valid? : False
Service Names :
Overlap Matches :
1 ether-type 2048 src-ip 10.1.1.1 255.255.255.0 dst-ip 20.1.1.1 255.255.255.0
Strip VLAN : False
Delivery Bandwidth : 20 Gbps
explicitly-scheduled : False
Filter Bandwidth : 10 Gbps
Type : Dynamic
~ Match Rules ~
None.
~~~~~~~~~~~~~~~~~~~~~~~~~~~ Filter Interface(s) ~~~~~~~~~~~~~~~~~~~~~~~~~~~
# IF Switch IF Name State Dir Packets Bytes Pkt Rate Bit Rate
-|---------|-----------|--------|-----|---|-------|-----|--------|--------|
1 f1 filter-sw-1 s11-eth1 up rx 0 0 0 -
~~~~~~~~~~~~~~~~~~~~~~~~~~ Delivery Interface(s) ~~~~~~~~~~~~~~~~~~~~~~~~~~
# IF Switch IF Name State Dir Packets Bytes Pkt Rate Bit Rate
-|---------|-----------|--------|-----|---|-------|-----|--------|--------|
1 d1 filter-sw-2 s12-eth1 up tx 0 0 0 -
2 d2 filter-sw-2 s12-eth2 up tx 0 0 0 -
~ Service(s) ~
None.
~~~~~~~~~~~~~~~~~~~~~~~ Core Interface(s) ~~~~~~~~~~~~~~~~~~~~~~~
# Switch IF State Dir Packets Bytes Pkt Rate Bit Rate
-|-----------|--------|-----|---|-------|-----|--------|--------|
1 filter-sw-1 s11-eth3 up tx 0 0 0 -
2 core-sw-2 s10-eth1 up rx 0 0 0 -
3 core-sw-2 s10-eth2 up tx 0 0 0 -
~ Failed Path(s) ~
None.
~~~~~~~~~~~~~~~~~~~~~~~~~~~~~~~~~~~~ Event History ~~~~~~~~~~~~~~~~~~~~~~~~~~~~~~~~~~~~
# Time Event Detail
-|-------------------|---------------------|-------------------------------------------|
1 2014-08-05 22:22:27 start forward pending installation - installed to forward
2 2014-08-05 22:22:27 installation complete installed - installed to forward
Configuring the Policy Overlap Limit Strict using the GUI
The Policy Overlap Limit Strict option, enabled by default, strictly limits the number of overlapping policies to the maximum configured. For example, when setting the maximum number of overlapping policies to 4 (the default) and users create a fifth policy using the same filter interface, the operation fails with a validation error.
From the DANZ Monitoring Fabric (DMF) Features page, proceed to the Configuring the Policy Overlap Limit Strict feature card.
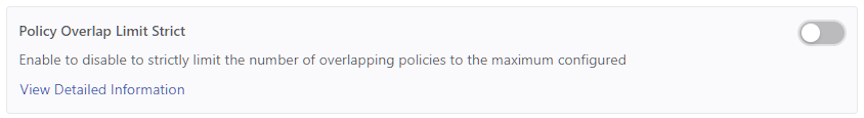
Select the Policy Overlap Limit Strict card.
Note: The Policy Overlap Limit Strict option is enabled by default. The following steps guide if the Policy Overlap Limit Strict option is disabled.
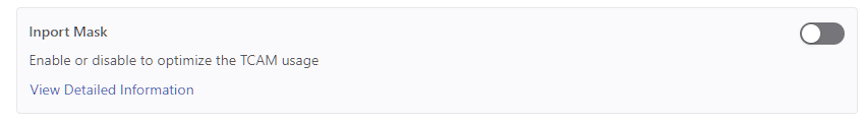
Figure 12. Policy Overlap Limit Strict Disabled
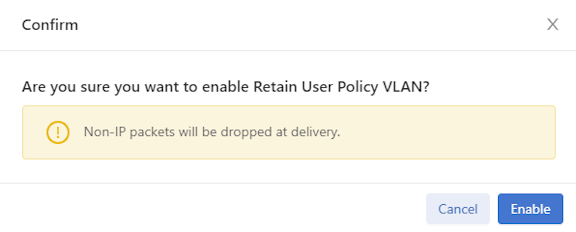
Toggle the Policy Overlap Limit Strict switch to On.
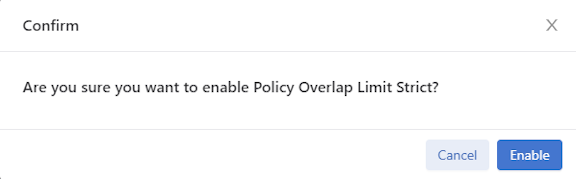
Confirm the activation by selecting Enable. Or, Cancel to return to the DMF Features page.
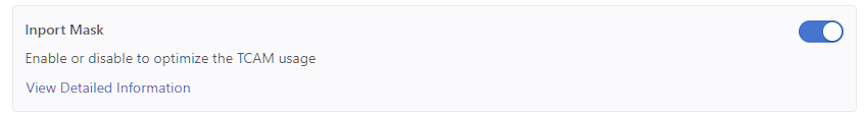
Figure 13. Enable Policy Overlap Limit Strict
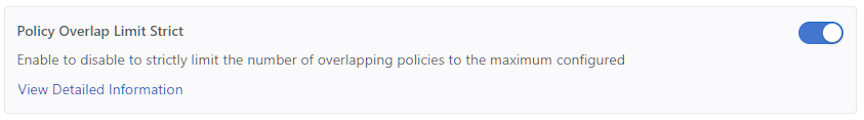
Retain Configuring the Policy Overlap Limit Strict is running.
Figure 14. Policy Overlap Limit Strict Enabled
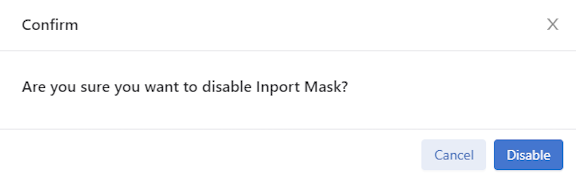
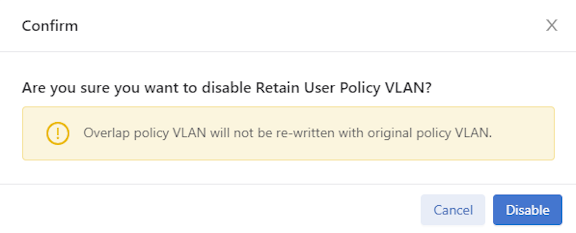
To disable the feature, toggle the Policy Overlap Limit Strict switch to Off. Select Disable and confirm.
Figure 15. Disable Policy Overlap Limit Strict
The feature card updates with the status.
Figure 16. Policy Overlap Limit Strict Disabled
Configuring the Policy Overlap Limit Strict using the CLI
The Policy Overlap Limit Strict option, enabled by default, strictly limits the number of overlapping policies to the maximum configured. For example, when setting the maximum number of overlapping policies to 4 (the default) and users create a fifth policy using the same filter interface, the operation fails with a validation error.
Use the following commands to disable or enable the Policy Overlap Limit Strict feature using the CLI.
controller-1(config)# no overlap-limit-strict
controller-1(config)# overlap-limit-strict
Exclude Inactive Policies from Overlap Limit Calculation
Previously, DANZ Monitoring Fabric (DMF) calculated the overlap policy limit by determining how many policies use the same filter interface, irrespective of whether the policies are active or inactive. By default, the overlap policy limit is 4, and the maximum is 10.
Suppose the limit is 4, and a user attempts to create a 5th policy using the same filter interface (f1). DMF throws the following error message: Error: Validation failed: Filter interfaces used in more than 4 policies: f1.
This count will include filter interfaces used in active or inactive policies.
The DMF policy overlap calculation excludes inactive policies when using the inactive command in policy configuration. For example, using the same policy limit settings described above, DMF supports creating a 5th policy using the same filter interface (f1) by first putting the 5th policy in an inactive state using the inactive command under policy configuration.
Note: This feature applies to switches running SWL OS and EOS.
Global Configuration Example
Select a switch and enter the config mode using the following command:
(config)# switch core1
Select an interface on the switch used as the filter-interface, as shown in the following example.
(config-switch)# interface ethernet1
Create a filter interface, for example, f1, using the following command:
(config-switch-if)# role filter interface-name f1
Repeat the process to create the delivery interfaces.
(config-switch)# interface ethernet2
(config-switch-if)# role delivery interface-name d1
(config-switch)# interface ethernet3
(config-switch-if)# role delivery interface-name d2
(config-switch)# interface ethernet4
(config-switch-if)# role delivery interface-name d3
Set a max overlap-policy-limit value, for example, 2.
(config-switch)# overlap-policy-limit 2
Create overlap policies using the same filter-interface, in this example, f1.
(config-switch)# policy p1
(config-policy)# filter-interface f1
(config-policy)# delivery-interface d1
(config-policy)# action forward
(config-policy)# 1 match any

(config-switch)# policy p2
(config-policy)# filter-interface f1
(config-policy)# delivery-interface d2
(config-policy)# action forward
(config-policy)# 1 match any
Since the overlap-policy-limit value is 2, the third overlap policy will not allow the use of the same filter interface f1 in the third policy, p3. DMF throws a validation error.
(config-switch)# policy p3
(config-policy)# delivery-interface d3
(config-policy)# action forward
(config-policy)# filter-interface f1Error: Validation failed: Filter interfaces used in more than 2 policies: f1
Show Commands
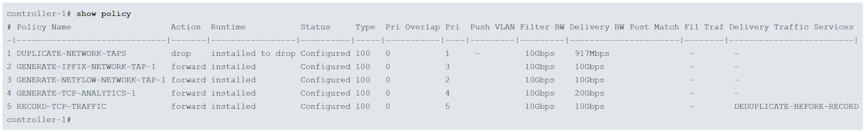
The following command example displays the configured policies listing two overlap policies _p1_o_p2.
(config-policy)# show policy
# Policy Name Action  Runtime Status               Type       Priority Overlap Priority Push VLAN Filter BW (truncated...)
-|-----------|-------|----------------------------|----------|--------|----------------|---------|--------- (truncated...)
1 _p1_o_p2    forward A component policy failed    Dynamic    100      1                3         10Gbps    (truncated...)
2 p1          forward all delivery interfaces down Configured 100      0                1         10Gbps    (truncated...)
3 p2          forward all delivery interfaces down Configured 100      0                2         10Gbps    (truncated...)
4 p3          forward inactive                     Configured 100      0                4         -         (truncated...)
To add filter interface f1 to the third overlap policy, p3, set the policy to inactive.
(config-switch)# policy p3
(config-policy)# inactive
(config-policy)# filter-interface f1
This results in an inactive policy p3 being configured with filter interface f1. Use the show
running-config policy command to view the status.
(config-policy)# show running-config policy
! policy
policy p1
action forward
delivery-interface d1
filter-interface f1
1 match any

policy p2
action forward
delivery-interface d2
filter-interface f1
1 match any

policy p3
action forward
delivery-interface d3
filter-interface f1
inactive
1 match any
Exclude Expired Policies from Overlap Limit Calculation
If any two policies use the same filter interface and the same priority, then an additional dynamic policy is created to ensure the delivery of packets matching both of the original policies. There is a limit on how many overlap policies can be created and it is configurable with a range between 0 to 10 with a default value of 4. Currently, the system excludes policies configured as inactive in the overlap policy limit calculation. With this new feature, the system excludes policies that have an expired duration from the overlap policies limit calculation.
CLI Configuration
No new configuration is necessary to use this feature. However, In order to achieve this improvement, the existing config validation Filter interfaces
used in more than n policies was removed which is present in the policy creation of adding the filter interface after exceeding the max overlap limit number of policies.
Show Commands
Once the number of installed overlap policies reaches the maximum limit, any additional policies will not be installed. They are marked as inactive with the reason: Filter interface fil1 cannot be used in more than 2 active
policies. In the example below, the overlap limit is 2.
controller-1# show running-config overlap-policy-limit

! overlap-policy-limit
overlap-policy-limit 2
policy1, policy2 and its overlap policy _policy1_o_policy2 have been installed. Since the overlap policy limit has been reached, policy policy3 is inactive.
The reason for policy policy3 inactive is shown in both the Config Status and Detailed
Status.
controller-1# show policy policy3
Policy Name                            : policy3
Config Status                          : Filter interface fil1 cannot be used in more than 2 active policies
Runtime Status                         : inactive
Detailed Status                        : Filter interface fil1 cannot be used in more than 2 active policies
Priority                               : 100
Overlap Priority                       : 0
# of switches with filter interfaces   : 1
# of switches with delivery interfaces : 1
# of switches with service interfaces  : 0
# of filter interfaces                 : 1
# of delivery interfaces               : 1
# of core interfaces                   : 0
# of services                          : 0
# of pre service interfaces            : 0
# of post service interfaces           : 0
Push VLAN                              : 4
Post Match Filter Traffic              : -
Total Delivery Rate                    : -
Total Pre Service Rate                 : -
Total Post Service Rate                : -
Overlapping Policies                   : none
Component Policies                     : none
Timestamping enabled                   : False
~ Match Rules ~
# Rule
-|-----------|
1 1 match any

~~~~~~~~~~~~~~~~~~~~~~~~~~~~~~~~~~ Filter Interface(s) ~~~~~~~~~~~~~~~~~~~~~~~~~~~~~~~~~~
# DMF IF Switch  IF Name    State Dir Packets Bytes Pkt Rate Bit Rate Counter Reset Time
-|------|-------|----------|-----|---|-------|-----|--------|--------|------------------|
1 fil1   filter1 ethernet12 up    rx  0       0     0        -

~~~~~~~~~~~~~~~~~~~~~~~~~~~~~~~~ Delivery Interface(s)  ~~~~~~~~~~~~~~~~~~~~~~~~~~~~~~~~
# DMF IF Switch IF Name    State Dir Packets Bytes Pkt Rate Bit Rate Counter Reset Time
-|------|------|----------|-----|---|-------|-----|--------|--------|------------------|
1 del3   core1  ethernet14 up    tx  0       0     0        -

~ Service Interface(s) ~
None.

~ Core Interface(s) ~
None.

~ Failed Path(s) ~
None.
These inactive policies are displayed in the fabric errors as shown below with Policy Name and Error.
controller-1# show fabric errors policy-error
~~~~~~~~~~~~~~~~~~~~~~~~~~~~~~ Policy related error ~~~~~~~~~~~~~~~~~~~~~~~~~~~~~~
# Policy Name Error
-|-----------|-------------------------------------------------------------------|
1 policy3     Filter interface fil1 cannot be used in more than 2 active policies
policy2 is configured with an expiration duration of 180 seconds as shown below.
controller-1# show running-config policy policy2
! policy
policy policy2
 action forward
 delivery-interface del2
 filter-interface fil1
 start on-date-time 2026-01-05T20:07:36+00:00
 stop on-date-time 2026-01-05T20:10:36+00:00
 1 match any
After 180 seconds, policy2 is marked as inactive due to its expired duration. Here policy policy3 is installed automatically as the existing installed overlap policy policy2 becomes expired.
This feature does not apply to policies that are expired because they exceeded the configured duration as shown in the following example:
controller-1# start now duration 40 seconds
controller-1#(config-policy)# show this

! policy
policy POLICY1
  action capture
  filter-interface TAP-TOOL-F3-1
  start on-date-time 2026-01-06T23:17:25+00:00
  stop on-date-time 2026-01-06T23:18:05+00:00
  1 match any
controller-1#(config-policy)#
Viewing Information about Policies
Installing and activating overlapping policies may take more than a minute, depending on the number of overlapping policies and the number of rules in each policy.
Viewing Policy Flows
The show policy-flow command lists all the flows installed by the DANZ Monitoring Fabric (DMF) application on the switches in the monitoring fabric. The following is the command syntax:
show policy-flow policy_name
Flows are sorted on a per-policy basis. Each flow entry includes the configured policy name. The packet and byte count is affiliated with each flow entry, as shown in the following example:
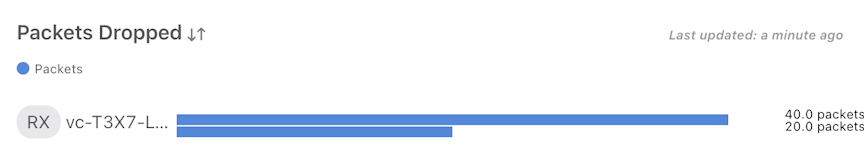
The drops option displays the current value of the transmit drop packet counters at the filter, delivery, and core interfaces for the specified policy, as shown in the following example:
controller-1# show policy p1 drops
~~~~~~~~~~~~~~~~~~~~~~~~~~~~~~~~~~~~~~~~~~~~~~~~~~~~~~~ Filter Interface(s) Drops ~~~~~~~~~~~~~~~~~~~~~~~~~~~~~~~~~~~~~
# IF  Switch IF               Name     state speed   Xmit Drops Pkt Count Xmit Drops Pkt Rate Rx Drops Pkt Count Rx Drops Pkt Rate
-|---|-----------------------|--------|-----|-------|--------------------|-------------------|------------------|-----------------|
1 f1  00:00:00:00:00:00:00:0c s12-eth1 up    10 Gbps 0                    0                   0                  0
~~~~~~~~~~~~~~~~~~~~~~~~~~~~~~~~~~~~~~~~~~~~~~~~~~~~~~ Delivery Interface(s) Drops ~~~~~~~~~~~~~~~~~~~~~~~~~~~~~~~~~~~~
# IF  Switch IF               Name     state speed   Xmit Drops Pkt Count Xmit Drops Pkt Rate Rx Drops Pkt Count Rx Drops Pkt Rate
-|---|-----------------------|--------|-----|-------|--------------------|-------------------|------------------|-----------------|
1 d1  00:00:00:00:00:00:00:0c s12-eth2 up    10 Gbps 0                    0                   0                  0
~ Core Interface(s) Drops ~
None.
~ Service Interface(s) Drops ~
None.
Using Rule Groups
DANZ Monitoring Fabric (DMF) supports using an IP address group in multiple policies, referring to the group by name in match rules. If no subnet mask is provided in the address group, it is assumed to be an exact match. For example, for an IPv4 address group, no mask is interpreted as a mask of /32. For an IPv6 address group, no mask is interpreted as /128.
Identify only a single IP address group for a specific policy match rule. Address lists with both src-ip and dst-ip options cannot be used in the same match rule.
Using the GUI to Configure Rule Groups
In this release, the Rule Groups Dashboard aligns with modern User Interface (UI) standards used throughout DMF. This view maintains full functional parity with the previous version while delivering a consistent and unified user experience.
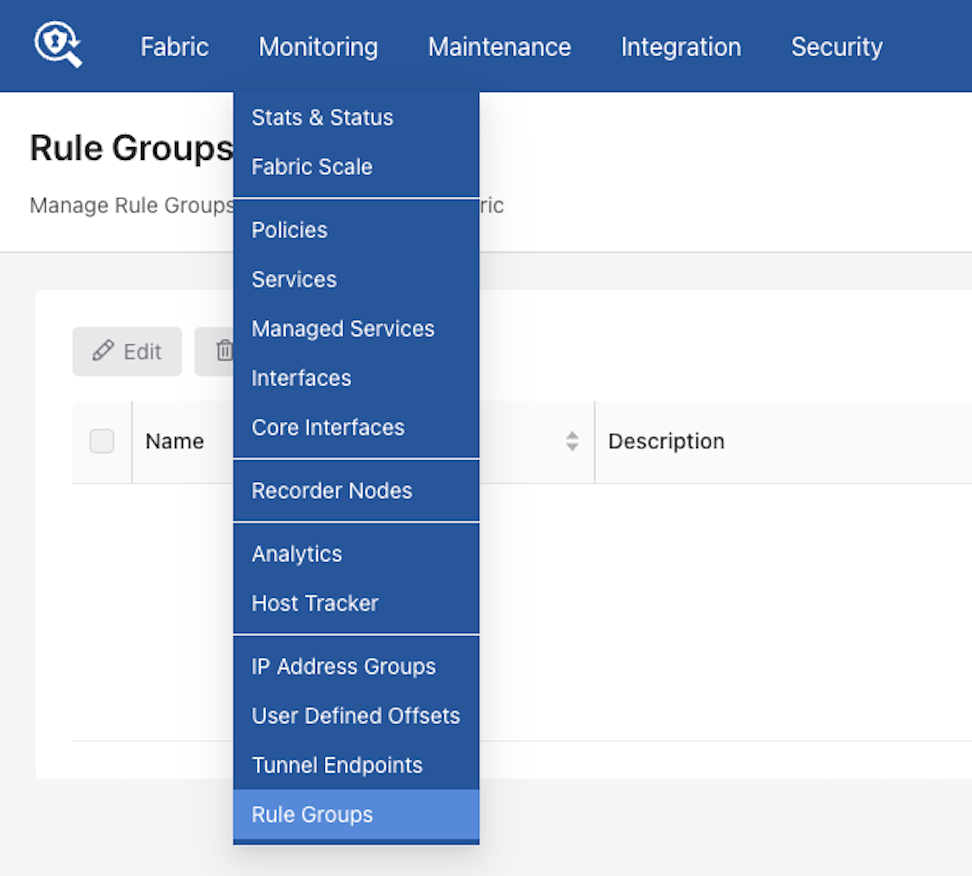
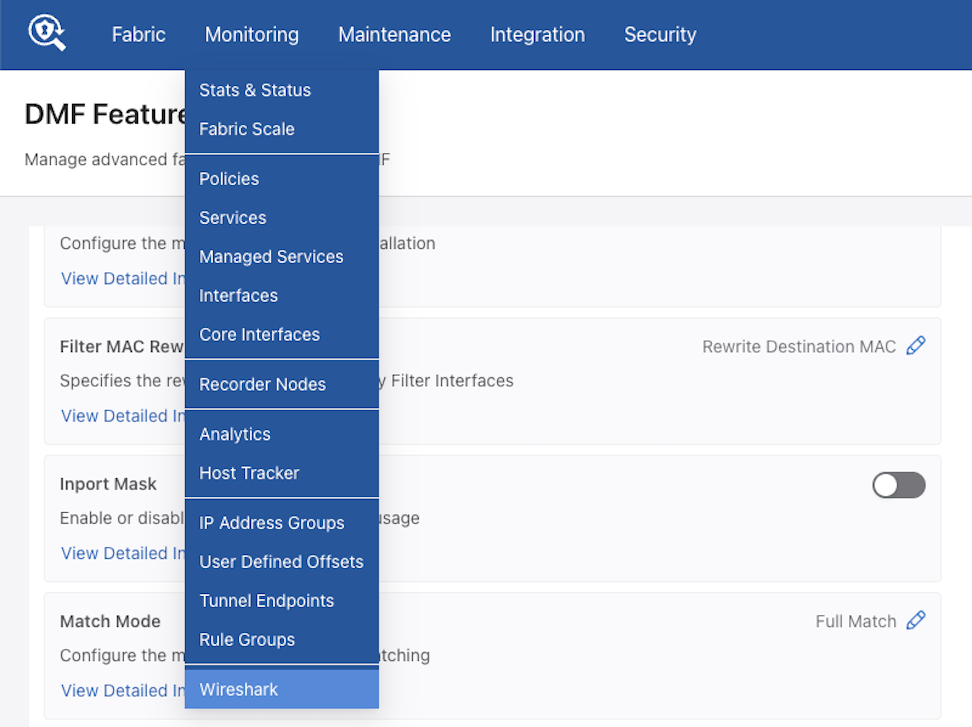
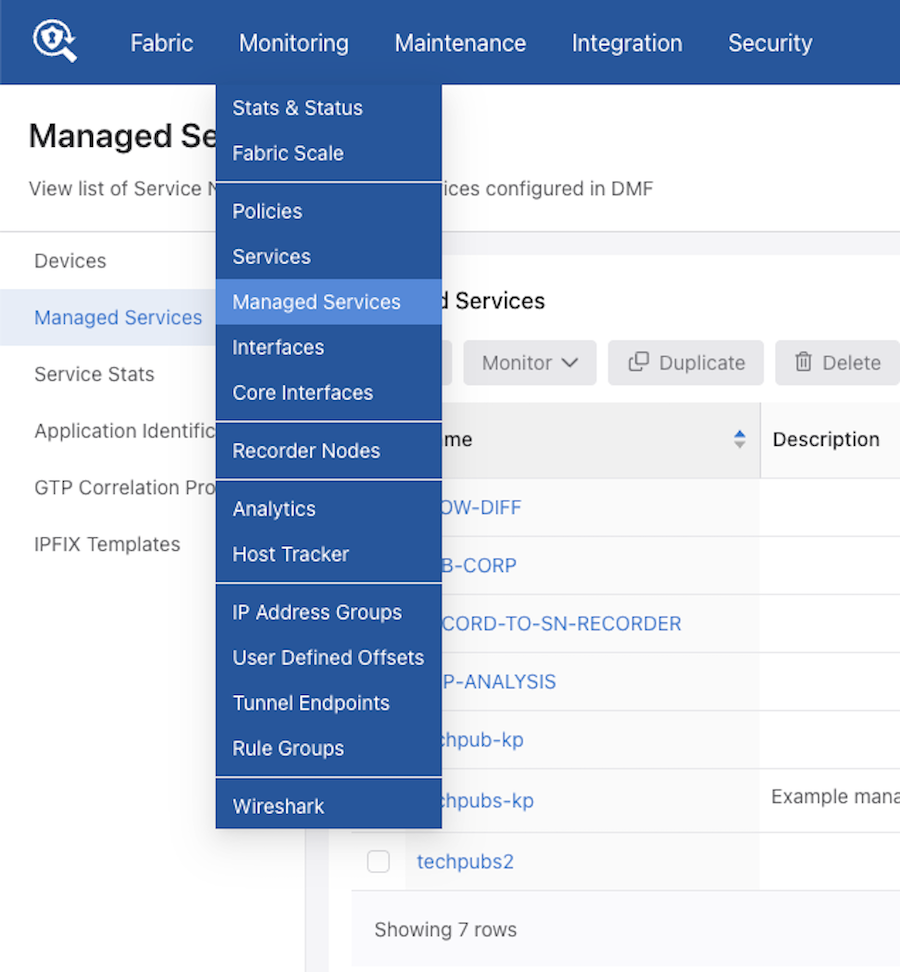
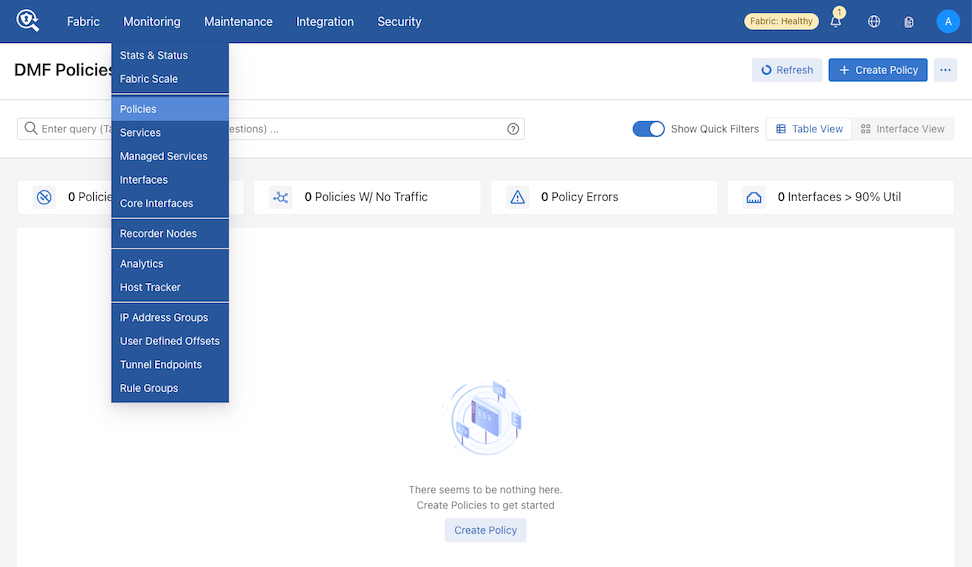
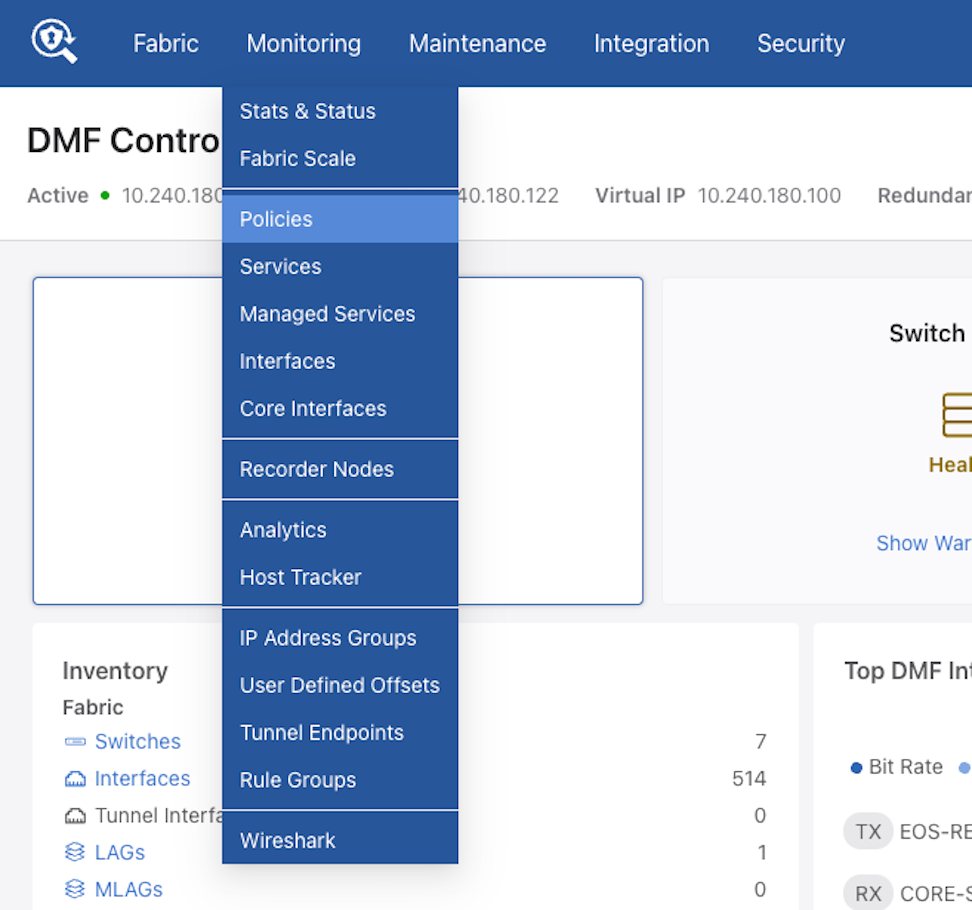
Access Rule Groups through the main navigation menu under Monitoring.
Figure 17. Monitoring - Rules Group
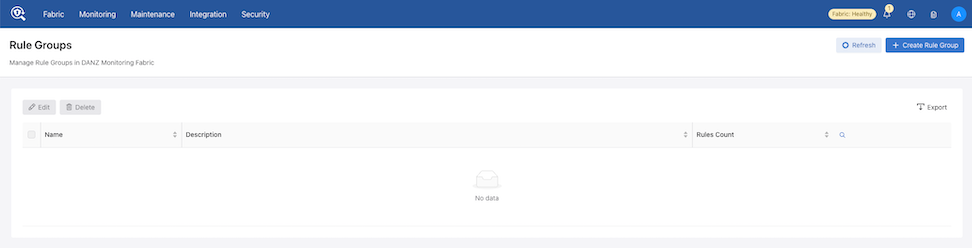
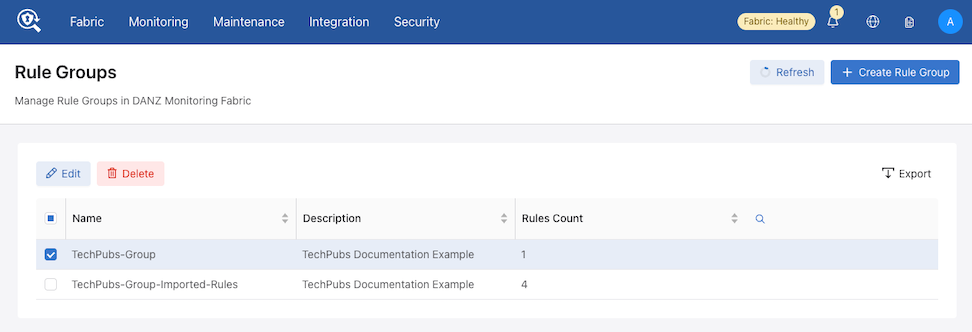
The dashboard presents a tabular view of all configured rule groups.
Figure 18. Rule Groups Dashboard
Follow the steps outlined in the following content to manage rule groups and rules (Create, Import, Edit, or Delete):
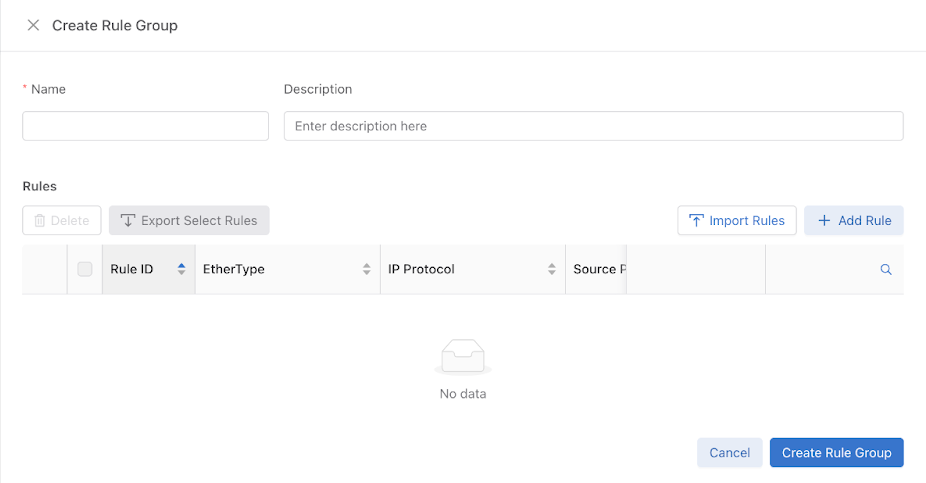
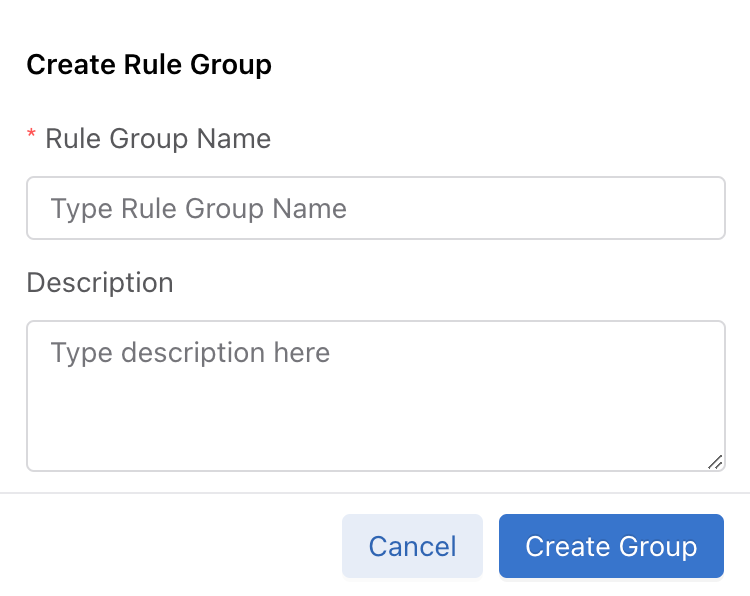
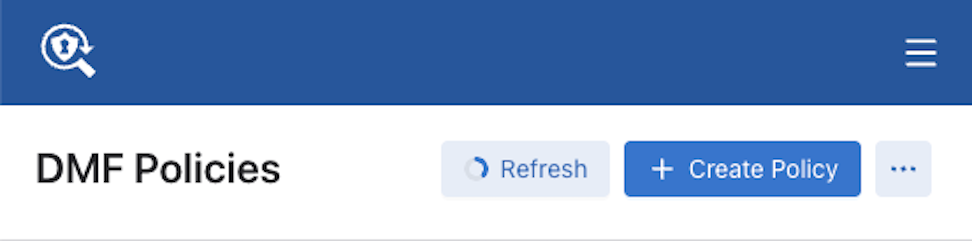
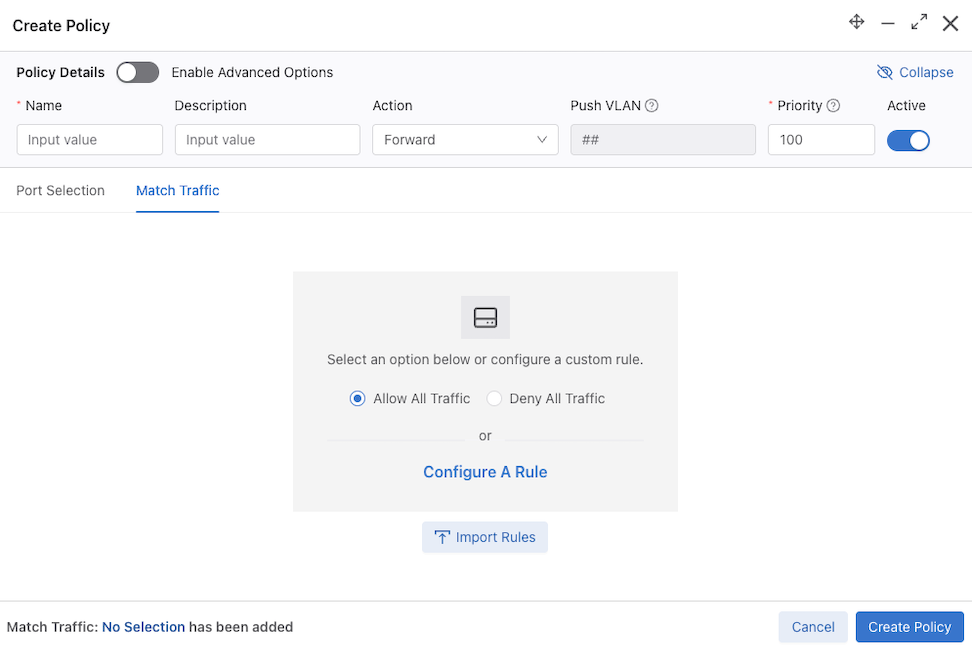
From the Rules Group dashboard select + Create Rule Group.
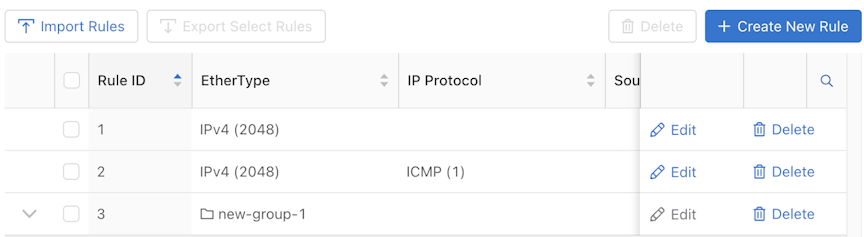
Figure 19. Creating Rule Groups
Note: The workflows within this drawer align with the Policies dashboard to ensure a consistent user experience. Use the controls Import Rules and + Add Rule to add or import individual rules.
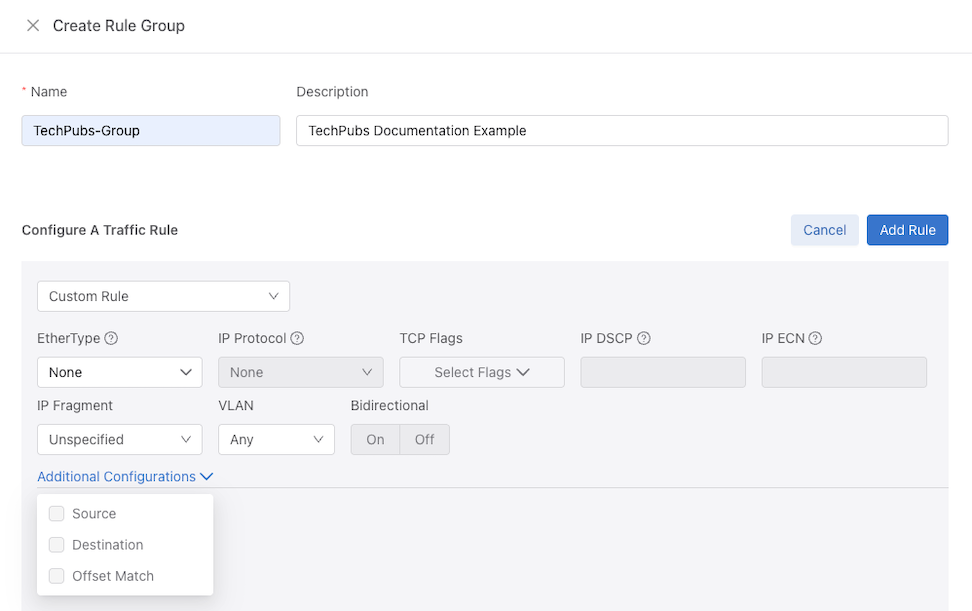
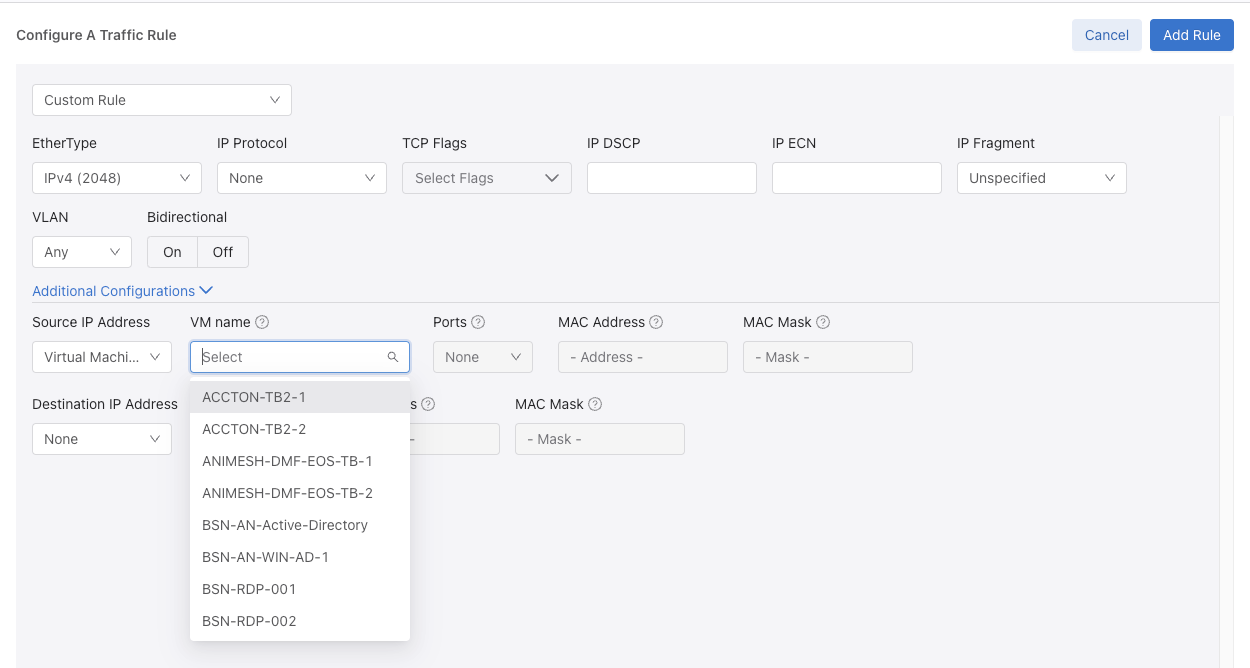
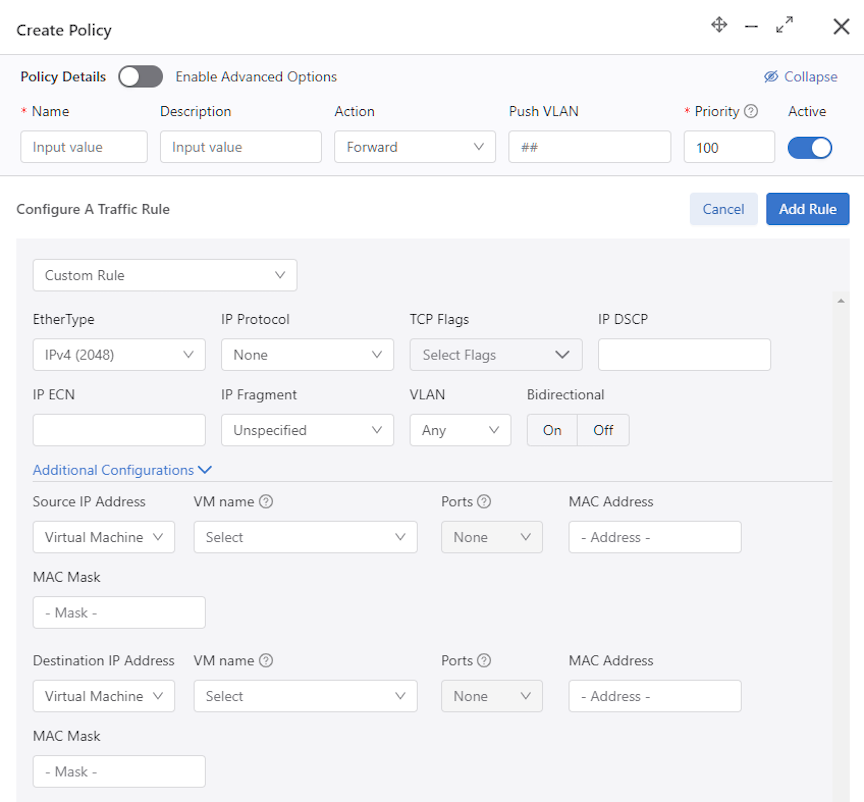
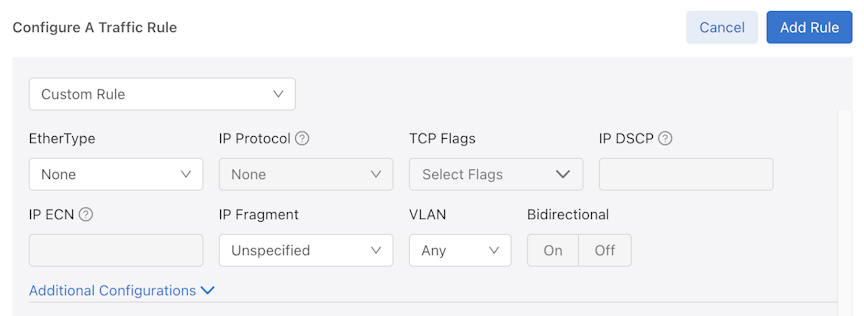
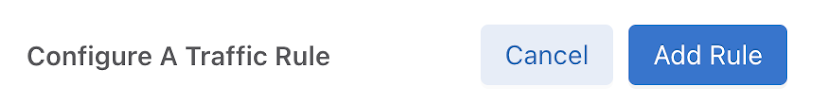
To add a Single Rule, select Add Rule.
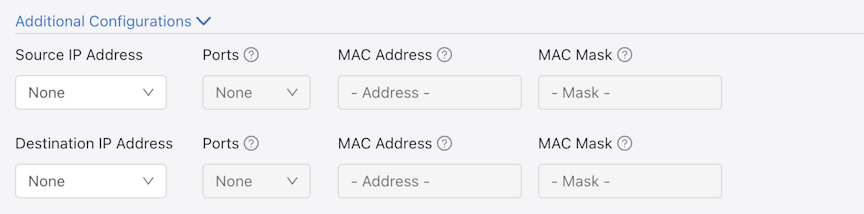
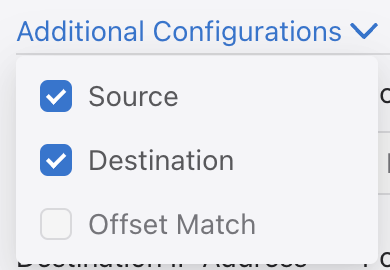
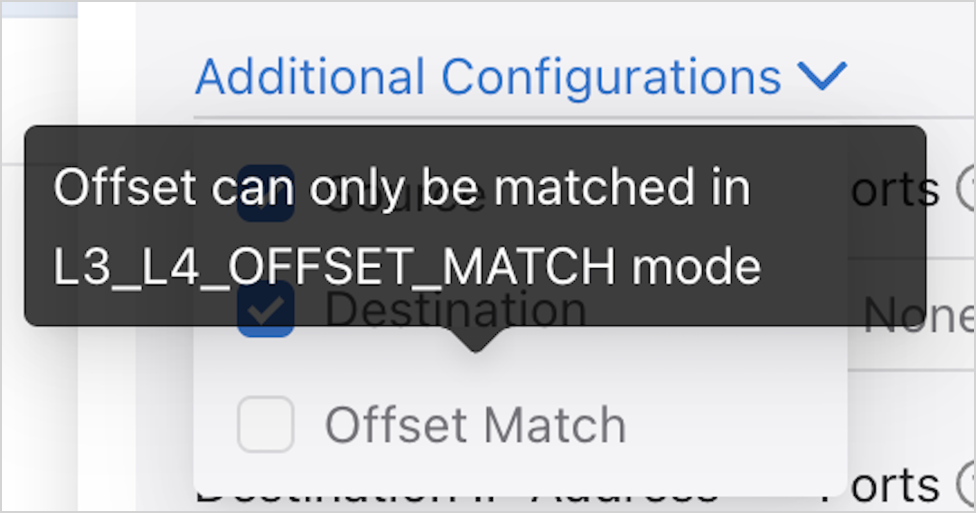
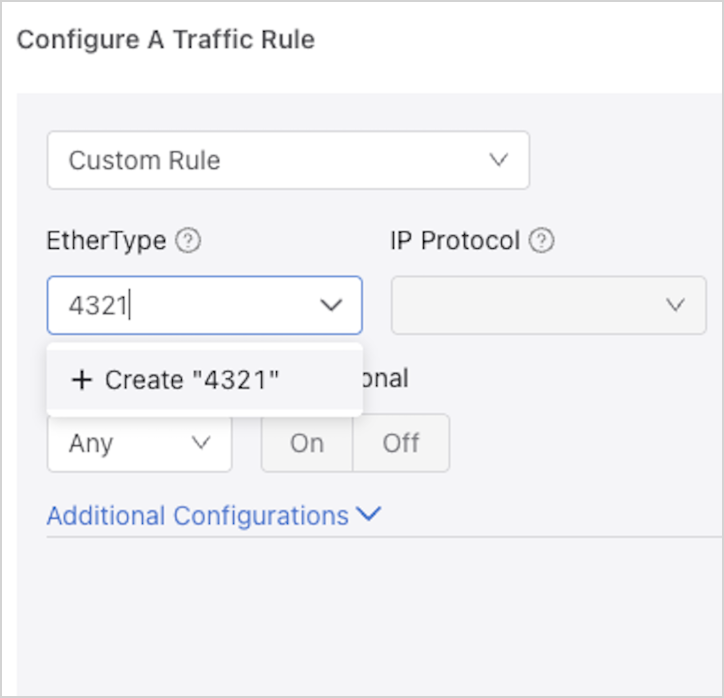
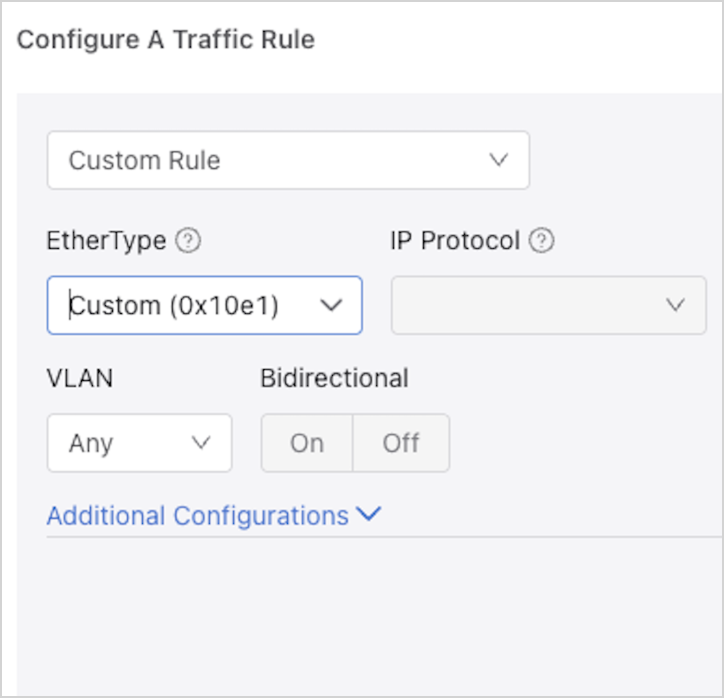
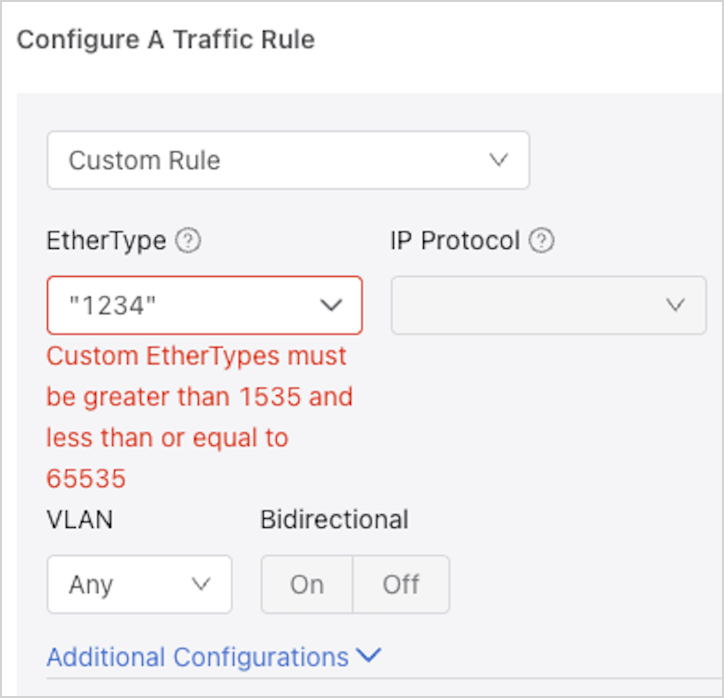
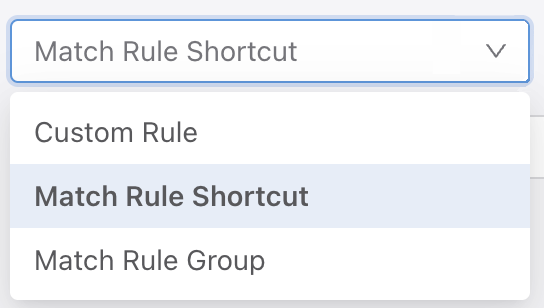
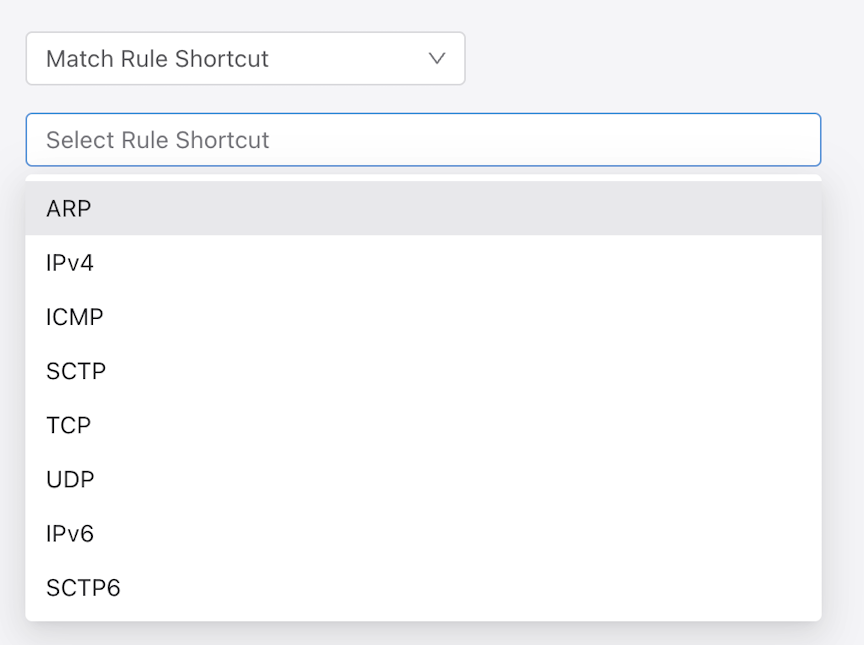
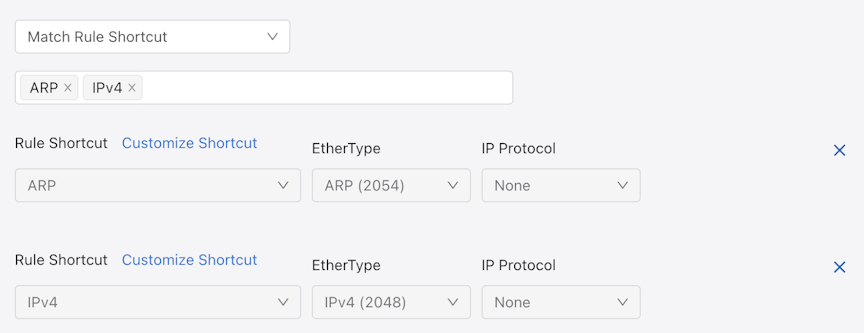
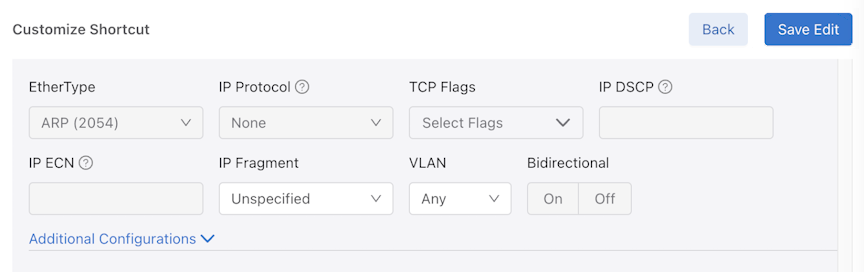
Populate the applicable fields in the configuration form including a Name and an optional Description. Use the Additional Configurations drop-down to enter parameters related to the chosen traffic rule.
Use Add Rule to save the entry.
Figure 20. Add Single Rule
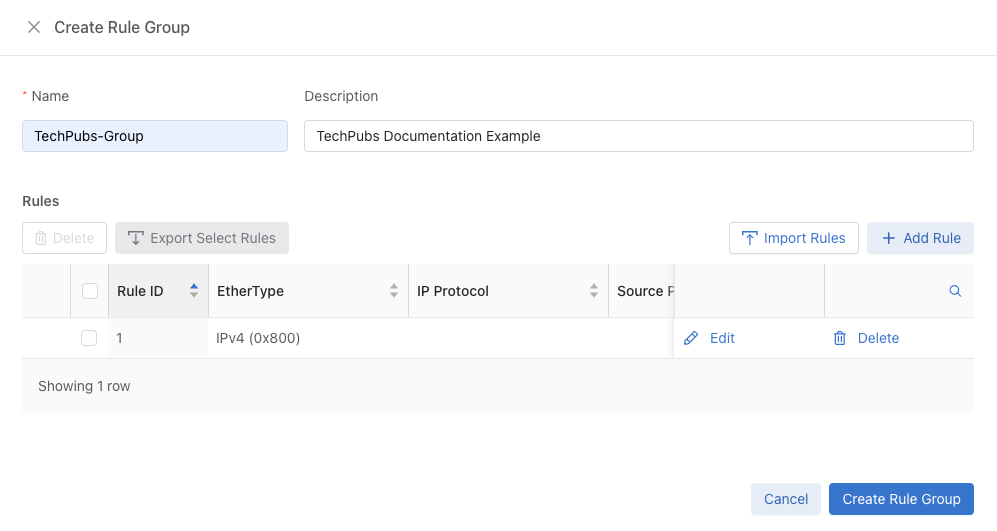
Select Create Rule Group to save the rule group.
Figure 21. Save Rule Group
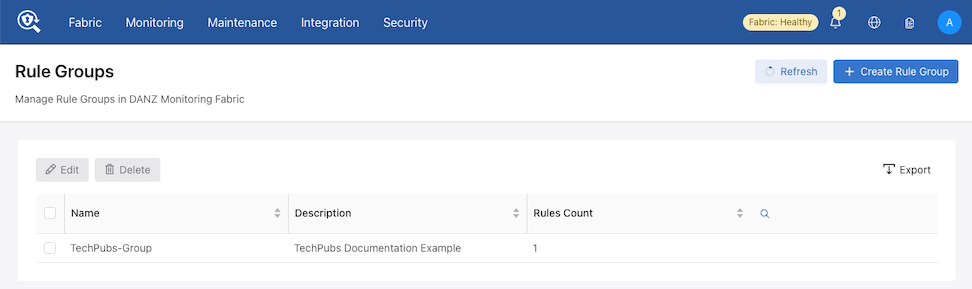
The newly created rule group appears in the Rule Groups dashboard.
Figure 22. Updated Rule Group Dashboard
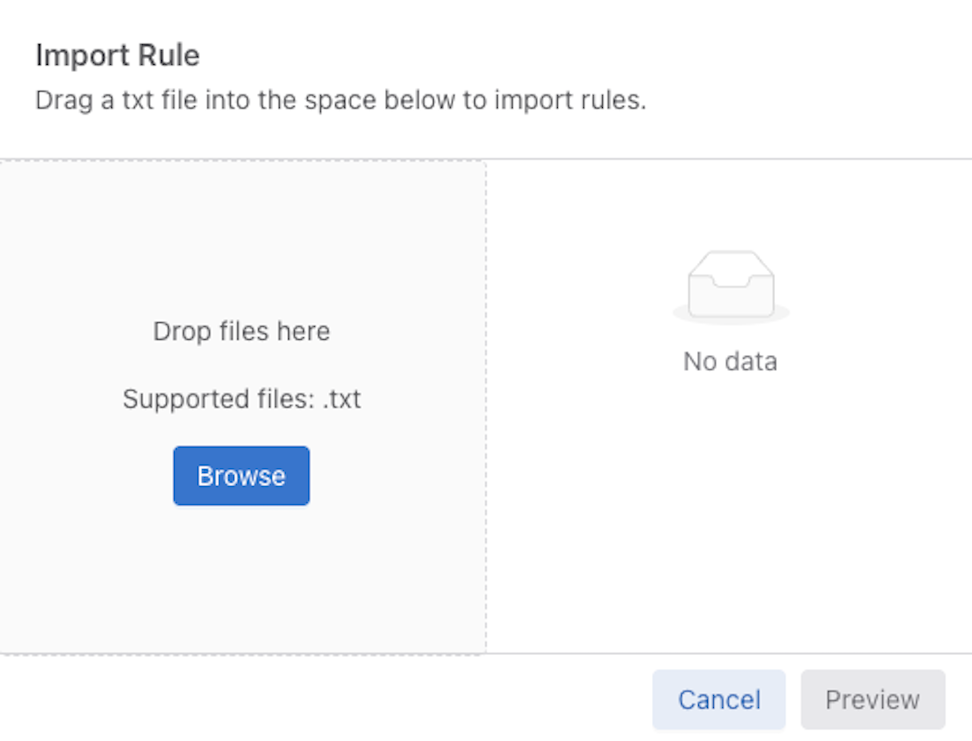
The Import Rules function uploads rule configurations from a text file.
Choose an existing rule group from the Rule Groups dashboard or select + Create Rule Group followed by Import Rules to open the configuration dialog.
Figure 23. Create Rule Group - Import Rules
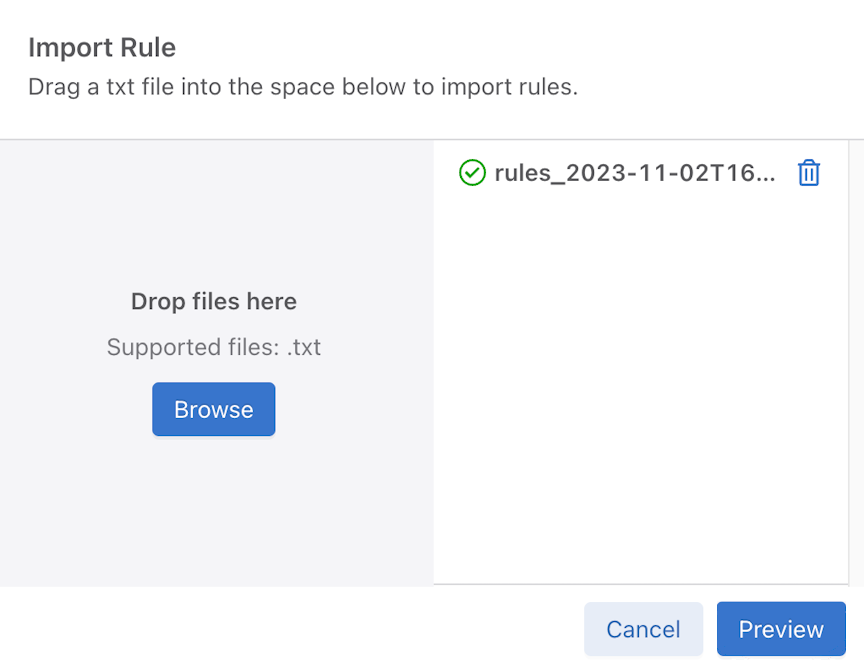
The Import Rule window appears.
Figure 24. Import Rule
Upload a .txt file using the Browse function or by dragging and dropping the file into the upload area.
1 match ip
2 match tcp
3 match tcp src-port 80
4 match tcp dst-port 25
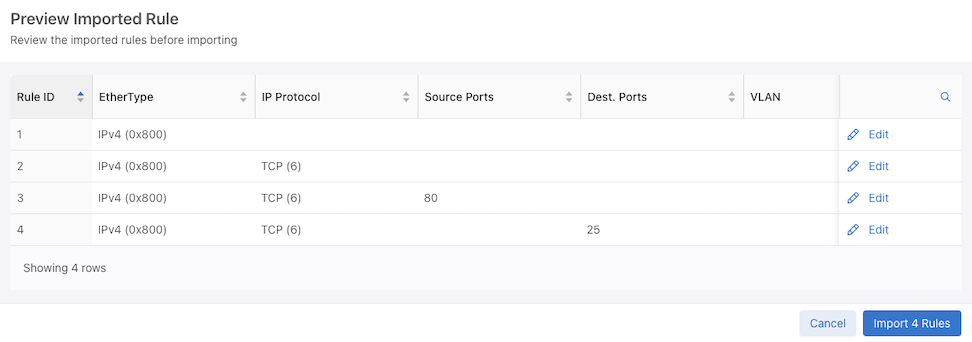
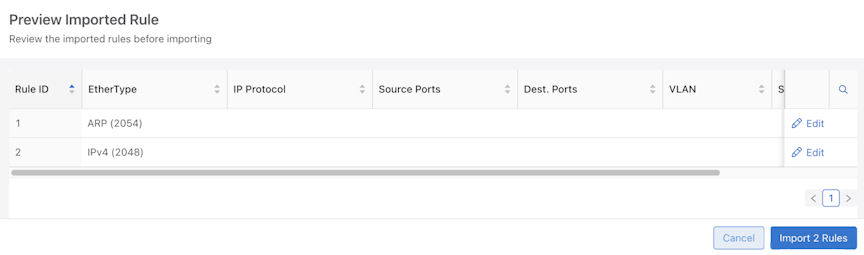
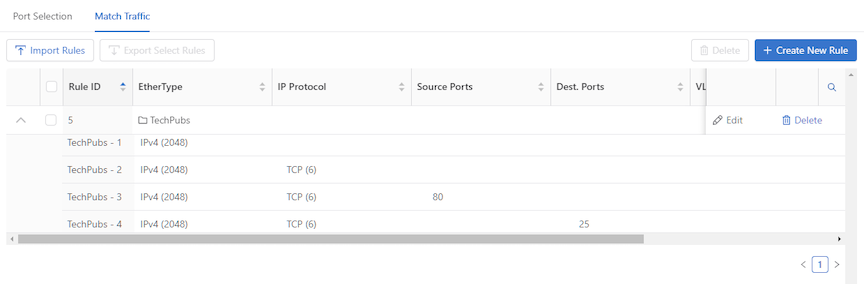
Select Preview to verify the parsed rules.
Figure 25. Preview Imported Rule
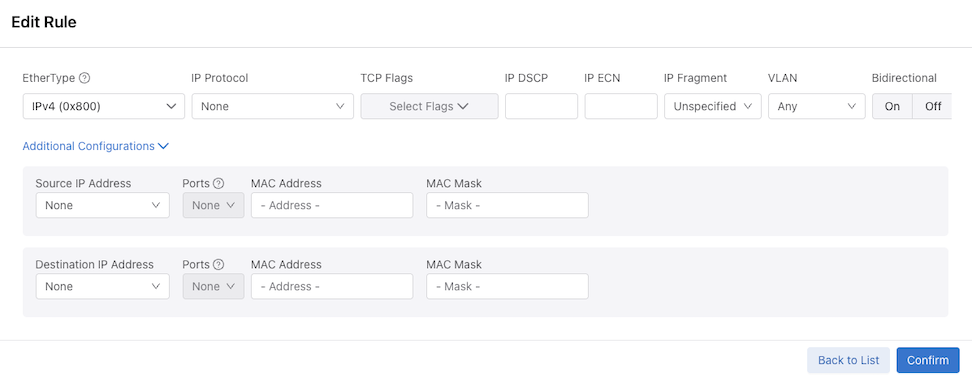
Optional Step: Select Edit next to an entry in the Preview Imported Rule table to modify specific rule parameters.
Figure 26. Edit Imported Rule
Select Confirm to finalize the preview.
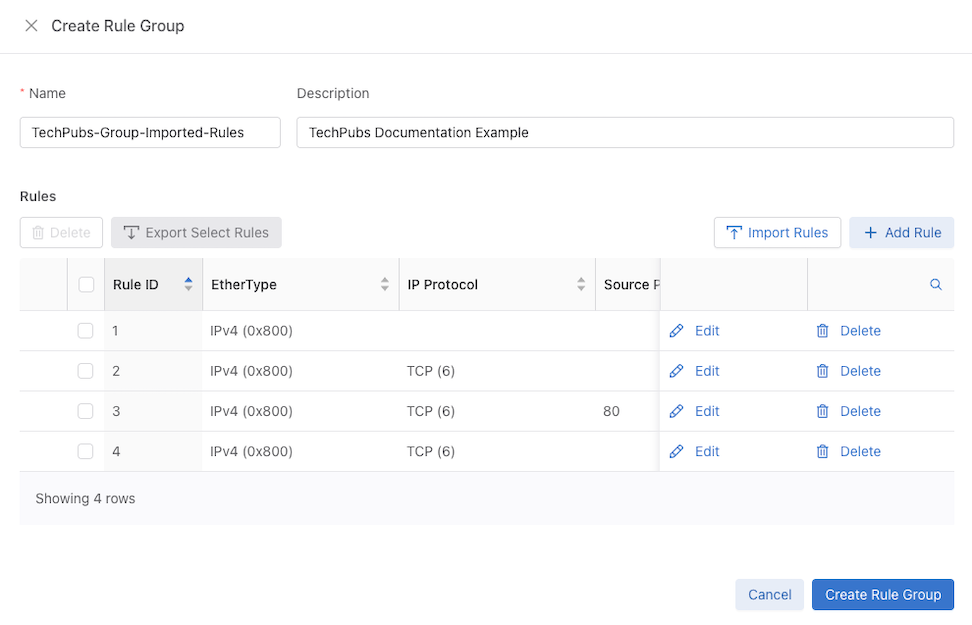
After returning to the Preview Imported Rule dashboard, use Import [x] Rules to complete the process.
Select Create Rule Group to save the rule group.
Figure 27. Create Imported Rule Group
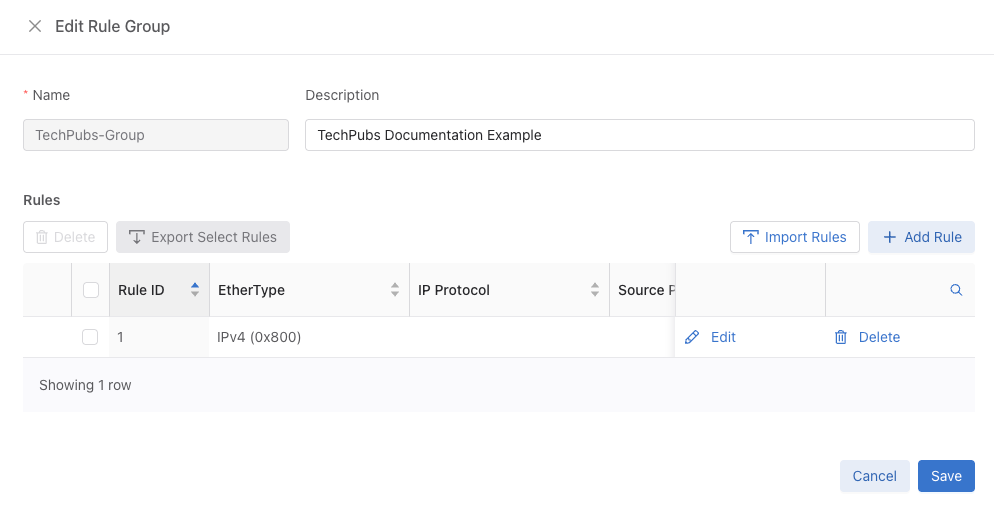
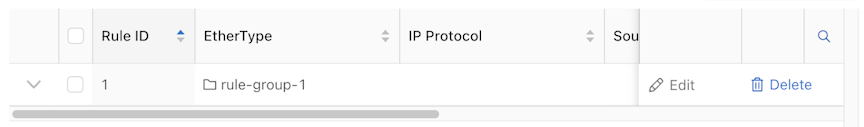
Editing a Rule Group.
Select the target row in the table.
Use the Edit button.
Figure 28. Edit Rule Group
The system opens the editing panel (identical to the creation interface).
Figure 29. Edit Rule Group
Select Save to update the rule group.
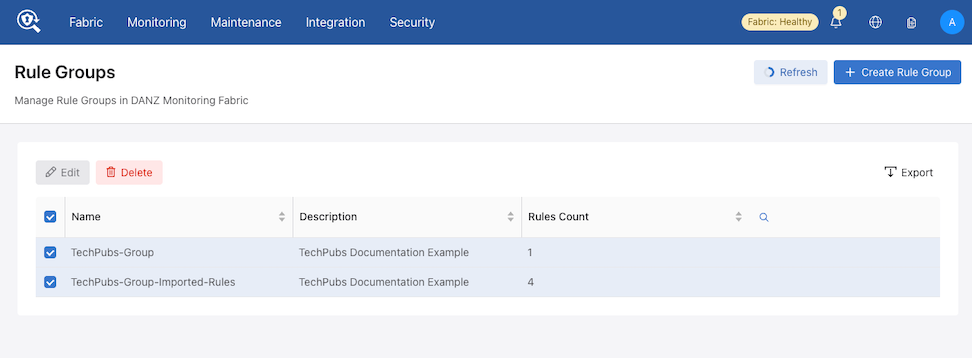
Deleting a Rule Group
Select one or more rows in the table.
Figure 30. Delete Rule Groups
Use the Delete button.
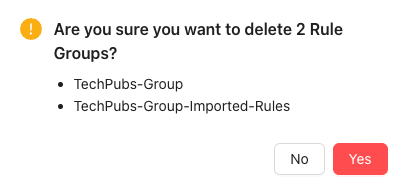
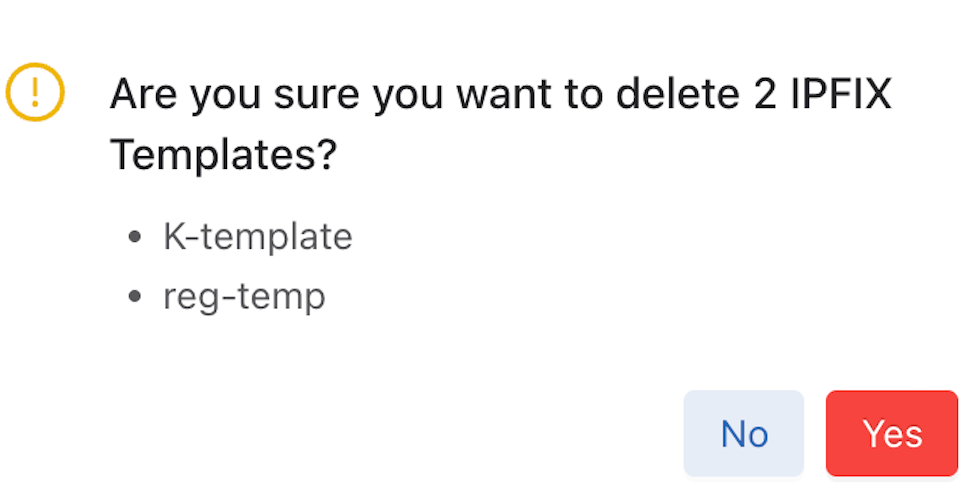
The system displays a confirmation dialog.
Figure 31. Confirm Delete
Select Yes to permanently delete the selected rule groups.
Using the CLI to Configure Interface Groups
The following example describes configuring two interface groups: a filter interface group, TAP-PORT-GRP, and a delivery interface group, TOOL-PORT-GRP.
To view information about the interface groups in the DANZ Monitoring Fabric (DMF) fabric, enter the show filter-interface-group command, as in the following examples:
Filter Interface Groups
controller-1(config-filter-interface-group)# show filter-interface-group
! show filter-interface-group TAP-PORT-GRP
# Name Big Tap IF Name                    Switch            IF Name    Direction Speed   State VLAN Tag
-|------------|--------------------------|-----------------|----------|---------|-------|-----|--------|
1 TAP-PORT-GRP TAP-PORT-1                 DMF-CORE-SWITCH-1 ethernet17 rx        100Gbps up           0
2 TAP-PORT-GRP TAP-PORT-2                 DMF-CORE-SWITCH-1 ethernet18 rx        100Gbps up           0
controller1(config-filter-interface-group)#
Delivery Interface Groups
controller1(config-filter-interface-group)# show delivery-interface-group
! show delivery-interface-group DELIVERY-PORT-GRP
# Name Big Tap      IF Name         Switch                IF Name    Direction Speed  Ratelimit State Strip Forwarding Vlan
-|-----------------|---------------|---------------------|----------|---------|------|---------|-----|---------------------|
1 TOOL-PORT-GRP     TOOL-PORT-1     DMF-DELIVERY-SWITCH-1 ethernet15 tx        10Gbps           up    True
2 TOOL-PORT-GRP     TOOL-PORT-2     DMF-DELIVERY-SWITCH-1 ethernet16 tx        10Gbps           up    True
controller-1(config-filter-interface-group)#
PTP Timestamping
DANZ Monitoring Fabric (DMF) rewrites the source MAC address of packets that match a policy with a 48-bit timestamp value sourced from a high-precision hardware clock.
Connect a switch with a filter interface to a PTP network with a dedicated interface for the Precision Time Protocol. With a valid PTP interface, the switch will be configured in boundary clock mode and can sync the hardware clock with an available Grandmaster clock.
Once configuring a policy to use timestamping, any packet matching on this policy will get its source MAC address rewritten with a timestamp value. The same holds true for any overlapping policy that carries traffic belonging to a user policy with timestamp enabled.
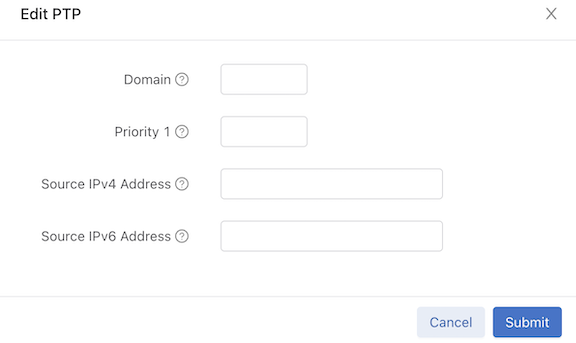
The following options are available to configure a switch in boundary mode:
domain: Value for data plane PTP domain (0-255) (optional)
Priority1: Value of priority1 data plane PTP (0-255) (optional)
Source IPv4 Address: Used to restamp PTP messages from a switch to the endpoints (optional)
Source IPv6 Address: Used to restamp PTP messages from a switch to the endpoints (optional)
The following options are available to configure an interface with role “ptp”:
Announce Interval: Set ptp announce interval between messages (-3,4). Default is 1 (optional)
Delay Request Interval: Set ptp delay request interval between messages (-7,8). The default is 5 (optional)
Sync Message Interval: Set ptp sync message interval between messages (-7,3). The default is 0 (optional)
PTP Vlan: VLANs used for Trunk or Access mode of operation for a ptp interface
A policy should have enabled timestamping and have its filter interfaces on a switch with a valid PTP config to get its packets timestamped.
Platform Compatibility
DANZ Monitoring Fabric (DMF) supports the timestamping feature on 7280R3 switches.
Use the show switch all property command to check which switch in DMF fabric supports timestamping. If the following properties exist in the output, the feature is supported:
Note: Configuring the PTP domain for the distribution of PTP-based time sync in the network is beyond the scope of this document. The assumption is the network exists with a PTP domain and all necessary components.
Configuring PTP Timestamping using the CLI
Configure the switch at a global level under the config submode in the CLI or for each switch under the config-switch submode. Irrespective of the place, it has the following options:
Domain: Set the data plane PTP domain. The default value is 0. Valid values are [0 to 255] inclusive.
Priority1: Set the value of priority1 data plane PTP. The default value is 128. Valid values are [0 to 255] inclusive.
Source-ipv4-address: This is the source IPv4 address used to restamp PTP messages from this switch to the endpoints. Some master clock devices do not accept default source IP (0.0.0.0). If so, configureit can to sync with such devices. The default is 0.0.0.0 .
Source-ipv6-address: This is the source IPv6 address used to restamp PTP messages from this switch to the endpoints. Some master clock devices do not accept default source IP (::/0). If so, configure it to sync with such devices. The default is ::/0 .
All fields are optional, and default values are selected if not configured by the user.
Global Configuration
The global configuration is a central place to provide a common switch config for PTP. It only takes effect after creating a ptp-interface for a switch. Under the config submode, provide PTP switch properties using the following commands:
The local configuration provides a local PTP configuration or overrides a global PTP config for a selected switch. Select the switch using the command switchswitch name. PTP switch config (local or global) only takes effect after creating a ptp-interface for a switch. Under the config-switch submode, provide local PTP switch properties using the following commands:
(config)# switch eos
(config-switch)# ptp priority1 1 domain 2
Configuring PTP Timestamping using the GUI
Global Configuration
To view or edit the global PTP configuration, navigate to the DANZ Monitoring Fabric (DMF) Features page by selecting the gear icon.
Figure 32. DMF Menu Gear Icon
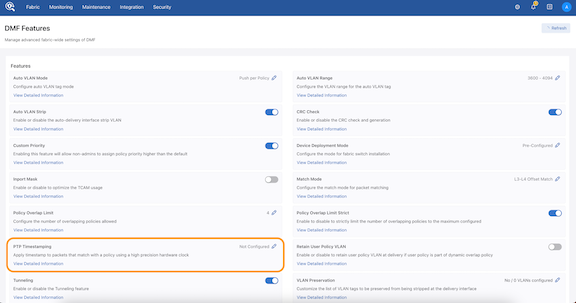
Scroll to the PTP Timestamping card and use Edit (pencil icon) to configure or modify the global PTP Timestamping settings.
Figure 33. DMF Features Page
Figure 34. Edit PTP
Local Configuration
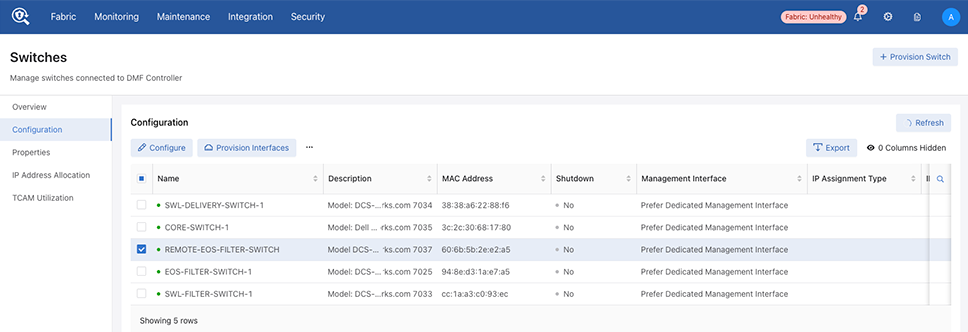
Provide a local PTP configuration for the switch or override the global PTP configuration for a selected switch while configuring or editing a switch configuration (under the PTP step) using Fabric > Switch > Configuration. Select a switch in the Configuration dashboard.
Figure 35. Configuration Dashboard
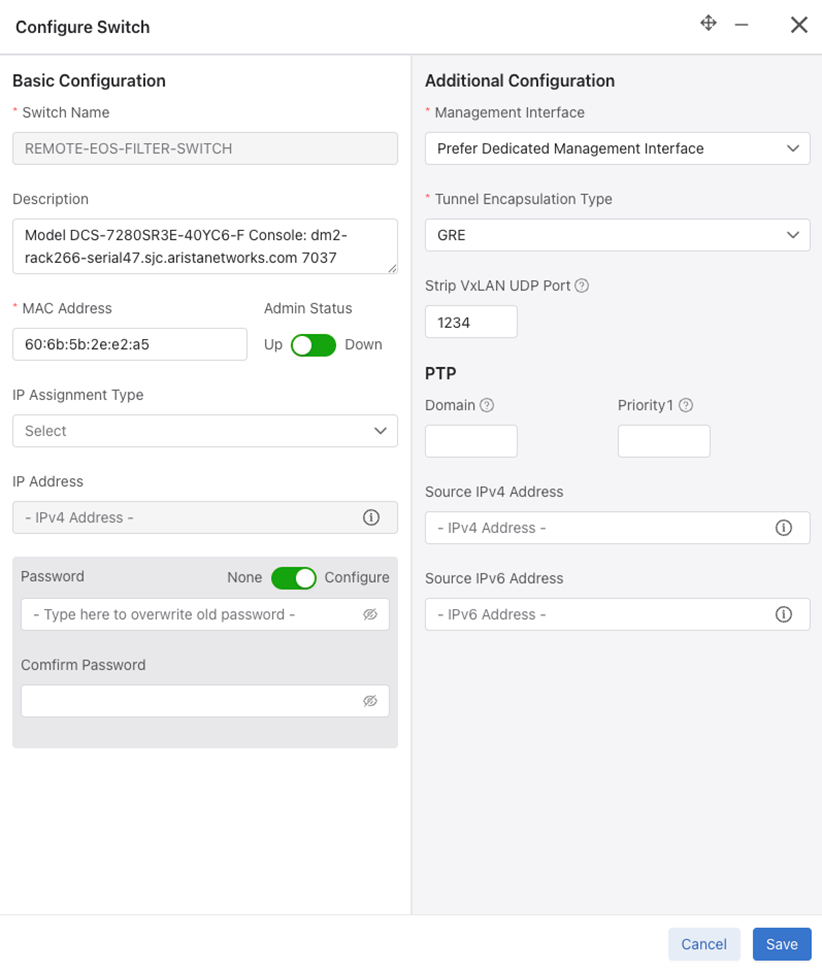
Select Configure.
Figure 36. Configure Switch
PTP Interface Configuration
Configure a PTP Interface on the Monitoring > Interfaces > Configuration > PTP dashboard.
Figure 37. PTP Interfaces
Select Create PTP Interface.
Figure 38. Create Interface
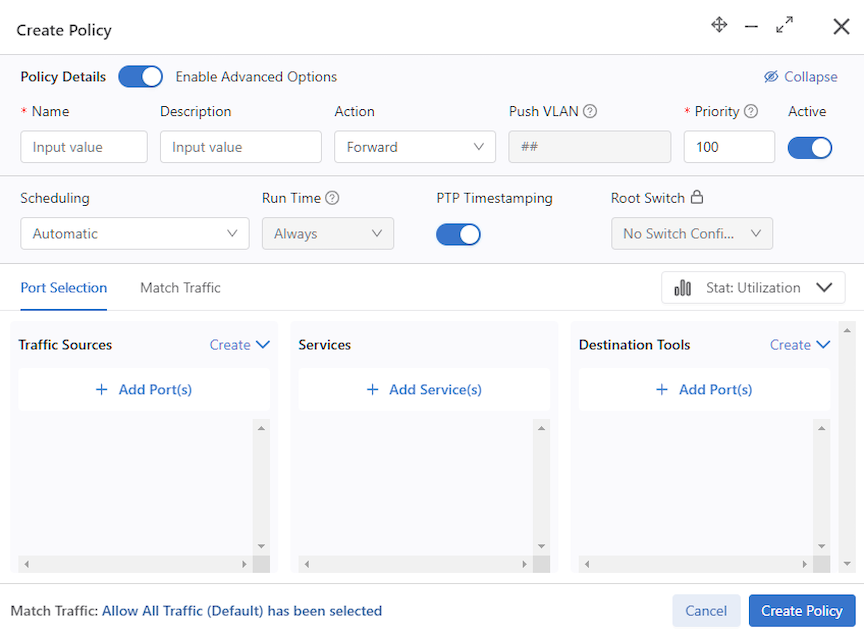
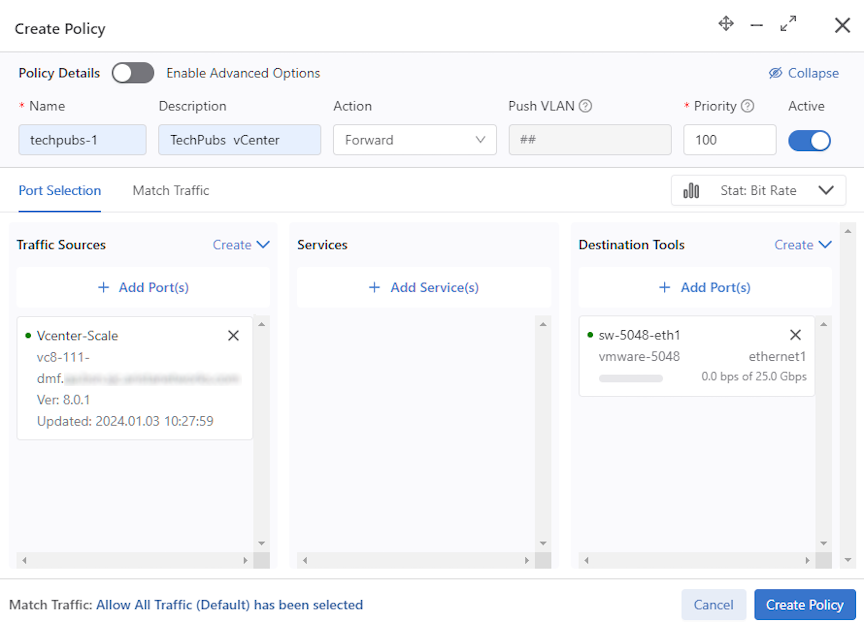
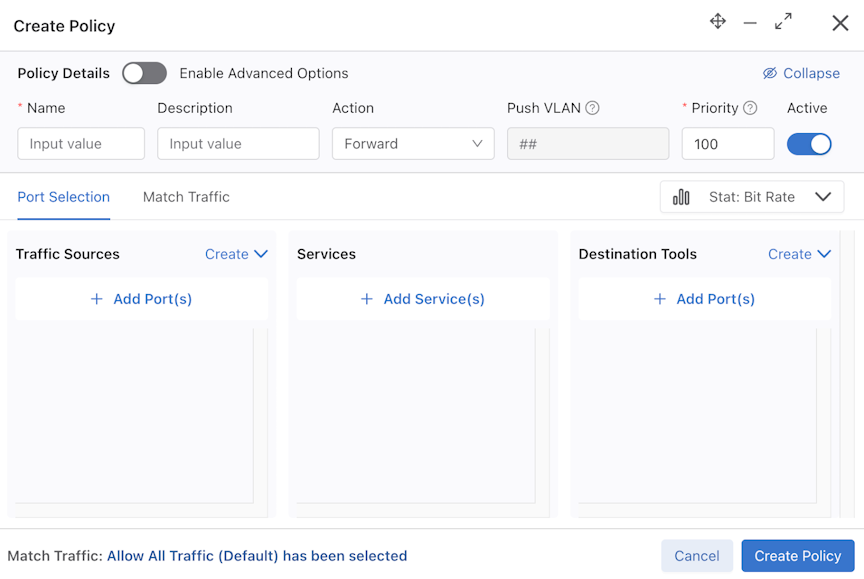
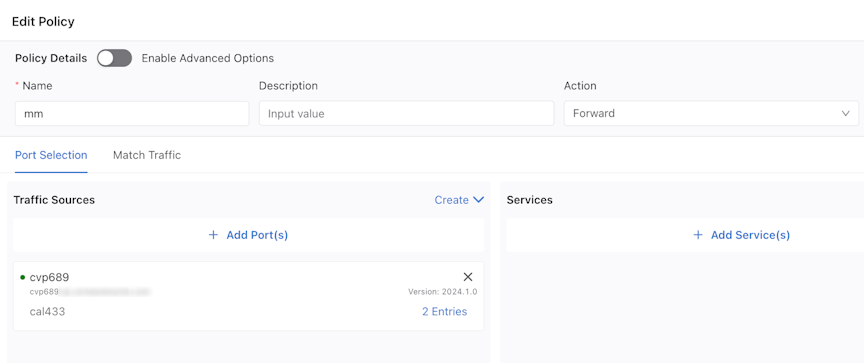
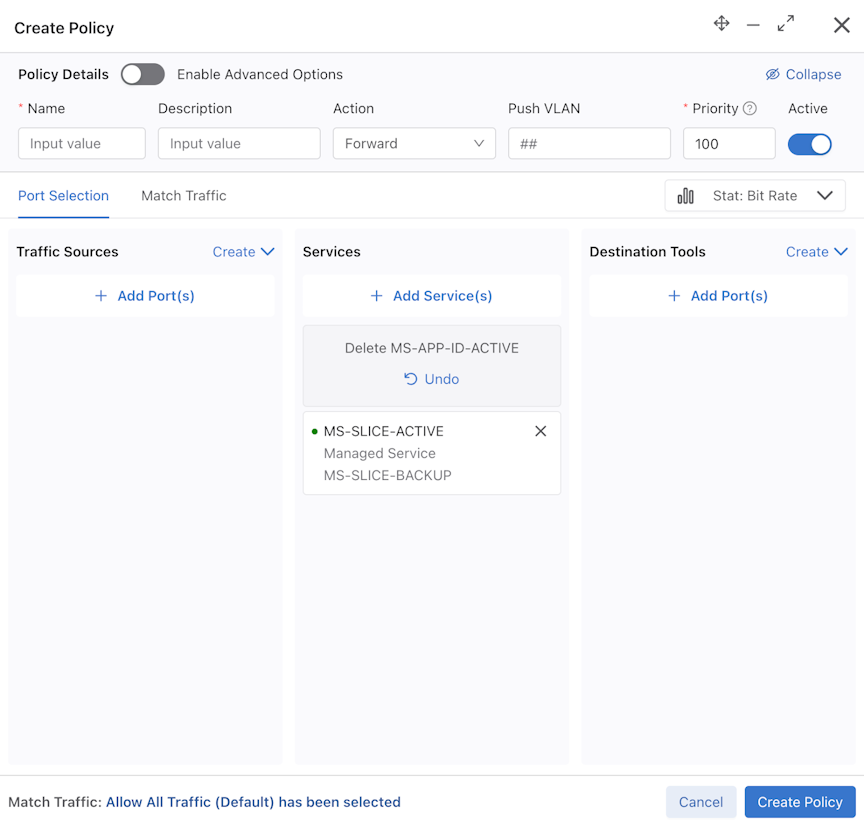
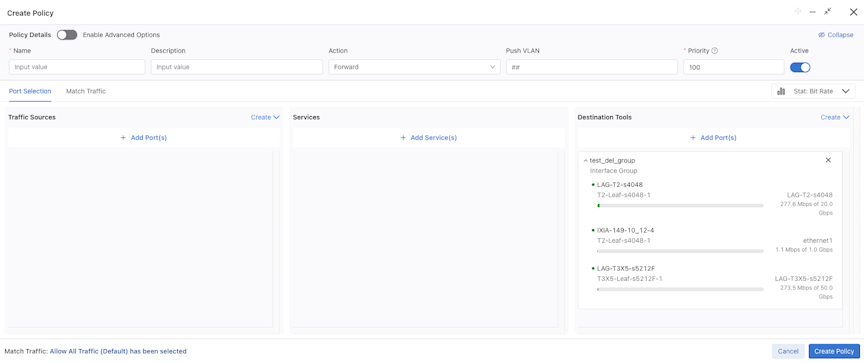
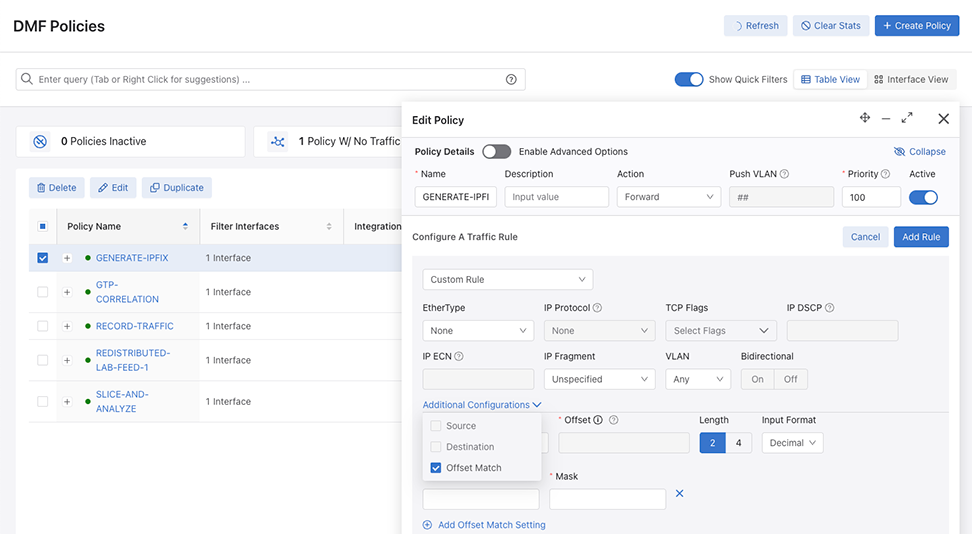
Timestamping Policy Configuration
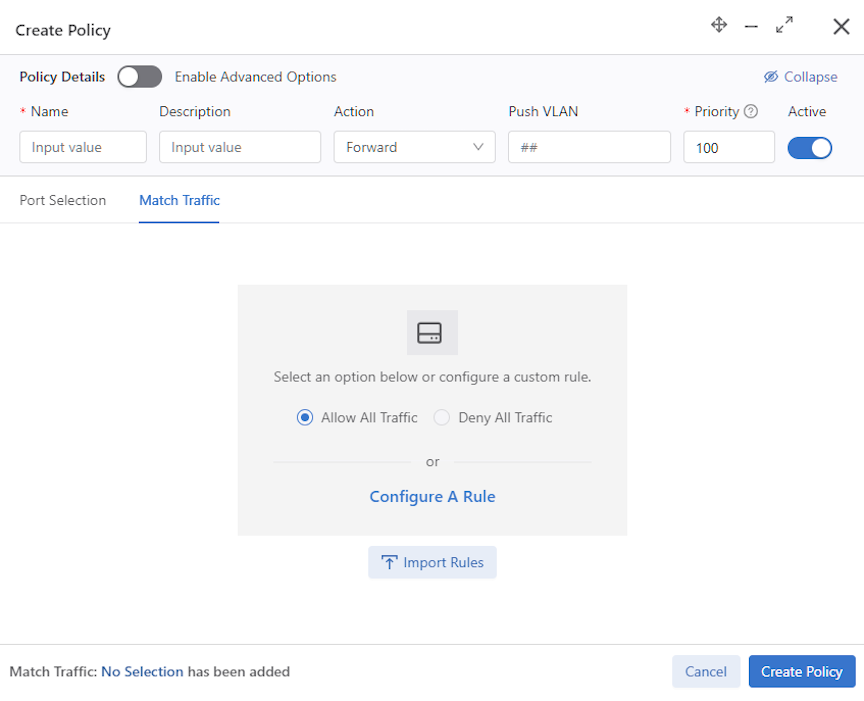
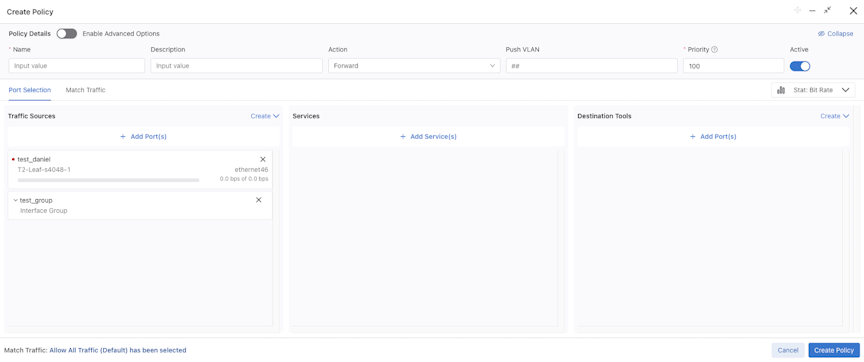
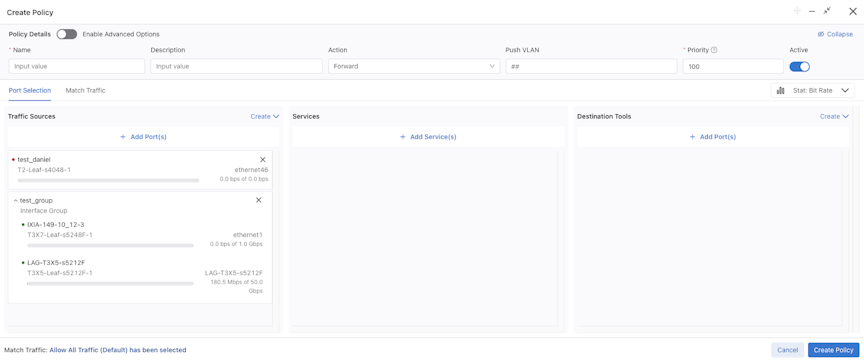
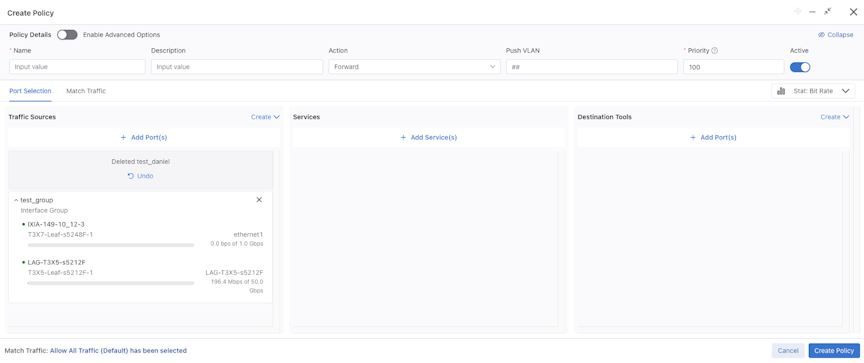
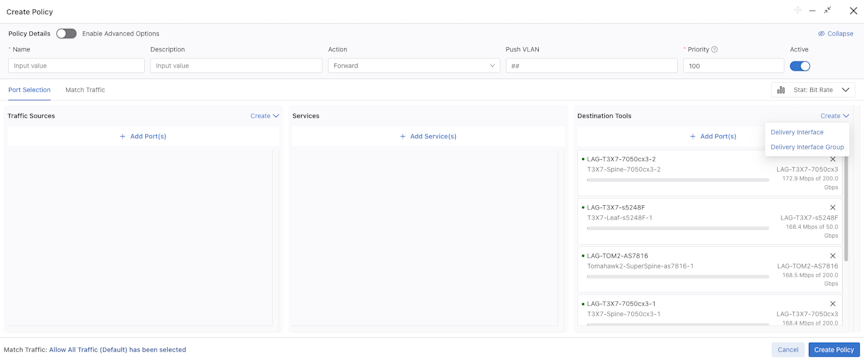
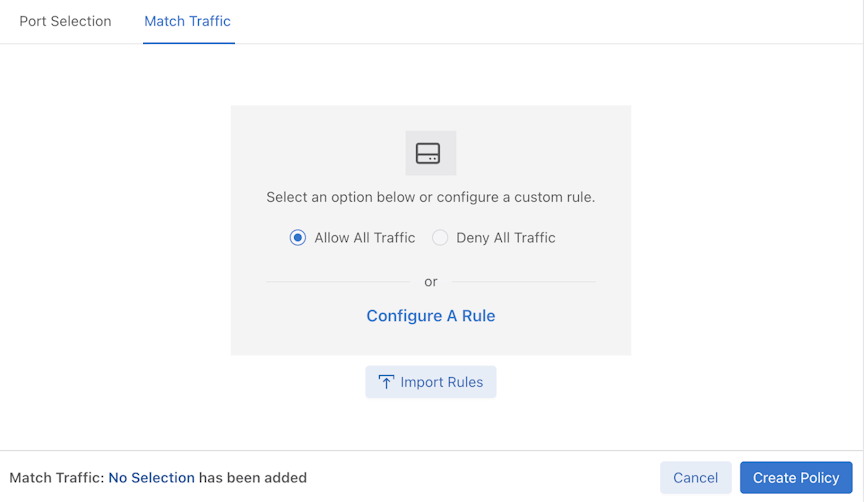
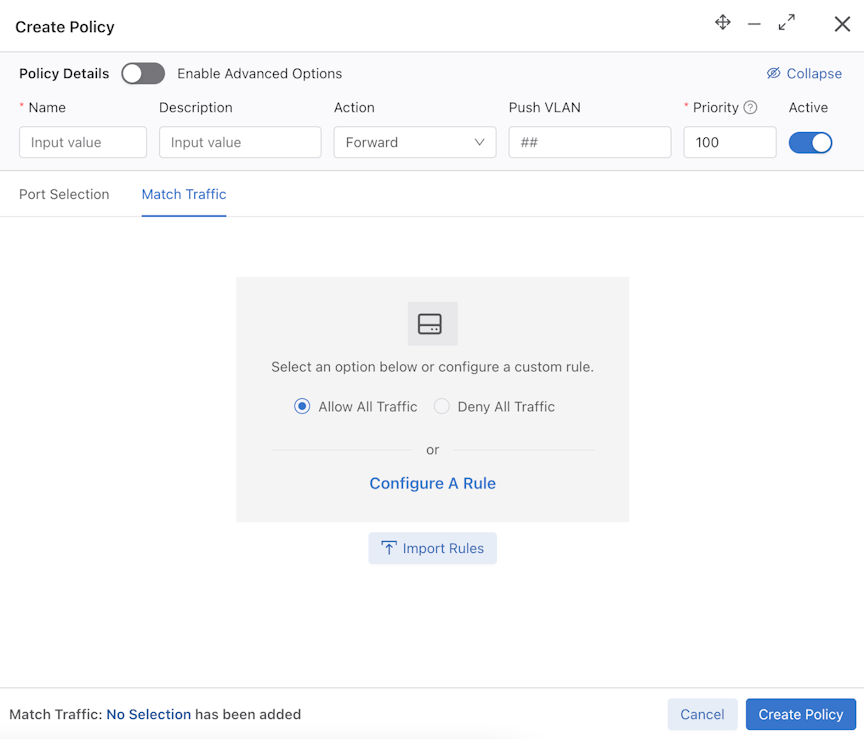
DMF supports flow-based timestamping. This function requires programming a policy to match relevant traffic and enable timestamping for the matched traffic. In the Create/Edit Policy workflow (on the Monitoring > Policies page), use the PTP Timestamping toggle to enable or disable timestamping.
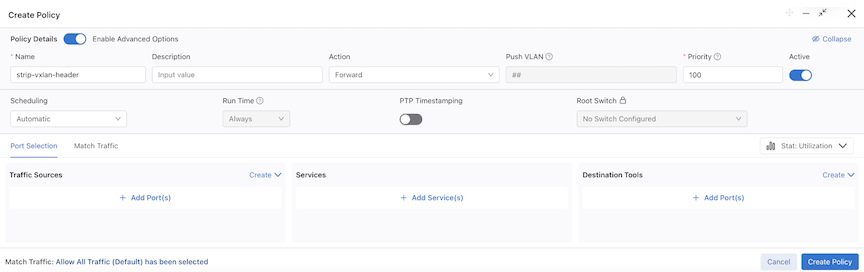
Figure 39. Create Timestamping Policy
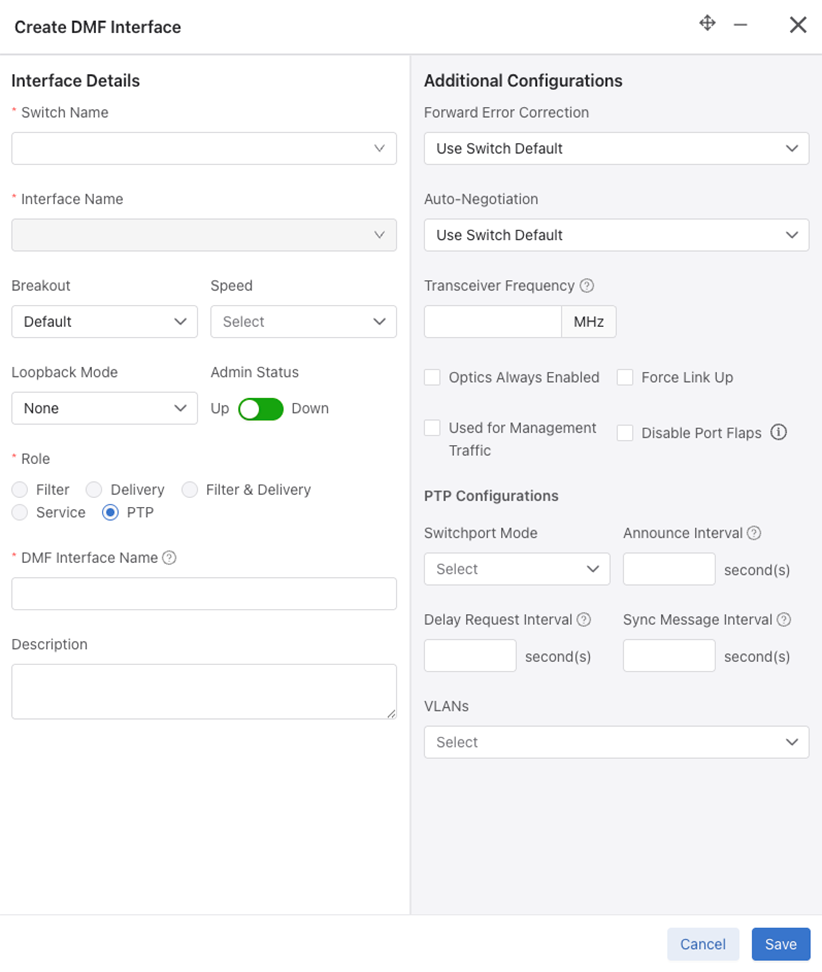
PTP Interface Configuration
A switch that syncs its hardware clock using PTP requires a physical front panel interface configured as a PTP interface. This interface is solely responsible for communication with the master clock and has no other purpose.
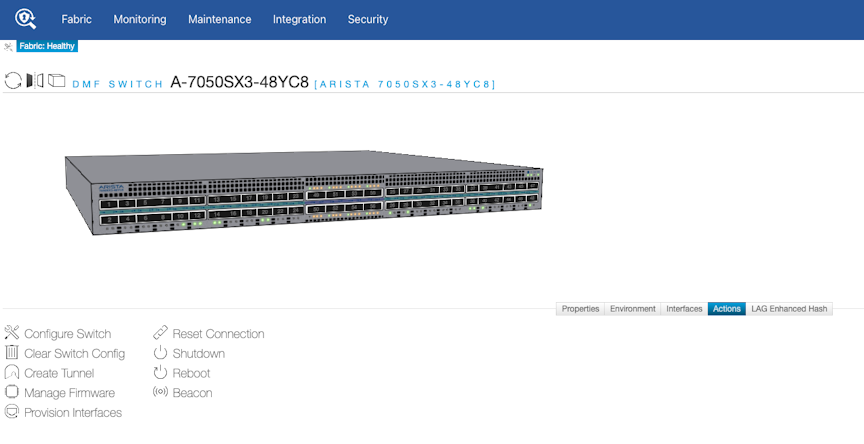
To configure the PTP interface, select an interface on the switch, as illustrated in the following command.
(config-switch)# interface Ethernet6/1
Use the role command to assign a ptp role and interface name and select switchport-mode for the specified interface.
A switch port is required to configure a PTP interface. The options for switch port mode are:
trunk-mode
access-mode
routed-mode
The switchport mode configuration for a PTP interface is necessary to match the PTP master switch's interface configuration. Configure the master switch to communicate PTP messages with or without a vlan tag. Use the trunk-mode with the appropriate ptp vlan when configuring the neighbor similarly. If the neighbor's interface is in switch-port access mode or routed mode, use either of these to match it on the filter switch.
Other fields are optional, using default values when no configuration is provided.
Optional fields:
announce-interval: Set PTP to announce interval between messages [-3,4]. The default value is 1.
delay-request-interval: Set PTP delay request interval between messages [-7,8]. The default value is 5.
sync-message-interval: Set PTP sync message interval between messages (-7,3). The default value is 0.
Depending on the switch port mode selected for this interface, provide VLANs that will be associated with the selected ptp-interface using the following commands:
In routed switchport mode, we ignore the configured VLANs. In access switchport mode, the first VLAN is used for programming while ignoring the rest. In trunk switchport mode, all configured VLANs are programmed into the switch.
Policy Configuration for Timestamping
DANZ Monitoring Fabric (DMF) supports flow-based timestamping. This function requires programming a policy to match relevant traffic and enable timestamping for the matched traffic.
Create a policy using the command policypolicy name.
Under config-policy submode, enable timestamping using the following command:
(config-policy)# use-timestamping
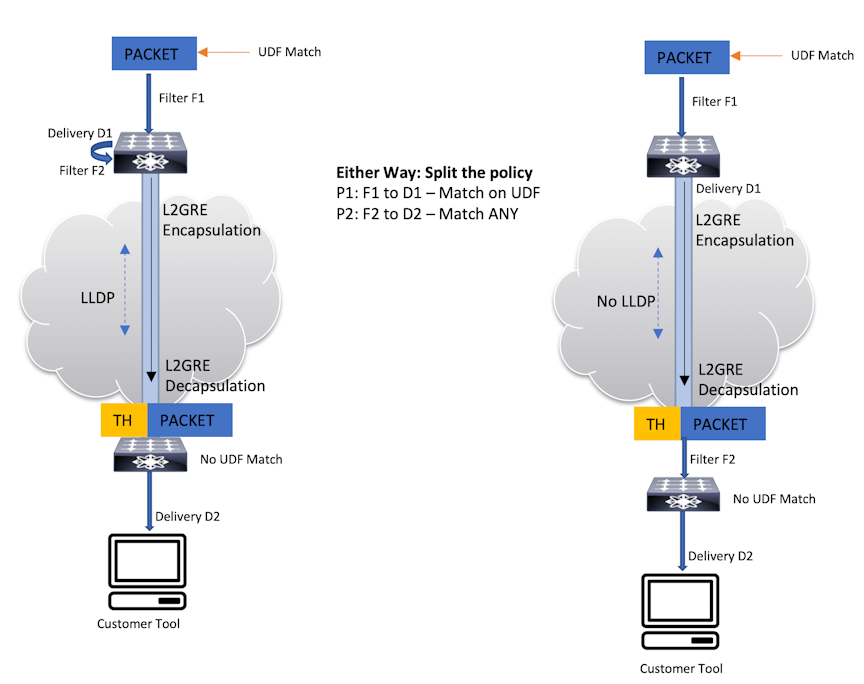
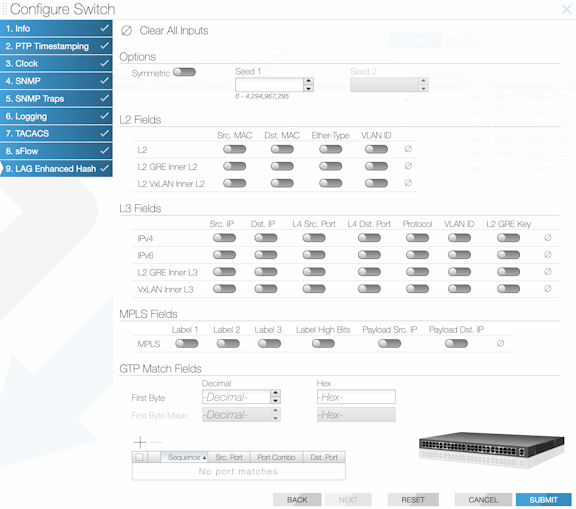
L2GRE Encapsulation of Packets with Arista Timestamp Headers
L2GRE encapsulation of packets with Arista timestamp headers is an extension of an existing feature allowing DANZ Monitoring Fabric (DMF) to use intra-fabric L2GRE tunnels.
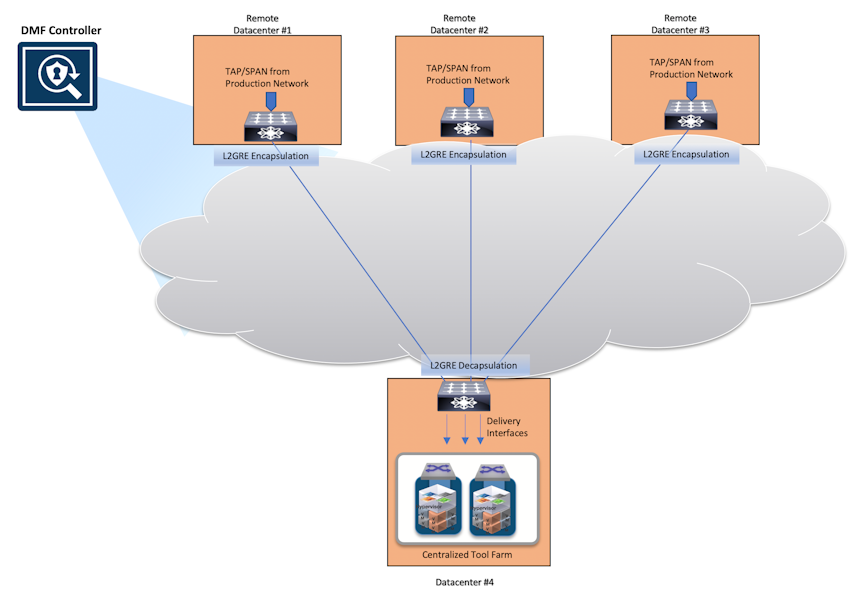
These tunnels enable forwarding unmodified production network packets over intermediate L3 networks used by DMF, which can now forward packets with Arista Networks Timestamp headers across L2GRE tunnels defined on EOS switches.
When a PTP header-based timestamping capable filter switch is in a remote location, and the remote filter switches connect to the centralized tool farm via L2GRE tunnels, timestamp the packets using PTP timestamping. These packets are encapsulated in an L2GRE header and sent to the core switch via the L2GRE tunnel. The timestamped packets will properly decapsulate at the remote end and be forwarded to the destination tools.
Note: DMF only supports PTP timestamping with L2GRE encapsulation with the header-based timestamping feature.
Use the show switchswitch name ptp info|masters|interface|local-clock command to obtain the PTP state of the selected switch.
The show switch switch name ptp info command summarizes the switch's PTP state and the PTP interfaces' status.
Controller# show switch eos ptp info
PTP Mode: Boundary Clock
PTP Profile: Default ( IEEE1588 )
Clock Identity: 0x2c:dd:e9:ff:ff:96:2b:ff
Grandmaster Clock Identity: 0x44:a8:42:ff:fe:34:fd:7e
Number of slave ports: 1
Number of master ports: 1
Slave port: Ethernet1
Offset From Master (nanoseconds): -128
Mean Path Delay (nanoseconds): 71
Steps Removed: 2
Skew (estimated local-to-master clock frequency ratio): 1.0000080070748882
Last Sync Time: 00:52:44 UTC Aug 09 2023
Current PTP System Time: 00:52:44 UTC Aug 09 2023
Interface       State        Transport    Delay
Mechanism
--------------- ------------ --------------- ---------
Et1 Slave        ipv4         e2e
Et47Master       ipv4         e2e
The show switch switch name ptp master command provides information about the PTP master and grandmaster clocks.
The show switch switch name ptp local-clock command provides PTP local clock information.
Controller# show switch eos ptp local-clock
PTP Mode: Boundary Clock
Clock Identity: 0x2c:dd:e9:ff:ff:96:2b:ff
Clock Domain: 0
Number of PTP ports: 56
Priority1: 128
Priority2: 128
Clock Quality:
Class: 248
Accuracy: 0x30
OffsetScaledLogVariance: 0xffff
Offset From Master (nanoseconds): -146
Mean Path Delay: 83 nanoseconds
Steps Removed: 2
Skew: 1.0000081185368557
Last Sync Time: 01:01:41 UTC Aug 09 2023
Current PTP System Time: 01:01:41 UTC Aug 09 2023
Policy State Show Commands
Use the show policy command to view the timestamping status for a given policy.
> show policy
# Policy Name Action             Runtime Status Type       Priority Overlap Priority Push VLAN Filter BW Delivery BW Post Match Filter Traffic Delivery Traffic Services Installed Time Installed Duration Ptp Timestamping
-|-----------|------------------|--------------|----------|--------|----------------|---------|---------|-----------|-------------------------|----------------|--------|--------------|------------------|----------------|
1 p1          unspecified action inactive       Configured 100      0                1         -         -           -                         -                                                           True
Configuration Validation Messages
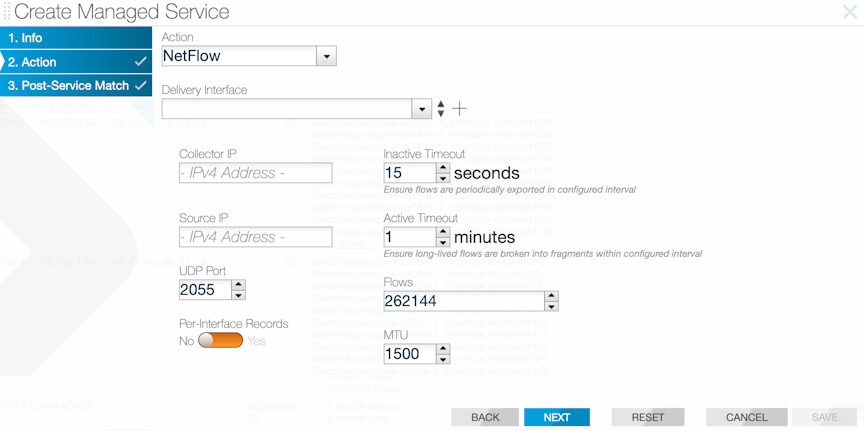
In push-per-policy mode, a validation exception occurs if a policy uses NetFlow managed-service with records-per-interface option and the same policy also uses timestamping. The following message appears:
Validation failed: Policy policy1 cannot have timestamping enabled along with header modifying netflow service.
Netflow service netflow1 is configured with records-per-interface in push-per-policy mode
In push-per-policy mode, a validation exception occurs if a policy uses the ipfix managed-service (using a template with records-per-dmf-interface key) and the same policy also uses timestamping. The following message appears:
Validation failed: Policy policy1 cannot have timestamping enabled along with header modifying ipfix service.
Ipfix service ipfix1 is configured with records-per-dmf-interface in push-per-policy mode
Only unicast source-ipv4-address or source-ipv6-address are allowed in the switch PTP config.
Examples of invalid ipv6 addresses: ff02::1, ff02::1a, ff02::d, ff02::5
Validation failed: Source IPv6 address must be a unicast address
Examples of invalid ipv4 addresses: 239.10.10.10, 239.255.255.255, 255.255.255.255
Validation failed: Source IPv4 address must be a unicast address
Troubleshooting
A policy programmed to use timestamping can fail for the following reasons:
The filter switch does not support syncing its hardware clock using PTP.
An unconfigured PTP interface or the interface is inactive.
The PTP switch configuration or PTP interface configuration is invalid or incomplete.
Configuring the PTP interface on a logical port (Lag or Tunnel).
Reasons for failure will be available in the runtime state of the policy and viewed using the show policy policy name command.
As the Platform Compatibility Section describes, use the show switch all
properties command to confirm a switch supports the feature.
Limitations
The source MAC address of the user packet is re-written with a 48-bit timestamp value on the filter switch.
This action can exhibit the following behavior changes or limitations:
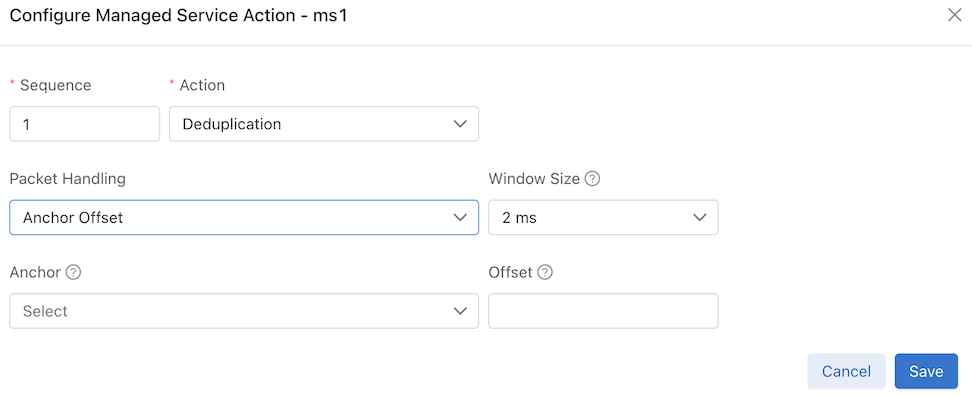
Dedup managed service will not work as expected. A high-precision timestamp can be different for duplicate packet matching on two different filter interfaces. Thus, the dedup managed service will consider this duplicate packet to be different in the L2 header. To circumvent this limitation, use an anchor/offset in the dedup managed-service config to ignore the source MAC address.
Any Decap managed service except for decap-l3-mpls will remove the timestamp information header.
The user source MAC address is lost and unrecoverable when using this feature.
The rewrite-dst-mac feature cannot be used on the filter interface that is part of the policy using the timestamping feature.
In push-per-filter mode, if a user has src-mac match condition as part of their policy config, the traffic will not be forwarded as expected and can get dropped at the core switch.
The in-port masking feature will be disabled for a policy using PTP timestamping.
Logical ports (Lag/Tunnel) as PTP interfaces are not allowed.
This chapter describes fabric-wide configuration options required in advanced use cases for deploying DMF policies.
Configuring Advanced Fabric Settings
To navigate the DMF Features Page, select the gear icon in the navigation bar.
Figure 1. Gear Icon
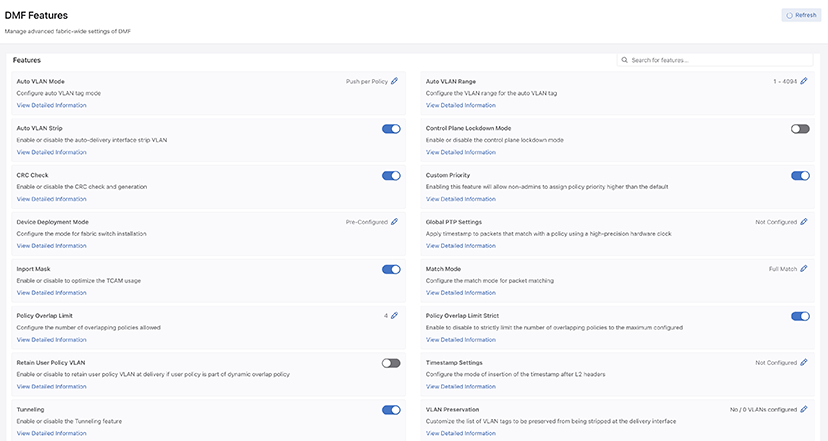
Page Layout
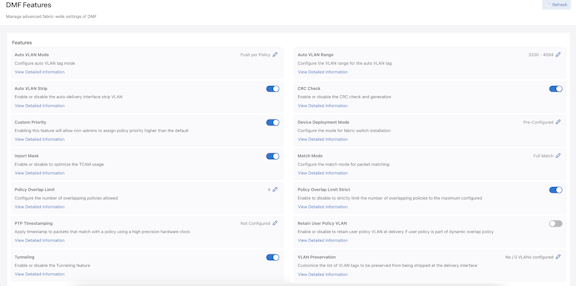
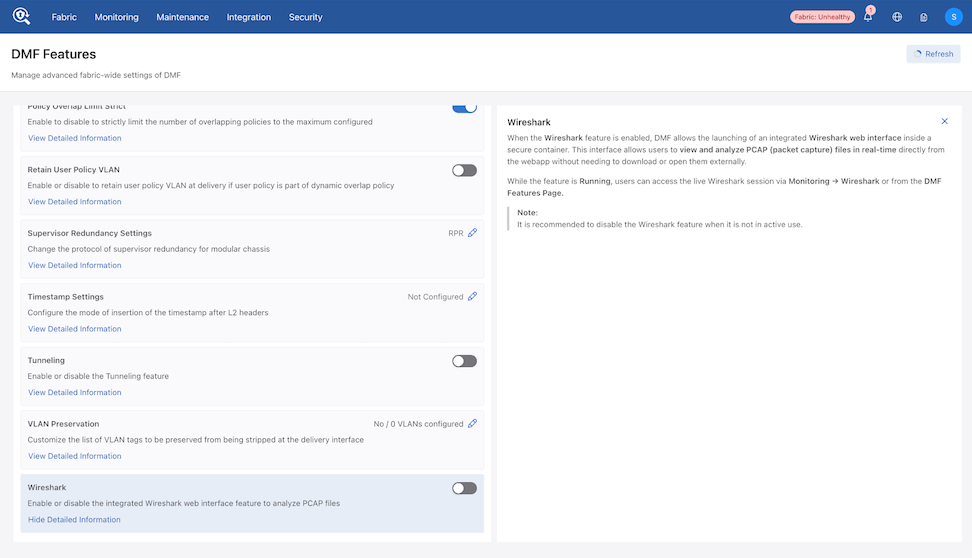
All fabric-wide configuration settings required in advanced use cases for deploying DMF policies appear in the new DMF Features Page.
Figure 2. DMF Features Page
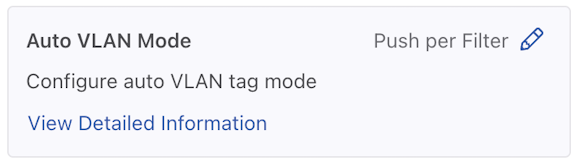
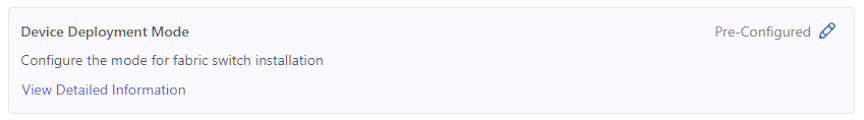
Each card on the page corresponds to a feature set.
Figure 3. Feature Set Card Example
The UI displays the following:
Feature Title
A brief description
View / Hide detailed information link
Current Setting
Edit Link - Use Edit (pencil) icon to change the value.
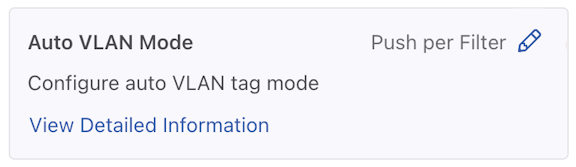
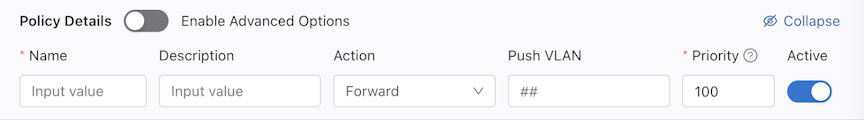
The fabric-wide options used with DMF policies include the following:
Feature Set
Auto VLAN Mode
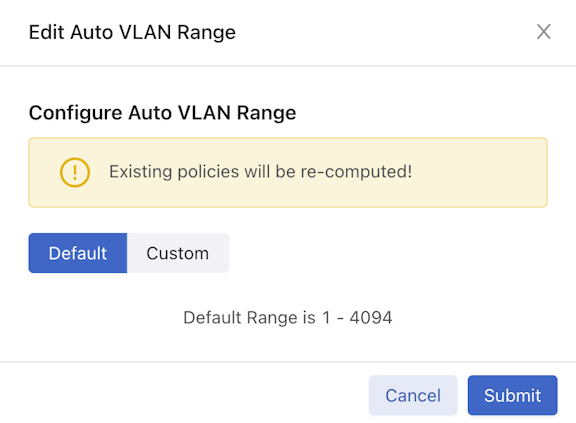
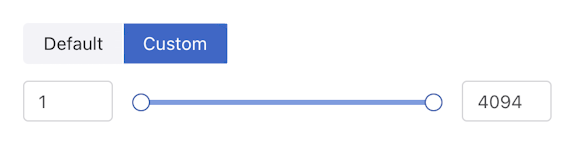
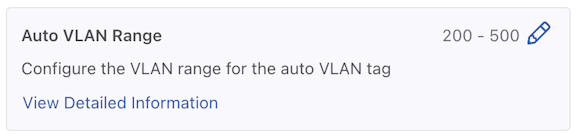
Auto VLAN Range
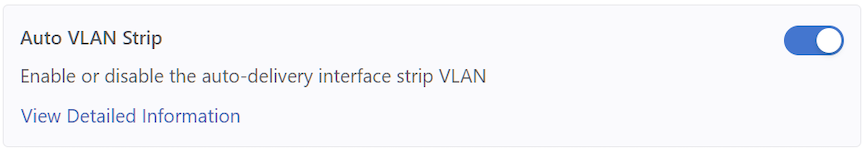
Auto VLAN Strip
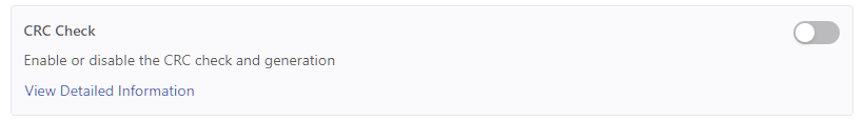
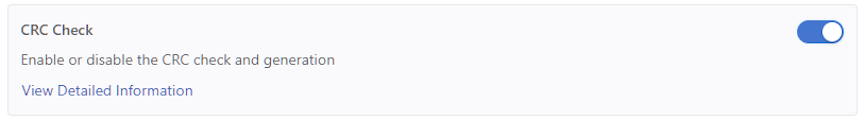
CRC Check
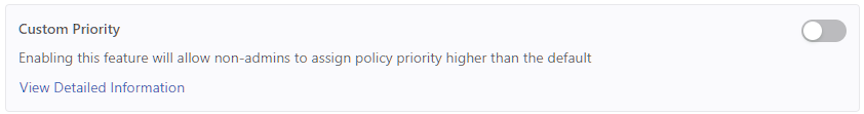
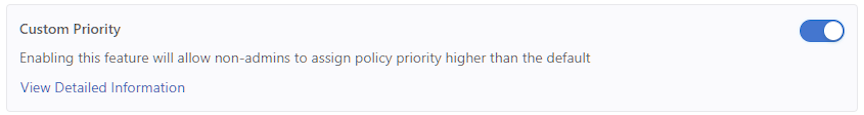
Custom Priority
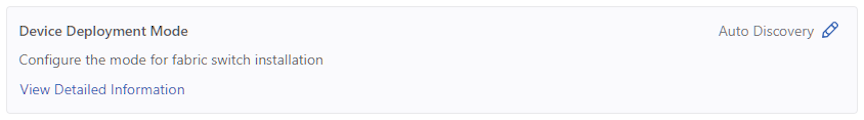
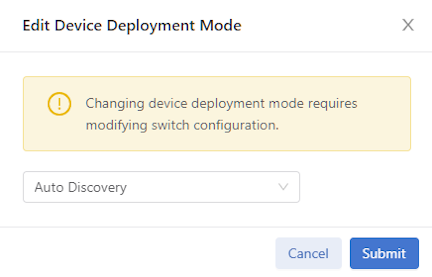
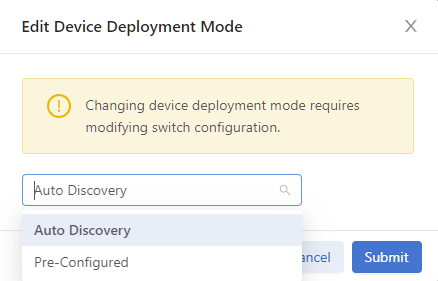
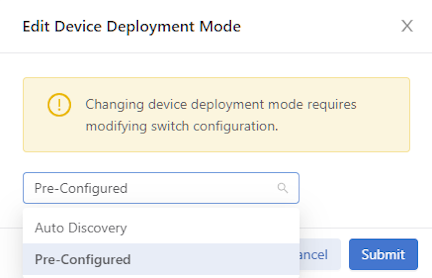
Device Deployment Mode
Inport Mask
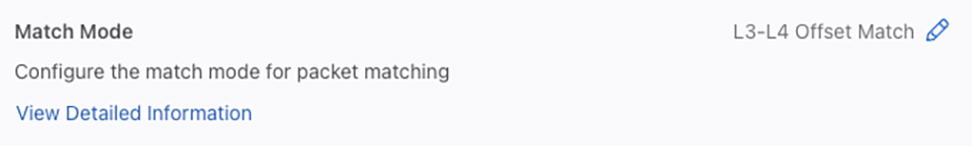
Match Mode
Policy Overlap Limit
Policy Overlap Limit Strict
PTP Timestamping
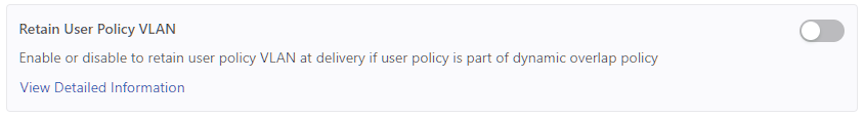
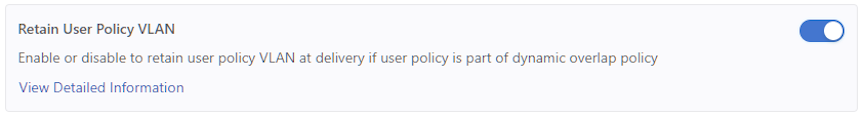
Retain User Policy VLAN
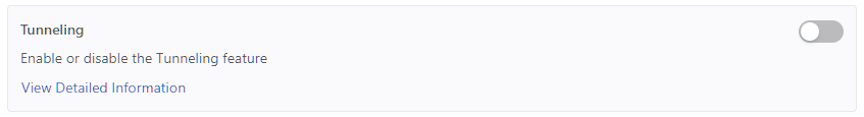
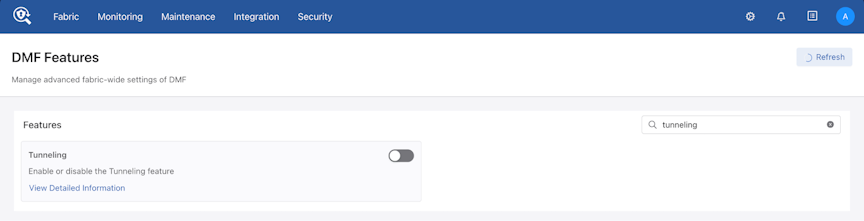
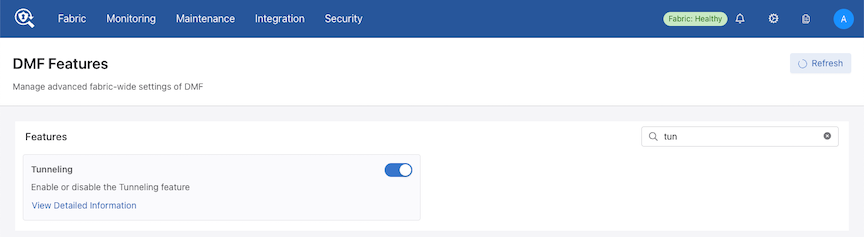
Tunneling
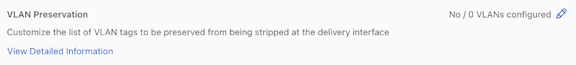
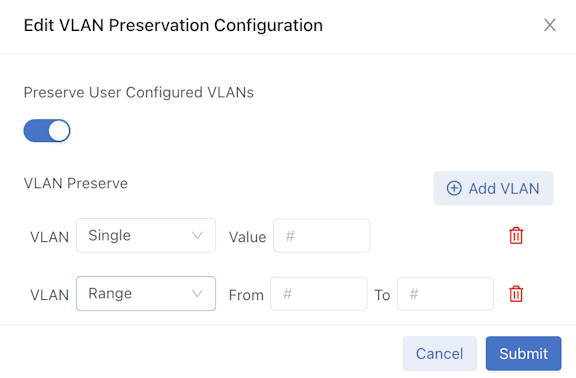
VLAN Preservation
Managing VLAN Tags in the Monitoring Fabric
Analysis tools often use VLAN tags to identify the filter interface receiving traffic. How VLAN IDs are assigned to traffic depends on which auto-VLAN mode is enabled. The system automatically assigns the VLAN ID from a configurable range of VLAN IDs, from 1 to 4094 by default. Available auto-VLAN modes behave as follows:
push-per-policy (default): Automatically adds a unique VLAN ID to all traffic selected by a specific policy. This setting enables tag-based forwarding.
push-per-filter: Automatically adds a unique VLAN ID from the default auto-VLAN range (1-4094) to each filter interface. A custom VLAN range can be specified using the auto-vlan-range command. Manually assign any VLAN ID not in the auto-VLAN range to a filter interface.
The VLAN ID assigned to policies or filter interfaces remains unchanged after controller reboot or failover. However, it changes if the policy is removed and added back again. Also, when the VLAN range is changed, existing assignments are discarded, and new assignments are made.
The push-per-filter feature preserves the original VLAN tag, but the outer VLAN tag is rewritten with the assigned VLAN ID if the packet already has two VLAN tags.
The following table summarizes how VLAN tagging occurs with the different auto-VLAN modes:
Table 1. VLAN Tagging Across VLAN Modes
Traffic with VLAN tag type
push-per-policy Mode (Applies to all supported switches)
push-per-filter Mode (Applies to all supported switches)
Untagged
Pushes a single tag
Pushes a single tag
Single tag
Pushes an outer (second) tag
Pushes an outer (second) tag
Two tags
Pushes an outer (third) tag. Except on T3-based switches, it rewrites the outer tag. Due to this outer customer VLAN is replaced by DMF policy VLAN.
Rewrites the outer tag. Due to this outer customer VLAN is replaced by DMF filter VLAN.
Note: When enabling push-per-policy, the auto-delivery-interface-vlan-strip feature is enabled (if disabled) before enabling push-per-policy. When enabling push-per-filter, the global delivery strip option is not enabled if previously disabled.
The following table summarizes how different auto-VLAN modes affect the applications and services supported.
Note: Matching on untagged packets cannot be applied to DMF policies when in push-per-policy mode.
Table 2. Auto-VLAN Mode Comparison
Auto-VLAN Mode
Supported Platform
TCAM Optimization in the Core
L2 GRE Tunnels Support
Q-in-Q Packets Preserve Both Original Tags
Support DMF Service Node Services
Manual Tag to Filter Interface
Push-per-policy (default)
All
Yes
Yes
Yes
All
Policy tag overwrites manual
Push-per-filter
All
No
Yes
No
All
Configuration not allowed
Note: Tunneling is supported with full-match or offset-match modes but not with l3-l4-match mode.
Tag-based forwarding, which improves traffic forwarding and reduces TCAM utilization on the monitoring fabric switches, is enabled only when choosing the push-per-policy option.
When the mode is push-per-filter, the VLAN that is getting pushed or rewritten can be displayed using the show interface-names command as shown below:
controller-1> show interface-names
~~~~~~~~~~~~~~~~~~~~~~~~ Filter Interface(s) ~~~~~~~~~~~~~~~~~~~~~~~~~~~~~~~~~~~~~~~~~~~~~~~~~~
#  DMF IF                      Switch IF     Name         Dir State Speed  VLAN Tag Analytics Ip address Connected Device
--|---------------------------|-------------|------------|---|-----|------|--------|---------|----------|----------------|
1  TAP-PORT-eth1               FILTER-SW1    ethernet1    rx  up    10Gbps 5        True
2  TAP-PORT-eth10              FILTER-SW1    ethernet10   rx  up    10Gbps 10       True
3  TAP-PORT-eth12              FILTER-SW1    ethernet12   rx  up    10Gbps 11       True
4  TAP-PORT-eth14              FILTER-SW1    ethernet14   rx  up    10Gbps 12       True
5  TAP-PORT-eth16              FILTER-SW1    ethernet16   rx  up    10Gbps 13       True
6  TAP-PORT-eth18              FILTER-SW1    ethernet18   rx  up    10Gbps 14       True
7  TAP-PORT-eth20              FILTER-SW1    ethernet20   rx  up    10Gbps 16       True
8  TAP-PORT-eth22              FILTER-SW1    ethernet22   rx  up    10Gbps 17       True
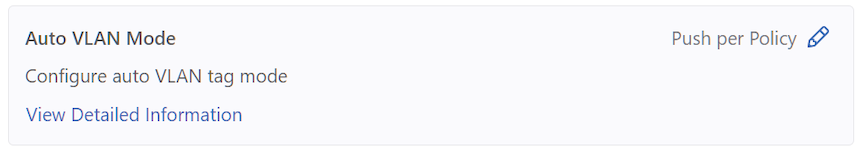
Auto VLAN Mode
Analysis tools often use VLAN tags to identify the filter interface receiving traffic. How VLAN IDs are assigned to traffic depends on which auto-VLAN mode is enabled. The system automatically assigns the VLAN ID from a configurable range of VLAN IDs from 1 to 4094 by default. Available auto-VLAN modes behave as follows:
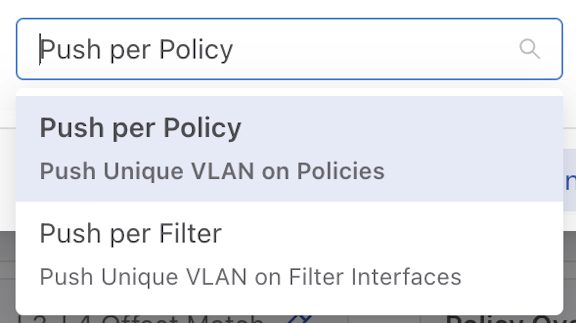
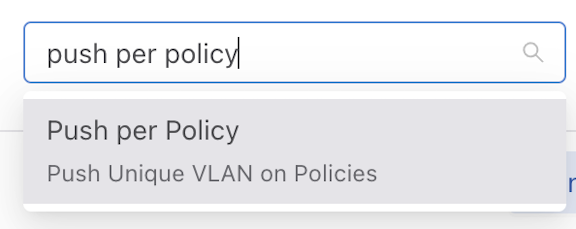
Push per Policy (default): Automatically adds a unique VLAN ID to all traffic selected by a specific policy. This setting enables tag-based forwarding.
Push per Filter: Automatically adds a unique VLAN ID from the default auto-vlan-range (1-4094) to each filter interface. A new vlan range can be specified using the auto-vlan-range command. Manually assign any VLAN ID not in the auto-VLAN range to a filter interface.
The following table summarizes how VLAN tagging occurs with the different Auto VLAN modes.
Table 3. VLAN Tagging
Traffic with VLAN tag type
push-per-policy Mode
(Applies to all supported switches)
push-per-filter Mode
(Applies to all supported switches)
Untagged
Pushes a single tag
Pushes a single tag
Single tag
Pushes an outer (second) tag
Pushes an outer (second) tag
Two tags
Pushes an outer (third) tag. Except on T3-based switches, it rewrites the outer tag. Due to this outer customer VLAN is replaced by DMF policy VLAN.
Rewrites the outer tag. Due to this outer customer VLAN is replaced by DMF filter VLAN.
Note: When enabling push-per-policy, the auto-delivery-interface-vlan-strip feature is enabled (if disabled) before enabling push-per-policy. When enabling push-per-filter, the global delivery strip option is not enabled if previously disabled.
The following table summarizes how different Auto VLAN modes affect supported applications and services.
Note: Matching on untagged packets cannot be applied to DMF policies when in push-per-policy mode.
Table 4. Auto VLAN Modes
Auto-VLAN Mode
Supported Platform
TCAM Optimization in the Core
L2 GRE Tunnels Support
Q-in-Q Packets Preserve Both Original Tags
Supported DMF Service Node Services
Manual Tag to Filter Interface
Push per Policy (default)
All
Yes
Yes
Yes
All
Policy tag overwrites manual
Push per Filter
All
No
Yes
No
All
Configuration not allowed
Tag-based forwarding, which improves traffic forwarding and reduces TCAM utilization on the monitoring fabric switches, is only enabled when choosing the push-per-policy option.
Use the CLI or the GUI to configure Auto VLAN Mode as described in the following topics.
To set the auto VLAN mode, perform the following steps:
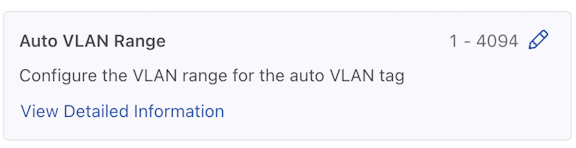
When setting the auto VLAN mode to push-per-filter, define the range of automatically assigned VLAN IDs by entering the following command from config mode:
auto-vlan-range vlan-min start vlan-max end
Replace start and end with the first and last VLAN ID in the range. For example, the following command assigns a range of 100 VLAN IDs from 3994 to 4094:
For example, the following command adds a unique outer VLAN tag to each packet received on each filter interface:
controller-1(config)# auto-vlan-mode push-per-filter
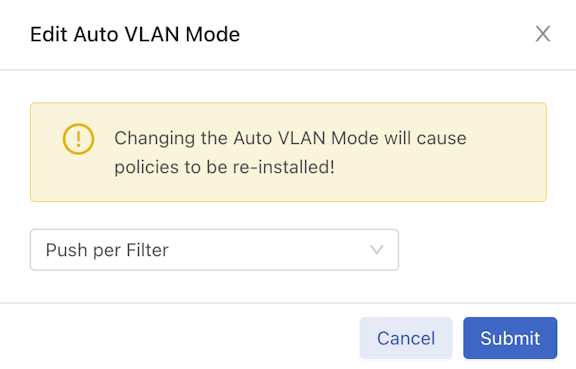
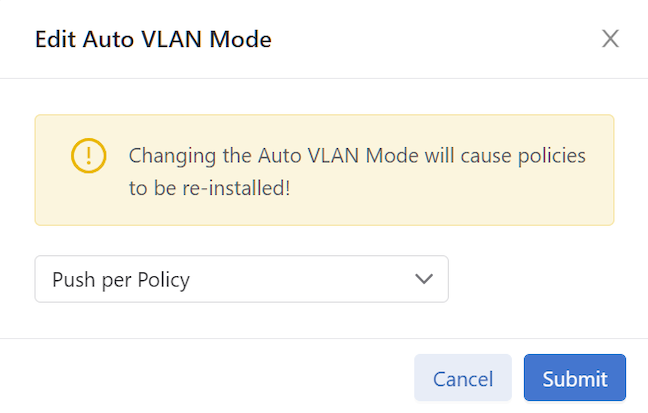
Switching to auto vlan mode would cause policies to be re-installed. Enter "yes" (or "y")
to continue: y
To display the configured VLAN mode, enter the show fabric command, as in the following example:
controller-1# show fabric
~~~~~~~~~~~~~~~~~~~~~ Aggregate Network State ~~~~~~~~~~~~~~~~~~~~~
Number of switches                          : 5
Inport masking                              : True
Start time                                  : 2018-11-02 23:42:29.183000 UTC
Number of unmanaged services                : 0
Filter efficiency                           : 1:1
Number of switches with service interfaces  : 0
Total delivery traffic (bps)                : 411Kbps
Number of managed service instances         : 0
Number of service interfaces                : 0
Match mode                                  : full-match
Number of delivery interfaces               : 13
Max pre-service BW (bps)                    : -
Auto VLAN mode                              : push-per-filter
Number of switches with delivery interfaces : 4
Number of managed devices                   : 1
Uptime                                      : 2 days, 19 hours
Total ingress traffic (bps)                 : 550Kbps
Max overlap policies (0=disable)            : 10
Auto Delivery Interface Strip VLAN          : False
Number of core interfaces                   : 219
Max filter BW (bps)                         : 184Gbps
Number of switches with filter interfaces   : 5
State                                       : Enabled
Max delivery BW (bps)                       : 53Gbps
Total pre-service traffic (bps)             : -
Track hosts                                 : True
Number of filter interfaces                 : 23
Number of active policies                   : 3
Number of policies                          : 25
------------------------output truncated------------------------
To display the VLAN IDs assigned to each policy, enter the show policy command, as in the following example:
Note: The strip VLAN option, when enabled, removes the outer VLAN tag, including the VLAN ID applied by any rewrite VLAN option.
Configuring Auto VLAN Mode using the GUI
Auto VLAN Mode
Control the configuration of this feature using the Edit icon by locating the corresponding card and the pencil icon.
Figure 4. Auto VLAN Mode Config
A confirmation edit dialogue window appears, displaying the corresponding prompt message.
Figure 5. Edit VLAN Mode
To configure different modes, select the drop-down arrow to open the menu.
Figure 6. Drop-down Example
From the drop-down menu, select the desired mode.
Figure 7. Push Per Policy
Alternatively, enter the desired mode name in the input area.
Figure 8. Push Per Policy
Use Submit to confirm the configuration changes or Cancel to discard the changes.
Figure 9. Submit Button
After successfully setting the configuration, the current configuration status displays next to the edit icon.
Figure 10. Current Configuration Status
The following feature sets work in the same manner as the Auto VLAN Mode feature described above.
Device Deployment Mode
Match Mode
Auto VLAN Range
Auto VLAN Range
The range of automatically generated VLANs only applies when setting Auto VLAN Mode to push-per-filter. VLANs are picked from the range 1 - 4094 when not specified.
Control the configuration of this feature using the Edit icon by locating the corresponding card and selecting the pencil icon.
Figure 11. Edit Auto VLAN Range
A configuration edit dialogue window pops up, displaying the corresponding prompt message. The Auto VLAN Range defaults to 1 - 4094.
Figure 12. Edit Auto VLAN Range
Select Custom to configure the custom range.
Figure 13. Custom Button
Adjust range value (minimum value: 1, maximum value: 4094). There are three ways to adjust the value of a range:
Directly enter the desired value in the input area, with the left side representing the minimum value of the range and the right side representing the maximum value.
Adjust the value by dragging the slider using a mouse. The left knob represents the minimum value of the range, while the right knob represents the maximum value.
Use the up and down arrow buttons in the input area to adjust the value accordingly. Pressing the up arrow increments the value by 1, while pressing the down arrow decrements it by 1.
Use Submit to confirm the configuration changes or Cancel to discard the changes.
After successfully setting the configuration, the current configuration status displays next to the edit icon.
Figure 14. Configuration Change Success
Configuring Auto VLAN Range using the CLI
To set the Auto VLAN Range, use the following command:
auto-vlan-range vlan-min start vlan-max end
To set the Auto VLAN Range, replace start and end with the first and last VLAN ID in the desired range.
For example, the following command assigns a range of 100 VLAN IDs from 3994 to 4094:
The strip VLAN option removes the outer VLAN tag before forwarding the packet to a delivery interface. Only the outer tag is removed if the packet has two VLAN tags. If it has no VLAN tag, the packet is not modified. Users can remove the VLAN ID on traffic forwarded to a specific delivery interface globally for all delivery interfaces. The strip VLAN option removes any VLAN ID applied by the rewrite VLAN option.
The strip vlan option removes the VLAN ID on traffic forwarded to the delivery interface. The following are the two methods available:
Remove VLAN IDs fabric-wide for all delivery interfaces. This method removes only the VLAN tag added by DMF Fabric.
On specific delivery interfaces. This method has four options:
Keep all tags intact. Preserves the VLAN tag added by DMF Fabric and other tags in the traffic using strip-no-vlan option during delivery interface configuration.
Remove only the outer VLAN tag the DANZ Monitoring Fabric added using the strip-one-vlan option during delivery interface configuration.
Remove only the second (inner) tag. Preserves the VLAN (outer) tag added by DMF Fabric and removes the second (inner) tag in the traffic using the strip-second-vlan option during delivery interface configuration.
Remove two tags. Removes the outer VLAN tag added by DMF fabric and inner vlan tag in the traffic using the strip-two-vlan option during delivery interface configuration.
Note: The strip vlan command for a specific delivery interface overrides the fabric-wide strip vlan option.
By default, the VLAN ID is stripped when DMF adds it to enable the following options:
Push per Policy
Push per Filter
Rewrite VLAN under filter-interfaces
Tagging and stripping VLANs as they ingress and egress DMF differs depending on whether the switch is a Trident 3-based.
Use the CLI or the GUI to configure Auto VLAN Strip as described in the following topics.
The strip VLAN option removes the outer VLAN tag before forwarding the packet to a delivery interface. Only the outer tag is removed if the packet has two VLAN tags. If it has no VLAN tag, the packet is not modified. Users can remove the VLAN ID on traffic forwarded to a specific delivery interface or globally for all delivery interfaces. The strip VLAN option removes any VLAN ID applied by the rewrite VLAN option.
The following are the two methods available:
Remove VLAN IDs fabric-wide for all delivery interfaces: This method removes only the VLAN tag added by the DMF Fabric.
Remove VLAN IDs only on specific delivery interfaces: This method has four options:
Keep all tags intact. Preserves the VLAN tag added by DMF Fabric and other tags in the traffic using strip-no-vlan option during delivery interface configuration.
Remove only the outer VLAN tag the DANZ Monitoring Fabric added using the strip-one-vlan option during delivery interface configuration.
Remove only the second (inner) tag. Preserves the VLAN (outer) tag added by DMF and removes the second (inner) tag in the traffic using the strip-second-vlan option during delivery interface configuration.
Remove two tags. Removes the outer VLAN tag added by DMF fabric and the inner VLAN tag in the traffic using the strip-two-vlan option during delivery interface configuration.
Note: The strip vlan command for a specific delivery interface overrides the fabric-wide stripVLAN option.
By default, the VLAN ID is stripped when DMF adds it as a result of enabling the following options:
push-per-policy
push-per-filter
rewrite vlan under filter-interfaces
To view the current auto-delivery-interface-vlan-strip configuration, enter the following command:
To view the current auto-delivery-interface-vlan-strip state, enter the following command:
controller-1> show fabric
~~~~~~~~~~~~~~~~~~~~~ Aggregate Network State ~~~~~~~~~~~~~~~~~~~~~
Number of switches : 5
Inport masking : True
Start time : 2018-10-16 22:30:03.345000 UTC
Number of unmanaged services : 0
Filter efficiency : 3005:1
Number of switches with service interfaces : 0
Total delivery traffic (bps) : 232bps
Number of managed service instances : 0
Number of service interfaces : 0
Match mode : l3-l4-match
Number of delivery interfaces : 24
Max pre-service BW (bps) : -
Auto VLAN mode : push-per-policy
Number of switches with delivery interfaces : 5
Number of managed devices : 1
Uptime : 21 hours, 53 minutes
Total ingress traffic (bps) : 697Kbps
Max overlap policies (0=disable) : 10
Auto Delivery Interface Strip VLAN : True
To disable this global command, enter the following command:
controller-1(config-switch-if)# no auto-delivery-interface-vlan-strip
The delivery interface level command to strip the VLAN overrides the global auto-delivery-interface-vlan-strip command. For example, when global VLAN stripping is disabled or to override the default strip option on a delivery interface use the below options:
To strip the VLAN added by DMF fabric on a specific delivery interface, use the following command:
controller-1(config-switch-if)# role delivery interface-name TOOL-PORT-1 strip-one-vlan
When global VLAN stripping is enabled, it strips only the outer VLAN ID. To remove outer VLAN ID that was added by DMF as well as the inner VLAN ID, enter the following command:
controller-1(config-switch-if)# role delivery interface-name TOOL-PORT-1 strip-two-vlan
To strip only the inner VLAN ID and preserve the outer VLAN ID that DMF added, use the following command:
controller-1(config-switch-if)# role delivery interface-name TOOL-PORT-1 strip-second-vlan
To preserve the VLAN tag added by DMF and other tags in the traffic, use the following command:
controller-1(config-switch-if)# role delivery interface-name TOOL-PORT-1 strip-no-vlan
Note:For all modes VLAN ID stripping is supported at both the global and delivery interface levels. The rewrite-per-policy and rewrite-per-filter options have been removed in DMF Release 6.0 because the push-per-policy and push-per-filter options now support the related use cases.
The syntax for the strip VLAN ID feature is as follows:
controller-1(config-switch-if)# role delivery interface-name name [strip-no-vlan | strip-onevlan | strip-second-vlan | strip-two-vlan]
Use the option to leave all VLAN tags intact, remove the outermost tag, remove the second (inner) tag, or remove the outermost two tags, as required.
By default, VLAN stripping is enabled and the outer VLAN added by DMF is removed.
To preserve the outer VLAN tag, enter the strip-no-vlan command, as in the following example, which preserves the outer VLAN ID for traffic forwarded to the delivery interface TOOL-PORT-1:
controller-1(config-switch-if)# role delivery interface-name TOOL-PORT-1 strip-no-vlan
When global VLAN stripping is disabled, the following commands remove the outer VLAN tag, added by DMF, on packets transmitted to the specific delivery interface ethernet20 on DMF-DELIVERY-SWITCH-1:
To restore the default configuration, which is to strip the VLAN IDs from traffic to every delivery interface, enter the following command:
controller-1(config)# auto-delivery-interface-vlan-strip
This would enable auto delivery interface strip VLAN feature.
Existing policies will be re-computed. Enter “yes” (or “y”) to continue: yes
As mentioned earlier, tagging and stripping VLANs as they ingress and egress DMF differs based on whether the switch uses a Trident 3 chipset. The following scenarios show how DMF behaves in different VLAN modes with various knobs set.
Scenario 1
VLAN mode: Push per Policy
Filter interface on any switch except a Trident 3 switch
Delivery interface on any switch
Global VLAN stripping is enabled
Table 5. Behavior of Traffic as It Egresses with Different Strip Options on a Delivery Interface
VLAN tag type
No Configuration
strip-no-VLAN
strip-one-VLAN
strip-second-VLAN
strip-two-VLAN
DMF policy VLAN is stripped automatically on delivery inter- face using default global strip VLAN added by DMF
DMF policy VLAN and customer VLAN preserved
Strips the outermost VLAN that is DMF policy VLAN
DMF policy VLAN is preserved and outermost customer VLAN is removed
Strip two VLANs, DMF policy VLAN and customer outer VLAN removed
Untagged
Packets exit DMF as untagged packets
Packets exit DMF as singly tagged packets. VLAN in the packet is DMF policy VLAN.
Packets exit DMF as untagged packets.
Packets exit DMF as single-tagged traffic. VLAN in the packet is DMF policy VLAN.
Packets exit DMF as untagged traffic.
Singly Tagged
Packets exit DMF as single-tagged traffic with customer VLAN.
Packets exit DMF as doubly tagged packets. Outer VLAN in the packet is DMF policy VLAN.
Packets exit DMF as single-tagged traffic with customer VLAN.
Packets exit DMF as single-tagged traffic. VLAN in the packet is DMF policy VLAN.
Packets exit DMF as untagged traffic.
Doubly Tagged
Packet exits DMF as doubly tagged traffic. Both VLANs are customer VLANs.
Packet exits DMF as triple-tagged packets. Outermost VLAN in the packet is the DMF policy VLAN.
Packet exits DMF as doubly tagged traffic. Both VLANs are customer VLANs.
Packet exits DMF as double-tagged packets. Outer VLAN is DMF policy VLAN, inner VLAN is inner customer VLAN in the original packet.
Packet exits DMF as singly tagged traffic. VLAN in the packet is the inner customer VLAN.
Scenario 2
VLAN Mode: Push per Policy
Filter interface on any switch except a Trident 3 switch
Delivery interface on any switch
Global VLAN strip is disabled
Table 6. Behavior of Traffic as It Egresses with Different Strip Options on a Delivery Interface
VLAN tag type
No Configuration
strip-no-VLAN
strip-one-VLAN
strip-second-VLAN
strip-two-VLANs
DMF policy VLAN and customer VLAN are preserved
DMF policy VLAN and customer VLAN are preserved
Strips only the outermost VLAN that is DMF policy VLAN
DMF policy VLAN is preserved and outer most customer VLAN is removed
Strip two VLANs, DMF policy VLAN and customer outer VLAN removed
Untagged
Packet exits DMF as singly tagged packets. VLAN in the packet is DMF policy VLAN.
Packet exits DMF as singly tagged packets. VLAN in the packet is DMF policy VLAN.
Packet exits DMF as untagged packets.
Packet exits DMF as single-tagged traffic. VLAN in the packet is DMF policy VLAN.
Packet exits DMF as untagged traffic.
Singly Tagged
Packet exits DMF as doubly tagged packets. Outer VLAN in packet is DMF policy VLAN and inner VLAN is customer outer VLAN.
Packet exits DMF as doubly tagged packets. Outer VLAN in the packet is DMF policy VLAN.
Packet exits DMF as single-tagged traffic with customer VLAN.
Packet exits DMF as single-tagged traffic. VLAN in the packet is DMF policy VLAN.
Packets exits DMF as untagged traffic.
Doubly Tagged
Packet exits DMF as triple-tagged packets. Outermost VLAN in the packet is the DMF policy VLAN.
Packet exits DMF as triple-tagged packets. Outermost VLAN in the packet is the DMF policy VLAN.
Packet exits DMF as doubly tagged traffic. Both VLANs are customer VLANs.
Packet exits DMF as doubly tagged packets. Outer VLAN is DMF policy VLAN, inner VLAN is inner customer VLAN in the original packet.
Packet exits DMF as singly tagged traffic. VLAN in the packets is the inner customer VLAN.
Scenario 3
VLAN Mode - Push per Policy
Filter interface on a Trident 3 switch
Delivery interface on any switch
Global VLAN strip is enabled
Table 7. Behavior of traffic as it egresses with different strip options on a delivery interface
VLAN tag type
No Configuration
strip-no-VLAN
strip-one-VLAN
strip-second-VLAN
strip-two-VLAN
DMF policy VLAN is stripped automatically on delivery interface using default global strip VLAN added by DMF
DMF policy VLAN and customer VLAN preserved
Strips the outermost VLAN that is DMF policy VLAN
DMF policy VLAN is preserved and outermost customer VLAN is removed
Strip two VLANs , DMF policy VLAN and customer outer VLAN removed
Untagged
Packet exits DMF as untagged packets.
Packet exits DMF as singly tagged packets. VLAN in the packet is DMF policy VLAN.
Packet exits DMF as untagged packets.
Packet exits DMF as single-tagged traffic. VLAN in the packet is DMF policy VLAN.
Packet exits DMF as untagged traffic.
Singly Tagged
Packet exits DMF as single-tagged traffic with customer VLAN.
Packet exits DMF as doubly tagged packets. Outer VLAN in the packet is DMF policy VLAN.
Packet exits DMF as single tagged traffic with customer VLAN.
Packet exits DMF as single-tagged traffic. VLAN in the packet is DMF policy VLAN.
Packet exits DMF as untagged traffic.
Doubly Tagged
Packet exits DMF as singly tagged traffic. VLAN in the packet is the inner customer VLAN
Packet exits DMF as doubly tagged traffic. Outer customer VLAN is replaced by DMF policy VLAN.
Packet exits DMF as singly tagged traffic. VLAN in the packet is the inner customer VLAN.
Packet exits DMF as singly tagged traffic. VLAN in the packet is the DMF policy VLAN.
Packet exits DMF as untagged traffic.
Scenario 4
VLAN Mode - Push per Filter
Filter interface on any switch
Delivery interface on any switch
Global VLAN strip is enabled
Table 8. Behavior of Traffic as It Egresses with Different Strip Options on a Delivery Interface
VLAN tag type
No Configuration
strip-no-VLAN
strip-one-VLAN
strip-second-VLAN
strip-two-VLAN
DMF filter VLAN is stripped automatically on delivery interface using global strip VLAN added by DMF.
DMF filter VLAN and customer VLAN preserved.
Strips the outermost VLAN that is DMF filter VLAN.
DMF filter VLAN is preserved and outermost customer VLAN is removed.
Strip two VLANs, DMF filter interface VLAN and customer outer VLAN removed.
Untagged
Packet exits DMF as untagged packets.
Packet exits DMF as singly tagged packets. VLAN in the packet is DMF filter interface VLAN.
Packet exits DMF as untagged packets.
Packet exits DMF
as single tagged traffic. VLAN in the packet is DMF filter inter- face VLAN.
Packet exits DMF as untagged traffic.
Singly Tagged
Packet exits DMF as singly tagged traffic. VLAN in the packet is the customer VLAN.
Packet exits DMF as doubly tagged packets. Outer VLAN in the packet is DMF filter interface VLAN.
Packet exits DMF as singly tagged traffic. VLAN in the packet is the customer VLAN.
Packet exits DMF as singly tagged traffic. VLAN in the packet is DMF filter interface VLAN.
Packet exits DMF as untagged traffic.
Doubly Tagged
Packet exits DMF as singly tagged traffic. VLAN in the policy is the inner customer VLAN.
Packet exits DMF as doubly tagged traffic. Outer customer VLAN is replaced by DMF filter interface VLAN.
Packet exits DMF as singly tagged traffic. VLAN in the policy is the inner customer VLAN.
Packet exits DMF as singly tagged traffic. VLAN in the policy is the DMF filter interface VLAN.
Packet exits DMF as untagged traffic.
Scenario 5
VLAN Mode - Push per Filter
Filter interface on any switch
Delivery interface on any switch
Global VLAN strip is disabled
Table 9. Behavior of Traffic as It Egresses with Different Strip Options on a Delivery Interface
VLAN tag type
No Configuration
strip-no-VLAN
strip-one-VLAN
strip-second-VLAN
strip-two-VLAN
DMF filter VLAN is stripped automatically on delivery interface using global strip VLAN added by DMF.
DMF filter VLAN and customer VLAN preserved.
Strips the outermost VLAN that is DMF filter VLAN.
DMF filter VLAN is preserved and outermost customer VLAN is removed.
Strip two VLANs, DMF filter interface VLAN and customer outer VLAN removed.
Untagged
Packet exits DMF as singly tagged packets. VLAN in the packet is DMF filter interface VLAN.
Packet exits DMF as singly tagged packets. VLAN in the packet is DMF filter interface VLAN.
Packet exits DMF as untagged packets.
Packet exits DMF as singly tagged traffic. VLAN in the packet is DMF filter interface VLAN.
Packet exits DMF as untagged traffic.
Singly Tagged
Packet exits DMF as doubly tagged traffic. Outer VLAN in the packet is DMF filter VLAN and inner VLAN is the customer VLAN.
Packet exits DMF as doubly tagged packets. Outer VLAN in the packet is DMF filter interface VLAN.
Packet exits DMF as single tagged traffic. VLAN in the packet is the customer VLAN.
Packet exits DMF as singly tagged traffic. VLAN in the packet is DMF filter interface VLAN.
Packet exits DMF as untagged traffic.
Doubly Tagged
Packet exits DMF as doubly tagged traffic. Outer customer VLAN is replaced by DMF filter interface VLAN.
Packet exits DMF as doubly tagged traffic. Outer customer VLAN is replaced by DMF filter interface VLAN.
Packet exits DMF as singly tagged traffic. VLAN in the policy is the inner customer VLAN.
Packet exits DMF as singly tagged traffic. VLAN in the policy is the DMF filter interface VLAN.
Packet exits DMF as untagged traffic.
Auto VLAN Strip using the GUI
Auto VLAN Strip
A toggle button controls the configuration of this feature. Locate the corresponding card and use the toggle switch.
Figure 15. Toggle Switch
A confirm window pops up, displaying the corresponding prompt message. Use Enable to confirm the configuration changes orCancel to cancel the configuration. Conversely, to disable the configuration, select Disable.
Figure 16. Confirm / Enable
Review any warning messages that appear in the confirmation window during the configuration process.
Figure 17. Warning Message - Changing
The following feature sets work in the same manner as the Auto VLAN Strip feature described above.
CRC Check
Custom Priority
Inport Mask
Policy Overlap Limit Strict
Retain User Policy VLAN
Tunneling
CRC Check
If the Switch CRC option is enabled, which is the default, each DMF switch drops incoming packets that enter the fabric with a CRC error. The switch generates a new CRC if the incoming packet was modified using an option that modifies the original CRC checksum, which includes the push VLAN, rewrite VLAN, strip VLAN, and L2 GRE tunnel options.
Note: Enable the Switch CRC option to use the DMF tunneling feature.
If the Switch CRC option is disabled, DMF switches do not check the CRC of incoming packets and do not drop packets with CRC errors. Also, switches do not generate a new CRC if the packet is modified. This mode is helpful if packets with CRC errors need to be delivered to a destination tool unmodified for analysis. When disabling the Switch CRC option, ensure the destination tool does not drop packets having CRC errors. Also, recognize that CRC errors will be caused by modification of packets by DMF options so that these CRC errors are not mistaken for CRC errors from the traffic source.
Note: When the Switch CRC option is disabled, packets going to the Service Node or Recorder Node are dropped because a new CRC is not calculated when push-per-policy or push-per-filter adds a VLAN tag.
Enable and disable CRC Check using the steps described in the following topics.
If the Switch CRC option is enabled, which is the default, each DMF switch drops incoming packets that enter the fabric with a CRC error. The switch generates a new CRC if the incoming packet was modified using one option that modifies the original CRC checksum, which includes the push VLAN, rewrite VLAN, strip VLAN, and L2 GRE tunnel options.
Note: Enable the Switch CRC option to use the DMF tunneling feature.
If the Switch CRC option is disabled, DMF switches do not check the CRC of incoming packets and do not drop packets with CRC errors. Also, switches do not generate a new CRC if the packet is modified. This mode is helpful if packets with CRC errors need to be delivered to a destination tool unmodified for analysis. When disabling the Switch CRC option, ensure the destination tool does not drop packets having CRC errors. Also, recognize that CRC errors will be caused by modification of packets by DMF options so that these CRC errors are not mistaken for CRC errors from the traffic source.
To disable the Switch CRC option, enter the following command from config mode:
controller-1(config)# no crc
Disabling CRC mode may cause problems to tunnel interface. Enter “yes” (or “y”) to continue: y
In the event the Switch CRC option is disabled, re-enable the Switch CRC option using the following command from config mode:
controller-1(config)# crc
Enabling CRC mode would cause packets with crc error dropped. Enter "yes" (or "y
") to continue: y
Tip: To enable or disable the CRC through the GUI, refer to the chapter, Check CRC using the GUI.
Note: When the Switch CRC option is disabled, packets going to the service node or recorder node are dropped because a new CRC is not calculated when push-per-policy or push-per-filter adds a VLAN tag.
CRC Check using the GUI
From the DMF Features page, proceed to the CRC Check feature card and perform the following steps to enable the feature.
Select the CRC Check card.
Figure 18. CRC Check Disabled
Toggle the CRC Check to On.
Confirm the activation by selecting Enable. Or, Cancel to return to the DMF Features page.
Figure 19. Enable CRC Check
CRC Check is running.
Figure 20. CRC Check Enabled
To disable the feature, toggle the CRC Check to Off. Select Disable and confirm.
Figure 21. Disable CRC Check
The feature card updates with the status.
Figure 22. CRC Check Disabled
Custom Priority
When custom priorities are allowed, non-admin users may assign policy priorities between 0 and 100 (the default value). However, when custom priorities are not allowed, the default priority of 100 will be automatically assigned to non-admin users' policies.
Enable and disable Custom Priority using the steps described in the following topics.
From the DMF Features page, proceed to the Custom Priority feature card and perform the following steps to enable the feature.
Select the Custom Priority card.
Figure 23. Custom Priority Disabled
Toggle the Custom Priority to On.
Confirm the activation by selecting Enable. Or, Cancel to return to the DMF Features page.
Figure 24. Enable Custom Priority
Custom Priority is running.
Figure 25. Custom Priority Enabled
To disable the feature, toggle the Custom Priority to Off. Select Disable and confirm.
Figure 26. Disable Custom Priority
The feature card updates with the status.
Figure 27. Custom Priority Disabled
Configuring Custom Priority using the CLI
To enable the Custom Priority, enter the following command:
controller-1(config)# allow-custom-priority
To disable the Custom Priority, enter the following command:
controller-1(config)# no allow-custom-priority
Device Deployment Mode
Complete the fabric switch installation in one of the following two modes:
Layer 2 Zero Touch Fabric (L2ZTF, Auto-discovery switch provisioning mode)
In this mode, switch software automatically discovers the Controller via IPv6 local link addresses and downloads and installs the appropriate Switch Light OS image from the Controller. This installation method requires all the fabric switches and the DMF Controller to be in the same Layer 2 network (IP subnet). Also, suppose the fabric switches need IPv4 addresses to communicate with SNMP or other external services. In that case, users must configure IPAM, which provides the Controller with a range of IPv4 addresses to allocate to the fabric switches.
Layer 3 Zero Touch Fabric (L3ZTF, Preconfigured switch provisioning mode)
When fabric switches are in a different Layer 2 network from the Controller, log in to each switch individually to configure network information and download the ZTF installer. Subsequently, the switch automatically downloads Switch Light OS from the Controller. This mode requires communication between the Controller and the fabric switches using IPv4 addresses, and no IPAM configuration is required.
The following table summarizes the requirements for installation using each mode:
Table 10. Device Deployment Mode
Requirement
Layer 2 mode
Layer 3 mode
Any switch in a different subnet from the controller
No
Yes
IPAM configuration for SNMP and other IPv4 services
Yes
No
IP address assignment
IPv4 or IPv6
IPv4
Refer to this section (in User Guide)
Using L2 ZTF (Auto-Discovery) Provisioning Mode
Changing to Layer 3 (Pre-Configured) Switch Provisioning Mode
All the fabric switches in a single fabric must be installed using the same mode. If users have any fabric switches in a different IP subnet than the Controller, users must use Layer 3 mode for installing all the switches, even those in the same Layer 2 network as the Controller. Installing switches in mixed mode, with some switches using ZTF in the same Layer 2 network as the Controller, while other switches in a different subnet are installed manually or using DHCP is unsupported.
Configuring Device Deployment Mode using the GUI
From the DMF Features page, proceed to the Device Deployment Mode feature card and perform the following steps to manage the feature.
Select the Device Deployment Mode card.
Figure 28. Device Deployment Mode - Auto Discovery
Enter the edit mode using the pencil icon.
Figure 29. Configure Device Deployment Mode
Change the switching mode as required using the drop-down menu. The default mode is Auto Discovery.
DANZ Monitoring Fabric implements multiple flow optimizations to reduce the number of flows programmed in the DMF switch TCAM space. This feature enables effective usage of TCAM space, and it is on by default.
When this feature is off, TCAM rules are applied for each ingress port belonging to the same policy. For example, in the following topology, if a policy was configured with 10 match rules and filter-interface as F1 and F2, then 20 (10 for F1 and 10 for F2) TCAM rows were consumed.
Figure 33. Simple Inport Mask Optimization
With inport mask optimization, only 10 rules are consumed. This feature optimizes TCAM usage at every level (filer, core, delivery) in the DMF network.
Consider the more complex topology illustrated below:
Figure 34. Complex Inport Mask Optimization
In this topology, if a policy has N rules without in-port optimization, the policy will consume 3N at Switch 1, 3N at Switch 2, and 2N at Switch 3. With the in-port optimization feature enabled, the policy consumes only N rules at each switch.
However, this feature loses granularity in the statistics available because there is only one set of flow mods for multiple filter ports per switch. Statistics without this feature are maintained per filter port per policy.
With inport optimization enabled, the statistics are combined for all input ports sharing rules on that switch. The option exists to obtain filter port statistics for different flow mods for each filter port. However, this requires disabling inport optimization, which is enabled by default.
To disable the inport optimization feature, enter the following command from config mode:
controller-1(config)# controller-1(config)# no inport-mask
Inport Mask using the GUI
From the DMF Features page, proceed to the Inport Mask feature card and perform the following steps to enable the feature.
Select the Inport Mask card.
Figure 35. Inport Mask Disabled
Toggle the Inport Mask to On.
Confirm the activation by selecting Enable. Or, Cancel to return to the DMF Features page.
Figure 36. Enable Inport Mask
Inport Mask is running.
Figure 37. Inport Mask Enabled
To disable the feature, toggle the Inport Mask to Off. Select Disable and confirm.
Figure 38. Disable Inport Mask
The feature card updates with the status.
Figure 39. Inport Mask Disabled
Match Mode
Switches have finite hardware resources available for packet matching on aggregated traffic streams. This resource allocation is relatively static and configured in advance. The DANZ Monitoring Fabric supports three allocation schemes, referred to as switching (match) modes:
L3-L4 mode (default mode): With L3-L4 mode, fields other than src-mac and dst-mac can be used for specifying policies. If no policies use src-mac or dst-mac, the L3-L4 mode allows more match rules per switch.
Full-match mode: With full-match mode, all matching fields, including src-mac and dst-mac, can be used while specifying policies.
L3-L4 Offset mode: L3-L4 offset mode allows matching beyond the L4 header up to 128 bytes from the beginning of the packet. The number of matches per switch in this mode is the same as in full-match mode. As with L3-L4 mode, matches using src-mac and dst-mac are not permitted.
Note: Changing switching modes causes all fabric switches to disconnect and reconnect with the Controller. Also, all existing policies will be reinstalled. The switching mode applies to all DMF switches in the DANZ Monitoring Fabric. Switching between modes is possible, but any match rules incompatible with the new mode will fail.
Setting the Match Mode Using the CLI
To use the CLI to set the match mode, enter the following command:
This feature will send traffic to a delivery interface with the user policy VLAN tag instead of the overlap dynamic policy VLAN tag for traffic matching the dynamic overlap policy only. This feature is supported only in push-per-policy mode. For example, policy P1 with filter interface F1 and delivery interface D1, and policy P2 with filter interface F1 and delivery interface D2, and overlap dynamic policy P1_o_P2 is created when the overlap policy condition is met. In this case, the overlap dynamic policy is created with filter interface F1 and delivery interfaces D1 and D2. The user policy P1 assigns a VLAN (VLAN 10) and P2 assigns a VLAN (VLAN 20) when it is created, and the overlap policy also assigns a VLAN (VLAN 30) when it is dynamically created. When this feature is enabled, traffic forwarded to D1 will have a policy VLAN tag of P1 (VLAN 10) and D2 will have a policy VLAN tag of policy P2 (VLAN 20). When this feature is disabled, traffic forwarded to D1 and D2 will have the dynamic overlap policy VLAN tag (VLAN 30). By default, this feature is disabled.
Feature Limitations:
An overlap dynamic policy will fail when the overlap policy has filter (F1) and delivery interface (D1) on the same switch (switch A) and another delivery interface (D2) on another switch (switch B).
Post-to-delivery dynamic policy will fail when it has a filter interface (F1) and a delivery interface (D1) on the same switch (switch A) and another delivery interface (D2) on another switch (switch B).
Overlap policies may be reinstalled when a fabric port goes up or down when this feature is enabled.
Double-tagged VLAN traffic is not supported and is dropped at the delivery interface.
Tunnel interfaces are not supported with this feature.
Only IPv4 traffic is supported; other non-IPv4 traffic is dropped at the delivery interface.
Delivery interfaces with IP addresses (L3 delivery interfaces) are not supported.
This feature is not supported on EOS switches (Arista 7280 switches).
Delivery interface statistics may not be accurate when displayed using the sh policy command. This will happen when policy P1 has F1, D1, D2 and policy P2 has F1, D2. In this case, overlap policy P1_o_P2 is created with delivery interfaces D1, D2. Since D2 is in both policies P1 and P2, overlap traffic is forwarded to D2 with both the P1 policy VLAN and the P2 policy VLAN. The sh policypolicy_name command will not show this doubling of traffic on delivery interface D2. Delivery interface statistics will show this extra traffic forwarded from the delivery interface.
To enable this feature, enter the following command:
controller-1(config)# retain-user-policy-vlan
This will enable retain-user-policy-vlan feature. Non-IP packets will be dropped at delivery. Enter
"yes" (or "y") to continue: yes
To see the current Retain Policy VLAN configuration, enter the following command:
controller-1> show fabric
~~~~~~~~~~~~~~~~~~~~~~~~~ Aggregate Network State ~~~~~~~~~~~~~~~~~~~~~~~~~
Number of switches : 14
Inport masking : True
Number of unmanaged services : 0
Number of switches with service interfaces : 0
Match mode : l3-l4-offset-match
Number of switches with delivery interfaces : 11
Filter efficiency : 1:1
Uptime : 4 days, 8 hours
Max overlap policies (0=disable) : 10
Auto Delivery Interface Strip VLAN : True
Number of core interfaces : 134
State : Enabled
Max delivery BW (bps) : 2.18Tbps
Health : unhealthy
Track hosts : True
Number of filter interfaces : 70
Number of policies : 101
Start time : 2022-02-28 16:18:01.807000 UTC
Number of delivery interfaces : 104
Retain User Policy Vlan : True
Use this feature with the strip-second-vlan option during delivery interface configuration to preserve the outer DMF fabric policy VLAN, strip the inner VLAN of traffic forwarded to a tool, or the strip-no-vlan option during delivery interface configuration.
Retain User Policy VLAN using the GUI
From the DMF Features page, proceed to the Retain User Policy VLAN feature card and perform the following steps to enable the feature.
Select the Retain User Policy VLAN card.
Figure 43. Retain User Policy VLAN Disabled
Toggle the Retain User Policy VLAN to On.
Confirm the activation by selecting Enable. Or, Cancel to return to the DMF Features page.
Figure 44. Enable Retain User Policy VLAN
Retain User Policy VLAN is running.
Figure 45. Retain User Policy VLAN Enabled
To disable the feature, toggle the Retain User Policy VLAN to Off. Select Disable and confirm.
Figure 46. Disable Retain User Policy VLAN
The feature card updates with the status.
Figure 47. Retain User Policy VLAN Disabled
From the DMF Features page, proceed to the Tunneling feature card and perform the following steps to enable the feature.
Select the Tunneling card.
Figure 48. Tunneling Disabled
Toggle Tunneling to On.
Confirm the activation by selecting Enable. Or, Cancel to return to the DMF Features page.
Figure 49. Enable Tunneling
Note: CRC Check must be running before attempting to enable Tunneling. An error message displays if CRC Check is not enabled. Proceeding to select Enable results in a validation error message. Refer to the CRC Check section for more information on configuring the CRC Check feature.
Figure 50. CRC Check Warning Message
Tunneling VLAN is running.
Figure 51. Tunneling Enabled
To disable the feature, toggle Tunneling to Off. Select Disable and confirm.
Figure 52. Disable Tunneling
The feature card updates with the status.
Figure 53. Tunneling VLAN Disabled
Configuring Tunneling using the CLI
To enable the Tunneling, enter the following command:
controller-1(config)# tunneling

Tunneling is an Arista Licensed feature.
Please ensure that you have purchased the license for tunneling before using this feature.
Enter "yes" (or "y") to continue: y
controller-1(config)#
To disable the Tunneling, enter the following command:
controller-1(config)# no tunneling
This would disable tunneling feature? Enter "yes" (or "y") to continue: y
controller-1(config)#
VLAN Preservation
In DANZ Monitoring Fabric (DMF), metadata is appended to the packets forwarded by the fabric to a tool attached to a delivery interface. This metadata is encoded primarily in the outer VLAN tag of the packets.
By default (using the auto-delivery-strip feature), this outer VLAN tag is always removed on egress upon delivery to a tool.
The VLAN preservation feature introduces a choice to selectively preserve a packet's outer VLAN tag instead of stripping or preserving all of it.
VLAN preservation works in both push-per-filter and push-per-policy mode for auto-assigned and user-configured VLANs.
Note: VLAN preservation applies to switches running SWL OS and does not apply to switches running EOS.
This functionality only supports 2000 VLAN IDs and port combinations per switch.
Support for VLAN preservation is on select Broadcom® switch ASICs. Ensure your switch model supports this feature before attempting to configure it.
Configure VLAN Preservation
VLAN preservation can be configured at global and local levels. A local configuration can override the global configuration. Follow the steps outlined below to configure a Global Configuration (steps 1 - 4), Local Configuration (steps 5-7), or an MLAG Delivery Interface configuration within an MLAG domain (step 8).
Global Configuration
To view or edit the global configuration, navigate to the DANZ Monitoring Fabric (DMF) Features page by selecting the gear icon in the navigation bar.
Figure 54. DMF Menu Bar
The DMF Feature allows for managing fabric-wide settings for DMF.
Scroll to the VLAN Preservation card.
Figure 55. DMF Features Page
Figure 56. VLAN Preservation Card
Select Edit (pencil icon) to configure or modify the global VLAN Preservation feature settings.
Figure 57. Edit VLAN Preservation Configuration
The edit screen has two input sections:
Toggle on or off the Preserve User Configured VLANs.
Enter the parameters for VLAN Preserve using the following functions:
Use + Add VLAN to add VLAN IDs.
Select the Single VLAN type drop-down to add a single VLAN ID.
Select the Range VLAN type drop-down to add a continuous VLAN ID range.
Use the Trash icon (delete) to delete a single VLAN ID or a VLAN ID range.
Select Submit to save the configuration.
Local Configuration
The VLAN Preservation configuration can be applied per-delivery interface while configuring or editing a delivery or filter-and-delivery interface in DMF Interfaces and Monitoring Interfaces > Delivery Interfaces.
The following inputs are available for the local feature configuration:
Enable VLAN Preservation. Use this option to preserve all user-configured VLAN IDs in push-per-policy or push-per-filter mode on a selected delivery interface. The packets with the user-configured VLANs will have their fabric-applied VLAN tags preserved even after leaving the respective delivery interface.
Preserve User Configured VLANs. Refer to Step 3.
Disable VLAN Preservation. Disabling this option will ignore this feature configuration given globally/locally for this delivery interface. VLAN Preservation is enabled by default.
Select Save to save the configuration.
VLAN Preservation for MLAG Delivery Interfaces
Configure VLAN preservation for MLAG delivery interfaces using the FabricMLAGs page while configuring an MLAG Domain toggling the VLAN Preservation and Preserve User Configured VLANs switches to on (as required).
Configure VLAN preservation at two levels: global and local. A local configuration can override the global configuration.
Global Configuration
Enable VLAN preservation globally using the vlan-preservation command from the config submode to apply aglobal configuration.
(config)# vlan-preservation
Two options exist while in the config-vlan-preservation submode:
preserve-user-configured-vlans
preserve-vlans
Use the help function to list the options by entering a ? (question mark).
(config-vlan-preservation)# ?
Commands:
preserve-user-configured-vlans     Preserve all user-configured VLANs for all delivery interfaces
preserve-vlan                      Configure VLAN ID to preserve for all delivery interfaces
Use the preserve-user-configured-vlans option to preserve all user-configured VLANs. The packets with the user-configured VLANs will have their fabric-applied VLAN tags preserved even after leaving the respective delivery interface.
Use the preserve-vlan option to specify and preserve a particular VLAN ID. Any VLAN ID may be provided. In the following example, the packets with VLAN ID 100 or 200 will have their fabric-applied VLAN tags preserved upon delivery to the tool.
This feature applies to delivery and both-filter-and-delivery interface roles.
Fabric-applied VLAN tag preservation can be enabled locally on each delivery interface as an alternative to the global VLAN preservation configuration. To enable this functionality locally, enter the following configuration submode using the if-vlan-preservation command to specify either one of the two available options. Use the help function to list the options by entering a ? (question mark).
(config-switch-if)# if-vlan-preservation
(config-switch-if-vlan-preservation)# ?
Commands:
preserve-user-configured-vlans     Preserve all user-configured VLANs for all delivery interfaces
preserve-vlan                      Configure VLAN ID to preserve for all delivery interfaces
Use the preserve-user-configured-vlans option to preserve all user-configured VLAN IDs in push-per-policy or push-per-filter mode on a selected delivery interface. All packets egressing such delivery interface will have their user-configured fabric VLAN tags preserved.
Use the preserve-vlan option to specify and preserve a particular VLAN ID. For example, if any packets with VLAN ID 100 or 300 egress the selected delivery interface, VLAN IDs 100 and 300 will be preserved.
Note: Any local vlan-preservation configuration overrides the global configuration for the selected interfaces by default.
On an MLAG delivery interface, the local configuration follows the same model, as shown below.
(config-mlag-domain-if)# if-vlan-preservation member role
(config-mlag-domain-if)# if-vlan-preservation
(config-mlag-domain-if-vlan-preservation)# preserve-user-configured-vlans preserve-vlan
To disable selective VLAN preservation for a particular delivery or both-filter-and-delivery interface, use the following command to disable the feature's global and local configuration for the selected interface:
(config-switch-if)# role delivery interface-name del
<cr>                 no-analytics          strip-no-vlan         strip-second-vlan
ip-address            no-vlan-preservation  strip-one-vlan        strip-two-vlan
(config-switch-if)# role delivery interface-name del no-vlan-preservation
CLI Show Commands
The following show command displays the device name on which VLAN preservation is enabled and the information about which VLAN is preserved on specific selected ports. Use the data in this table primarily for debugging purposes.
# show switch all table vlan-preserve
# Vlan-preserve Device name Entry key
-|-------------|-----------|----------------------|
1 0             delivery1   VlanVid(0x64), Port(6)
2 0             filter1     VlanVid(0x64), Port(6)
3 0             core1       VlanVid(0x64), Port(6)
Troubleshooting
Use the following commands to troubleshoot the scenario in which a tool attached to a delivery interface expects a packet with a preserved VLAN tag, but instead, there is no tag attached to it; double-check the following.
A partial policy installation may occur if any delivery interface fails to preserve the VLAN tag. This can happen when exceeding the 2000 VLAN ID/Port combination limit. Use the show policypolicy-name command to obtain a detailed status, as shown in the following example:
(config)# show policy vlan-999
Policy Name                            : vlan-999
Config Status                          : active - forward
Runtime Status                         : installed but partial failure
Detailed Status                        : installed but partial failure -
                                         Failed to preserve VLAN's on some/all
                                         delivery interfaces, see warnings for details
Priority                               : 100
Overlap Priority                       : 0
# of switches with filter interfaces   : 1
# of switches with delivery interfaces : 1
# of switches with service interfaces  : 0
# of filter interfaces                 : 1
# of delivery interfaces               : 1
# of core interfaces                   : 2
# of services                          : 0
# of pre service interfaces            : 0
# of post service interfaces           : 0
Push VLAN                              : 999
Post Match Filter Traffic              : -
Total Delivery Rate                    : -
Total Pre Service Rate                 : -
Total Post Service Rate                : -
Overlapping Policies                   : none
Component Policies                     : none
Installed Time                         : 2023-11-06 21:01:11 UTC
Installed Duration                     : 1 week
Verify the running config and review if the VLAN preservation configuration is enabled for that VLAN ID and on that delivery interface.
Verify if a switch has any associated preserve VLAN warnings among the fabric warnings:
(config-vlan-preservation)# show fabric warnings | grep "preserve
1 delivery1 (00:00:52:54:00:85:ca:51) Switch 00:00:52:54:00:85:ca:51
cannot preserve VLANs for some interfaces due to resource exhaustion.
The show fabric warnings feature-unsupported-on-device command provides information on whether VLAN preservation is configured on any unsupported devices:
(config-switch)# show fabric warnings feature-unsupported-on-device
# Name Warning
-|----|------------------------------------------------------------|
1 del1 VLAN preservation feature is not supported on EOS switch eos
In the event of any preserve VLAN fabric warnings, please contact the This email address is being protected from spambots. You need JavaScript enabled to view it. for assistance.
Reuse of Policy VLANs
Policies can reuse VLANs for policies in different switch islands. A switch island is an isolated fabric managed by a single pair of controllers; there is no data plane connection between fabrics in different switch islands. For example, with a single Controller pair managing six switches (switch1, switch2, switch3, switch4, switch5, and switch6 the option exists to create two fabrics with three switches each (switch1, switch2, switch3 in one switch island and switch4, switch5, and switch6 in another switch island), as long as there is no data plane connection between switches in the different switch islands.
There is no command needed to enable this feature. If the above condition is met, creating policies in each switch island with the same policy VLAN tag is supported.
In the condition mentioned above, assign the same policy VLAN to two policies in different switch islands using the push-vlanvlan-tag command under policy configuration. For example, policy P1 in switch island 1 assigned push-vlan 10, and policy P2 in switch island 2 assigned the same vlan tag 10 using push-vlan 10 under policy configuration.
When a data plane link connects two switch islands, it becomes one switch island. In that case, two policies cannot use the same policy vlan tag, so one of the policies (P1 or P2) will become inactive.
Rewriting the VLAN ID for a Filter Interface
When sharing a destination tool with multiple filter interfaces, use the VLAN identifier assigned by the rewrite VLAN option to identify the ingress filter interface for specific packets. To use the rewrite VLAN option, assign a unique VLAN identifier to each filter interface. Ensure this VLAN ID is outside of the auto-VLAN range.
Note: In push-per-policy mode, enabling the rewrite VLAN feature on filter interfaces is impossible. When doing so, a validation error is displayed. This feature is available only in the push-per-filter mode.
The following commands change the VLAN tag on packets received on the interface ethernet10 on f-switch1 to 100. The role command in this example also assigns the alias TAP-PORT-1 to Ethernet interface 10.
The rewrite VLAN option overwrites the original VLAN frame tag if it was already tagged, and this changes the CRC checksum so it no longer matches the modified packet. The switch CRC option, enabled by default, rewrites the CRC after the frame has been modified so that a CRC error does not occur.
Note: Starting with DMF Release 7.1.0, simultaneously rewriting the VLAN ID and MAC address is supported and uses VLAN rewriting to isolate traffic while using MAC rewriting to forward traffic to specific VMs.
Reusing Filter Interface VLAN IDs
A DMF fabric comprises groups of switches, known as islands, connected over the data plane. There are no data plane connections between switches in different islands. When Push-Per-Filter forwarding is enabled, monitored traffic is forwarded within an island using the VLAN ID affiliated with a Filter Interface. These VLAN IDs are configurable. Previously, the only recommended configuration was for these VLAN IDs to be globally unique.
This feature adds official support for associating the same VLAN ID with multiple Filter Interfaces as long as they are in different islands. This feature provides more flexibility when duplicating Filter Interface configurations across islands and helps prevent using all available VLAN IDs.
Note that within each island, VLAN IDs must still be unique, which means that Filter Interfaces in the same group of switches cannot have the same ID. When trying to reuse the same VLAN ID within an island, DMF generates a fabric error, and only the first Filter Interface (as sorted alphanumerically by DMF name) remains in use.
Configuration
This feature requires no special configuration beyond the existing Filter Interface configuration workflow.
Troubleshooting
A fabric error occurs if the same VLAN ID is configured more than once in the same island. The error message includes the Filter Interface name, the switch name, and the VLAN ID that is not unique. When encountering this error, pick a different non-conflicting VLAN ID.
Filter Interface invalid VLAN errors can be displayed in the CLI using the following command:
The following is a vertical representation of the CLI output above for illustrative purposes only.
>show fabric errors filter-interface-invalid-vlan
~~ Invalid Filter Interface VLAN(s) ~~
#               1
DMF Name        filter1-f1
IF Name         ethernet2
Switch          filter1 (00:00:52:54:00:4b:c9:bc)
Rewrite VLAN    1
Details         The configured rewrite VLAN 1 for filter interface filter1-f1
                is not unique within its fabric.
It is helpful to know all of the switches in an island. The following command lists all of the islands (referred to in this command as switch clusters) and their switch members:
>show debug switch-cluster
# Member
-|--------------|
1 core1, filter1
It can also be helpful to know how the switches within an island are interconnected. Use the following command to display all the links between the switches:
>show link all
~~~~~~~~~~~~~~~~~~~~~~~~~~~~~~~~~~~~~~~~~~~~ Links ~~~~~~~~~~~~~~~~~~~~~~~~~~~~~~~~~~~~~~~~~~~~
# Active State Src switch Src IF Name Dst switch Dst IF Name Link Type Since
-|------------|----------|-----------|----------|-----------|---------|-----------------------|
1 active       filter1    ethernet1   core1      ethernet1   normal    2023-05-24 22:31:39 UTC
2 active       core1      ethernet1   filter1    ethernet1   normal    2023-05-24 22:31:40 UTC
Considerations
VLAN IDs must be unique within an island. Filter Interfaces in the same island with the same VLAN ID are not supported.
This feature only applies to manually configured Filter Interface VLAN IDs. VLAN IDs that are automatically assigned are still unique across the entire fabric.
Using Push-per-filter Mode
The push-per-filter mode setting does not enable tag-based forwarding. Each filter interface is automatically assigned a VLAN ID; the default range is 1 to 4094. To change the range, use the auto-vlan-range command.
The option exists to manually assign a VLAN not included in the defined range to a filter interface.
To manually assign a VLAN to a filter interface in push-per-filter mode, complete the following steps:
Change the auto-vlan-range from the default (1-4094) to a limited range, as in the following example:
The example above configures the auto-VLAN feature to use VLAN IDs from 1 to 1000.
Assign a VLAN ID to the filter interface that is not in the range assigned to the auto-VLAN feature.
controller-1(config)# role filter interface-name TAP-1 rewrite vlan 1001
Tag-based Forwarding
The DANZ Monitoring Fabric (DMF) Controller configures each switch with forwarding paths based on the most efficient links between the incoming filter interface and the delivery interface, which is connected to analysis tools. The TCAM capacity of the fabric switches may limit the number of policies to configure. The Controller can also use VLAN tag-based forwarding, which reduces the TCAM resources required to implement a policy.
Tag-based forwarding is automatically enabled when the auto-VLAN Mode is push-per-policy, which is the default. This configuration improves traffic forwarding within the monitoring fabric. DMF uses the assigned VLAN tags to forward traffic to the correct delivery interface, saving TCAM space. This feature is handy when using switches based on the Tomahawk chipset because these switches have higher throughput but reduced TCAM space.
Policy Rule Optimization
Prefix Optimization
A policy can match with a large number of IPv4 or IPv6 addresses. These matches can be configured explicitly on each match rule, or the match rules can use an address group. With prefix optimization based on IPv4, IPv6, and TCP ports, DANZ Monitoring Fabric (DMF) uses efficient masking algorithms to minimize the number of flow entries in hardware.
Example 1: Optimize the same mask addresses.
controller-1(config)# policy ip-addr-optimization
                controller-1(config-policy)# action forward
                controller-1(config-policy)# delivery-interface TOOL-PORT-1
                controller-1(config-policy)# filter-interface TAP-PORT-1
                controller-1(config-policy)# 10 match ip dst-ip 1.1.1.0 255.255.255.255
                controller-1(config-policy)# 11 match ip dst-ip 1.1.1.1 255.255.255.255
                controller-1(config-policy)# 12 match ip dst-ip 1.1.1.2 255.255.255.255
                controller-1(config-policy)# 13 match ip dst-ip 1.1.1.3 255.255.255.255
                controller-1(config-policy)# show policy ip-addr-optimization optimized-match
                Optimized Matches :
                10 ether-type 2048 dst-ip 1.1.1.0 255.255.255.252
Example 2: In this case, if a generic prefix exists, all the specific addresses are not programmed in TCAM.
controller-1(config)# policy ip-addr-optimization
                controller-1(config-policy)# action forward
                controller-1(config-policy)# delivery-interface TOOL-PORT-1
                controller-1(config-policy)# filter-interface TAP-PORT-1
                controller-1(config-policy)# 10 match ip dst-ip 1.1.1.0 255.255.255.255
                controller-1(config-policy)# 11 match ip dst-ip 1.1.1.1 255.255.255.255
                controller-1(config-policy)# 12 match ip dst-ip 1.1.1.2 255.255.255.255
                controller-1(config-policy)# 13 match ip dst-ip 1.1.1.3 255.255.255.255
                controller-1(config-policy)# 100 match ip dst-ip 1.1.0.0 255.255.0.0
                controller-1(config-policy)# show policy ip-addr-optimization optimized-match
                Optimized Matches :
                100 ether-type 2048 dst-ip 1.1.0.0 255.255.0.0
Example 3: IPv6 prefix optimization. In this case, if a generic prefix exists, the specific addresses are not programmed in the TCAM.
Example 4: Different subnet prefix optimization. In this case, addresses belonging to different subnets are optimized.
controller-1(config)# policy ip-addr-optimization
                controller-1(config-policy)# 10 match ip dst-ip 2.1.0.0 255.255.0.0
                controller-1(config-policy)# 11 match ip dst-ip 3.1.0.0 255.255.0.0
                controller-1(config-policy)# show policy ip-addr-optimization optimized-match
                Optimized Matches : 10 ether-type 2048 dst-ip 2.1.0.0 254.255.0.0
Transport Port Range and VLAN Range Optimization
The DANZ Monitoring Fabric (DMF) optimizes transport port ranges and VLAN ranges within a single match rule. Improvements in DMF now support cross-match rule optimization.
Show Commands
To view the optimized match rule, use the show command:
# show policy policy-name optimized-match
To view the configured match rules, use the following command:
# show running-config policy policy-name
Consider the following DMF policy configuration.
# show running-config policy p1
! policy
policy p1
action forward
delivery-interface d1
filter-interface f1
1 match ip vlan-id-range 1 4
2 match ip vlan-id-range 5 8
3 match ip vlan-id-range 7 16
4 match ip vlan-id-range 10 12
With the above policy configuration and before the DMF 8.5.0 release, the four match conditions would be optimized into the following TCAM rules:
However, with the cross-match rule optimizations introduced in this release, the rules installed in the switch would further optimize TCAM usage, resulting in:
A similar optimization technique applies to L4 ports in match conditions:
# show running-config policy p1
! policy
policy p1
action forward
delivery-interface d1
filter-interface f1
1 match tcp range-src-port 1 4
2 match tcp range-src-port 5 8
3 match tcp range-src-port 7 16
4 match tcp range-src-port 9 14

# show policy p1 optimized-match
Optimized Matches :
1 ether-type 2048 ip-proto 6 src-port 0 -16
1 ether-type 2048 ip-proto 6 src-port 16 -1
Match Rule Field Set Optimization
When several IP addresses are used in a single policy (whether via an address group or individually across match rules with otherwise identical conditions), the Controller groups the addresses together and programs them as a field set on supported switches.
TCAM directly references the field set label, enabling entry matching against packets containing any associated IP prefixes. This optimization dramatically reduces TCAM consumption for policies involving numerous addresses, facilitating the programming of significantly more policies or addresses without exceeding hardware capacity limits.
For example, on a switch incapable of performing this optimization, a policy matching traffic from a 100-entry source address group to a 100-entry destination address group would require 100x100=10,000 individual entries. With this optimization, the Controller programs two field sets and a single match rule that references both, reducing TCAM consumption for that policy from 10,000 entries to just 1.
The feature operates transparently without requiring any configuration changes or user intervention. The Controller automatically detects switch capabilities and applies optimizations only when supported by the switch.
Note: On switches lacking this feature, the existing method programs policies.
The following switches support Match Rule Field Set Optimization:
7280R3 series
7280R3A series
7800R3
Configuration
No configuration is necessary. This feature operates automatically during rule installation on supported hardware. The Controller selects field set optimization based on the specific rules and the destination switch.
Show Commands
Running the following command confirms switch support by verifying that Aegis Field Set Supported displays True within the switch properties:
dmf-controller # show switch switch-name property
Switch                               : switch-name
…
Aegis Field Set Supported            : True
…
Troubleshooting
The following commands facilitate troubleshooting.
Use the show switch switch-name table contents
ingress-flow-2 command to display rules programmed to a switch:
dmf-controller(config-policy)# show switch switch-name table contents ingress-flow-2
~~~~~~~~~~~~~~~~~~~~~~~~~~~~~~~~~~~~~~~~~~~~~~~~~~~~~ Ingress-flow-2s ~~~~~~~~~~~~~~~~~~~~~~~~~~~~~~~~~~~~~~~~~~~~~~~~~~~~~~~~~~~~~~~~~~~~~~~~~~~~~
# Ingress-flow-2 Device name Entry key                                                                                               Entry value
-|--------------|-----------|-------------------------------------------------------------------------------------------------------|-----------------|
1 0              sw          Priority(6400), Port(1701), EthType(2048), FieldSetMatch(mtype=BSN_FIELD_SET_MATCH_IPV4_SRC, name=[52]) Name(test), …
Alternately, use the show policy <policy-name> flow command:
dmf-controller(config-policy)# show policy policy-name flow
~~~~~~~~~~~~~~~~~~~~~~~~~~~~~~~~~~~~~~~~~~~~~~~~~~~~~~~~~~~~~~ Policy Flow Info ~~~~~~~~~~~~~~~~~~~~~~~~~~~~~~~~~~~~~~~~~~~
# Policy Switch Pkt/s Bit/s Priority In-Ports Match                                         Instructions
-|------|------|-----|-----|--------|--------|---------------------------------------------|-------------------------------------|
1 test   sw     0.0   -              1701     ether-type 2048,ipv4-src ipv4-src field-set 4 apply: name=<policy-name> push-vlan: ...

~~~~~~ Policy Match Rule & Flow Correlation  ~~~~~~
# Policy Switch Flow Related Policy Policy Matches
-|------|------|---|--------------|--------------|
1 test   sw     #1  test           1
The following command displays the contents of a field set on a switch. Matching names facilitate correlation across outputs. The name in the field-set and ingress-flow-2 output represents the byte values of the string shown in the show policy
policy-name flow output.
For instance, the Unicode character 4 in the earlier show policy policy-name flow policy flow output corresponds to name=[52] in the following field set output.
dmf=controller (config-policy)# show switch switch-name table contents field-set
~~~~~~~~~~~~~~~~~~~~~~~~~~~~~~~~~~~~~~~~~~~~~~~~~~~~~~~~~~~~~~~~~~~~~~~~~~~~~~ Field-sets ~~~~~~~~~~~~~~~~~~~~~~~~~~~~~~~~~~~~~~~~~~
# Field-set Device name Entry key                                      Entry value
-|---------|-----------|----------------------------------------------|----------------------------------------------------------------------------|
1 0         sw          FieldSet(fstype=BSN_FIELD_SET_IPV4, name=[52]) Ipv4Prefix(10.0.0.2, prefixLength=31), Ipv4Prefix(10.0.0.8, prefixLength=32)
Note: For documentation purposes, the earlier outputs display only relevant sections.
Examples
Policy P1 with filter interface F1 and delivery interface D1 on a 7280R3 switch switch1 with 5 rules as shown in the following.
policy P1
  action forward
  delivery-interface D1
  filter-interface F1
  1 match full ether-type ip src-ip 192.168.23.10
  2 match full ether-type ip src-ip 78.1.32.20
  3 match full ether-type ip protocol 6 range-src-ip 30.1.1.0 30.1.1.100 src-port 443
  4 match full ether-type ip protocol 6 src-port 8080
  5 match full ether-type ip protocol 6 src-port 22
Previous DMF releases would have installed 8 TCAM entries on a 7280R3 switch for the example policy. The current release installs only four TCAM entries by utilizing the Aegis field-set optimization feature.
Aegis field set 1 is used for match rule 1 and 2 for source ip address 78.1.32.20 and 192.168.23.10. Aegis field set 2 is used for match rule for range-src-ip 30.1.1.0 to 30.1.1.100.
switch1# sh management dmf flow ingress 2 brief
Total flows: 4
Programmed: 4
Pending: 0
Failed: 0
Flows:

4 [ipv4] protocol tcp source port ssh destination port all in:Et7 setOuterVlan:179;Et12 [0/0] [S]
3 [ipv4] protocol tcp source port 8080 destination port all in:Et7 setOuterVlan:179;Et12 [0/0] [S]
2 [ipv4] source prefix field-set 7F protocol tcp source port https destination port all in:Et7 setOuterVlan:179;Et12 [0/0] [S]
1 [ipv4] source prefix field-set 7E in:Et7 setOuterVlan:179;Et12 [0/0] [S]
switch1# sh traffic-policy field-set ipv4 prefix
Traffic policy IPv4 prefix field set: 7E
Source:

Prefix count: 2
Exception prefix count: 0
Prefix               Exception Prefixes
-------------------  ----------------------------------------------------------
78.1.32.20/32
192.168.23.10/32
Used in policies: INFLOW2_PMAP_Et7
Traffic policy IPv4 prefix field set: 7F
Source:

Prefix count: 4
Exception prefix count: 0
Prefix               Exception Prefixes
-------------------  ----------------------------------------------------------
30.1.1.0/26
30.1.1.64/27
30.1.1.96/30
30.1.1.100/32
Used in policies: INFLOW2_PMAP_Et7
Considerations
Supported switches maintain a default maximum capacity of approximately 15,000 IPv4 addresses or 5,000 IPv6 addresses across all field sets combined. Exceeding this limit causes policy installation failure.
In mixed fabrics containing both supported and non-supported hardware, the entire policy may fail if the required rule count exceeds the capacity of any non-supported switch, even if the supported switches have a lower rule count.
Policy creation triggers rule optimization into the most condensed form. Consequently, the optimized-match output count may appear significantly lower than the actual rules required for switches lacking this optimization.
Switch Dual Management Port
Overview
When a DANZ Monitoring Fabric (DMF) switch disconnects from the Controller, the switch is taken out of the fabric, causing service interruptions. The dual management feature solves the problem by providing physical redundancy of the switch-to-controller management connection. DMF achieves this by allocating a switch data path port to be bonded with its existing management interface, thereby acting as a standby management interface. Hence, it eliminates a single-point failure in the management connectivity between the switch and the Controller.
Once an interface on a switch is configured for management, this configuration persists across reboots and upgrades until explicitly disabling the management configuration on the Controller.
Configure an interface for dual management using the CLI or the GUI.
Note: Along with the configuration on the Controller detailed below, dual management requires a physical connection in the same subnet as the primary management link from the data port to a management switch.
Configuring Dual Management Using the CLI
From config mode, specify the switch to be configured with dual management, as in the following example:
Note: When assigning an interface to a management role, no other interface-specific commands are honored for that interface (e.g., shut-down, role, speed, etc.).
Configuring Dual Management Using the GUI
Select Fabric > Switches from the main menu.
Figure 61. Controller GUI Showing Fabric Menu List
Select the switch name to be configured with dual management.
Figure 62. Controller GUI Showing Inventory of Switches
Set Use for Management Traffic to Yes. This action configures the interface to the standby management role.
Figure 66. Use for Management Traffic
Select Save.
Management Interface Selection Using the GUI
By default, the dedicated management interface serves as the management port, with the front panel data port acting as a backup only when the management interface is unavailable:
When the dedicated management interface fails, the front panel data port becomes active as the management port.
When the dedicated management interface returns, it becomes the active management port.
When the management network is undependable, this can lead to switch disconnects.
The Management Interface choice dictates what happens when the management interface returns after a failover. Make this selection using the GUI or the CLI.
If you select Prefer Dedicated Management Interface (the default), when the dedicated management interface goes down, the front panel data port becomes the active management port for the switch. When the dedicated management port comes back up, the dedicated management port becomes the active management port again, putting the front panel data port in an admin down state.
If you select Prefer Current Interface, when the dedicated management interface goes down, the front panel data port still becomes the active management port for the switch. However, when the dedicated management port comes back up, the front panel data port continues to be the active management port.
Management Interface Selection Using the CLI
By default, the dedicated management interface serves as the management port, with the front panel data port acting as a backup only when the management interface is unavailable:
When the dedicated management interface fails, the front panel data port becomes active as the management port.
When the dedicated management interface returns, it becomes the active management port.
When the management network is undependable, this can lead to switch disconnects. The management interface selection choice dictates what happens when the management interface returns after a failover.
Controller-1(config)# switch DMF-SWITCH-1
Controller-1(config-switch)#management-interface-selection ?
prefer-current-interface Set management interface selection algorithm
prefer-dedicated-management-interface Set management interface selection algorithm (default selection)
Controller-1(config-switch)#
If you select prefer-dedicated-management-interface (the default), when the dedicated management interface goes down, the front panel data port becomes the active management port for the switch. When the dedicated management port comes back up, the dedicated management port becomes the active management port again, putting the front panel data port in an admin down state.
If you select prefer-current-interface, when the dedicated management interface goes down, the front panel data port still becomes the active management port for the switch. However, when the dedicated management port comes back up, the front panel data port continues to be the active management port.
Switch Fabric Management Redundancy Status
To check the status of all switches configured with dual management as well as the interface that is being actively used for management, enter the following command in the CLI:
Controller-1# show switch all mgmt-stats
Additional Notes
A maximum of one data-plane interface on a switch can be configured as a standby management interface.
The switch management interface ma1 is a bond interface, having oma1 as the primary link and the data plane interface as the secondary link.
The bandwidth of the data-plane interface is limited regardless of the physical speed of the interface. Arista Networks recommends immediate remediation when the oma1 link fails.
Management Redundancy on EOS Fixed System Chassis
DANZ Monitoring Fabric (DMF) provides support for Management Redundancy on an Extensible Operating System (EOS) Fixed System Chassis. It provides a method to enable redundant active/active connectivity on the management IP address for a DMF switch in a fixed system chassis using an out-of-band management port and a front-panel port on the switch.
The feature utilizes first hop redundancy protocols such as Virtual Router Redundancy Protocol (VRRP) running in the gateway devices and addressless forwarding on the switch.
Figure 71. Example - Management Redundancy
After enabling the feature, a floating loopback interface is created on the DMF switch and assigned with the Ma1 (Management interface) IP address. Addressless forwarding is enabled on Ma1 and the redundant port (e.g., Et1) along with proxy ARP. This supports the feature without using any more IP addresses. A default route is programmed on the DMF switch to point to the gateway IP (which is assumed to be the virtual IP address of the first-hop redundancy protocol).
When the feature is disabled, the system deletes the floating loopback interface on the DMF switch, and the original Ma1 configurations are automatically re-configured for the Ma1 interface.
Management Redundancy on an EOS fixed system chassis is supported on the following platforms:
Navigate to Fabric > Interfaces and select Configure using the menu icon.
Figure 72. Configure Interface
Navigate to Edit Interface > Port.
Figure 73. Edit Interface
Set Use for Management Traffic to Yes.
Figure 74. Use for Management Traffic
Select Save.
Show Commands
Several show commands are available to view the configuration settings of a redundant management interface.
Use the show running-config switch
switch-name command to view the running-config and the management traffic interface settings, as shown in the following example:
c1(config)# show running-config switch fixed-eos

! switch
switch fixed-eos
  mac 28:99:3a:34:42:81
  !
  interface Ethernet1
    management
Use the show switch switch-name
running-config command to view the running-config generated for the switch, as shown in the following example:
c1(config)# show switch fixed-eos running-config
!
management dmf
controller address 10.243.255.239
no disabled
hostname fixed-eos
username controller privilege 15 role network-admin secret sha512
$6$XTUb68lm$0ohxyre2dzkRoB9ycR37Tjy/sA/DR8V3fOpwdFSjcjy2FmB3GIyOX2T5q.JztN9/tz7ZW2VUSCyPTg8I5dDtR1
aaa authorization exec default local
username admin ssh-key ssh-rsa
AAAAB3NzaC1yc2EAAAADAQABAAACAQC6Bll8rjahrn2YTQ9sQbuQXkt9+KMxJWIq3+d2M6+ZGLeQ5nEMdaALQ2pSoO2DqOBvHD0zq
7qBVDzOKAEkUxdVeFuSZVcuTss32NGKU+q2oD/5Gxu+4tOWIo7J6ljWEtF6FqzINRf7mlEFpSBShLBiX5CfDCvHhwfI4fEwNGDsWS
UgN19j/uWwugv3nuPulCt+2xIUPhRhKHcck6qN+1LTJFJ1VQrljqYq65lDIJ3PxgN9ML1+imbnx4w4kgUXEWRNERkZvqS7nhV1U9d
vblq824eBaM3KnsgDxYDEHu3PAJZLjerqu426v/mC3J/+2ghbcfADwSww0/4rYaKS1Btt4SWG+qVDwtQSKPF9HGVz1+qlhnmGJ+02
WfqXc+qNF5Sa9RpJIJ68VMjHGIHRhOGy6CpI8kA1de2RI7xz7lgB1/3M7DYd5mdV7jlR/Bga9jWwAR60hTlzUYJrBQFJ30DIjvyT3
ZNzgmgS3Bi/fytRRYz4DjkrBNMMggXnk0kIZALxnaabPK14esInW5HMJEapMVgLraOwgGlq+8M8BfCSXbvZvAEFSNKhAE4hhoTjQ0
ds5AuVx8KZODZRnlwtzLRwIv12SCVEhT/hQufM4LDI+Aeek1WNzETAKRlZ/As21ni4+RaKGgFtfpkIp/dyviYTVinNm154SLtHzjh
XeIp6rQ== floodlight@controller\n
clock timezone UTC
ntp server 10.243.255.239
ntp server ntp1.aristanetworks.com
ntp server ntp2.aristanetworks.com
ntp server ntp3.aristanetworks.com
ntp server ntp4.aristanetworks.com
logging host 10.243.255.239
logging host docker1.eng.bigswitch.com 11514
logging trap
snmp-server engineID local 800092a20328993a344281
! redundant management interface Ethernet1
In the example, the output shows ! redundant management interface
Ethernet1 is destined for the switch. This isn't an actual configuration in the usual sense; it’s a comment (i.e. ! is at the front of the string). This line is parsed on the EOS switch and replaced with the relevant configuration to tune the redundant management interface.
If the line ! redundant management interface
Ethernet1 is not present in the running-config of the switch, use the show fabric warnings command to see if there was an issue in applying the configuration to that switch interface. The following example displays the output of the show fabric warnings command when the switch is a VM. DMF does not support this feature for EOS VMs.
c1(config)# show fabric warnings
# Name  Warning
-|-----|---------------------------------------------------------------------------|
1 core2 Redundant management interface config not supported on VM based EOS systems
To confirm that management interface redundancy has been configured on EOS, use the show switch all mgmt-stats command. This will display the management redundancy operational-state and the interface names that are involved.
c1# show switch all mgmt-stats
~~~~~~~~~~~~~~ Switches ~~~~~~~~~~~~~~
# Switch DPID               Redundant
-|-------------------------|---------|
1 swl                       False
2 eos                       True


~~~~~~~~~~~~~~~~~~ Interfaces of Switch DPIDs  ~~~~~~~~~~~~~~~~~~
# Switch DPID               Interface   Active Fail Count LinkUp
-|-------------------------|-----------|------|----------|------|
1 swl                       ethernet2   False  1          False
2 swl                       oma1        True   0          True
3 eos                       Ethernet9   True   3          True
4 eos                       Management1 True   8          True
In the earlier example, the switch eos shows the operational state of management redundancy. The redundant interfaces are Ethernet9 and Management1.
Troubleshooting
If the fixed-system EOS switch is not using a front-panel port as an alternative management redundancy port, yet it was configured on the Controller, perform the following steps:
Inspect the output of the show fabric warnings command to see if the config has been filtered.
c1(config)# show fabric warnings
# Name  Warning
-|-----|---------------------------------------------------------------------------|
1 core2 Redundant management interface config not supported on VM based EOS systems
Inspect the output of the show switch all
zerotouch command to confirm the switch is in an OK state. If it is not, this might be a pointer to the life-cycle managers on the switch having difficulty syncing up the updated running-config. In the following example, the switch named fixed-eos is in a reloading state. If this persists, perform step 3.
c1(config)# show switch all zerotouch
# Name      Device                        Ip address     Platform                   Serial number                    Zerotouch state Last update
-|---------|-----------------------------|--------------|--------------------------|--------------------------------|---------------|------------------------------|
1 fixed-eos 28:99:3a:34:42:81 (Arista)    172.30.157.207 x86_64-dcs-7020tr-48-eos   SSJ17251623                      reloading       2024-06-05 16:02:38.041000 UTC
2 core2     52:54:00:b7:e7:ad (Linux KVM) 10.243.252.111 x86_64-veos-eos            2A7BE3544FA18468729F340F7A451506 ok              2024-06-05 16:02:18.961000 UTC
3 core1     52:54:00:c5:54:58 (Linux KVM) 10.243.253.42  x86-64-bigswitch-bs3240-r0 525400c55458                     ok              2024-06-05 16:02:26.504000 UTC
Investigate the show logging controller output to see if there’s an issue with ZTN in trying to sync up the configuration.
c1(config)# show logging controller last hour

2024-06-13T10:13:07.699-07:00 floodlight: INFO
[PackedFileStateRepository:packed-file-state-repository-worker-thread] PFSTATEREP1007:
Beginning scan of segment files; type=integrity check;
enqueue-time=2024-06-13T17:13:07.699Z, dequeue-time=2024-06-13T10:13:07.699-07:00

2024-06-13T10:13:07.702-07:00 floodlight: INFO
[PackedFileStateRepository:packed-file-state-repository-worker-thread] PFSTATEREP1008:
Scanning segment file: /var/lib/floodlight/db/global-config/data/20240613021314.seg

2024-06-13T10:13:07.704-07:00 floodlight: INFO
[PackedFileStateRepository:packed-file-state-repository-worker-thread] PFSTATEREP1009:
Finished scan of segment files; type=integrity check; enqueue-time=2024-06-13T17:13:07.699Z,
dequeue-time=2024-06-13T17:13:07.699Z, complete-time=2024-06-13T10:13:07.704-07:00

2024-06-13T10:17:24.667-07:00 floodlight: INFO
[AbstractServiceAddressDirectory:FLTP-1-10] SERVADDR1216: Starting garbage collection

2024-06-13T10:17:24.671-07:00 floodlight: INFO
[AbstractServiceAddressDirectory:FLTP-1-10] SERVADDR1215: Scheduling garbage
collection: delay=31 minutes, reason=ROUTINE

2024-06-13T10:43:07.700-07:00 floodlight: INFO
[PackedFileStateRepository:packed-file-state-repository-worker-thread] PFSTATEREP1007:
Beginning scan of segment files; type=integrity check;
enqueue-time=2024-06-13T17:43:07.700Z, dequeue-time=2024-06-13T10:43:07.700-07:00

2024-06-13T10:43:07.703-07:00 floodlight: INFO
[PackedFileStateRepository:packed-file-state-repository-worker-thread] PFSTATEREP1008:
Scanning segment file: /var/lib/floodlight/db/global-config/data/20240613021314.seg

2024-06-13T10:43:07.705-07:00 floodlight: INFO
[PackedFileStateRepository:packed-file-state-repository-worker-thread] PFSTATEREP1009:
Finished scan of segment files; type=integrity check;
enqueue-time=2024-06-13T17:43:07.700Z, dequeue-time=2024-06-13T17:43:07.700Z,
complete-time=2024-06-13T10:43:07.705-07:00

2024-06-13T10:48:24.671-07:00 floodlight: INFO
[AbstractServiceAddressDirectory:FLTP-1-7] SERVADDR1216: Starting garbage collection

2024-06-13T10:48:24.677-07:00 floodlight: INFO
[AbstractServiceAddressDirectory:FLTP-1-7] SERVADDR1215: Scheduling garbage
collection: delay=31 minutes, reason=ROUTINE
Arista Technical Support can investigate the floodlight logs to determine if any note-worthy errors are ZTN-related. If nothing relevant is found in those logs, proceed to step 4.
If possible, investigate the EOS switch using the connect switch
switch-name command. The following is an example of a properly configured and running switch. If Zerotouch state does not indicate Zerotouch handshake is complete this might point to a serious and non-trivial issue with the ZTN process between the controller and switch.
c1(config)# connect switch fixed-eos
fixed-eos> en
fixed-eos(config)# show management dmf controller zerotouch

ZTN is active
Controllers: 10.243.255.239
Manifest timestamp: 2024-06-05 UTC 16:10:37.728336
Zerotouch state: Zerotouch handshake is complete
Limitations
The Management1 interface should be active during the switch reboot and image upgrade.
A default gateway is configured on the switch when the feature is enabled.
The feature doesn’t work with DHCP configuration on the Management interface.
The feature only works for fixed system chassis.
Port configurations such as VLAN tagging, stripping VLAN, rate limit, disabling transmission, and setting truncation size are not allowed for the port chosen as a redundant interface.
The switch's Management interface can only be configured with CLI commands that are also supported for the loopback interface.
A LAG/Port-Channel cannot be configured as a redundant management port.
The front-panel redundant port can have a different MTU value than the Management interface.
In earlier releases, the CLI command show switch all
mgmt-stats will not display the correct interface redundancy opstate.
Controller Lockdown
Controller lockdown mode, when enabled, disallows user configuration such as policy configuration, inline configuration, and rebooting of fabric components and disables data path event processing. If there is any change in the data path, it will not be processed.
The primary use case for this feature is a planned management switch upgrade. During a planned management switch upgrade, DANZ Monitoring Fabric (DMF) switches disconnect from the Controller, and DMF policies are reprogrammed, disrupting traffic forwarding to tools. Enabling this feature before starting a management switch upgrade will not disrupt the existing DMF policies when DMF switches disconnect from the Controller, thereby forwarding traffic to the tools.
Note:DMF policies are reprogrammed when the switches reconnect to the DMF fabric when Controller lockdown mode is disabled after the management switch upgrade is completed. Controller lockdown mode is a special operation and should not be enabled for a prolonged period.
Operations such as switch reboot, Controller reboot, Controller failover, Controller upgrade, policy configuration, etc., are disabled when Controller lockdown mode is enabled.
The command to enable Controller lockdown mode, system control-plane-lockdown enable, is not saved to the running config. Hence, Controller lockdown mode is disabled after Controller power down/up. When failover happens with a redundant Controller configured, the new active Controller will be in Controller lockdown mode but may not have all policy information.
In Controller lockdown mode, copying the running config to a snapshot will not include the system control-plane-lockdown enable command.
The CLI prompt will start with the prefix LOCKDOWN when this feature is enabled.
Link up/down and other events during Controller lockdown mode are processed after Controller lockdown mode is disabled.
All the events handled by the switch are processed in Controller lockdown mode. For example, traffic is hashed to other members automatically in Controller lockdown mode if one LAG member fails. Likewise, all switch-handled events related to inline are processed in Controller lockdown mode.
Use the below commands to enable Controller lockdown mode. Only an admin user can enable or disable this feature.
Controller# configure
Controller(config)# system control-plane-lockdown enable
Enabling control-plane-lockdown may cause service interruption. Do you want to continue ("y" or "yes
" to continue):yes
LOCKDOWN Controller(config)#
To disable Controller lockdown mode, use the command below:
LOCKDOWN Controller(config)# system control-plane-lockdown disable
Disabling control-plane-lockdown will bring the fabric to normal operation. This may cause some
service interruption during the transition. Do you want to continue ("y" or "yes" to continue):
yes
Controller(config)#
CPU Queue Stats and Debug Counters
Switch Light OS (SWL) switches can now report their CPU queue statistics and debug counters. To view these statistics, use the DANZ Monitoring Fabric (DMF) Controller CLI. DMF exports the statistics to any connected DMF Analytics Node.
The CPU queue statistics provide visibility into the different queues that the switch uses to prioritize packets needing to be processed by the CPU. Higher-priority traffic is assigned to higher-priority queues.
The SWL debug counters, while not strictly limited to packet processing, include information related to the Packet-In Multiplexing Unit (PIMU). The PIMU performs software-based rate limiting and acts as a second layer of protection for the CPU, allowing the switch to prioritize specific traffic.
Note: The feature runs on all SWL switches supported by DMF.
Configuration
These statistics are collected automatically and do not require any additional configuration to enable.
To export statistics, configure a DMF Analytics Node. Please refer to the DMF User Guide for help configuring an Analytics Node.
Show Commands
Showing the CPU Queue Statistics
The following command shows the statistics for the CPU queues on a single switch.
controller-1> show switch FILTER-SWITCH-1 queue cpu
# Switch            OF Port Queue ID Type      Tx Packets Tx Bytes  Tx Drops Usage
-|-----------------|-------|--------|---------|----------|---------|--------|---------------------------------|
1 FILTER-SWITCH-1   local   0        multicast 830886     164100990 0        lldp, l3-delivery-arp, tunnel-arp
2 FILTER-SWITCH-1   local   1        multicast 0          0         0        l3-filter-arp, analytics
3 FILTER-SWITCH-1   local   2        multicast 0          0         0
4 FILTER-SWITCH-1   local   3        multicast 0          0         0
5 FILTER-SWITCH-1   local   4        multicast 0          0         0        sflow
6 FILTER-SWITCH-1   local   5        multicast 0          0         0
7 FILTER-SWITCH-1   local   6        multicast 0          0         0        l3-filter-icmp
There are a few things to note about this output:
The CPU's logical port is also known as the local port.
The counter values shown are based on the last time the statistics were cleared.
Different CPU queues may be used for various types of traffic. The Usage column displays the traffic that an individual queue is handling. Not every CPU queue is used.
The details token can be added to view more information. This includes the absolute (or raw) counter values, the last updated time, and the last cleared time.
Showing the Debug Counters
The following command shows all of the debug counters for a single switch:
controller-1> show switch FILTER-SWITCH-1 debug-counters
#  Switch            Name                            Value   Description
--|-----------------|-------------------------------|-------|-------------------------------------------|
1  FILTER-SWITCH-1   arpra.total_in_packets          1183182 Packet-ins recv'd by arpra
2  FILTER-SWITCH-1   debug_counter.register          79      Number of calls to debug_counter_register
3  FILTER-SWITCH-1   debug_counter.unregister        21      Number of calls to debug_counter_unregister
4  FILTER-SWITCH-1   pdua.total_pkt_in_cnt           1183182 Packet-ins recv'd by pdua
5  FILTER-SWITCH-1   pimu.hi.drop                    8       Packets dropped
6  FILTER-SWITCH-1   pimu.hi.forward                 1183182 Packets forwarded
7  FILTER-SWITCH-1   pimu.hi.invoke                  1183190 Rate limiter invoked
8  FILTER-SWITCH-1   sflowa.counter_request          9325983 Counter requests polled by sflowa
9  FILTER-SWITCH-1   sflowa.packet_out               7883772 Sflow datagrams sent by sflowa
10 FILTER-SWITCH-1   sflowa.port_features_update     22      Port features updated by sflowa
11 FILTER-SWITCH-1   sflowa.port_status_notification 428     Port status notif's recv'd by sflowa
The counter values shown are based on the last time the statistics were cleared.
Add the name or the ID token and a debug counter name or ID to filter the output.
Add the details token to view more information. This includes the debug counter ID, the absolute (or raw) counter values, the last updated time, and the last cleared time.
Clear Commands
Clearing the Debug Counters
The following command will clear all of the debug counters for a single switch:
controller-1# clear statistics debug-counters
Clearing all Statistics
To clear both the CPU queue stats and the debug counters for every switch, use the following command:
controller-1# clear statistics
Note: This command is not only limited to switches. It will clear any clearable statistics for every device.
Analytics Export
The following statistics are automatically exported to a connected Analytics Node:
CPU queue statistics for every switch.
Note: This does not include the statistics for queues associated with physical switch interfaces.
The PIMU-related debug counters. These are debug counters whose name begins with pimu. No other debug counters are exported.
DMF exports these statistics once every minute.
Note: The exported CPU queue statistics will include port number -2, which refers to the switch CPU's logical port.
Troubleshooting
Use the details with the new show commands to provide more information about the statistics. This information includes timestamps showing statistics collection time and the last time the statistics were cleared.
Use the redis-cli command to query the Redis server on the Analytics Node from the Bash shell on the DMF Controller to view the statistics successfully exported to the Analytics Node.
The following command queries for the last ten exported debug counters:
Only the CPU queue stats are exported to the Analytics Node. Physical interface queue stats are not exported.
Only the PIMU-related debug counters are exported to the Analytics Node. No other debug counters are exported.
Only SWL switches are currently supported. EOS switches are not supported.
Egress Filtering
Egress Filtering is an option to send different traffic to each tool attached to the policy's delivery setting. It provides additional filtering at the delivery ports based on the egress filtering rules specified at the interface.
DANZ Monitoring Fabric (DMF) supports egress filtering on the delivery and recorder node interfaces and supports configuring IPv4 and IPv6 rules on the same interface. Only packets with an IPv4 header are subject to the rules associated with the IPv4 token, while packets with an IPv6 header are only subject to the rules associated with the IPv6 token. If any egress filtering rules are configured on the interface, a default drop rule is applied if no traffic matches the configured rules.
Egress Filtering applies to all switches running SWL OS and EOS DCS-7280R/R2/R3 switches.
Configuring Egress Filtering using the CLI
CLI Configuration
The egress filtering feature is configurable at the interface level. To enable it, run the egress-filtering command from the config-switch-if submode.
In the config-switch-if-egress-filtering submode, enter the rule's sequence number. The number represents the sequence in which the rules are applied. The lowest sequence number will have the highest priority.
Tip: Leave gaps between the sequence numbers so that new rules can be added in the middle later, if necessary.
dmf-controller(config-switch-if-egress-filtering)# 1
allow     Forward traffic matching this rule
drop      Drop traffic matching this rule
After the sequence number, specify the action of the rule. It can be either drop orallow.
dmf-controller(config-switch-if-egress-filtering)# 1 allow
any ipv4 ipv6
After specifying the action, enter the rule target traffic type: IPv4, IPv6, or any.
dmf-controller(config-switch-if-egress-filtering)# 1 allow
any   ipv4  ipv6
Any Traffic
The following illustrates a rule to allow all traffic on the interface, in this case, ethernet18.
dmf-controller(config-switch-if-egress-filtering)# 1 allow any
And a rule to drop all traffic on the interface, in this case, ethernet18.
dmf-controller(config-switch-if-egress-filtering)# 1 drop any
IPv4 Traffic
To allow or drop all IPv4 traffic on an interface, use the following commands:
Drop
dmf-controller(config-switch-if-egress-filtering)# 1 drop ipv4
dmf-controller(config-switch-if-egress-filtering-ipv4)#
The following other options are available in the submode config-switch-if-egress-filtering-ipv4. DMF supports the following qualifiers for IPv4 traffic filtering along with the IP address, port, and VLAN ranges.
Configuring an unsupported qualifier on a switch interface results in the following error message:
dmf-controller(config)# show fabric warnings egress-filtering-warning
~~~~~~~~~~~~~~~~~~~~~~~~~ Egress filtering warnings ~~~~~~~~~~~~~~~~~~~~~~~~~
# Switch         IF Name      Warning message
-|--------------|------------|------------------------------------------------------------------------------------------|
1 DCS-7050SX3    ethernet18   Rule 1 matching on the following field(s) is not supported on the switch: ECN; IP fragment
Show Commands
The following show command displays the Egress Filtering enabled device name, the information about the specified rule under the Entry key column, and the rule's action under the Entry value column. DMF uses the table to communicate the egress filtering rules with the device. The data in this table is primarily intended for debugging and communication purposes.
dmf-controller# show switch all table egress-flow-1
# Egress-flow-1 Device name        Entry key                                                       Entry value
-|-------------|------------------|---------------------------------------------------------------|----------------------------------------------|
1 0             DCS-7050SX3-48YC8  Priority(1000), Port(13), EthType(2048), Ipv4Src(12.123.123.12) Name(__Rule1__), Data([0, 0, 0, 0]), NoDrop()
2 1             DCS-7050SX3-48YC8  Priority(0), Port(13)                                           Name(__Rule0__), Data([0, 0, 0, 0]), Drop()
If any egress filtering warnings are present, they can be seen by running the show fabric warnings egress-filtering-warnings command. The output lists the switch name and the interface name on which an egress filtering warning is present, with a detailed message.
Validation Messages
The following are examples of validation failure messages and their potential causes.
A validation exception occurs when configuring an egress filtering rule without specifying EtherType.
Validation failed: EtherType is mandatory for egress filtering rule
Similarly, there is another configuration validation for action, which is mandatory for egress filtering rules. Each rule can have a maximum of two ranges, and when exceeded, a validation failure occurs.
Validation failed: A rule cannot contain more than 2 configured ranges
DMF does not support configuring individual port values and port ranges of the same qualifier in the same rule, and configuring a source port and its range results in a validation failure.
Validation failed: Source port and its ranges are not supported together
A validation failure occurs if any specified ranges have a higher minimum value than the maximum value. For example, the specified inner VLAN minimum exceeds the maximum value. Similarly, validation failures may occur for ranges.
Validation failed: Inner VLAN min cannot be greater than inner VLAN max
The ip-proto setting is mandatory when specifying any port number, source, or destination. Specifying the source or destination port without ip-proto causes a validation failure.
Validation failed: IP protocol number is mandatory for source port
Validation failed: IP protocol number is mandatory for destination port
A validation failure occurs if any unsupported IP protocol number is a source or destination port specified without ip-proto. DMF only supports TCP(6), UDP(17), and SCTP(132) protocol numbers for port qualifiers.
Validation failed: IP protocol number protocol number is unsupported for source port
Validation failed: IP protocol number protocol number is unsupported for destination port
Configuring Egress Filtering using the GUI
Perform the following steps to configure Egress Filtering.
Navigate to Monitoring > Interfaces.
Figure 75. DMF Interfaces
Under the Configuration tab select either Delivery or Filter & Delivery.
Note: DMF supports configuring egress filtering rules for Delivery, Filter & Delivery, and Recorder Node interfaces.
Figure 76. Delivery Interfaces
Optional - If required, create a Delivery or Filter & Delivery interface using Create DMF Interface.
Figure 77. Create DMF Interface
Under the DMF Interface Name, select the Delivery or Filter & Delivery interface to configure additional interface attributes.
Figure 78. DMF Interface Details
Under Configuration, select + Add Rule in the Egress Filtering Rules section.
Figure 79. Add New Rule
Setting EtherType to either IPv4 or IPv6 displays additional configuration options.
Traffic: Basic traffic configurations.
Sequence - Enter a numerical value. The lowest sequence number will have the highest priority.
Action (drop-down) - Allow or Drop
Ethertype (drop-down) - IPv4, IPv6, or Any
Source: Single IP or IP Range.
IP Address
IP Mask
Destination: Single IP or IP Range.
IP Address
IP Mask
VLANs: VLAN (drop-down) - Any, Single, or Range.
Figure 80. EtherType Settings
Enter all required inputs, and any optional fields that are applicable. Select Submit to save the Egress Filtering Rule.
Repeat the process using + Add Rule to add more rules as needed.
Figure 81. Edit Interface
To edit a rule, click the pencil (edit) icon. To delete a rule, select the trash (delete) icon.
Similarly, to configure Egress filtering rules for Recorder Node Interfaces, navigate to Monitoring > Recorder Nodes. Under the Inventory section, select RN Interfaces and the RN interface name to configure the egress filtering rules.
Figure 82. Inventory
Syslog Messages
There are no Syslog messages relevant to the Egress Filtering feature.
Troubleshooting
When a tool connected to a delivery interface configured with egress filtering rules receives an unexpected packet or does not receive the expected packet, use the following steps to troubleshoot the issue.
Review the show running-config command output to see if the egress filtering rules are configured correctly under that particular interface.
Verify the show switch switch-name table
egress-flow-1 command output. It will display the port number of the interface for the configured egress filtering rules, its qualifiers as Entry key, the Entry value action of Drop or NoDrop, and a default drop rule for that port number with priority 0.
dmf-controller# show sw all table egress-flow-1
# Egress-flow-1 Device name        Entry key                                                       Entry value
-|-------------|-----------------|---------------------------------------------------------------|---------------------------------------------|
1 0             DCS-7050SX3-48YC8 Priority(1000), Port(13), EthType(2048), Ipv4Src(12.123.123.12) Name(__Rule1__), Data([0, 0, 0, 0]), NoDrop()
2 1             DCS-7050SX3-48YC8 Priority(0), Port(13)                                           Name(__Rule0__), Data([0, 0, 0, 0]), Drop()
Use the following command to verify the same information from a switch (e.g., DCS-7050SX3-48YC8).
Use the show fabric warnings egress-filtering-warning command to view any egress filtering warnings.
dmf-controller(config)# show fabric warnings egress-filtering-warning
~~~~~~~~~~~~~~~~~~~~~~~~~ Egress filtering warnings ~~~~~~~~~~~~~~~~~~~~~~~~~
# Switch               IF Name     Warning message
-|-----------------|-----------|-----------------------------------------------------|
1 DCS-7050SX3-48YC8 ethernet18  Supported only on delivery or recorder node interfaces
2 DCS-7280SR-48C6   Ethernet8   Egress filtering feature is not supported on EOS switches
The show fabric warnings feature-unsupported-on-device command provides information on any egress filtering rules configured on any unsupported devices:
dmf-controller(config)# show fabric warnings feature-unsupported-on-device
# Name    Warning
-|-------|------------------------------------------------------------|
1 test1   Egress filtering is not supported on the switch test1
Limitations
Egress filtering supports only 500 rules per interface. A validation failure occurs when exceeding this limit.
Validation failed: Only 500 egress filtering rules are supported per interface
DMF does not support egress filtering on MLAG delivery interfaces.
EOS DCS-7280R/R2/R3 switches do not support VLAN qualifiers and their ranges.
SWL OS switches do not support the following qualifiers: icmp-code, icmp-type, ecn-value, dscp-value, and ip-fragment.
For EOS 7280R3, dst-port only works on VLAN-tagged packets when there is an exact match.
None of the IPv6 qualifiers work for EOS 7280R and 7280R2 switches.
SWL OS switches do not support the following qualifiers under IPv6 submode: src-ip, dst-ip, src-ip-range, and dst-ip-range.
The DANZ Monitoring Fabric (DMF) allows the integration and monitoring of VMs in a VMware vCenter cluster. After integrating a vCenter with the DMF fabric, use DMF policies to select different types of traffic from specific VMs and apply managed services, such as deduplication or header slicing, to the selected traffic.
Currently, DMF supports the following versions of VMware vCenter for monitoring:
vCenter Server 7.0.0
vCenter Server 8.0.0
The DANZ Monitoring Fabric provides two options to monitor a VMware vCenter cluster:
Monitoring using span ports: This method monitors VMware vCenter clustering using a separate monitoring network. The advantage of this configuration is that it has no impact on the production network and has a minimal effect on compute node CPU performance. However, in this configuration, each compute node must have a spare NIC to monitor traffic.
The following figure illustrates the topology used for local SPAN configuration:
Figure 1. Mirroring on a Separate SPAN Physical NIC (SPAN)
Monitoring using ERPAN/L2GRE tunnels: Use Remote SPAN (ERSPAN) to monitor VMs running on the ESX hosts within a vCenter instance integrated with DMF. ERSPAN monitors traffic to and from VMs anywhere in the network and does not require a dedicated physical interface card on the ESX host. However, ERSPAN can affect network performance, especially when monitoring VMs connected to the DMF Controller over WAN links or production networks with high utilization.
Using SPAN to Monitor VMs
This section describes the configuration required to integrate the DANZ Monitoring Fabric (DMF) Controller with one or more vCenter instances and to monitor traffic from VMs connected to the VMware vCenter after integration.
The following figure illustrates the topology required to integrate a vCenter instance with the monitoring fabric and deliver the traffic selected by DMF policies to specified delivery ports connected to different monitoring tools.
Figure 2. VMware vCenter Integration and VM Monitoring
When integrated with vCenter, the DMF Controller uses Link Layer Discovery Protocol (LLDP) to automatically identify the available filter interfaces connected to the vCenter instance.
Using ERSPAN to Monitor VMs
Use Remote SPAN (ERSPAN) to monitor VMs running on the ESX hosts within a VMware vCenter instance integrated with the DANZ Monitoring Fabric (DMF). ERSPAN monitors traffic to and from VMs anywhere in the network and does not require a dedicated physical interface card on the ESX host. However, ERSPAN can affect network performance, especially when monitoring VMs connected to the DMF Controller over WAN links or production networks with high utilization.
Figure 3. Using ERSPAN to Monitor VMs
The procedure for deploying ERSPAN is similar to SPAN but requires an additional step to define the tunnel endpoints used on the DMF network to terminate the ERSPAN session.
Configuration Summary for vCenter Integration
The following procedure summarizes the high-level steps required to integrate the vCenter and monitor traffic to or from selected VMs:
(For ERSPAN only) Define the tunnel endpoint.
Identify a fabric interface connected to the vCenter instance for the tunnel endpoint by entering the tunnel-endpoint command in config mode. To define the tunnel endpoint, refer to the Defining a Tunnel Endpoint section.
Provide the vCenter address and credentials.
The vSphere extension on the DANZ Monitoring Fabric (DMF) Controller discovers an inventory of VMs and the associated details for each VM.
Select the VMs to monitor on the DMF Controller.
The DMF Controller uses APIs to invoke the vSphere vCenter instance.
vSphere calls the DVS to create a SPAN session. The preferred option is to SPAN on a separate physical NIC. However, the option exists to also use ERSPAN by tunneling to the remote interface.
Create policies in DMF to filter, replicate, process, and redirect traffic to tools.
When using tunnels with ERSPAN, DMF terminates the tunnels using the specified tunnel endpoint. A DMF policy for monitoring VM traffic using a SPAN session must include the required information regarding the vCenter configuration. All match conditions, including User-Defined ofFsets (UDFs), are supported.
The policy for selecting VM traffic to monitor is similar to other DMF policies, except that the filtering interfaces are orchestrated automatically (filter interfaces are auto-discovered and cannot be specified manually). All managed-service actions are supported.
Defining a Tunnel Endpoint
Predefine the tunnel endpoints for creating tunnels when monitoring VMware vCenter traffic using either the GUI or the CLI.
GUI Procedure
To manage tunnel endpoints in the GUI, select Monitoring > Tunnel Endpoints.
Figure 4. Monitoring > Tunnel Endpoints
This page lists the tunnel endpoints that are already configured and provides information about each endpoint.
To create a new tunnel endpoint, select the provision (+) control in the Tunnel Endpoints table.
Figure 5. Create Tunnel Endpoint
To create the tunnel endpoint, enter the following information and select Save:
Name: Type a descriptive name for the endpoint.
Switch: Select the DMF switch from the selection list for the configured endpoint interface.
Interface: Select the interface from the selection list for the endpoint.
Gateway: Type the address of the default gateway.
IP Address: Type the endpoint IP address.
Mask: Type the subnet mask for the endpoint.
Integrate a vCenter Instance
To integrate a vCenter instance with DANZ Monitoring Fabric (DMF) to begin monitoring VMs, select Integration > vCenter from the DMF menu bar.
Figure 6. Integration > vCenter
This page displays information about the vCenter instances integrated with DMF. To add a vCenter instance for integration with DMF, perform the following steps:
Select the provision control (+) in the table.
Figure 7. Create vCenter: Info
Type an alphanumeric identifier for the vCenter instance, and (optionally) add a description in the fields provided.
Identify the vCenter hostname to be integrated.
Enter the vCenter username and password for authenticating to the vCenter instance.
These credentials are used by the DMF Controller when communicating with the vCenter host.
Select Next.
Figure 8. Create vCenter: Options (page 2)
This page defines the mirror type as SPAN or ERSPAN. When selecting ERSPAN, the following additional fields complete the ERSPAN configuration:
Cluster Tunnel Endpoints (optional)
Default Tunnel Endpoint (required)
Sampling Rate (optional)
Mirrored Packet Length (optional)
Create Wildcard Tunnels(optional)
Use Cluster Tunnel Endpoints to specify a common tunnel endpoint for all the ESXi hosts in the cluster. Use Default Tunnel Endpoint to specify a common tunnel endpoint for all the ESXi hosts regardless of the cluster. When configuring both cluster and default tunnel endpoints, all hosts in clusters form tunnels using the cluster-specific configuration, and all the other hosts that are not a part of any cluster use the default configuration to form tunnels.
Select Next.
Figure 9. Create vCenter/VMs
To add a VM for monitoring, select the provision control (+).
Figure 10. Configure vCenter VM
Select VMs from the selection list after integrating vCenter and discovering the VMs, or manually add the VM hostname.
After identifying the VM to monitor, select Append.
On the VMs of the Create vCenter dialog, select Save.
Using a vCenter Instance as the Traffic Source in a DMF Policy
To identify a vCenter instance integrated with the DANZ Monitoring Fabric (DMF) Controller as the traffic source for a DMF policy, select the VMware vCenter tab on the Integration page. Locate the vCenter instance name.
Figure 11. VMware vCenter Name
Proceed to the Monitoring > Policies page.
Figure 12. DMF Policies
Select + Create Policy to add a policy.
Figure 13. Create Policy
Enter a Name and Description for the vCenter policy. From the Traffic Sources column, select + Add Ports(s).
Figure 14. Traffic Sources - Add Ports
Select vCenters.
Figure 15. vCenters
Available vCenter instances display. Select the required vCenter instance which then appears in the Selected traffic Sources panel.
Figure 16. vCenter Instance
Select Add 1 Source. The vCenter instance appears in the Traffic Sources column.
Figure 17. vCenter Traffic Sources
From the Destination Tools column, select + Add Ports(s). Select the interface under Destination Tools.
Figure 18. Destination Tools - Add Ports
Select Add 1 Interface. The interface appears under the Destination Tools column.
Figure 19. Add Interface
Select Create Policy. The new vCenter policy appears in the DMF Policies dashboard.
Figure 20. Create vCenter Policy
View vCenter Configuration
After integrating a vCenter instance, select the link in the Name column in the vCenter table to view vCenter activity.
Figure 21. VMware vCenter Instance Name
DANZ Monitoring Fabric (DMF) displays the vCenter Info page.
Figure 22. VMware vCenter Configuration
The Info page displays information about the configuration of the vCenter instance. To view information about vCenter resources, scroll down to the following sections:
Hosts
Virtual Switches
Physical Connections
Virtual Machines
Network Host Connection Details
Figure 23. Hosts, Virtual Switches, and Physical Connections
Figure 24. Virtual Machines and Network Host Connection Details
Integrating vCenter with DMF using Mirror Stack
DANZ Monitoring Fabric (DMF) vCenter integration supports mirroring from vCenter hosts using the default TCP/IP stack. However, this can result in traffic drops and affect production traffic since mirror traffic can conflict with production traffic. DMF vCenter integration with Mirror Stack provides the functionality to use the mirror TCP/IP stack for mirror sessions. Mirror stack in the ESXi host allows decoupling the traffic and keeps the production traffic unaffected.
vCenter configurations in DMF will use a mirror stack by default; however, if upgrading from previous DMF versions, the already configured vCenter will be set to use the default TCP/IP stack.
Platform Compatibility
vCenter integration with Mirror Stack requires an extra NIC on the ESXi host with following versions:
vCenter Server 7.0.x
vCenter Server 8.0.x
vCenter Configuration
DMF vCenter integration with Mirror Stack requires a mirror stack configuration on the ESXi host and vCenter.
Perform the following steps to configure the mirror stack on vCenter.
Repeat the steps for each ESXi host containing VMs to be monitored.
Enable the mirror stack in the ESXi host if not already enabled.
Use the esxcli network ip netstack list command to review the current network stacks.
[root@ESX33:~] esxcli network ip netstack list
defaultTcpipStack
   Key: defaultTcpipStack
   Name: defaultTcpipStack
   State: 4660

mirror
   Key: mirror
   Name: mirror
   State: 4660
To view the TCP/IP configuration from vCenter UI, navigate to Host > Configure > TCP/IP.
Figure 25. TCP/IP Configuration
If the mirror stack is not configured, use the esxcli
network ip netstack set -N mirror command to enable it.
Note: The mirror setting is required to enable the Mirror TCP/IP stack and DMF integration.
From vCenter create a VMkernel adapter with the mirror stack.
Figure 26. VMkernel Network Adapter
Select the appropriate network using the Browse option.
Figure 27. Browse
Select Next and select Port properties and choose mirror.
Figure 28. Port Properties - Mirror
Figure 29. Mirror Stack Added
Add the IPv4 address and the Default gateway address according to your local network requirements.
Figure 30. IP Address and Gateway Address
Select Next.
Figure 31. VMkernel Adapters
Based on the networking requirements, configure the default gateway of the mirror stack in the host's TCP/IP configuration or a static route entry in the ESXi host to the DMF tunnel endpoint. The following example illustrates adding a static route entry to the DMF tunnel endpoint.
To configure TCP/IP Stack, navigate to Integration > VMware vCenter. While adding or editing a vCenter configuration, select the appropriate choice using TCP/IP Stack. Default Stack and Mirror Stack are the options.
Figure 34. Create vCenter TCP/IP Stack
Attention: Encapsulated Remote mirroring with Default Stack is not recommended. Use Mirror Stack for optimal performance.
Refer to the CLI show commands to view the tcp-ip-stack configuration. In addition, use the show
fabric errors and show fabric warnings commands to troubleshoot and verify that everything is functioning as expected.
Limitations
A port mirroring session remains on the original distributed virtual switch (DVS) when a VM migrates between DVSs.
Port mirroring sessions will persist on the DVS if a VM is renamed in vCenter while being monitored by DMF.
DMF cannot create a port mirroring session in the DVS if a conflicting session with the same VM exists in the DVS. This is not a limitation in vCenter 7.
When using mirror stack configuration in DMF, mirror sessions may still be created on the DVS for the ESXi host that doesn’t have a mirror stack configuration. This will result in no traffic being mirrored from the VM.
Auto-generated filter interfaces by vCenter integration should not be deleted from the policy. If they are deleted manually from the policy, they will not be automatically re-added.
Create Wildcard Tunnels for VMware vCenter Monitoring
The current implementation of VMware vCenter creates one tunnel interface from every ESXi host to DMF.
Using a wildcard tunnel on DMF for VMware vCenter reduces the number of tunnels created.
Platform Compatibility
This feature is only compatible with switches that support wildcard tunneling.
Use the DANZ Monitoring Fabric (DMF) GUI to create wildcard tunnels as outlined below.
Navigate to the Integration > VMware vCenter page.
Figure 35. VMware vCenter Add/Edit
Select the Menu icon.
As part of the Options step of the Add/Edit vCenter workflow, enable wildcard tunnels using the Create Wildcard Tunnels toggle input. By default, the feature is disabled.
Figure 36. VMware vCenter Create vCenter Options
Limitations
Select Broadcom® switch ASICs support wildcard tunnels; ensure your switch model supports this feature before configuring it for vCenter.
Please refer to the Platform Compatibility section for more information.
Minimum Permissions for Non-admin Users
For a non-admin user to add, remove, edit, or monitor a vCenter via the DANZ Monitoring Fabric (DMF), the privilege level assigned to the non-admin user is VSPAN operation. To assign VSPAN operation privileges to a user, perform the following steps:
From the vCenter GUI, navigate to Menu > Administration.
Once on the page, select the Users and Groups link in the navigation bar on the left.
Figure 37. Users and Groups
Select the Users tab and ensure the appropriate domain is selected (in this case, the domain is vsphere.local).
Figure 38. Domain Selection
Next, select the ADD USER link and create the desired user. (In the example below, a user called dmf-aliceis created.)
Figure 39. Add a New User
Verify that the newly created user is on the Users and Groups page.
Figure 40. Verify User Created
After creating the desired user, create and assign a role to this user. Select Roles under Access Control in the navigation bar on the left. Next, select the + sign to add a new role.
Figure 41. Add a New Role
In the New Role pop-up dialog, select Distributed Switch from the left and then scroll down to find and select VSPAN operation as the role. Select Next and give the new role a new name. (In the example below the new role monitor-dmf is created.) Select Finish to create the new role.
Figure 42. Select Role Type
Figure 43. Save New Role
Verify the creation of the new role on the Roles page.
Figure 44. Verify New Role Created
To assign the new role to the new user, select the Global Permissions link in the navigation bar on the left. Next, select the + sign to assign the new role.
Figure 45. Global Permissions
In the Add Permission dialog, type the newly created username and select the newly created role, as shown in the figure below.
Note:Do not forget to check mark the Propagate to children checkbox.
Figure 46. Assign Role to User
Verify assigning the newly created role to the newly created user.
Figure 47. Verify Role Assignment to User
Monitor vCenter Traffic by VM Names
Match VMware vCenter-specific information in the policy. Specifically, this feature matches traffic using VMware vCenter Virtual Machine (VM) names and requires DANZ Monitoring Fabric (DMF) vCenter integration.
Configure vCenter VM name matches under the DANZ Monitoring Fabric (DMF) policies match rules section. For example:
In the DMF GUI, navigate to the Monitoring > Policies page.
Figure 48. DMF Policies
Select Create Policy to create a new policy or edit an existing one by selecting a row from the Policies Table and selecting Edit.
Figure 49. Create / Edit Policy
Navigate to the Match Traffic tab.
Figure 50. Match Traffic
Select Configure a Rule to configure a custom match rule.
Figure 51. Configure a Rule
Set the EtherType to IPv4 or IPv6.
Add the Source IP Address as the vCenter VM name. Select the Virtual Machine option from the Source IP Address drop-down and select a virtual machine from the VM Name drop-down.
Figure 52. Source IP Address VM Name
Add the Destination IP address as the vCenter VM name. Select the Virtual Machine option from the Destination IP Address drop-down and select a virtual machine from the VM Name drop-down.
Figure 53. Destination IP VM
Note: If the VM Name drop-down shows No Data, ensure only one vCenter is affiliated with the policy (under Traffic Sources).
Select Add Rule to add the match rule to the policy.
After entering other inputs as required, select Create Policy (or Save Policy) to save the configuration.
Limitations
This feature only works with vCenter integration and a direct Switch Port Analyzer (SPAN) from a switch with ESXi traffic.
VM interface IP addresses connected to dvs will only be added to policy matches.
The system may use extra TCAM entries if the management network uses dvs.
Vmkernal names cannot be matched in the policy.
When a VM name with multiple vNICs (multiple IP addresses) matches the policy, a TCAM entry is added for all the IP addresses.
VM Names cannot be matched with the MAC option in the policy.
If the vCenter becomes disconnected, policies associated with the VM names may not get correct matches or traffic.
The IP address assigned to this endpoint is 172.27.1.1, and the next hop address for connecting to the vCenter via OSEP1 (using ERSPAN) is 172.27.1.2.
Integrate a vCenter Instance
Refer to the following topics to monitor VMs using Encapsulated Remote SPAN (ERSPAN) or Switch Port Analyzer (SPAN) on a locally connected vCenter instance and VMs on a second locally connected vCenter instance.
VMs using ERSPAN on a Locally Connected vCenter Instance
To configure the DANZ Monitoring Fabric Controller for monitoring VMs using ERSPAN on a locally connected vCenter instance, perform the following steps:
Add the vCenter instance details by entering the following commands.
The sampling-rate and mirrored-packet-length commands are optional.
ERSPAN mirroring requires a tunnel endpoint configuration. Use the cluster command to specify a common tunnel endpoint for all the ESXi hosts in the cluster. Use the default-tunnel-endpoint command to specify a common tunnel endpoint for all the ESXi hosts regardless of the cluster. When using both the cluster and default-tunnel-endpoint commands, all hosts in clusters form tunnels using the cluster-specific configuration, and all the other hosts not a part of any cluster use the default configuration to form tunnels.
Add the VMs to monitor by entering the following commands.
controller-1(config-vcenter)# vm-monitoring
controller-1(config-vcenter-vm-monitoring)# vm vm-2001
controller-1(config-vcenter-vm-monitoring)# vm vm-2002
Receive-only GRE tunnel-interfaces are auto-configured under switch for all the hosts belonging to vc-1 that have a route to the default or cluster tunnel-endpoint.
Enter the show running-config vcenter command to view the vCenter configuration.
controller-1# show running-config vcenter
! vcenter
vcenter vc-1
hashed-password 752a3a3211040e0200090409090611
host-name 10.8.23.70
mirror-type erspan
mirrored-packet-length 60
sampling-rate 60
user-name This email address is being protected from spambots. You need JavaScript enabled to view it.
!
vm-monitoring
vm vm-2001
vm vm-2002
Configure the policies specifying the match rules and delivery interfaces.
controller-1(config)# policy dmf-policy-with-vcenter
controller-1(config-policy)# action forward
controller-1(config-policy)# filter-vcenter vc-1
controller-1(config-policy)# 1 match any
controller-1(config-policy)# delivery-interface TOOL-PORT-03
Enter the show running-config policy command to view the automatically assigned filter interfaces.
controller-1# show running-config policy dmf-policy-with-vcenter
! policy
policy dmf-policy-with-vcenter
action forward
delivery-interface TOOL-PORT-03
filter-interface DMF-RU34-filter-vcenter-abd08a18 vc-1--interface
filter-interface DMF-RU34-filter-vcenter-abd08a37 vc-1--interface
filter-interface DMF-RU34-filter-vcenter-abd08a56 vc-1--interface
filter-vcenter vc-1
1 match any
All the host tunnels belonging to vc-1 will become the filter interfaces. If new hosts are added, deleted, or modified, policies will be recomputed with the new interfaces.
VMs using SPAN on a Locally Connected vCenter Instance
To configure the DANZ Monitoring Fabric Controller for monitoring VMs using SPAN on a locally connected vCenter instance, perform the following steps:
Add the vCenter instance details by entering the following commands.
The sampling-rate and mirrored-packet-length commands are optional.
Add the VMs to monitor by entering the following commands.
controller-1(config-vcenter)# vm-monitoring
controller-1(config-vcenter-vm-monitoring)# vm vm-2001
controller-1(config-vcenter-vm-monitoring)# vm vm-2002
To view the vCenter configuration, enter the show running-config vcenter command as in the following example.
controller-1# show running-config vcenter
! vcenter
vcenter vc-1
hashed-password 752a3a3211040e0200090409090611
host-name 10.8.23.70
mirror-type span
mirrored-packet-length 60
sampling-rate 60
user-name This email address is being protected from spambots. You need JavaScript enabled to view it.
!
vm-monitoring
vm vm-2001
vm vm-2002
Configure the policies specifying the match rules and delivery interfaces.
controller-1(config)# policy dmf-policy-with-vcenter
controller-1(config-policy)# action forward
controller-1(config-policy)# filter-vcenter vc-1
controller-1(config-policy)# 1 match any
controller-1(config-policy)# delivery-interface TOOL-PORT-03
To view the automatically assigned filter interfaces, enter the show running-config policy command.
controller-1# show running-config policy dmf-policy-with-vcenter
! policy
policy dmf-policy-with-vcenter
action forward
delivery-interface TOOL-PORT-03
filter-interface vc-filter-1 origination vc-10-9-19-7--filter-interface
filter-interface vc-filter-3 origination vc-10-9-19-7--filter-interface
filter-vcenter vc-1
1 match any
Note: LLDP automatically learns the filter interfaces. All the hosts belonging to vc-1 that have physical connections to DMF switches become the filter interfaces. If new connections are made later (or existing connections are changed), policies will be recomputed with the new interfaces.
VMs on a Second Locally Connected vCenter Instance
To configure the DMF Controller for monitoring VMs on a second locally connected vCenter instance, perform the following steps:
Add the VMs to monitor and configure the DMF policies to specify the match rules and delivery interfaces.
Configure the policy for the second vCenter instance.
(config)# policy dmf-policy-with-vcenter-2
(config-policy)# filter-vcenter vc-2
(config-policy)# 1 match any
(config-policy)# delivery-interface TOOL-PORT-02
View vCenter Configuration
To view the vCenter configuration in the CLI, use the show vcenter command, as in the following examples:
controller-1# show vcenter
# vCenter Name vCenter Host Name or IP Last vCenter Update Time Detail State vSphere Version
--|------------|-----------------------|------------------------------|----------------------------|---------------|
1 vc-10-9-0-75 10.9.0.75 2017-09-09 18:02:35.980000 PDT Connected and authenticated. 6.5.0
2 vc-10-9-0-76 10.9.0.76 2017-09-09 18:02:36.488000 PDT Connected and authenticated. 6.5.0
3 vc-10-9-0-77 10.9.0.77 2017-09-09 18:02:35.908000 PDT Connected and authenticated. 6.0.0
4 vc-10-9-0-78 10.9.0.78 2017-09-09 18:02:33.507000 PDT Connected and authenticated. 6.5.0
5 vc-10-9-0-79 10.9.0.79 2017-09-09 18:02:32.248000 PDT Connected and authenticated. 6.5.0
6 vc-10-9-0-80 10.9.0.80 2017-09-09 18:02:32.625000 PDT Connected and authenticated. 6.0.0
7 vc-10-9-0-81 10.9.0.81 2017-09-09 18:02:34.672000 PDT Connected and authenticated. 6.0.0
8 vc-10-9-0-82 10.9.0.82 2017-09-09 18:02:33.008000 PDT Connected and authenticated. 6.0.0
9 vc-10-9-0-83 10.9.0.83 2017-09-09 18:02:30.011000 PDT Connected and authenticated. 6.0.0
10 vc-10-9-0-84 10.9.0.84 2017-09-09 18:02:33.024000 PDT Connected and authenticated. 6.5.0
11 vc-10-9-0-85 10.9.0.85 2017-09-09 18:02:34.827000 PDT Connected and authenticated. 6.0.0
12 vc-10-9-0-86 10.9.0.86 2017-09-09 18:02:35.164000 PDT Connected and authenticated. 6.0.0
13 vc-10-9-0-87 10.9.0.87 2017-09-09 18:02:38.042000 PDT Connected and authenticated. 6.5.0
14 vc-10-9-0-88 10.9.0.88 2017-09-09 18:02:37.212000 PDT Connected and authenticated. 6.0.0
15 vc-10-9-0-89 10.9.0.89 2017-09-09 18:02:33.436000 PDT Connected and authenticated. 6.5.0
controller-1#
controller-1# show vcenter vc-10-9-0-75
# vCenter Name vCenter Host Name or IP Last vCenter Update Time Detail State vSphere Version
--|------------|-----------------------|------------------------------|----------------------------|---------------|
1 vc-10-9-0-75 10.9.0.75 2017-09-09 18:02:44.698000 PDT Connected and authenticated. 6.5.0
controller-1#
controller-1# show vcenter vc-10-9-0-75 detail
vCenter Name : vc-10-9-0-75
vCenter Host Name or IP : 10.9.0.75
Last vCenter Update Time : 2017-09-09 18:02:49.463000 PDT
Detail State : Connected and authenticated.
vSphere Version : 6.5.0
controller-1#
controller-1# show vcenter vc-10-9-0-75 error
vCenter Name : vc-10-9-0-75
vCenter Host Name or IP : 10.9.0.75
State : connected
Detail State : Connected and authenticated.
Detailed Error Info :
controller-1#
Integrating vCenter with DMF using Mirror Stack
From the DMF Controller configure the TCP/IP stack using the tcp-ip-stack option in the vCenter config. The default and recommended value is mirror-stack.
Use the show running-config command to view the tcp-ip-stack configuration.
Note: If mirror-stack is configured, it will only show when using the details token.
dmf-controller-1(config-vcenter)# show running-config vcenter vc8 details
! vcenter
vcenter vc8
default-tunnel-endpoint r34-lag-leaf1b
hashed-password <hashed-password>
host-name <ip-address>
mirror-type encapsulated-remote
tcp-ip-stack mirror-stack
user-name This email address is being protected from spambots. You need JavaScript enabled to view it.
View the existing mirror stack NICs and IPs of the host using the show
vcenter vCenter name inventory command.
Use the show fabric errors and show fabric
warnings commands to troubleshoot and verify that everything is functioning as expected.
In the following example, the error message indicates that DMF could not find a route from the ESXi host to the DMF tunnel endpoint.
dmf-controller-1# show fabric errors
~~~~~~~~~~~~~~~~~~~~~~~~~~~~~~~~~~~~~~~~~~~~~~~~~~~~~~~~~~~~~~~~~~~ vCenter related error ~~~~~~~~~~~~~~~~~~~~~~~~~~~~~~~~~~~~~~~~~~~~~~~~~~~~~~~~~~~~~~~~~~~
# vCenter Name Error
--|------------|--------------------------------------------------------------------------------------------------------------------------------------------|
1 vc701 Unable to locate a matching route for Mirror TCP/IP stack in host ESX37.qa.bsn.sjc.aristanetworks.com for DMF endpoint 192.168.200.254
Create Wildcard Tunnels
The current implementation of VMware vCenter creates one tunnel interface from every ESXi host to DMF.
Using a wildcard tunnel on DMF for VMware vCenter reduces the number of tunnels created.
Platform Compatibility
This feature is only compatible with switches that support wildcard tunneling.
The CLI construct wildcard-tunnels is available as a configuration option when configuring a VMware vCenter in DANZ Monitoring Fabric (DMF), as shown below:
Table 1. Commands
cluster
Configure tunnel-endpoint for cluster
default-tunnel-endpoint
Configure tunnel endpoints
description
Describe this vCenter
hashed-password
Set the vCenter password (to log into vCenter)
host-name
Set the vCenter hostname
mirror-type
Set the vCenter vm monitoring mode
mirrored-packet-length
Set the mirrored packet length
password
Set the vCenter password (to log into vCenter)
sampling-rate
Set the packet sampling rate
user-name
Set the vCenter user name (to log into vCenter)
vm-monitoring
Enter vm-monitoring config submode
wildcard-tunnels
Enable wildcard tunnels
Enable wildcard tunnels by setting the above leaf parameter, as shown in the following example of vCenter configuration on the Controller node.
dmf-controller-1(config)# vcenter VC1
dmf-controller-1(config-vcenter)# wildcard-tunnels
dmf-controller-1(config-vcenter)# show this
! vcenter
vcenter VC1
wildcard-tunnels
dmf-controller-1(config-vcenter)#
Similarly, disable wildcard tunnels by issuing the no command as shown below:
dmf-controller-1(config-vcenter)# show this
! vcenter
vcenter VC1
wildcard-tunnels
dmf-controller-1(config-vcenter)# no wildcard-tunnels
dmf-controller-1(config-vcenter)# show this
! vcenter
vcenter VC1
dmf-controller-1(config-vcenter)#
Show Commands
There is no specific show command for wildcard tunnels; however, check them in the vCenter running config. In addition, the show tunnels command shows the tunnels created for the selected vCenter configuration with a wildcard remote IP address.
Troubleshooting
Verify errors and warnings are clear using the show fabric errors and show fabric warnings commands. The show
tunnels command displays tunnels created based on the vCenter configuration on the Controller with a wildcard remote IP address. Use the show switch name table gre-tunnel command to display tunnels programmed on the switch.
Monitor vCenter Traffic by VM Names
Configuration
This feature works with vCenter integration; therefore, configure vCenter Integration in DANZ Monitoring Fabric (DMF). Configure vCenter mapping in the policy, then define a policy match using VM names in the vCenter as illustrated in the following configuration example:
dmf-controller-1(config)# policy v1
dmf-controller-1(config-policy)# action forward
dmf-controller-1(config-policy)# filter-interface filter-interface
dmf-controller-1(config-policy)# delivery-interface delivery-interface
dmf-controller-1(config-policy)# filter-vcenter vcenter-name
dmf-controller-1(config-policy)# 1 match ip src-vm-name vm-name dst-vm-name vm-name
dmf-controller-1(config-policy)# 2 match ip6 src-vm-name vm-name
Show Commands
Enter the show running-config policy policy
name command to display the configuration.
dmf-controller-1# show running-config policy v1
! policy
policy v1
action forward
delivery-interface delivery-interface
filter-interface filter-interface
filter-vcenter vcenter-name
1 match ip src-vm-name vm-name dst-vm-name vm-name
2 match ip6 src-vm-name vm-name
The show policy policy name command displays the policy information, including stats.
dmf-controller-1# show policy v2
Policy Name : v2
Config Status : active - forward
Runtime Status : installed
Detailed Status : installed - installed to forward
Priority : 100
Overlap Priority : 0
# of switches with filter interfaces : 1
# of switches with delivery interfaces : 1
# of switches with service interfaces : 0
# of filter interfaces : 1
# of delivery interfaces : 1
# of core interfaces : 0
# of services : 0
# of pre service interfaces : 0
# of post service interfaces : 0
Push VLAN : 5
Post Match Filter Traffic : -
Total Delivery Rate: -
Total Pre Service Rate : -
Total Post Service Rate : -
Overlapping Policies : none
Component Policies : none
Installed Time : 2023-12-21 19:00:39 UTC
Installed Duration : 50 minutes, 11 secs
~~~~~~~~~~~~~~~~~~~~~~~~~~~~~~~~ Match Rules ~~~~~~~~~~~~~~~~~~~~~~~~~~~~~~~~
# Rule
-|--------------------------------------------------------------------------|
1 1 match ip src-vm-name DMF-RADIUS-SERVER-1 dst-vm-name DMF-TACACS-SERVER-1
~~~~~~~~~~~~~~~~~~~~~~~~~~~~~~~~~~~~~~~~~~~~~~ Filter Interface(s) ~~~~~~~~~~~~~~~~~~~~~~~~~~~~~~~~~~~~~~~~~~~~~~
# DMF IF Switch IF Name State Dir Packets Bytes Pkt Rate Bit Rate Counter Reset Time
-|----------------|-----------|----------|-----|---|-------|-----|--------|--------|------------------------------|
1 span_from_arista Arista-7050 ethernet20 up rx 0 0 0 - 2023-12-21 19:00:39.941000 UTC
~~~~~~~~~~~~~~~~~~~~~~~~~~~~~~~~~~~~~~~~~~~~ Delivery Interface(s) ~~~~~~~~~~~~~~~~~~~~~~~~~~~~~~~~~~~~~~~~~~~~
# DMF IF Switch IF Name State Dir Packets Bytes Pkt Rate Bit Rate Counter Reset Time
-|------------|-----------|------------|-----|---|-------|-----|--------|--------|------------------------------|
1 ubuntu-tools Arista-7050 ethernet49/2 up tx 0 0 0 - 2023-12-21 19:00:39.941000 UTC
~ Service Interface(s) ~
None.
~ Core Interface(s) ~
None.
~ Failed Path(s) ~
None.
The show vcenter vcenter name endpoint command displays the vCenter VM information, including networks.
dmf-controller-1# show vcenter vcenter1 endpoint
# vCenter Name VM Name ESXi Host Name Network Interface Name MAC Address IP Address Virtual Switch Portgroup Power State
--|------------|---------|--------------|----------------------|--------------------------|------------------------------------------|--------------|-------------|-----------|
1 vcenter1 ub-11-216 10.240.155.216 Network adapter 1 00:50:56:8b:4d:03 (VMware) 1.1.11.216/24, fe80::250:56ff:fe8b:4d03/64 DVS-DMF vlan11 powered-on
2 vcenter1 ub-12-216 10.240.155.216 Network adapter 1 00:50:56:8b:72:a0 (VMware) 1.1.12.216/24, fe80::250:56ff:fe8b:72a0/64 DVS-DMF vlan12 powered-on
3 vcenter1 ub-13-216 10.240.155.216 Network adapter 1 00:50:56:8b:c0:06 (VMware) 1.1.13.216/24, fe80::250:56ff:fe8b:c006/64 DVS-DMF vlan-10 powered-on
4 vcenter1 ub-14-216 10.240.155.216 Network adapter 1 00:50:56:8b:d1:d9 (VMware) 1.1.14.216/24, fe80::250:56ff:fe8b:d1d9/64 DVS-DMF vlan-10 powered-on
Troubleshooting
Fabric errors and warnings are very useful for troubleshooting this feature.
When using the show fabric warnings command, the following validation message displays when the vCenter integration cannot resolve the IP address for the VM name used in the policy.
dmf-controller-1# show fabric warnings
~~~~~~~~~~~~~~~~~~~~~~~~~~~~~~~~~~~~~~~~~~~~~~~~~ Policy related warning ~~~~~~~~~~~~~~~~~~~~~~~~~~~~~~~~~~~~~~~~~~~~~~~~~
# Policy Name Warning
-|-----------|------------------------------------------------------------------------------------------------------------|
1 v1 No IP found for VMs [ub-15-216, ub-216-multinic, ub-217-vlan10, ub-14-216, ub-11-216] associated with policy
When VM names used in a policy are matched, the following validation message content appears when a vCenter instance is not associated with the policy.
dmf-controller-1# show fabric warnings
~~~~~~~~~~~~~~~~~~~ Policy related warning ~~~~~~~~~~~~~~~~~~~
# Policy Name Warning
-|-----------|-----------------------------------------------|
1 v1 No vCenter associated to policy with VM matches
This chapter describes establishing Generic Routing Encapsulation (GRE) and or Virtual Extensible LAN (VXLAN) tunnels between DMF switches in different locations or between a DMF switch and a third-party device.
Understanding Tunneling
DMF can forward traffic between two DMF switches controlled by the same Controller over a tunnel. Use this feature to extend a DMF deployment across multiple data centers or branch offices over networks connected by Layer-3 networks. This feature supports the centralization or distribution of tools and taps across multiple locations when they cannot be cabled directly.
Note:Refer to the DANZ Monitoring Fabric 8.6 Hardware Compatibility List for a list of the switches that support tunneling. The DANZ Monitoring Fabric 8.6 Verified Scale Guide indicates the number of tunnels supported by each supported switch (Verified Scalability Values/Encap Tunnels/Decap Tunnels).
When enabling tunneling between DMF switches, keep the following in mind:
Connect switch ports in the main data center and the remote location to the appropriate WAN routers and ping each interface to ensure IP connectivity is established.
Create tunnel endpoints and configure the tunnel attributes on each end of the tunnel.
The CRC Check option must be enabled if tunneling is enabled, which it is by default. If CRC checking is disabled, re-enable it before configuring a tunnel.
In the case of GRE tunnels, the optional gre-key-decap value on the receiving end must match the GRE key value of the sender. The option exists to set multiple values on the same tunnel to decapsulate traffic with different keys.
A single switch can initiate multiple tunnels. Configure a separate encap-loopback-interface for each tunnel (transmit-only or bidirectional).
Set the loopback-mode to mac on the encap-loopback-interface.
Figure 1. Connecting DMF Switches Using a Layer-2 GRE Tunnel
Note: For EOS switches running DMF 8.5: L2GRE tunneling is supported on Arista 7280R3 switches only and subject to the following limitations:
L2GRE tunnels are not supported on DMF 7280R and 7280R2 switches.
DSCP configuration is not supported.
Traffic steering for traffic arriving on an L2GRE tunnel will only allow for matching based on inner src/dst IP, IP protocol, and inner L4 src/dst port.
Packets may only be redirected to a single L2GRE tunnel.
Packets may not be load-balanced across multiple L2GRE tunnels.
Only IPv4 underlays in the default VRF are supported.
Matching on inner IPv6 headers may not be supported.
The maximum number of tunnels on EOS Jericho switches is 32.
There is no bi-directional tunnel support. The parent/uplink router-facing interface is used for either encapsulation or decapsulation, but not simultaneously.
When using tunnel-as-a-filter, there is no inner L3/L4 matching support immediately after decapsulation in the same switch pass. Using a loopback may work around this limitation.
VXLAN tunnels are currently NOT supported on 7280 switches.
Encapsulation Type
DANZ Monitoring Fabric (DMF) supports VXLAN tunnel type and Level-2 Generic Routing Encapsulation (L2GRE). The tunnel type is a per-switch configuration, setting the switch pipeline to VXLAN or L2GRE. Once the switch pipeline is set, all tunnels configured on the switch will use the same tunnel type.
The encapsulation type can be configured in the GUI while adding a new switch into the DMF Controller, as shown in the figure below:
Figure 2. Encapsulation Type
The encapsulation type can be edited for an existing switch from the Fabric > Switches > Configure Switch page, as shown in the figure below:
Figure 3. Switches / Configure
Using Tunnels in Policies
Tunnels can be used as a core link, filter interface, or delivery interface. The most common use case is linking multiple sites, using the tunnel as a core link. If used as a core link, DMF automatically discovers the link as if it were a physical link and similarly determines connectivity (link-state). If the tunnel goes down for any reason, DMF treats the failure as it would a physical link failure.
Another typical use case for the tunnel is as a filter interface to decapsulate L2 GRE/VXLAN tunneled production traffic or a tunnel initiated by another DMF instance managed by a different DMF Controller. Use the tunnel endpoint as a delivery interface to encapsulate filtered monitoring traffic to send to analysis tools or another DANZ Monitoring Fabric managed by a different DMF Controller.
Note: By default, sFlow®* and other Arista Analytics metadata cannot be generated for decapsulated L2 GRE/VXLAN tunneled production traffic on a tunnel interface configured as a filter interface. To generate this metadata, create a policy with a filter interface as a tunnel interface and send the decapsulated traffic to a MAC loopback port configured in a filter-and-delivery role. Now, create a second policy with the filter interface as the MAC loopback port and the delivery interface going to the tools. The sFlow and metadata will now be generated for the decapsulated tunnel traffic.
Configure a GRE Tunnel
To configure a VXLAN tunnel, perform the following steps:
Select Fabric > Switch.
On the Switches page, select the Menu control next to the switch or interface to include in the tunnel and select Create Tunnel.
Alternatively, configure tunnels from the Fabric > Interfaces page by selecting the Menu Control > Create Tunnel option. The system displays the dialog as shown in the figure below:
Figure 4. Configure VXLAN Tunnel
Complete the fields on this page as described below.
Switch: From the drop-down, select the DMF switch.
Encapsulation Type: The encapsulation type will automatically be selected based on the pipeline mode of the selected switch.
Name: Name of the tunnel, beginning with the word tunnel.
Rate Limit (Optional): Packets entering the tunnel can be rate-limited to restrict the bandwidth usage of the tunnel. This can help ensure that a WAN link is not saturated with monitoring traffic being tunneled between sites. This setting is applicable on the tunnel encapsulation side.
Direction: Direction can be bidirectional, transmit-only, or receive-only. For bidirectional tunnels, set the tunnel direction to bidirectional on both ends. For uni-directional tunnels from remote to main datacenter, the tunnel direction is transmit-only on the remote datacenter switch and receive-only on the main data center switch.
Local IP: Local IP address and subnet mask in CIDR format (/nn).
Gateway IP: IP address of the default (next-hop) gateway.
Remote IP: This is the IPv4 address of the other end (remote end) of the tunnel.
Parent Interface: Physical port or port-channel interface associated with the tunnel. This is the destination interface for the tunnel.
Loopback Interface: A physical interface on each switch with a transmit-only or a bidirectional tunnel endpoint. Use this physical interface for tunnel encapsulation and not for any other DMF purpose, such as a filter, delivery, service, or core interface.
DSCP (Optional): Mark the tunnel traffic with the specified DSCP value.
After configuring the appropriate options, select Submit.
Note:Configure this procedure on both switches at each end of the tunnel. Set the Auto VLAN mode to Push Per Policy or Push Per Filter Interface.
Configure a VXLAN Tunnel
To configure a VXLAN tunnel using the GUI, perform the following steps:
Select Fabric > Switch.
On the Switches page, select the Menu control next to the switch or interface to include in the tunnel and select Create Tunnel.
Alternatively, configure tunnels from the Fabric > Interfaces page by selecting the Menu Control > Create Tunnel option. The system displays the dialog as shown in the figure below:
Figure 5. Configure VXLAN Tunnel
Complete the fields on this page as described below:
Switch: From the drop-down, select the DMF switch.
Encapsulation Type: Encapsulation type will automatically be selected based on the pipeline mode of the selected switch.
Name: Name of the tunnel, beginning with the word tunnel.
Rate Limit (Optional): Packets entering the tunnel can be rate-limited to restrict bandwidth usage of the tunnel. This can help ensure that a WAN link is not saturated with monitoring traffic being tunneled between sites. This setting is applicable on the tunnel encap side.
Direction: bidirectional, transmit-only, or receive-only. For bidirectional tunnels, set tunnel-direction to bidirectional on both ends. For uni-directional tunnels from remote to main datacenter, tunnel-direction is transmit only on the remote datacenter switch and the tunnel-direction is receive-only on the main data center switch.
Local IP: Local IP address and subnet mask in CIDR format (/nn).
Gateway IP: IP address of the default (next-hop) gateway.
Remote IP: This is the IPv4 address of the other end (remote end) of the tunnel.
Parent Interface: Physical port or port-channel interface associated with the tunnel. This is the destination interface for the tunnel.
Loopback Interface: A physical interface on each switch with a transmit-only or a bidirectional tunnel endpoint. Use this physical interface for tunnel encapsulation and not for any other DMF purpose, such as a filter, delivery, service, or core interface.
DSCP (Optional): Mark the tunnel traffic with the specified DSCP value.
After configuring the appropriate options, select Submit.
Note:Configure this procedure on both switches at each end of the tunnel. Set the Auto VLAN mode to Push Per Policy or Push
Per Filter Interface.
Viewing or Modifying Existing Tunnels
To view or modify the configuration of an existing tunnel, use the Fabric > Interfaces option. To view the tunnel configuration, expand the interface. DMF displays the tunnel configuration as illustrated in the following figure.
Tip: When multiple interfaces are present, use the Filter feature to locate tunnel interfaces after typing the first few letters of the word tunnel.
Figure 6. Tunnel Interfaces
The expanded row displays the status and other properties of the tunnel configured for the selected interface. Use the Menu control and select Configure Tunnel to modify the tunnel configuration. Select Delete Tunnel to remove the tunnel.
Using a Tunnel with User-defined Offsets
With an L2-GRE or VXLAN tunnel, matching traffic on a user-defined offset results in dropping interesting traffic. The tunnel header throws off the offset calculation, and the selected traffic may be dropped. This behavior is due to how switch hardware calculates the anchor and offset concerning incoming packets. When the core link is a tunnel, the anchor and offset calculation differs when encapsulating packets compared to when decapsulating.
There are two ways to work around this issue:
Avoid matching on user-defined offsets on tunnel interfaces
Avoid using a tunnel as a core link when matching on a user-defined offset
Avoid matching on user-defined offsets when the ingress filter interface is a tunnel by filtering on the user-defined offset before the traffic enters a tunnel used as a filter interface. This preserves the LLDP messaging on the core tunnel link, but it requires an extra physical loopback interface on the encapsulating switch. The figure below illustrates both of these workarounds. In either case, a UDF match is applied to the ingress traffic on filter interface F. For example, the policy might apply a match at offset 20 after the start of the L4 header. In both workarounds, the policy has been split into two policies:
P1: F to D1, match on user-defined offset P2: F1 to D, match any.
In the example on the left, the ingress interface on the decapsulating switch, which is included in a core tunnel link, no longer has to calculate the user-defined offset. This solution preserves LLDP messages on the tunnel link but requires an extra loopback interface.
Figure 7. Using Tunnels with User-Defined Offsets
In the example on the right, the tunnel endpoints are configured as filter and delivery interfaces. This solution avoids using the tunnel as a core link and does not require an extra physical loopback interface. However, LLDP updates are lost on the tunnel link.
Configuring Wildcard Tunnels
Wildcard Tunnels on SAND Platforms
The Wildcard tunneling feature allows the DANZ Monitoring Fabric (DMF) to decapsulate L2GRE-based tunneled traffic from any remote source. This feature, supported on Switch Light OS (SWL) based DMF switches in prior releases, now allows wildcard tunnels on Arista EOS-based DMF switches.
Platform Compatibility
EOS switches with Jericho2 or higher ASICs compatible with DMF 8.5.0 that support L2GRE tunneling. L2GRE tunneling on EOS SAND platforms is only supported on Arista 7280R3 switches.
Enable Tunneling by navigating to the DMF Features page and selecting the gear icon in the navigation bar.
Figure 8. DMF Navigation Menu
Locate the Tunneling card feature on the page.
Tip: Use the search bar to quickly locate the feature.
Figure 9. DMF Features - Tunneling
Select the toggle switch to enable the Tunneling feature on DMF.
Figure 10. Tunneling On
Steps to Enable Wildcard Tunnels
Locate the Switches tab on the Fabric > Switches page.
Figure 11. Fabric > Interfaces
Select the Create Tunnel option from the table menu.
Figure 12. Create Tunnel
Create a Tunnel (select Encapsulation Type as GRE) by entering the required fields. To enable wildcard support, enter the Remote IP input with data as shown below.
To configure a GRE tunnel using the CLI, perform the following steps:
Connect switch ports (on remote and main datacenter) to their respective WAN routers and ensure they can communicate via IP.
Enable tunneling on the DMF network by entering the following command from config mode:
controller-1(config)# tunneling
Tunneling is an Arista Licensed feature. Please ensure that you have purchased the license
for tunneling before using this feature. enter "yes" (or "y") to continue: yes
controller-1(config)#
Configure the MAC loopback mode, as shown in the following example:
controller-1(config)# switch DMF-CORE-SWITCH
controller-1(config-switch)# interface ethernet7
controller-1(config-switch-if)# loopback-mode mac
Create tunnel endpoints.
The following CLI example configures a bi-directional tunnel from remote-dc1-filter-sw to main-dc-delivery-sw:
!
switch remote-dc1-filter-sw
gre-tunnel-interface tunnel1
remote-ip 192.168.200.50
gre-key-decap 4097 === 4097 is the VPN key used for the tunnel ID
parent-interface ethernet6
local-ip 192.168.100.50 mask 255.255.255.0 gateway-ip 192.168.100.1
direction bidirectional encap-loopback-interface ethernet38
!
switch main-dc-delivery-sw
gre-tunnel-interface tunnel1
remote-ip 192.168.100.50
gre-key-decap 4097 === 4097 is the VPN key used for the tunnel ID
parent-interface ethernet5
local-ip 192.168.200.50 mask 255.255.255.0 gateway-ip 192.168.200.1
direction bidirectional encap-loopback-interface ethernet3
The following CLI example configures a uni-directional tunnel from remote-dc1-filter-sw to main-dc-delivery-sw:
!
switch remote-dc1-filter-sw
gre-tunnel-interface tunnel1
remote-ip 192.168.200.50
gre-key-decap 4097 === 4097 is the VPN key used for the tunnel ID
interface parent-interface ethernet6
local-ip 192.168.100.50 mask 255.255.255.0 gateway-ip 192.168.100.1
direction transmit-only encap-loopback-interface ethernet38
!
switch main-dc-delivery-sw
gre-tunnel-interface tunnel1
remote-ip 192.168.100.50
gre-key-decap 4097 === 4097 is the VPN key used for the tunnel ID
parent-interface ethernet5
local-ip 192.168.200.50 mask 255.255.255.0 gateway-ip 192.168.200.1
direction receive-only
Rate Limit the Packets on a GRE Tunnel
Packets entering the GRE tunnel can be rate-limited to limit bandwidth usage by the tunnel and help ensure that a WAN link is not saturated with monitoring traffic being tunneled between sites. This setting is applicable on the tunnel encapsulation side.
Note: The minimum recommended value for rate limiting on the tunnel interface is 25 kbps. When attempting to set a value below this limit, the switch will still set the rate limit value to 25 kbps.
All CLI show commands for regular interfaces apply to GRE tunnel interfaces.
Use the show running-config command to view the configuration of tunnel interfaces.
Enter the show tunnel command to see a tunnel interface's configuration parameters and runtime state.
controller-1# show tunnel
# Switch DPID Tunnel Name Tunnel Status Direction Src IP Dst IP Parent Name Loopback Name
-|-------------------------|-----------|------------------|-------------|------------|------------|------------|-------------|
1 DMF-CORE-SWITCH-1 tunnel1 ESTABLISHED_TUNNEL bidirectional 198.82.215.1 216.47.143.1 ethernet5:1 ethernet6
2 DMF-CORE-SWITCH-2 tunnel1 ESTABLISHED_TUNNEL bidirectional 216.47.143.1 198.82.215.1 ethernet11:3 ethernet5
3 DMF-CORE-SWITCH-2 tunnel2 ESTABLISHED_TUNNEL bidirectional 192.168.43.1 192.168.42.1 ethernet11:4 ethernet17
4 DMF-CORE-SWITCH-3 tunnel2 ESTABLISHED_TUNNEL bidirectional 192.168.42.1 192.168.43.1 ethernet6 ethernet33
controller-1# show tunnel switch DMF-CORE-SWITCH-2
# Switch DPID Tunnel Name Tunnel Status Direction Src IP Dst IP Parent Name Loopback Name
-|-------------------------|-----------|------------------|-------------|------------|------------|------------|-------------|
1 DMF-CORE-SWITCH-2 tunnel1 ESTABLISHED_TUNNEL bidirectional 216.47.143.1 198.82.215.1 ethernet11:3 ethernet5
2 DMF-CORE-SWITCH-2 tunnel2 ESTABLISHED_TUNNEL bidirectional 192.168.43.1 192.168.42.1 ethernet11:4 ethernet17
controller-1# show tunnel switch DMF-CORE-SWITCH-2 tunnel1
# Switch DPID Tunnel Name Tunnel Status Direction Src IP Dst IP Parent Name Loopback Name
-|-------------------------|-----------|------------------|-------------|------------|------------|------------|-------------|
1 DMF-CORE-SWITCH-2 tunnel1 ESTABLISHED_TUNNEL bidirectional 216.47.143.1 198.82.215.1 ethernet11:3 ethernet5
controller-1#
Configure a VXLAN Tunnel
To configure a VXLAN tunnel using the CLI, perform the following steps:
Connect switch ports (on remote and main datacenter) to their respective WAN routers and ensure that they can communicate via IP.
Enable tunneling on the DMF network by entering the following command from config mode:
controller-1(config)# tunneling
Tunneling is an Arista Licensed feature. Please ensure that you have purchased the license
for tunneling before using this feature. enter "yes" (or "y") to continue: yes
controller-1(config)#
Configure the MAC loopback mode, as shown in the following example:
controller-1(config)# switch DMF-CORE-SWITCH
controller-1(config-switch)# interface ethernet7
controller-1(config-switch-if)# loopback-mode mac
Create tunnel endpoints.
The following CLI example configures a bi-directional tunnel from remote-dc1-filter-sw to main-dc-delivery-sw:
Packets entering the VXLAN tunnel can be rate-limited to limit bandwidth usage by the tunnel and help ensure that a WAN link is not saturated with monitoring traffic being tunneled between sites. This setting is applicable on the tunnel encapsulation side.
Note:The minimum recommended value for rate limiting on the tunnel interface is 25 kbps. When attempting to set a value below this limit, the switch will still set the rate limit value to 25 kbps.
All CLI show commands for regular interfaces apply to tunnel interfaces.
Use the show running-config command to display the configuration of tunnel interfaces.
Enter the show tunnel command to see the configuration parameters and runtime state for a VXLAN tunnel interface.
controller-1# show tunnel
# Switch DPID Tunnel Name Tunnel Status Direction Src IP Dst IP Parent Name Loopback
Name
-|-------------------------|-----------|-----------------|-------------|------------|------------|------------|-------------|
1 DMF-CORE-SWITCH-1 tunnel1 ESTABLISHED_TUNNEL bidirectional 198.82.215.1 216.47.143.1 ethernet5:1 ethernet6
2 DMF-CORE-SWITCH-2 tunnel1 ESTABLISHED_TUNNEL bidirectional 216.47.143.1 198.82.215.1 ethernet11:3 ethernet5
3 DMF-CORE-SWITCH-2 tunnel2 ESTABLISHED_TUNNEL bidirectional 192.168.43.1 192.168.42.1 ethernet11:4 ethernet17
4 dMF-CORE-SWITCH-3 tunnel2 ESTABLISHED_TUNNEL bidirectional 192.168.42.1 192.168.43.1 ethernet6 ethernet33
controller-1#
controller-1# show tunnel switch DMF-CORE-SWITCH-2
# Switch DPID Tunnel Name Tunnel Status Direction Src IP Dst IP Parent Name Loopback Name
-|-----------------------|-----------|------------------|-------------|------------|------------|------------|-------------|
1 DMF-CORE-SWITCH-2 tunnel1 ESTABLISHED_TUNNEL bidirectional 216.47.143.1 198.82.215.1 ethernet11:3 ethernet5
2 DMF-CORE-SWITCH-2 tunnel2 ESTABLISHED_TUNNEL bidirectional 192.168.43.1 192.168.42.1 ethernet11:4 ethernet17
controller-1#
controller-1# show tunnel switch DMF-CORE-SWITCH-2 tunnel1
# Switch DPID Tunnel Name Tunnel Status Direction Src IP Dst IP Parent Name Loopback Name
-|-----------------------|-----------|------------------|-------------|------------|------------|------------|-------------|
1 DMF-CORE-SWITCH-2 tunnel1 ESTABLISHED_TUNNEL bidirectional 216.47.143.1 198.82.215.1 ethernet11:3 ethernet5
controller-1#
Configuring Wildcard Tunnels
Wildcard Tunnels on SAND Platforms
The Wildcard tunneling feature allows the DANZ Monitoring Fabric (DMF) to decapsulate L2GRE-based tunneled traffic from any remote source. This feature, supported on Switch Light OS (SWL) based DMF switches in prior releases, now allows wildcard tunnels on Arista EOS-based DMF switches.
Platform Compatibility
EOS switches with Jericho2 or higher ASICs compatible with DMF 8.5.0 that support L2GRE tunneling. L2GRE tunneling on EOS SAND platforms is only supported on Arista 7280R3 switches.
Perform the following steps to configure the tunnels.
Enable the tunneling feature before configuring tunnels on a switch using the tunneling command. Enter yes when prompted to continue.
dmf-controller-1(config)# tunneling
Tunneling is an Arista Licensed feature.
Please ensure that you have purchased the license for tunneling before using this feature.
Enter "yes" (or "y") to continue: y
dmf-controller-1(config)#
Configure a tunnel by using the remote-ip as 0.0.0.0.
dmf-controller-1(config)# switch main-dc-delivery-sw
dmf-controller-1(config-switch)# gre-tunnel-interface tunnel1
dmf-controller-1(config-switch)# remote-ip 0.0.0.0 === this is to enable wildcard tunnel
dmf-controller-1(config-switch)# gre-key-decap 4097
dmf-controller-1(config-switch)# parent-interface ethernet5
dmf-controller-1(config-switch)# local-ip 192.168.200.50 mask 255.255.255.0 gateway-ip 192.168.200.1
dmf-controller-1(config-switch)# direction receive-only
Please refer to the Tunneling Between Data Centers chapter for more information on using L2GRE tunnels in DANZ Monitoring Fabric (DMF).
Show Commands
All CLI show commands for regular interfaces apply to GRE tunnel interfaces. Use the show
running-config command to view the configuration of tunnel interfaces.
Enter the show tunnel command to view a tunnel interface's configuration parameters and runtime state.
Example
dmf-controller-1# show tunnel
# Switch DPID Tunnel Name Tunnel Status Direction Src IP Dst IP Parent Name Loopback Name
-|-----------------|-----------|------------------|-------------|------------|------------|------------|-------------|
1 DMF-CORE-SWITCH-1 tunnel1 ESTABLISHED_TUNNEL bidirectional 198.82.215.1 216.47.143.1 ethernet5:1 ethernet6
2 DMF-CORE-SWITCH-2 tunnel1 ESTABLISHED_TUNNEL bidirectional 216.47.143.1 198.82.215.1 ethernet11:3 ethernet5
3 DMF-CORE-SWITCH-2 tunnel2 ESTABLISHED_TUNNEL bidirectional 192.168.43.1 192.168.42.1 ethernet11:4 ethernet17
4 DMF-CORE-SWITCH-3 tunnel2 ESTABLISHED_TUNNEL bidirectional 192.168.42.1 192.168.43.1 ethernet6 ethernet33
Encapsulation Types
DANZ Monitoring Fabric (DMF) supports VXLAN tunnel type and Level-2 Generic Routing Encapsulation (L2GRE). The tunnel type is a per-switch configuration, setting the switch pipeline to VXLAN or L2GRE. Once the switch pipeline is set, all tunnels configured on the switch will use the same tunnel type.
The encapsulation type can also be configured or edited from the CLI in configuration mode:
Ctrl-1(config)# switch Switch-1
Ctrl-1(config-switch)# tunnel-type
gre Select GRE as the tunnel type of the switch. (default selection)
vxlan Select VxLAN as the tunnel type of the switch.
The switch pipeline mode can be viewed from the CLI using the following command:
Ctrl-1(config)# show switch
# Switch Name IP Address State Pipeline Mode
-|-------------------|---------------------------|---------|----------------------------------|
1 Switch-1 fe80::d6af:f7ff:fef9:e2b0%9 connected l3-l4-offset-match-push-vlan-vxlan
2 Switch-2 fe80::e6f0:4ff:fe69:6aee%9 connected l3-l4-offset-match-push-vlan
3 Switch-3 fe80::e6f0:4ff:fe78:1ffe%9 connected l3-l4-offset-match-push-vlan-vxlan
Ctrl-1(config)#
In the above CLI output, Switch-1 and Switch-3 use the VXLAN tunnel type, as seen in the Pipeline Mode column. Switch-2 is using the L2GRE tunnel type.
This chapter describes configuring link aggregation groups between switches, switches, and tools or between switches and taps.
Configuring Link Aggregation
Link aggregation combines multiple LAN links and cables in parallel. Link aggregation provides a high level of redundancy and higher transmission speed.
Note: When connecting a Link Aggregation Group (LAG) to a DMF Service Node appliance, member links can be connected to multiple DMF Service Node appliances with data ports of the same speed.
DMF provides a configurable method of hashing for load distribution among LAG members. The enhanced hashing algorithm automatically assigns the best hashing type for the switch and traffic. This setting allows the manual selection of the packet types and fields used for load distribution among the members of a port-channel interface. Enhanced mode and symmetric hashing are enabled by default for the supported switch platforms. With symmetric hashing, bidirectional traffic between two hosts going out on a port channel is distributed on the same member port.
The default hashing option uses the best available packet header field that applies to each packet, and that is supported by the switch. These fields can include the following:
IPv4
IPv6
MPLS (disabled by default)
L2GRE packet
If none of these headers apply, DMF uses Layer-2 header fields (source MAC address, destination MAC address, VLAN-ID, and ethertype) to distribute traffic among the LAG member interfaces. Hashing on the following packet header fields is enabled by default:
hash l2 dst-mac eth-type src-mac vlan-id
hash ipv4 dst-ip src-ip
hash ipv6 dst-ip src-ip
hash l2gre inner-l3 dst-ip src-ip
hash symmetric
Note: DMF treats VN-tagged and QinQ packets as L2 packets and uses Layer-2 headers to distribute traffic among LAG member interfaces for these packets.
Configure Link Aggregation Groups
Overview
A new DMF LAGs Page introduces an improved workflow and additional functionality.
Navigate to Fabric > LAGs.
Figure 1. Lag Aggregation Groups Dashboard
Main Page
The main page contains four components:
LAG Information
LAG Alerts
Switch LAG Enhanced Hash Settings
LAG Members Utilization
LAG Information
Figure 2. LAG Information
The LAG Information table displays all the LAGs configured in DMF and each member's status. A row contains the LAG Name, Switch Name, and Member Status.
Hover over a member under Status to view the status of each member interface.
Use the checkbox to Edit or Delete a LAG entry. Select the LAG Name link to open the properties tab of the LAG details panel.
Create or Edit LAG
Figure 3. Create LAG
Select Create LAG to open the configuration panel.
Enter a LAG Name and the Switch Name from the drop-down list, and choose the member Interfaces from that switch.
Tip: If no configured LAGs exist, select Create LAG on the main page.
To edit a LAG, choose it in the Information table and select Edit.
While the LAG Name and switch name are not editable, modifying member Interfaces and Minimum Links values is.
Only one LAG can be edited at a time; however, the system supports deleting multiple LAGs simultaneously.
Select Submit to commit the changes to the LAG.
LAG Alerts
Figure 4. LAG Alerts
LAG Alerts displays all LAG Alerts and LAG-related Switch Alerts. The Switch or LAG tag indicates the type of alert. Expand each item to view the alert description and the number of occurrences.
LAG Enhanced Hash Grid
Figure 5. Grid
The Switch Lag Enhanced Hash Settings grid displays a switch's current LAG-enhanced hash settings across various hash fields and categories. If a cell is gray, there are no currently active sub-settings. Hover over the blue cell to view active fields. Select a switch name link to open the Enhanced Hash Configuration tab of the LAG Details pane.
LAG Members Utilization
Figure 6. Utilization
The LAG Members Utilization table summarizes the utilization for each LAG.
In the Utilization Range column, a colored bar indicates the start of the minimum utilization and the end of the maximum utilization of its members. Hover over the bar to view the Speed, minimum bit Rate, and maximum bit Rate of the LAG for each direction. The bar changes color based on LAG alerts:
Green – indicates no alerts.
Yellow – only warnings.
Red – there is more than one alert.
Select the LAG Name link to open the Utilization tab of the LAG Details pane.
Details Pane
Select a LAG or switch link to open the details pane. Choose a LAG to view its details. When choosing a switch link in the Enhanced Hash grid, the first LAG on that switch is selected. If there isn't a LAG on the switch, the system displays an empty string, and the Enhanced Hash opens for that switch. The Properties and Utilization tab will be disabled. Select a different LAG to access the other tabs.
Properties
Figure 7. Properties
The LAG Name, Switch Name, Members tags, and Minimum Link values appear in the descriptions section. The Members Configuration table shows the configuration of each member interface. Use Show/Hide Columns to determine which columns to display.
Utilization
Figure 8. Utilization
Utilization displays the utilization statistics for the LAG.
There are two time-series charts for RX and TX stats. These charts are updated every 10 seconds and display each LAG member's bit-rate / packet rate. For LAGs with over five members, select Top 5 or Bottom 5 from the All drop-down in the chart to display only the top or bottom five interfaces.
Alternate between Bytes and Packets to change the statistics displayed. Alternating between bytes and packets will not reset the time-series chart since both bytes and packet data are polled every 10 seconds.
Select Clear/Reset LAG Stats to re-initialize the chart. Selecting a new LAG re-initializes the charts, and polling begins for new LAG utilization data.
Enhanced Hash Configuration
Figure 9. Enhanced Configuration
Before the DMF 8.6 release, the LAG Enhanced Hash configuration occurred on the Switches page. Now, it is done in the LAGs Detail pane.
Select Unlock to Edit to enable changing configuration settings and Save Changes to submit the changes.
The LAGs detail pane closes, and the updated settings appear in the Switch Lag Enhanced Hash Settings grid table.
Each column lists sub-settings for L2, L2 GRE Inner L2, and other configurations.
Select a link in Switch Lag Enhanced Hash Settings to turn these on and off, depending on the data required. There are validations to ensure the correct combination of settings (such as L2 GRE Inner L2 and L2 GRE Inner L3 cannot be set at the same time) that will appear in an AlertMessageList in the pane. The configuration must pass all validations to submit the changes successfully.
The Symmetric field has three options: Default, Enabled, and Disabled.
Disable the Symmetric field for the GTP Match settings.
Enter First Byte and First Byte Mask as hex values 0–255 with up to four Port Match Entries.
Each port match entry must have a port combo and number values for the corresponding ports.
When setting the Port Combo to AND or OR, both Src Port and Dst Port must have non-zero values.
L2 GRE Key Hashing
The L2 GRE Key-based hashing feature allows the L2 GRE packets to hash based on the L2 GRE (Tunnel) Key on Core DMF switches.
Previously, L2 GRE payload-based hashing (InnerL2 or InnerL3) applied only to L2 GRE packets terminated at DMF delivery or filter switches. If a user wanted to hash L2 GRE packets transiting a DMF core switch, the L2 GRE payload-based hashing across port-channel interfaces would not have been functional as the L2 GRE tunnel was not terminating on the core DMF switch.
With the L2 GRE Key-based hashing feature, users can now hash L2 GRE packets based on the L2 GRE Key on core DMF switches.
Note: The L2 GRE Key-based hashing feature applies to switches running SWL OS and does not apply to switches running EOS.
Perform the following steps:
Configure the L2 GRE Key Hashing in the UI for a switch in the Fabric > Switches page using the table row menu action Configure option.
Figure 10. Fabric Switch Configure Menu
Enable the L2 GRE Key for the IPv4 packets in the LAG Enhanced Hash step.
Note: The L2 GRE Key is unsupported for IPv6 and VXLAN Inner L3.
Figure 11. Configure Switch L2 GRE Key
Select Submit to save the configuration.
Use the CLI commands to verify settings and troubleshoot any issues that may arise.
VXLAN Hashing
VXLAN hashing enables hashing on a VXLAN payload, including hashing on the Inner L3 Source IP, Inner L3 Destination IP, Inner L2 Source MAC, and inner L2 Destination MAC. This only applies to terminated cases.
Symmetric hashing works with VXLAN packet Inner L3 Source IP/Destination IP, Inner L4 Source Port/Destination Port, and Outer L3 Source IP/Destination IP.
Note: VXLAN hashing applies to switches running SWL OS.
Perform the following steps:
Configure the VXLAN Hashing in the UI for a switch in the Fabric > Switches page using the table row menu action Configure option.
Figure 12. Fabric Switch Configure Menu
In the LAG Enhanced Hash step, configure the following fields depending on your requirements:
L2 VXLAN Inner L2 fields
VXLAN Inner L3 fields
Note:
L2 GRE Key is not supported for VXLAN hash fields.
Cannot simultaneously specify enhanced hash for L2 GRE Inner L2 and Inner L3.
Cannot simultaneously specify enhanced hash for VXLAN Inner L2 and Inner L3.
Figure 13. Configure Switch LAG Enhanced Hash
Select Submit to save the configuration.
Use the CLI commands to verify settings and troubleshoot any issues that may arise.
MLAG RTAG7 Hash Computation for Unbalanced Load Balancing
In DANZ Monitoring Fabric (DMF), all SWL OS switches with the same underlying ASIC have the same RTAG7 hash parameters configured by default. After configuring MLAG to load balance traffic from filter to delivery switches, and when the number of interfaces in the MLAG and LAG in the delivery switch is the same, the traffic will not be load balanced in the delivery switch because of hash polarization.
Use the feature to avoid LAG hash polarization by choosing different hash algorithms in separate switches. The other option is using a different packet field set in each switch.
The feature supports using different hash algorithms by choosing different hash seed values.
Note: MLAG RTAG7 hash computation for unbalanced load balancing only applies to switches running SWL OS, does not apply to switches running EOS and is only supported on select Broadcom® switch ASICs that run SWL OS.
Perform the following steps:
From the home page, select the switches using Fabric > Switches.
Figure 14. Fabric > Switches
A list of available switches displays.
Figure 15. List of Switches
Choose the required switch for configuring the hash seeds. Hash seeds are integers used to generate random numbers in the RTAG7 hash algorithm.
Figure 16. Selected Switch
Select Actions from the menu.
Figure 17. Actions
On the Configure Switch page, select LAG Enhanced Hash.
Figure 18. LAG Enhanced Hash
Toggle on the following:
Options
Symmetric
L2 Fields
Src. MAC
Dst. MAC
Ether-Type
VLAN ID
Enter the hash Seed 1 and Seed 2 values in the LAG Enhanced Hash window.
Select Submit.
Note: The GUI example above illustrates an L2 configuration.
Optional: View the configured hash seed using the CLI and the following show command.
R450-C1# show lag-enhanced-hash
~~~~~~~~~~~~~~~~~~~~~~~~~~~ L2 Enhanced Hash ~~~~~~~~~~~~~~~~~~~~~~~~~~~
# Switch DPID Dst mac Eth type Src mac Vlan id Seed1 Seed2 Symmetric
-|---------------|-------|--------|-------|-------|-----|-----|---------|
1 A-7050SX3-48YC8 True True True True 1234 3456 True
Trident4 LAG Hashing for L2GRE and VXLAN Traffic
Overview
For L2GRE transit traffic, LAG hashing uses only the encapsulated (inner) packet header fields. There is no option to use underlay (outer) packet header fields.
When the encapsulated packet is IP, the system uses the IP parameters configured with hash ipv4 or hash
ipv6 for hashing.
When the encapsulated packet is L2, the system uses L2 parameters configured using hash l2 for hashing.
For VXLAN transit traffic, LAG hashing uses only the underlay packet header fields. There is no option to use encapsulated packet header fields. The system treats VXLAN transit traffic like IP traffic.
This feature is supported on Arista 7050X4 switches.
Limitations
Like other platforms, you cannot configure VXLAN and L2GRE packet fields for LAG hashing. For 7050X4 switches, the system does not support LAG configurations hash
l2gre, hash vxlan, hash ipv4, andl2-gre-key.
Pseudo Multi-Chassis Link Aggregation
DMF supports Link Aggregation Groups (LAGs) that allow 2 or more physical interfaces on the same DMF switch to be aggregated into 1 logical interface to increase the aggregate bandwidth and provide link redundancy against link failure. This feature works well if all the tools connect to the same DMF delivery switch, typically when co-locating customer tools in the same physical location. However, in cases where tools reside in different data centers or physical locations, where a single DMF switch cannot connect to all the tools, load balancing across two DMF delivery switches is required.
A pseudo-multi-chassis Link Aggregation Group (MLAG) provides redundancy for each delivery switch connected to a multi-homed tool. With MLAG, traffic is hashed on the upstream DMF switch across two active-active links toward the delivery switches. If one of the switches fails, the traffic will fail over to the healthy switch.
Figure 19. Redundancy using MLAG
MLAG Components
Figure 20. MLAG Components
MLAG Domain: An MLAG domain is a logical grouping of two delivery switches that will participate in an MLAG.
Peer Switch: Member switches added into the MLAG domain.
MLAG Interface: An MLAG interface, configured under the MLAG domain, is a logical binding of two physical interfaces or LAG interfaces, one from each peer switch.
Core MLAG Link: A fabric-facing MLAG link. A core switch LAG interface, whose members connect to the two peer switches participating in the MLAG domain.
Delivery MLAG Link: An MLAG interface that is assigned the delivery interface role. This interface is used in a policy as a delivery interface.
MLAG Member Interface: A physical interface or a LAG interface added into an MLAG interface.
DMF Policy: A user-configured DMF policy that contains at least one MLAG delivery interface.
Dynamic MLAG Domain Policy: Dynamically configured policies that follow the naming convention _mlag_DMF-policy_DeliverySwitch. For one user-configured MLAG policy, a policy that uses at least one MLAG delivery interface, two dynamic MLAG domain policies are created, one for each peer switch.
MLAG Limitations
An MLAG domain cannot have more than two switches.
A switch can only be a part of one MLAG domain.
An MLAG interface can only have two member interfaces.
An MLAG interface can only have one interface (physical interface or LAG interface) from each peer switch.
Tunnel interfaces are not supported as members in MLAG interface configuration.
Configure MLAG
To configure an MLAG domain from the GUI, go to the Fabric > MLAGs tab.
Figure 21. Fabric –> MLAGs page
Figure 22. Create MLAGDomain
Select Create MLAG Domain and enter the following:
Domain Name: Enter the MLAG domain alias.
Peer Switch 1: From the drop-down, select the first switch that will be participating in the MLAG domain.
Peer Switch 2: From the drop-down, select the second switch that will be participating in the MLAG domain.
MLAG Interfaces: Enter an alias for the fabric-facing MLAG interface. This interface connects the core switch to the peer switches in the MLAG domain.
Peer Switch 1 and Peer Switch 2: After selecting peer switches under the domain name, the peer switches under the MLAG interface will automatically be selected.
Interface 1: Select the member interface that connects the core switch to DeliverySwitch-1
Interface 2: Select the member interface that connects the core switch to DeliverySwitch-2.
MLAG Delivery Interfaces: Enter an alias for each MLAG delivery interface.
DMF Interface Name: Enter the DMF interface name for the MLAG delivery interface. This alias will be used to identify the delivery interface while configuring the DMF policy.
Strip VLAN on Egress: Select the strip VLAN configuration for the MLAG delivery interface
Peer Switch 1 and Peer Switch 2: These will be automatically selected based on the peer switches selected under the domain name.
Interface 1: Select the member interface on Peer Switch 1.
Interface 2: Select the member interface on Peer Switch 2.
Select Create to save the configuration.
Figure 23. MLAG Domain StateFigure 24. MLAG Domain Expanded View
The above screenshot displays the MLAG domain status. Select + to expand each MLAG interface's domain configuration and status of each MLAG interface.
Create MLAG Policy
To configure an MLAG policy, go to the Monitoring > Policies page.
Figure 25. Configure MLAG Policy
Select + Create Policy to add a new policy.
Select + Add Ports in Destination Tools and select or drag the MLAG interface to associate with the policy.
Figure 26. Add MLAG Interface
Select Add 1 Interface and enter the following to configure the policy association.
Name: Assign a unique name to the policy.
Description: A description for the policy.
Action: Forward (default), None, Capture, or Drop.
Priority: 100 (default), or enter a value.
Scheduling: Automatic (default), Now, Set Time, or Set Delay.
Port Selection > Traffic Sources > + Add Port(s): Select the filter interface (traffic source) for the policy.
Match Traffic > Allow All Traffic / Deny All Traffic or Configure A Rule: Specify the traffic rule for the policy.
Select Create Policy.
Viewing Policy Statistics
After configuring the MLAG policy, view it under Monitoring > Policies along with the dynamic policies created as part of the MLAG policy.
Figure 27. MLAG Policy
To view the policy statistics, roll over a Policy Name or select the MLAG Policy Name. The following screens appear.
Figure 28. MLAG Policy - Interface StatisticsFigure 29. MLAG Policy - Operational Details
Viewing MLAG Links
To view the MLAG links, go to Fabric > Links > MLAG Member Links tab.
Figure 30. MLAG Member Links
The above screenshot shows the MLAG links established between the core switch and the peer switches that are part of the MLAG domain. The LLDP message exchange discovers the links.
Use the lag-interface command to enter the config-switch-lag-if submode to define the LAG member interfaces and specify the type of load distribution (hashing) to use for the LAG.
Use the member command to add an interface to a LAG. Enter this command for each interface to add to the LAG. To remove an interface, use the no member version of the command.
For example, the following commands add two interfaces to a LAG named my-lag.
controller-1(config)# switch DMF-FILTER-SWITCH-1
controller-1(config-switch)# lag-interface mylag
controller-1(config-switch-lag-if)# member ethernet13
controller-1(config-switch-lag-if)# member ethernet14
To configure multiple delivery interfaces as a LAG, complete the following steps:
Assign a name to the LAG and enter the config-switch-lag-if submode.
controller-1(config-switch-lag-if)# member ethernet39
controller-1(config-switch-lag-if)# member ethernet40
To configure a core LAG apply the membership configuration to both ends of the connection:
controller-1(config)# switch SWITCH-1
controller-1(config-switch)# lag-interface core-link
controller-1(config-switch-lag-if)# member ethernet1
controller-1(config-switch-lag-if)# member ethernet3
controller-1(config)# switch SWITCH-2
controller-1(config-switch)# lag-interface core-link
controller-1(config-switch-lag-if)# member ethernet49
controller-1(config-switch-lag-if)# member ethernet51
Note: Ensure that when you set up a core LAG between DMF fabric switches it is properly configured on both sides of the connection; otherwise, you will get a lag_misconfiguration error state. You need to configure link aggregation symmetrically on both ends of a connection for it to work properly.
To view the configured LAGs, enter the show lag command, as in the following example:
controller-1> show lag
~~~~~~~~~~~~~~~~~~~~~~~~~~~~~~~~~~~~~~~~~~~~~ Lag Interfaces ~~~~~~~~~~~~~~~~~~~~~~~~~~~~~~~~~~~~~~~~~~~~~
# Switch LAG State Rx Rate Pkt Rate Peak Rate Peak Pkt Rate TX Rate Pkt Rate Peak Rate Peak Pkt Rate
-|--------|---------|-----|-------|--------|---------|-------------|-------|--------|---------|-------------|
1 SWITCH-1 core-link up 720bps 0 2.59Gbps 608181 184bps 0 53.2Mbps 37150
2 SWITCH-2 core-link up 184bps 0 424bps 0 720bps 0 1.08Kbps 1
~~~~~~~~~~~~~~~~~~~~~~~~~~~~~~~~~~~~~~~~~~~~~~~~~~~~ Member Interfaces ~~~~~~~~~~~~~~~~~~~~~~~~~~~~~~~~~~~~~~~~~~~~~~~~~~~~
# Switch LAG Member State Fault Rx Rate Pkt Rate Peak Rate Peak Pkt Rate Tx Rate Pkt Rate Peak Rate Peak Pkt Rate
-|--------|---------|----------|-----|-----|-------|--------|---------|-------------|-------|--------|---------|-------------|
1 SWITCH-1 core-link ethernet1 up 624bps 0 800bps 1 88bps 0 152bps 0
2 SWITCH-1 core-link ethernet3 up 96bps 0 18.5Mbps 1735 88bps 0 136bps 0
3 SWITCH-2 core-link ethernet49 up 88bps 0 152bps 0 624bps 0 800bps 1
4 SWITCH-2 core-link ethernet51 up 88bps 0 280bps 0 96bps 0 18.5Mbps 1735
Configuring Hashing Fields
To configure the hashing fields manually via the CLI, use the lag-enhanced-hash command to enter config-switch-hash mode as in the following example:
Minimum Link and Activation Configuration for LAG Interfaces
When some LAG member links go down, it may be preferable to isolate the filter switch by bringing down the entire LAG interface rather than delivering unreliable data to tools and devices.
Two additional commands are part of the DANZ Monitoring Fabric (DMF) lag-interface configuration to aid in managing the LAG interface when a specified number of links go down. These commands are:
minimum-link
activate
minimum-link
The minimum-link command configures the minimum number of links that must be up for a functional LAG. If the total number of active links in the interface-group is less than the configured minimum threshold, DMF brings down all active links belonging to the interface group.
The minimum-link command is optional, with a default value of 0. You should ensure this value is reasonable. If the value exceeds the total member links, the LAG will always be down.
activate
You must use the activate command to manually try to bring up the LAG if it was shut down because the number of active links was below the minimum link.
Note: If you make any changes to fix the downed LAG members and subsequently use the activate command to re-enable the LAG, it will go back down if the active members are still less than the minimum links value.
Configuration
The minimum-link and activate commands are available within a switch's lag-interface submode. The following example illustrates configuring these options:
Use the CLI to enter the switch's submode.
Enter the lag interface submode by using the lag-interface command.
Use the minimum-link command to configure the minimum threshold value needed before bringing down a LAG.
Use the activate command to bring back up the previously shutdown LAG (due to having fewer active member links than the minimum threshold).
While in the switch and lag-interface submodes, the show running-config and show
this commands list the configured minimum-link threshold value. However, since activate is an action command rather than a configuration value, it doesn't appear when running the show commands.
dmf-controller-1# show running-config switch core1 lag lag1
! switch
switch core1
!
lag-interface lag1
member a
member b
member c
member d
minimum-link 2
Troubleshooting
If a LAG always shows down, ensure the minimum-link value is not greater than the total number of member links in that LAG.
Limitations
The system doesn’t provide any warning when the minimum-link value exceeds the total number of member links in that LAG.
Tunnel Endpoint for vCenter Integration
This feature supports using Link Aggregation Group (LAG) in the tunnel endpoint configuration and runs on DANZ Monitoring Fabric (DMF) compatible switches supporting LAGs. Refer to the DMF 8.6 Hardware Compatibility Guide to view the list of compatible switches.
Configuration
Add the configured LAG as an interface in the tunnel endpoint configuration, as shown in the following example.
Do not use LAG members as a Tunnel endpoint interface.
Do not configure multiple gateways for the same interface used in Tunnel endpoints.
Do not use a LAG configured as management or DMF interface (filter or delivery) in the Tunnel endpoint configuration.
L2 GRE Key Hashing
L2 GRE Key-based hashing is supported only for the IPv4-based packets with L2 GRE payload. This feature does NOT support the IPv6 packets with L2 GRE payloads.
Enable the L2 GRE Key hashing by setting the l2-gre-key parameter, as shown in the following example.
Controller-Active# show running-config switch DMF-SWITCH-1
! switch
switch DMF-SWITCH-1
mac c0:d6:82:17:fd:5a
!
lag-enhanced-hash
hash ipv4 l2-gre-key
hash symmetric disable
Use the CLI commands to verify settings and troubleshoot any issues that may arise.
# show lag-enhanced-hash
While logged into a switch, use the following commands to troubleshoot this feature.
Note: The L2GRE_KEY offset is the same as the SRCL4 and DSTL4 offset in hardware. Hence, the hardware requires setting SRCL4 and DSTL4 hash fields and the L2GRE_KEY hash field to hash the packets using the L2GRE_KEY.
VXLAN Hashing
VXLAN hashing enables hashing on a VXLAN payload, including hashing on the Inner L3 Source IP, Inner L3 Destination IP, Inner L2 Source MAC, and inner L2 Destination MAC. This only applies to terminated cases.
Symmetric hashing works with VXLAN packet Inner L3 Source IP/Destination IP, Inner L4 Source Port/Destination Port, and Outer L3 Source IP/Destination IP.
Note: VXLAN hashing applies to switches running SWL OS.
VXLAN hashing includes hashing on L2 and L3 and the setting of at least one parameter enabled under the switch construct on Controller CLI:
The following information addresses Virtual Extensible LAN (VXLAN) hashing capabilities and behavior, specifically on the DCS-7280 platforms.
Platform Compatibility
There are two use cases:
Decapsulation – Strips the VXLAN header.
Transit – Retains the VXLAN header.
Since VXLAN Header Stripping is only supported on DCS-7280R3 platforms, the Decapsulation use case is supported only on these platforms.
The Transit use case is supported on all DCS-7280 platforms.
Configuration
There are two assumptions:
The VXLAN packet is IPv4 (outer).
The VXLAN packet has a UDP destination port value matching the configured value (default – 4789).
For the decapsulation use case, the packet context is advanced to the start of the payload upon VXLAN parsing on ingress. Hence, you can configure normal (outer) hash fields to hash against the VXLAN payload (inner) as if the outer encapsulation has already been discarded.
Traffic is hashed based on the outer header for the transit use case, just like any non-VXLAN UDP packet. Arista advises configuring L4-src-port hashing to hash against the UDP source port of the VXLAN packet, typically used as an entropy of its payload.
Only IPv4 VXLAN tunnel header stripping is supported.
Currently, it is not possible to limit VXLAN packet parsing to selected interfaces on a given switch. Configuring strip-vxlan on any switch interface will trigger VXLAN packet parsing to be active globally on the switch. In this situation, the packet context of any ingressed VXLAN packet would be advanced to the start of its payload. As a result, policy matching and hashing behaviors will be generally affected for VXLAN packets on this switch, even for packets not subject to strip-vxlan.
MLAG RTAG7 Hash Computation for Unbalanced Load Balancing
In DANZ Monitoring Fabric (DMF), all SWL OS switches with the same underlying ASIC have the same RTAG7 hash parameters configured by default. After configuring MLAG to load balance traffic from filter to delivery switches, and when the number of interfaces in the MLAG and LAG in the delivery switch is the same, the traffic will not be load balanced in the delivery switch because of hash polarization.
Use the feature to avoid LAG hash polarization by choosing different hash algorithms in separate switches. The other option is using a different packet field set in each switch.
The feature supports using different hash algorithms by choosing different hash seed values.
Note: MLAG RTAG7 hash computation for unbalanced load balancing only applies to switches running SWL OS, does not apply to switches running EOS and is only supported on select Broadcom® switch ASICs that run SWL OS.
CLI Configuration
Configure the feature on each switch using the following CLI commands:
Use the following show command to view the configured hash seed.
R450-C1# show lag-enhanced-hash switch S4048T
~~~~~~~~~~~~~~~~~~~~~~~~~ L2 Enhanced Hash ~~~~~~~~~~~~~~~~~~~~~~~~~
# Switch DPID Dst mac Eth type Src mac Vlan id Seed1 Seed2 Symmetric
-|-----------|-------|--------|-------|-------|-----|-----|---------|
1 S4048T True True True True 1234 3456 True
Note: The earlier CLI example illustrates an L2 configuration.
Troubleshooting a Configured Hash Seed
Use the following procedure to ensure the configured hash seed is correctly applied on the switch.
Log in to the switch using the connect switch
switch_name command.
Use the ofad-ctl gt PORT_CHANNEL_ENHANCED_HASH_SEED command to print the seed values and the hash algorithm.
Ensure the hash algorithms differ in the switches where hash polarization occurs.
Configure the hash seeds such that the hash algorithms are different.
Example
R450-C1(config)# connect switch A-7050SX3-48YC8
Switch Light OS SWL-OS-DMF-8.6.x(0), 2023-12-07.09:17-42d8658
Linux A-7050SX3-48YC8 4.19.296-OpenNetworkLinux #1 SMP Thu Dec 7 09:28:30 UTC 2023 x86_64
Switch Light ZTN Manual Configuration. Type help or ? to list commands.
(ztn-config) debug bash
***************************** WARNING ******************************
Any/All activities within bash mode are UNSUPPORTED
This is intended ONLY for additional debugging ONLY by Arista TAC.
Please type "exit" or Ctrl-D to return to the CLI
***************************** WARNING ******************************
root@A-7050SX3-48YC8:~# ofad-ctl gt PORT_CHANNEL_ENHANCED_HASH_SEED
GENTABLE : port_channel_enhanced_hash_seed
GENTABLE ID : 0x0006
hash_seed_valid: true
HASH_SEED1=0x000004d2
HASH_SEED2=0x000004d2
computed hash algorithm from seed: CRC32LO
root@A-7050SX3-48YC8:~#
Configuring an MLAG
To configure an MLAG, use the following steps:
Configure an MLAG domain by specifying an alias, and add peer switches that will be participating in the MLAG.
Controller-1(config-mlag-domain)# mlag-interface MLAG-Core-Intf
Controller-1(config-mlag-domain-if)# member switch DeliverySwitch-1 interface ethernet50
Controller-1(config-mlag-domain-if)# member switch DeliverySwitch-2 interface ethernet50
The above MLAG interface configuration selects one physical interface from each peer switch added into the MLAG domain. This MLAG interface is fabric-facing, which means that ethernet50 of DeliverySwitch-1 and ethernet50 of DeliverySwitch-2 are connected to the DMF core switch, where traffic hashing is performed.
Configure the core LAG interface, a LAG interface on the core switch. The members of the LAG interface are connected to the peer switches in the MLAG domain. This configuration ensures that the traffic will be hashed toward the two connected delivery switches.
Controller-1(config)# switch CoreSwitch-1
Controller-1(config-switch)# lag-interface Core-LAG
Controller-1(config-switch-lag-if)# member ethernet10
Controller-1(config-switch-lag-if)# member ethernet20
Configure the delivery MLAG interface by specifying an interface alias and selecting one member from each delivery switch.
Controller-1(config-mlag-domain-if)# mlag-interface MLAG-Del-Intf
Controller-1(config-mlag-domain-if)# member switch DeliverySwitch-1 interface ethernet1
Controller-1(config-mlag-domain-if)# member switch DeliverySwitch-2 interface ethernet1
Controller-1(config-mlag-domain-if)# role delivery interface-name MLAG-Tool-1
The above MLAG interface configuration selects one physical interface from each peer switch added into the MLAG domain. The members of this MLAG interface, ethernet1 of DeliverySwitch-1 and ethernet1 of DeliverySwitch-2, are connected to multi-homed tools. Note that unlike the core MLAG interface, the delivery MLAG interface is assigned the delivery role and its interface name is configured, so that it can be used in DMF policies as a delivery interface.
Configure a DMF policy by following the procedure shown below:
Controller-1(config)# policy Policy-1
Controller-1(config-policy)# action forward
Controller-1(config-policy)# 1 match any
Controller-1(config-policy)# filter-interface Filter-1
Controller-1(config-policy)# delivery-interface MLAG-Tool-1
The above policy is configured using the MLAG-Tool-1 interface configured in Step 4. Configuring the policy to use an MLAG delivery interface will result in two dynamic policies, one for each peer switch. Refer to the following topology for the policy breakdown.
Figure 31. MLAG Policy Breakdown
As seen in the topology above:
The user-configured policy delivers traffic from the filter switch to the core switch LAG interface.
Dynamic Policy 1 delivers traffic to delivery switch 1.
Dynamic Policy 2 delivers traffic to delivery switch 2.
The following output displays the three policies as configured on the DMF controller:
Below are the details for each policy:
Policy: Policy-1 Interfaces
Filter Interface(s) section lists the filter interface configured for the policy, Policy-1.
Core Interface(s) section lists the interfaces that connect the filter switch and the core switch selected for the policy.
MLAG Core Interface(s) section displays the core LAG interface that hashes the traffic towards the peer switches.
MLAG Delivery Interface(s) section lists the delivery MLAG interface members.
Filter Interfaces(s) section lists the dynamically configured interface name on DeliverySwitch2 to which the core switch is connected.
MLAG Delivery Interface(s) section lists the delivery MLAG interface member on DeliverySwitch2.
MLAG Link Discovery
Link Layer Discovery Protocol (LLDP) is used to discover MLAG links. When the DMF Controller receives an LLDP message, it looks for the switch and interface names. If the switch is a part of an MLAG domain, and the reported interface corresponds to the MLAG interface, then it is classified as an MLAG link.
Controller-1(config)# show link all link-type mlag-member
~~~~~~~~~~~~~~~~~~~~~~~~~~~~~~~~~~~~~~~~~~~~~~~~~~~~ Links ~~~~~~~~~~~~~~~~~~~~~~~~~~~~~~~~~~~~~~~~~~~~~~~~~~~~
# Active State Src switch Src IF Name Dst switch Dst IF Name Link Type Since
-|------------|-----------------|-----------|-----------------|-----------|-----------|-----------------------|
1 active CoreSwitch-1 ethernet10 DeliverySwitch-1 ethernet50 mlag-member 2022-11-11 21:54:28 UTC
2 active CoreSwitch-1 ethernet20 DeliverySwitch-2 ethernet50 mlag-member 2022-11-11 21:54:28 UTC
3 active DeliverySwitch-1 ethernet50 CoreSwitch-1 ethernet10 mlag-member 2022-11-11 21:54:28 UTC
4 active DeliverySwitch-2 ethernet50 CoreSwitch-1 ethernet20 mlag-member 2022-11-11 21:54:13 UTC
Controller-1(config)#
Overlapping Policies in LAGs
An overlapping policy is dynamically configured if two configured policies share at least one filter interface and at least one of the delivery interfaces is different.
When two DMF policies are configured to use an MLAG interface as a delivery interface overlap, the following policies are created:
Policy-1 uses the filter interface Filter-1 and the delivery interface MLAG-Tool-1.
Policy-2 uses the filter interface Filter-1 and the delivery interface MLAG-Tool-2.
The above two policies will result in an overlapping policy. An overlapping policy will be configured following the naming convention _Policy-1_o_Policy-2.
After calculating the overlapping policy for the two user-configured policies, DMF configures two dynamic policies: one for each peer switch in the MLAG domain and one for each of the three policies listed above.
Table 1. Dynamic Policies
MLAG Dynamic Policy
Parent Policy
Delivery Switch/Peer switch
_mlag_Policy-1_DeliverySwitch-1
Policy-1
DeliverySwitch-1
_mlag_Policy-1_DeliverySwitch-2
Policy-1
DeliverySwitch-2
_mlag_Policy-2_DeliverySwitch-1
Policy-2
DeliverySwitch-1
_mlag_Policy-2_DeliverySwitch-2
Policy-2
DeliverySwitch-2
_mlag Policy-1_o_Policy-2_DeliverySwitch-1
_Policy-1_o_Policy-2
DeliverySwitch-1
_mlag Policy-1_o_Policy-2_DeliverySwitch-2
_Policy-1_o_Policy-2
DeliverySwitch-2
The following policies, Policy-1 and Policy-2, share the same filter interface, Filter-1, but are configured to use different delivery interfaces, MLAG-Tool-1 and MLAG-Tool-2. No priority is configured; these policies use the same default priority.
Policy-1 Configuration
policy Policy-1
action forward
delivery-interface MLAG-Tool-1
filter-interface Filter-1
1 match ip src-ip 200.200.0.0 255.255.255.0
Policy-2 Configuration
policy Policy-2
action forward
delivery-interface MLAG-Tool-2
filter-interface Filter-1
1 match ip dst-ip 100.100.0.0 255.255.255.0
The above two policies will result in an overlapping policy.
Controller-1(config)# show policy
# Policy Name Action Runtime Status Type Priority Overlap Priy Push VLAN Filter BW Delivery BW Post Match Filt Traff Del Traffic Services
-|----------------------|-------|--------------|----------|--------|------------|---------|---------|-----------|----------------------|----------|--------|
1 Policy-1 forward installed Configured 100 0 1 25Gbps 80Gbps 314Mbps 315Mbps
2 Policy-2 forward installed Configured 100 0 3 25Gbps 80Gbps 314Mbps 315Mbps
3 _Policy-1_o_Policy-2 forward installed Dynamic 100 1 5 25Gbps 80Gbps 314Mbps 315Mbps
Policy-1: User-configured policy to forward packets matching source IP 200.200.0.0/24 to MLAG-Tool-1.
Policy-2: User-configured policy to forward packets matching destination IP 100.100.0.0/24 to MLAG-Tool-2.
_Policy-1_o_Policy-2: A dynamically configured overlapping policy with higher Overlap Priority to ensure that if a packet matches rules from both the policies (source IP of 200.200.0.1 and destination IP of 100.100.0.1), it forwards to both MLAG-Tool-1 and MLAG-Tool-2.
The following are the dynamic policies configured for each delivery switch in the MLAG Domain.
Policy-1 Dynamic Policies
_mlag_Policy-1_DeliverySwitch-1: MLAG dynamic policy for Policy-1 for DeliverySwitch-1.
_mlag_Policy-1_DeliverySwitch-2: MLAG dynamic policy for Policy-1 for DeliverySwitch-2.
Policy-2 Dynamic Policies
_mlag_Policy-2_DeliverySwitch-1: MLAG dynamic policy for Policy-2 for DeliverySwitch-1.
_mlag_Policy-2_DeliverySwitch-2: MLAG dynamic policy for Policy-2 for DeliverySwitch-2.
_Policy-1_o_Policy-2 Dynamic Policies
The following policies have higher Overlap Priority than the rest to prioritize the overlapping traffic forwarded to DeliverySwitch-1 and DeliverySwitch-2.
_mlag Policy-1_o_Policy-2_DeliverySwitch-1: MLAG dynamic policy for overlapping policy for DeliverySwitch-1.
_mlag Policy-1_o_Policy-2_DeliverySwitch-2: MLAG dynamic policy for overlapping policy for DeliverySwitch-2.
Using LAG Interfaces as Members in MLAG Interfaces
MLAG interface members can be physical interfaces or LAG interfaces to increase bandwidth. To add a LAG member to an MLAG interface, use the following procedure:
Configure the LAG interface on Peer Switch 1.
Controller-1(config)# switch DeliverySwitch-1
Controller-1(config-switch)# lag-interface LAG-peer-switch-1
Controller-1(config-switch-lag-if)# member ethernet11
Controller-1(config-switch-lag-if)# member ethernet12
Configure the LAG interface on Peer Switch 2.
Controller-1(config)# switch DeliverySwitch-2
Controller-1(config-switch)# lag-interface LAG-peer-switch-2
Controller-1(config-switch-lag-if)# member ethernet11
Controller-1(config-switch-lag-if)# member ethernet12
Add the configured LAG interfaces as members into the MLAG interface.
Controller-1(config)# mlag-domain Domain1
Controller-1(config-mlag-domain)# mlag-interface MLAG-LAG-Del-Intf
Controller-1(config-mlag-domain-if)# member switch DeliverySwitch-1 interface LAG-peer-switch-1
Controller-1(config-mlag-domain-if)# member switch DeliverySwitch-2 interface LAG-peer-switch-2
Controller-1(config-mlag-domain-if)# role delivery interface-name MLAG-LAG-Tool-1
Configure the DMF policy using the delivery interface MLAG-LAG-Tool-1.
Controller-1(config)# policy Policy-1
Controller-1(config-policy)# action forward
Controller-1(config-policy)# 1 match any
Controller-1(config-policy)# filter-interface Filter-1
Controller-1(config-policy)# delivery-interface MLAG-LAG-Tool-1
Note: Traffic will not hash toward tools if the core switch LAG has the same number of member interfaces as the LAG on the peer switches of MLAG delivery.
Workaround:
Ensure that the hash fields on the core switch and MLAG peer switches are different or:
Ensure that the number of member interfaces in the LAG interface configured on the core switch differs from the number of members in the LAG interface configured on peer switches.
Round-Robin LAG Distribution
Link Aggregation Group (LAG) or port channel interfaces comprise multiple member interfaces. Network devices typically distribute packets across the member interfaces using a hash computed from packet header fields. The Round-Robin LAG Distribution feature introduces a new packet distribution method: round-robin. A round-robin LAG configuration balances packets evenly across all member interfaces in a sequential, round-robin fashion.
The following platforms support the Round-Robin LAG Distribution feature: Arista 7050X3, 7260X3, and Dell switches running SWL OS.
Configuration
The system supports packet distribution modes of either round-robin or hash-based (default) on a per-switch and per-LAG-interface basis. Explicit per-LAG-interface configuration overrides any per-switch configuration.
To set the distribution mode for a switch, navigate to the switch submode. The distribution-mode command provides two options: hash-based and round-robin.
dmf-controller-1(config)# switch core1
dmf-controller-1(config-switch)# distribution-mode
hash-based Use hash-based distribution across LAG members
round-robin Use round-robin distribution across LAG members
To unset the distribution mode:
dmf-controller-1(config)# switch core1
dmf-controller-1(config-switch)# no distribution-mode
To set the distribution mode for a LAG interface:
dmf-controller-1(config)# switch core1
dmf-controller-1(config-switch) lag-interface lag1
dmf-controller-1(config-switch-lag-if)# distribution-mode
hash-based Use hash-based distribution across LAG members
round-robin Use round-robin distribution across LAG members
To unset the distribution mode:
dmf-controller-1(config)# switch core1
dmf-controller-1(config-switch) lag-interface lag1
dmf-controller-1(config-switch-lag-if)# no distribution-mode
Show Commands
Not all switches support round-robin packet distribution. The configuration of at least one LAG interface on the switch must occur before the system generates a fabric error. The application of round-robin distribution to a LAG interface on a non-supporting switch triggers a specific fabric warning in the CLI output; the following example illustrates the error:
dmf-controller-1> show fabric errors
~~~~~~~~~~~~~~~~~~~~~~~~~~~~~~~ Lag config not supported ~~~~~~~~~~~~~~~~~~~~~~~~~~~~~~~
# Switch Unsupported Config
-|-------------------------------|------------------------------------------------------|
1 core1 (00:00:52:54:00:7b:b3:9f) Round robin hash mode is configured but not supported.
Troubleshooting
The show switch all table contents lag command displays the distribution mode the Controller programs to the switches in the fabric.
dmf-controller-1> show switch all table contents lag
~~~~~~~~~~~~~~~~~~~~~~~~~~~~~~~~~~~~~~~~~~~~~~~~~~~~ Lags ~~~~~~~~~~~~~~~~~~~~~~~~~~~~~~~~~~~~~~~~~~~~~~~~~~~~
# Lag Device name Entry key Entry value
--|---|-----------------|---------|---------------------------------------------------------------------------|
1 0 CORE-SWITCH-1 Port(256) Name(LAG1), HashType(BSN_HASH_TYPE_ENHANCED), Port(1), Port(2)
2 1 CORE-SWITCH-1 Port(258) Name(LAG2), HashType(BSN_HASH_TYPE_ROUND_ROBIN), Port(3), Port(4)
Limitations
Changing the packet distribution mode of a LAG interface between hash-based and round-robin causes a brief traffic loss.
A policy utilizing a round-robin LAG occasionally delivers production flow packets to the tools out of order. Round-robin distribution inherently results in out-of-order delivery. When packet ordering within a flow remains critical, the policy path from the filter to delivery interfaces must exclude round-robin LAGs.
Certain DMF managed services require the hashing of flows to a single Service Node interface for proper functioning. Round-robin distribution generally conflicts with the requirements of the policy path or the managed service interface for services such as IPFIX, deduplication, TCP analysis, session slicing, and flow-diff. Service actions requiring either packet delivery in the original filter interface order or flow hashing to a specific Service Node interface must not utilize round-robin at or upstream of the managed service.
For a single policy flow any switch on the Policy Path can support redirection to only one round-robin LAG / Interface. The addition of multiple delivery interfaces or LAGs to a policy disables round-robin hashing, in such cases every LAG on the Switch performs hash-based distribution. A policy delivering traffic to multiple round-robin LAGs / Interface on a single delivery, core, or filter switch triggers the round-robin limitation.
This chapter describes configuring the DANZ Monitoring Fabric (DMF) Recorder Node (RN) to record packets from DMF filter interfaces. For related information, refer to the following:
The DANZ Monitoring Fabric (DMF) Recorder Node (RN) integrates with the DMF for single-pane-of-glass monitoring. A single DMF Controller can manage multiple RNs, delivering packets for recording through Out-of-Band policies. The DMF Controller also provides central APIs for packet queries across one or multiple RNs and for viewing errors, warnings, statistics, and the status of connected RNs.
A DMF out-of-band policy directs matching packets for recording to one or more RNs. An RN interface identifies the switch and port used to attach the RN to the fabric. A DMF policy treats these as delivery interfaces and adds them to the policy so that flows matching the policy are delivered to the specified RN interfaces.
Configuration Summary
At a high level, perform the following steps to configure the Recorder Node (RN).
The Recorder Node (RN) indexing configuration defines the fields used to query packets on the RN. By default, DMF enables all indexing fields in the indexing configuration. Selectively disable the specific indexing fields not required in RN queries.
Disabling indexing fields has two advantages. First, it reduces the index space required for each packet recorded. Second, it improves query performance by reducing unnecessary overhead. Arista recommends disabling unnecessary indexing fields.
The RN supports the following indexing fields:
MAC Source
MAC Destination
VLAN 1: Outer VLAN ID
VLAN 2: Inner/Middle VLAN ID
VLAN 3: Innermost VLAN ID
IPv4 Source
IPv4 Destination
IPv6 Source
IPv6 Destination
IP protocol
Port Source
Port Destination
MPLS
Community ID
MetaWatch Device ID
MetaWatch Port ID
Note: Enable the Outer VLAN ID indexing field to query the RN using a DANZ Monitoring Fabric (DMF) policy name or a DMF filter interface name.
To understand leveraging an indexing configuration, consider the following examples:
Example 1: To query packets based on applications defined by unique transport ports, disable all indexing fields except source and destination transport ports, saving only transport ports as metadata for each packet recorded. This technique greatly reduces per-packet index space consumption and increases RN query speed.
However, this will impact an effective query on any other indexing field because that metadata was not saved when the packets were recorded.
Example 2: The RN supports community ID indexing, a hash of IP addresses, IP protocol, and transport ports that identify a flow of interest. Suppose the RN use case is to query based on community ID. In that case, indexing on IPv4 source and destination addresses, IPv6 source and destination addresses, IP protocol, and transport port source and destination addresses might be redundant.
Pre-buffer Configuration and Events
The Recorder Node (RN) pre-buffer is a circular buffer recording received packets. When enabled, the pre-buffer feature allows for the retention of the packets received by the RN for a specified length of time prior to an event that triggers the recording of buffered and future packets to disk. Without an event, the RN will record into this buffer, deleting the oldest packets when the buffer reaches capacity.
When an RN event is triggered, DMF saves packets in the pre-buffer to disk. The packets received from the time of the event trigger to the time of the event termination are saved directly to disk upon termination of the event. However, the received packets are also retained in the pre-buffer until the next event is triggered. By default, the pre-buffer feature is disabled, indicated by a value of zero minutes.
For example, when configuring the pre-buffer to thirty minutes, the buffer will receive up to thirty minutes of packets. When triggering an event, DMF records the packets currently in the buffer to disk, and packets newly received by the RN bypass the buffer and are written directly to disk until the termination of the event. When terminating the event, the pre-buffer resets, accumulating received packets for up to the defined thirty-minute pre-buffer size.
The packets affiliated with an event can be queried, replayed, or analyzed using any RN query. Each triggered event is identified by a unique, user-supplied name, used in the query to reference packets recorded in the pre-buffer before and during the event.
Using an Authentication Token
When using a DANZ Monitoring Fabric (DMF) Controller authentication token, the Recorder Node (RN) treats the DMF Controller as an ordinary client, requiring it to present valid credentials either in the form of an HTTP basic username and password or an authentication token.
Static authentication tokens are pushed to each RN as an alternative form of authentication in headless mode when the DMF Controller is unreachable or by third-party applications that do not have or do not need Controller credentials.
Recorder Node User Interface
Overview
DANZ Monitoring Fabric (DMF) 8.7.0 introduces a redesigned Recorder Node (RN) UI with an improved configuration workflow, monitoring page, and query features.
There are several functions used in the DMF Recorder Node that are used throughout the user interface (UI).
These include:
Table 1. Common Features and Functions
Search and Filtering
Cancel
Column Sorting
Ascending or Descending
Window Controls
Move, Minimize, Expand, Close
Refresh Data Immediately
Information
Create Policy
Edit
Collapse Extra Settings
Delete
Show Extra Settings
Error Condition
Create
Warning Condition
Unit Display
Bit Rate
Packet Rate
Utilization
Expand Window
Export Data
Show or Hide Columns
Save
Settings or Configuration
Recorder Node Dashboard Layout
Active Queries: Expand the Active Queries widget to view ongoing queries.
Figure 1. Active Queries
Note:Active Queries fetch queries periodically; if a query completes quickly, the query may not appear in the widget.
Top Policy Utilization: The chart displays up to 5 top policies associating the Recorder Node interfaces with their respective bit rates.
Figure 2. Top Policy Utilization
Alerts: The Alerts widget displays Recorder Node warnings or errors. Any errors appear in the Alerts drop-down in the menu bar.
Figure 3. Alert Messages
Figure 4. Fabric Health Status
Top Filter Interfaces: Top Filter Interfaces displays the Top Filter Interfaces (up to five) attached to a policy with associated Recorder Node interfaces. Select the Unit drop-down to update the data with the selected unit type. The selection persists until changed. Hovering over a bar displays the throughput for the interface.
Figure 5. Top Filter Interfaces
Figure 6. Top Filter Interfaces - Units
Top Recorder Node Interfaces: Top Recorder Node Interfacesdisplays the Top Recorder Node Interfaces (up to five) attached to a policy with associated Recorder Node interfaces. Select the Unit drop-down to update the data with the selected unit type. The selection persists until changed. Hovering over a bar displays the throughput for the interface.
Figure 7. Top Recorder Node Interfaces
Inventory Table:
The Inventory Table is located in the lower section of the Recorder Nodes dashboard and displays all Recorder Node instances configured on the DMF Fabric. Selecting RN Interfaces displays all Recorder Node Interfaces configured in DMF.
Note: Even if a Recorder Node Interface is not configured, but the fabric detects a Recorder Node, it will show a partial entry in the Recorder Node Interfaces table.
Figure 8. Inventory - Recorder Nodes
Figure 9. Inventory - Recorder Node Interfaces
Select Edit to modify the Edit Recorder Node Interface or Edit Recorder Node configuration.
Figure 10. Edit Recorder Node Interface
Figure 11. Edit Recorder Node
Show / Hide Columns determine the information displayed in the dashboard and are user-selectable. Selections persist until changed.
Note: The Name column cannot be hidden.
Figure 12. Show / Hide Columns
Onboard a Recorder Node
To configure a Recorder Node (RN) or update the configuration of an existing RN, perform the following steps:
Select Monitoring > Recorder Nodes from the main menu bar of the DANZ Monitoring Fabric (DMF) GUI.
Figure 13. Recorder Nodes
To add a new RN, select the Add Recorder Node (Recorder Nodes tab active) in the Inventory section.
Figure 14. Provision Recorder Node
Enter the following information in the required fields:
Assign a name to the RN.
Set the MAC Address of the RN. Obtain the MAC address from the chassis ID of the connected device, using the Fabric > Connected Devices.
Figure 15. Connected Devices
Configure the following options as needed:
Recording: Recording is enabled by default. To disable recording on the RN, move the Recording toggle switch to Off. When recording is enabled, the RN records the matching traffic directed from the filter interface defined in a DMF policy.
Disk Full Policy: The default packet removal policy is Continuous operating as FIFO (First In First Out), which means the oldest packets are deleted to make room for newer packets. This occurs only when the RN disks are full. The alternative removal policy is Stop, which causes the RN to stop recording when the disks are full and wait until disk space becomes available. Disk space can be made available by leveraging the RN delete operation to remove all or selected time ranges of recorded packets.
Backup Disk Policy: Specify the disk backup policy to as desired. Select from one of the three following options:
No Backup: This is the default option and is also the recommended option when no extra disk is available.
Remote Extend: In this option, recording is performed on the local disks. When full, the recording continues on a remote Isilon cluster mounted over NFS. In this mode, the remote disks are called backup disks. With regard to the Disk Full Policy, if set to:
Stop: Recording stops when both local and remote disks become full.
Continuous: When the configured threshold is reached, the oldest files from both disks are removed until the disk usage returns below the threshold number.
Local Fallback: In this option, recording is performed on a remote Isilon cluster mounted over NFS. If the connection between the Recorder Node and the remote cluster fails, the recording is performed on the local disks until the failure is resolved. In this mode, the local disks are called backup disks. With regard to the Disk Full Policy, if set to:
Stop: Recording stops when the remote disks become full.
Continuous: When the configured threshold is reached, the oldest files from both disks are removed until the disk usage returns below the threshold number.
Note: A connection failure should not occur due to a misconfiguration of the NFS server on the DMF Controller. In such cases, the recording stops until the Controller’s configuration is fixed.
Max Packet Age: Change the Max Packet Age to set the maximum number of minutes that recorded packets are kept on the RN. Packets recorded are discarded after the specified number of minutes. This defines the maximum age in minutes of any packet in the RN. It can be used in combination with the Disk Full Policy to control when packets are deleted based on age rather than disk utilization alone. When unset, Max Packet Age is not enforced.
Incident Look Ahead Buffer: Assign the number of minutes the RN pre-buffer allows for windowed retention of packets received by the RN for a specified length of time. By default, the Incident Look Ahead Buffer is set to zero minutes (disabled). With a nonzero Incident Look Ahead Buffer setting and triggering a recorder event, any packets in the pre-buffer are saved to disk, and any packets received by the recorder after the trigger are saved directly to disk. When terminating an ongoing recorder event, a new pre-buffer is established in preparation for the next event.
Max Disk Utilization: Specify the maximum utilization allowed on the index and packet disks. The Disk Full Policy is enforced at this limit. If left unset, then the disks space are used to capacity.
Parse MetaWatch Trailer: Determine the parsing of the MetaWatch trailer.
Off: When set to Off, the RN will not parse the MetaWatch trailer, even if it is present in incoming packets.
Auto: When set to Auto, the RN will look for a valid timestamp in the last 12 bytes of the packet. If it matches the system timestamp closely enough, the trailer is parsed by the RN.
Always: When set to Always, RN will assume the last 12 bytes of packet is a MetaWatch trailer and parse it, even if it did not find a valid timestamp.
Indexing: All the indexing options are enabled by default. To disable any of the indexing behaviors, select Indexing and deselect from the list, as required. These include:
Configure network and storage settings selecting Network & Storage Config.
In order to store packets on external storage using an NFS mount, connect the Recorder Node's (RN) auxiliary interface to the same network and subnet where the NFS storage resides, as displayed in the figure below.
Figure 16. Topology to Use External Storage
Note: Create the volume for the index and packet on the NFS storage first. Refer to the vendor-specific NFS storage documentation about creating the volume (or path).
Figure 17. Network & Storage Settings
Auxiliary NIC Configuration: Move the toggle switch to On.
Enter the IP Address and Mask. These are required fields.
Figure 18. Auxiliary NIC Configuration
Index Disk Configuration: Move the toggle switch to On.
Enter the NFS Server as an IP address or hostname. For external NFS storage, such as Isilon, connect the auxiliary interface of the RN to a network and subnet that is reachable to Isilon NFS storage. When recording to an Isilon cluster over NFS with SmartConnect, the name of the storage pool can be specified. SmartConnect requires this name be registered as an A record pointing to the SmartConnect VIP in the DNS server used by the recorder node. The recorder will establish many mount points to the provided volume name in this storage pool. Each mount point will resolve to a different node in the storage pool, allowing the recorder to distribute recorded packets and metadata across multiple nodes in parallel.
Enter the Volume: Specify the storage location or path on the NFS server for the Index Disk.
Enter the Transport Port of NFS Service details. DMF uses the default value (2049) if no value is specified. Specify a value if the NFS storage has been configured to use something other than the default value.
Figure 19. Index Disk Configuration
Packet Disk Configuration: Move the toggle switch to On.
Enter the NFS Server as an IP address or hostname. For external NFS storage, such as Isilon, connect the auxiliary interface of the RN to a network and subnet that is reachable to Isilon NFS storage. When recording to an Isilon cluster over NFS with SmartConnect, the name of the storage pool can be specified. SmartConnect requires this name be registered as an A record pointing to the SmartConnect VIP in the DNS server used by the recorder node. The recorder will establish many mount points to the provided volume name in this storage pool. Each mount point will resolve to a different node in the storage pool, allowing the recorder to distribute recorded packets and metadata across multiple nodes in parallel.
Enter the Volume: Specify the storage location or path on the NFS server for the Packet Disk.
Enter the Transport Port of NFS Service details. DMF uses the default value (2049) if no value is specified. Specify a value if the NFS storage has been configured to use something other than the default value.
Figure 20. Packet Disk Configuration
Select Add Recorder Node to save and close the configuration page.
Figure 21. Provision Recorder Node-Indexing
Note:When editing the configuration of a previously added RN to use external storage versus local storage or vice versa, reboot the RN.
To record packets to a recorder node using a DANZ Monitoring Fabric (DMF) policy, configure a DMF Recorder Node (RN) interface that defines the switch and interface in the monitoring fabric where the RN is connected. The DMF RN interface is referenced by name in the DMF policy as the destination for traffic matched by the policy. To configure a DMF RN interface, perform the following steps:
To add a new RN interface, select the RN Interfaces tab in the Inventory section.
Figure 22. Create DMF Recorder Node Interface
Select Create RN Interface.
Figure 23. Create Recorder Node Interface
Enter or select the following parameters:
Recorder Node Interface Name: Assign a name to the interface.
Switch Name: Select a switch from the drop-down list containing the interface connecting the RN to the monitoring fabric.
Interface Name: Select an interface from the drop-down list connecting the RN to the monitoring fabric.
Description: (optional) Enter a description of the RN interface.
Select Create RN Interface to add the configuration to the DMF Controller.
Edit a Recorder Node Interface
To edit a DMF RN interface, perform the following steps:
Select the RN Interfaces tab in the Inventory section.
Figure 24. Create DMF Recorder Node Interface
Select an interface from the Inventory list and use the Edit icon.
Figure 25. Create Recorder Node Interface
Edit the following parameters:
Switch Name: Select a switch from the drop-down list containing the interface connecting the RN to the monitoring fabric.
Interface Name: Select an interface from the drop-down list connecting the RN to the monitoring fabric.
Description: (optional) Edit the description of the RN interface.
Select Edit RN Interface to modify and update the interface configuration.
To delete an interface, use the Delete icon and Confirm.
Figure 26. Confirm Delete
Recorder Node Details
The Recorder Node Detail page displays specific information about the Recorder Node.
In the Inventory window (Recorder Nodes tab active), select the Recorder Node Name to navigate to the details page.
Figure 27. Recorder Nodes Details
The upper dashboard displays a brief summary of the status of the Recorder Node. A Recorder Nodes link returns to the Recorder Nodes dashboard and a drop-down speed navigation to other RN instances.
Figure 28. Brief Summary
The middle dashboard displays any active Alerts on the selected Recorder Node and Storage details:
Figure 29. Alerts and Storage
Storage
Disk Index
Backup Disk Index
Disk Packet
Backup Disk Packet
Index Mount
Volume, Mount, File System, and Health
Packet Mount
Volume, Mount, File System, and Health
Virtual Disk Health
Name, Size, State, Block Health, and Raid Level
Use the + icon to obtain granular information on the Virtual Disk Packet and Index health.
Slot #, Device ID, Type, Size, State, Temp, Predicted Failure Count, Media Error Count, and Other Error Count.
Figure 30. Virtual Disk Health Details
The lower dashboard displays live graphs of the Recorder Node Ingress Rate, Recording Errors, and Packet Capture Frame Count, and Events.
Figure 31. Recorder Node Rates, Errors and Counts.
Hovering over the graph displays Timestamps and Ingress Rate.
Figure 32. Timestamps and Ingress Rate
Hovering over a bar displays Timestamps and Frame Count.
Figure 33. Timestamps and Frame Count
Show / Hide Additional Tabs determine the information displayed in the Event section. They are selectable and persist until changed. The UI displays up to four tabs.
Select Create Event to create an event. Enter the required information:
Name: Enter a name for the RN event.
Incident Look Ahead Buffer: Enter a value (in minutes).
Figure 37. Create Recorder Node Event
Select Create to create a Recorder Node Event.
Figure 38. Added Event
Use the X icon to stop the event and confirm.
Figure 39. Confirm Stop
Show / Hide Additional Tabs determine the information displayed in the Event section. They are selectable and persist until changed. The UI displays up to four tabs.
The CPU Core and Memory Info dashboard displays Memory Info and CPU Status.
Figure 41. CPU Core and Memory Info
Memory Info summary information includes:
Collection Time
Total Bytes
Used Bytes
Free Bytes
Shared Bytes
Buffer Bytes
Cache Bytes
Available Bytes
CPU Status tabular information includes:
Core Number
Name
User Utilization
User Low Priority Utilization
Kernel Utilization
I/O Wait Utilization
Hard Interrupt Utilization
Soft Interrupt Utilization
Idle Utilization
Stenographer Info
The Stenographer Info dashboard displays Stenographer Info and Recording Threads.
Figure 42. CPU Core and Memory Info
Stenographer Info summary information includes:
Collection Time
Initialized
Tracked Files
Cached Files
Maximum Cached Files
Recording Threads tabular information includes:
Instance
Tracked Files
Cached Files
Maximum Cached Files
Recording Info
The Recording Info dashboard displays Recording Threads.
Figure 43. Recording Info
Recording Threads tabular information includes:
CPU Core
Disk
Dropped Packets
Total Packets
Collection Start Time
Assign a Recorder Node Interface to a Policy
To forward traffic to a Recorder Node (RN), include one or more RN interfaces as a delivery interface in a DANZ Monitoring Fabric (DMF) policy. Two methods exist to create a Policy:
When creating a new policy or editing an existing policy, select the RN interfaces from the Monitoring > Recorder Nodes.
Note: For more information on configuring Policies refer to the Managing DMF Policies section.
Figure 44. Recorder Nodes
To create a policy, select + Create Policy followed by Destination Tools > Add Ports(s).
Figure 45. Recorder Node - Create Policy
Use RN Fabric Interface to select a previously configured RN interface. Select or drag the Interfaces or Recorder Nodes.
Figure 46. Selected Interface
Select Add n Interface to add to Destination Tools.
Figure 47. Destination Tools
Select Create Policy.
Note: The RN interface can only be selected and not created in the create policy dialogue.
For more information on configuring Policies refer to the Managing DMF Policies section.
Using Monitoring Policies to Create a Policy
When creating a new policy or editing an existing policy, select the RN interfaces from the Monitoring > Policies dialog, as shown in the following screen.
Note: For more information on configuring Policies refer to the Managing DMF Policies section.
Figure 48. DMF Policies
Note: If no RN fabric Interfaces appear, proceed to the Monitoring > Recorder Nodes > RN Interfaces tab in the Inventory section to create a RN interface.
To create a policy, select + Create Policy followed by Destination Tools > Add Ports(s).
Figure 49. Recorder Node - Create Policy
Use RN Fabric Interface to select a previously configured RN interface. Select or drag the Interfaces or Recorder Nodes.
Figure 50. Selected Interface
Select Add n Interface to add to Destination Tools.
Figure 51. Destination Tools
Select Create Policy.
Note: The RN interface can only be selected and not created in the create policy dialogue.
For more information on configuring Policies refer to the Managing DMF Policies section.
Recorder Node Query
Use the options in the Query Recorder Nodes section to create a query and submit it to the RN for processing.
Initiate the Query Recorder Node workflow from the Recorder Nodes or Query History pages.
Figure 52. Recorder Nodes
Select Query Recorder Nodes to open the Query Recorder Node window.
Figure 53. Active Queries - Query Recorder Nodes
The Recorder Node (RN) records all the packets received on a filter interface that match the criteria defined in a DMF policy. The RN can recall or analyze recorded packets using various queries. Use the options described in the Query Recorder Node section to create a query and submit it to the RN for processing.
Figure 54. Query Action Parameters
The following query actions are supported:
Interval: Retrieve the oldest and most recent recorded packet timestamps. While hovering over the info icon provides information about the oldest and newest timestamp, to perform a query, you must enter the query time range using one of the following:
Quick Windows: A time range relative to the current time in which look for packets.
Select Range: A specific time range in which to look for packets.
Recorder Nodes: Select a single or multiple Recorder Nodes from the drop-down list.
IP Protocol: If required, select the IP protocol from the drop-down list or specify the numeric identifier of the protocol.
Size: Provides the number of packets and their aggregate size in bytes that match the filter criteria specified.
AppID: Performs deep packet inspection to identify applications communicating with the packets recorded and that match the filter criteria specified.
Packet Data: Retrieves all the packets that match the filter criteria specified.
Packet Objects: The packet object query extracts unencrypted HTTP objects from packets matching the given stenographer filter.
Replay: Replays selected packets and transmits them to the specified delivery interface.
Flow Analysis: Analyzes TCP flows for information such as maximum RTT, retransmissions, throughput, etc.
Traffic:
Any IP: Include packets with the specified IP address in the IP header (either source or destination).
Unidirectional: Include packets with the specified source and/or destination IP address in the IP header.
Traffic Pair - Source Destination:
IP/CIDR or Mac: Select packets with a specific source and destination IP or MAC address.
Src Port: Include packets with the specified protocol port number in the Src Port field in the IP header.
Dst Port: Include packets with the specified protocol port number in the Dst Port field in the IP header.
VLAN: Select packets with a specific VLAN ID.
Inner VLAN
Inner Inner VLAN
Outer VLAN
Filter Interfaces: Select the filter interfaces to restrict the query to those interfaces.
Policies: Select the policies to restrict the query to those policies.
Coalesce: Defines whether or not the data is coalesced if from multiple Recorder Nodes.
Fast Fail: For multi-packet-recorder queries, if one packet recorder fails, fail the entire query immediately. Otherwise, continue obtaining a partial result from the remaining packet recorders.
Timeout: Specify a timeout interval in Seconds, Minutes, or Hours.
Max Size: This option is only available for packet queries. Specify the maximum number of bytes returned by a packet query in a PCAP file.
Max Packets: This option is only available for packet queries. Specify the maximum number of packets returned by a packet query in a PCAP file.
To query the Recorder Nodes, enter the required information. Interval details are mandatory, while other fields are optional. The current computed Stenographer Query string displays under Query Preview.
Figure 55. Query Recorder Nodes
Hovering over the info icon for the Interval field displays the range of packets found.
Figure 56. Interval Details
The Replay query type has an additional mandatory field: Delivery Interfaces. Select Delivery Interfaces or Delivery Interface Groups from the drop-down.
Figure 57. Replay Fields
The Flow Analysis query type has an additional drop-down field of configuration parameters:
DNS: Analyzes any DNS packets, extracting query and response metadata.
Hosts: Identifies all the unique hosts that match the filter criteria specified.
IPv4: Identifies and dissects distinct IPv4 flows.
IPv6: Identifies and dissects distinct IPv6 flows.
RTP Streams: Characterizes the performance of Real Time Protocol streaming packets.
SIP Correlate:
SIP Health:
TCP: Identifies and dissects distinct TCP flows.
TCP Flow Health: Analyzes TCP flows for information such as maximum RTT, retransmissions, throughput, etc.
UDP: Identifies and dissects distinct UDP flows.
Figure 58. Flow Analysis
Upon entering the information and selecting Query, the window closes, and an info notification appears. The Active Queries are populated (unless the query completes quickly).
Figure 59. Info Notification
When the query completes, a success notification appears. Selecting the link goes to the Query History page.
Figure 60. Success Message
Select Re-Query from the Query History page to pre-populate certain querying fields.
Figure 61. Re-Query Option
Note: The system does not repopulate all fields because it does not retain all of a query’s details. However, this entry point quickly modifies existing queries or speeds up commonly used queries.
Figure 62. Re-Query Configuration
Viewing Query History
Navigate to Monitoring > Recorder Nodes and scroll down to the Query History section.
Figure 63. Recorder Nodes
From Active Queries, select View Query History.
Figure 64. View Query History
The Query History dashboard appears.
Figure 65. Query Dashboard
While on the Query History page, use Recorder Nodes to return to the Recorder Nodes page.
Multiple Queries
To run queries on recorded packets by the RN, navigate to the Monitoring > Recorder Nodes page.
Under the Active Queries section, select Query Recorder Nodes to select the type of analysis to run on the recorded packets.
After selecting the query type, use filters to limit or narrow the search to obtain specific results. Providing specific filters also helps to complete the query analysis faster. In the following example, the query result for the TCP query type will return the results for IP address 10.240.30.24 for the past 15 minutes.
Figure 66. Query Type
After entering the desired filters, select Query. Query status windows appear.
To view the results select Active Queries. If the query has finished, view the results using Query History.
Select View Details under the More Options button.
Figure 67. More Options
Figure 68. Query Details
Query Results
To view Recorder Node Query Results, navigate to Query History.
Figure 69. Query History
Select View Details under the More Options button.
Figure 70. More Options
View Details displays the results of the query.
Figure 71. View Details
Selecting Download begins downloading the JSON data.
Figure 72. Downloaded Data
Deduplicate Packets
For Recorder Node queries, the recorded packets matching a specified query filter may contain duplicates when packet recording occurs at several different TAPs within the same network; i.e., as a packet moves through the network, it may be recorded multiple times. The dedup feature removes duplicate packets from the query results. By eliminating redundant information, packet deduplication improves query results' clarity, accuracy, and conciseness. Additionally, the dedup feature significantly reduces the size of query results obtained from packet query types.
The Query Recorder Nodes configuration window appears.
Figure 74. Query Recorder Nodes
Deduplication is off by default for these queries. To enable deduplication, perform the following steps:
Choose a Query Type.
Packet deduplication is available for the Size, AppID, Packet Data, Packet Objects, Replay, and Flow Analysis query types.
Specify a time window (in milliseconds) by entering an integer between 0 and 999 (inclusive) in the Dedup Time Window field.
Select Query to continue.
The following example illustrates enabling deduplication for a Size query specifying a Dedup Time Window value of 200 ms.
Figure 75. Dedup Parameters
Manage Access to the Recorder Node
Use Role-Based Access Control (RBAC) to manage access to the DANZ Monitoring Fabric (DMF) Recorder Node (RN) by associating the RN with an RBAC group.
To restrict access for a specific RN to a specific RBAC group, use the following instructions.
RBAC Configuration
Select Security > Groups, and select Edit from the Actions and select + Create Group.
Figure 76. Create Security Group
Enter a Group Name.
Figure 77. Create Group
Under the Role Based Access Control section select Add Recorder Node.
Select the Recorder Node from the selection list, and assign the permissions required.
Read: The user can view recorded packets.
Use: The user can define and run queries.
Configure: The user can configure packet recorder instances and interfaces.
Export: The user can export packets to a different device.
Figure 78. Associate Recorder Node
Select Create.
Rename a RBAC Group
This topic describes the workflow for renaming a Group Name in DMF.
Overview
Navigate to Security > Groups and select Groups.
Figure 79. Security Groups
Figure 80. Groups Dashboard
Renaming a Group Name
To update a Group Name, such as changing test-group to test-group-updated, select Edit in the row menu action.
Figure 81. Edit
An Edit Group window displays.
Figure 82. Edit Group
Enter the new Group Name.
Figure 83. Updated Group Name
Select Save to apply the change.
DMF updates the Group Name.
Figure 84. Updated Group Name
Enabling Egress sFlow® on Recorder Node Interfaces
Enable egress sFlow®* to sample traffic sent to any DANZ Monitoring Fabric (DMF) Recorder Node (RN) attached to the fabric. Examining these sampled packets on a configured sFlow collector allows the identification of post-match-rule flows recorded by the RNs without performing a query against the RNs. While not explicitly required, Arista Networks highly recommends using the DMF Analytics Node (AN) as the configured sFlow collector, as it can automatically identify packets sampled utilizing this feature.
Platform Compatibility
All platforms apart from the following series:
DCS-7280R
DCS-7280R2
DCS-7500R
DCS-7020
DCS-7050X4
Configuration
After configuring the fabric for sFlow and setting up the sFlow collector, navigate to Monitoring > Recorder Nodes.
Figure 85. Query Recorder Nodes
Select Edit Configuration and the configuration menu appears.
Figure 86. sFlow Configuration
Set Enable sFlow to Yes.
Figure 87. sFlow Enabled
Select Save.
DMF Analytics Node
When using a DMF Analytics Node as the sFlow collector, it has a dashboard to display the results from this feature. To access the results:
Navigate to the sFlow dashboard from the Fabric dashboard.
Select the disabled RN Flows filter.
Select the option to Re-enable the filter.
Figure 88. Re-enable sFlow
Troubleshooting Egress sFlow Configurations
Switches not affiliated with a sFlow collector (either a global sFlow collector or a switch-specific sFlow collector) do not have an active feature even if the feature is enabled. Ensure the fabric is set up for sFlow and a configured sFlow collector exists. To verify that a configured global sFlow collector exists, use the command:
dmf-controller-1# show sflow default
A configured collector appears as an entry in the table under the column labeled collector. Alternatively, to verify a configured collector exists for a given switch, use the command:
dmf-controller-1# show switch switch-name table sflow-collector
This command displays a table with one entry per configured collector.
A feature-unsupported-on-device warning appears when connecting an unsupported switch to an RN. The feature does not sample packets passing to an RN from an unsupported switch. View any such warnings using the GUI or using the following CLI command:
dmf-controller-1# show fabric warnings feature-unsupported-on-device
To verify the feature is active on a given switch, use the command:
dmf-controller-1# show switch switch-name table sflow-sample
If the feature is enabled, the entry values associated with the ports connected to an RN would include an EgressSamplingRate(number) with a number greater than 0. The following example illustrates Port(1) on switch-name connecting to an RN.
dmf-controller-1# show switch <switch-name> table sflow-sample
# Sflow-sample Device name Entry key Entry value
--|------------|---------------|---------|----------------------------------------------------------------------------------|
53 52 <switch-name> Port(1) SamplingRate(0), EgressSamplingRate(10000), HeaderSize(128), Interval(10000)
Empty State
Users installing DMF 8.7.0 for the first-time who have not migrated from a previous DMF release will see an empty-state Recorder Nodes dashboard, as shown in the following example.
Figure 89. Recorder Node - Empty State
Please refer to the DMF Deployment Guide for more information on installing and configuring a DMF Recorder Node.
Wireshark Web Interface via the DMF Interface
Accessing the Wireshark Web Interface via the DMF Interface
Security policies occasionally prevent the download of PCAP files from packet queries. The integrated Wireshark web interface enables PCAP analysis within the DMF environment and requires authentication. This integration provides full Wireshark functionality while keeping the PCAP file on the Controller to maintain adherence to security requirements.
The DMF Controller User Interface (UI) offers a toggle for Wireshark within the Features menu.
Figure 90. Access Features Menu
The DMF Features page also contains a link to detailed information within the Wireshark feature box, providing additional technical insights.
Figure 91. Wireshark Enable Panel
Select View Detailed Information to obtain additional information about the Wireshark feature, consistent with other DMF interface features.
Figure 92. View Detailed Information
Figure 93. Wireshark Info Message
Wireshark Feature States
The Wireshark feature displays the following operational states:
Enabled, starting: The system is initializing the service.
Enabled, error: The service failed to start or encountered a malfunction.
Enabled, running: The service is active and functional.
Disabled: The service remains inactive.
Figure 94. Wireshark Starting
Figure 95. Wireshark Error
Figure 96. Wireshark Running
Figure 97. Wireshark Disabled
Accessing the Wireshark Interface
Access to the Wireshark page occurs via two primary methods:
Using the here link within the feature box after the state reaches Enabled, running.
Selecting Wireshark from the Monitoring menu.
Figure 98. Wireshark Running
Figure 99. Monitoring > Wireshark
The DMF UI hosts the Wireshark interface for direct viewing and analysis.
Figure 100. Wireshark Menu
Limitations
Single Session Access: The interface supports only one active session at a time on a first-come, first-served basis.
Memory Constraints: A 2GB memory limit applies to file operations. Opening PCAP files that exceed this limit triggers an automatic denial of the attempt and a system restart.
No live capture: We do not support the real time streaming of live captures.
Syslog Messages
DANZ Monitoring Fabric (DMF) generates specific syslog messages related to Wireshark to record events, status changes, and errors. The logs provide real-time visibility and serve as a primary resource for troubleshooting and to identify specific message types, understand severity levels, and determine the appropriate corrective actions.
INFO
WRS1000: Successfully started Wireshark container.
WRS1001: Stopped Wireshark container.
WRS1002: Updating Wireshark configuration. Status set to {Wireshark UI status}.
Displays a detailed overview of the Docker system configuration, including container and image statistics.
sudo systemctl status docker
Checks the status of the main Docker background service (daemon) to verify operational state or identify errors.
Considerations
The following operational requirements and limitations apply to using Wireshark in the DMF User Interface.
Single Session Access: The interface supports only one active session at a time on a first-come, first-served basis.
Memory Constraints: A 2GB memory limit applies to file operations. Opening PCAP files that exceed this limit triggers an automatic denial of the attempt and a system restart.
No live capture: The interface does not support real-time streaming of live captures.
Recorder Node Stats in Analytics Node
The Analytics Node (AN) enables the correlation of 5-tuple data from Flows and DMF metadata with the corresponding packets retrieved from the Recorder Node (RN). Previously, the system displayed Egress sFlow®* to indicate potentially recorded flow packets.
The Network > Recorder Node dashboard now includes enhanced RN Statistics to:
Identify which interfaces and policies transmit packets to the RN.
Monitor the current recording status.
Track disk usage for both the RN index and packet storage.
Figure 101. Analytics Recorder Node Dashboard
Follow the CLI instructions to provision the DMF Controller with the AN IP address to enable statistics export.
Assign any alphanumeric identifier for the recorder node interface name, which changes the submode to config-pkt-rec-intf, to provide an optional description. This submode allows specifying the switch and interface where the RN is connected.
Provide an optional description and identify the switch interface connected to the RN.
controller-1(config-pkt-rec-intf)# description 'Delivery point for recorder-node'
controller-1(config-pkt-rec-intf)# recorder-interface switch Switch-z9100 ethernet37
(Optional) Recording: Enabled by default. To disable recording, enter the following commands:
controller-1(config)# recorder-node device rn-alias
controller-1(config-recorder-node)# no record
(Optional) Disk Full Policy: By default, Disk Full Policy is set to rolling-fifo, deleting the oldest packets to make room for newer packets when RN disks are full. This configuration can be changed to stop-and-wait, allowing the RN to stop recording until disk space becomes available. Enter the commands below to configure Disk Full Policy to stop-and-wait.
Backup Disk Policy: Define the backup disk policy to select the secondary volume and select one of the following three options:
controller-1(config-recorder-node)# backup-volume
local-fallback Set local disk as backup when remote disk is unreachable
no-backup Do not use any backup volume (default selection)
remote-extend Set remote volume to extend local main disk
The no-backup mode is the default mode. The other two modes require that the Recorder Node have a set of recording disks and a connection to an Isilon cluster mounted via NFS. Configure this remote storage from the DMF Controller.
(Optional) Max Packet Age: This defines the maximum age in minutes of any packet in the RN. By default, Max Packet Age is unset, which means no limit is enforced. When setting a Max Packet Age, packets recorded on the RN are discarded after the minutes specified. To set the maximum number of minutes that recorded packets will be kept on the RN, enter the following commands:
This sets the maximum time to keep recorded packets to 30 minutes.
Note: Combine Max Packet Age with the packet removal policy to control when packets are deleted based on age rather than disk utilization alone.
(Optional) Max Disk Utilization: This defines the maximum disk utilization as a percentage between 5% and 95%. The Disk Full Policy (rolling-fifo or stop-and-wait) is enforced when reaching this value. If unset, the default maximum disk utilization is 95%; however, configure it, as required, using the following commands:
(Optional) Disable unused or unneeded indexing configuration fields in subsequent recorder node queries. DMF enables all indexing fields by default. To disable a specific indexing option, enter the following commands from the config-recorder-node-indexing submode. To re-enable a disabled option, enter the command without the no prefix.
Use the following command to enter the RN indexing submode:
Configure the DANZ Monitoring Fabric (DMF) policy to identify the traffic to send to the RN.
controller-1(config-policy)# 1 match any
controller-1(config-policy)# # filter-interface FilterInterface1
controller-1(config-policy)# # action forward
This example forwards all traffic received in the monitoring fabric on filter interface FilterInterface1 to the RN interface. The following is the running-config for this example configuration:
recorder-fabric interface intf-1
description 'Delivery point for recorder-node'
recorder-interface switch 00:00:70:72:cf:c7:cd:7d ethernet37
policy RecorderNodePolicy
action forward
filter-interface FilterInterface1
use-recorder-fabric intf-1
1 match any
Authentication Token Configuration
Static authentication tokens are pushed to each Recorder Node (RN) as an alternative form of authentication in headless mode when the DANZ Monitoring Fabric (DMF) Controller is unreachable or by third-party applications that do not have or do not need DMF controller credentials to query the RN.
To configure the RN with a static authentication token, use the following commands:
controller-1(config)# recorder-node auth token mytoken
Auth : mytoken
Token : some_secret_string <--- secret plaintext token displayed once here
controller-1 (config)# show running-config recorder-node auth token
! recorder-node
recorder-node auth token mytoken $2a$12$cwt4PvsPySXrmMLYA.Mnyus9DpQ/bydGWD4LEhNL6xhPpkKNLzqWS <---hashed token shows in running config
The DMF Controller uses its hidden authentication token to query the RN. To regenerate the Controller authentication token, use the following command:
To enable the pre-buffer or change the time allocated, enter the following commands:
controller-1(config)# recorder-node device name
controller-1(config-recorder-node)# pre-buffer minutes
Replace name with the recorder node name. Replace minutes with the number of minutes to allocate to the pre-buffer.
Triggering a Recorder Node Event
To trigger an event for a specific Recorder Node (RN), enter the following command from enable mode:
controller-1# trigger recorder-node name event event-name
Replace name with the RN name and replace event-name with the name to assign to the current event.
Terminating a Recorder Node Event
To terminate a Recorder Node (RN) event, use the following command:
controller-1# terminate recorder-node name event event-name
Replace name with the RN name and replace event-name with the RN event name to terminate.
Viewing Recorder Node Events
To view recorder node events, enter the following command from enable mode:
controller-1# show recorder-node events
# Packet Recorder Time Event
-|---------------|------------------------------|-------------------------------------------------------------------|
1 pkt-rec-740 2018-02-06 16:21:37.289000 UTC Pre-buffer event my-event1 complete. Duration 3 minute(s)
2 pkt-rec-740 2018-02-06 20:23:59.758000 UTC Pre-buffer event event2 complete. Duration 73 minute(s)
3 pkt-rec-740 2018-02-07 22:39:15.036000 UTC Pre-buffer event event-02-7/event3 complete. Duration 183 minute(s)
4 pkt-rec-740 2018-02-07 22:40:15.856000 UTC Pre-buffer event event5 triggered
5 pkt-rec-740 2018-02-07 22:40:16.125000 UTC Pre-buffer event event4/event-02-7 complete. Duration 1 minute(s)
6 pkt-rec-740 2018-02-22 06:53:10.216000 UTC Pre-buffer event triggered
Run Recorder Node Queries
Note: The DANZ Monitoring Fabric (DMF) Controller prompt is displayed immediately after entering a query or replay request, but the query continues in the background. Attempting to enter another replay or query command before the previous command is completed, an error message is displayed.
Packet Replay
Enter the replay recorder-node command from enable mode to replay the packets recorded by a Recorder Node (RN).
The following are the options available with this command.
name: Specify the RN from which to replay the recorded packets.
interface: The DMF delivery interface name receiving the packets.
stenographer-query: The filter used to look up desired packets.
(Optional) real-time: Replay the packets at the original rate recorded by the specified RN. The absence of this parameter will result in a replay up to the line rate of the RN interface.
(Optional) replay-ratebps: Specify the number of bits per second used for replaying the packets recorded by the specified RN. The absence of this parameter will result in a replay up to the line rate of the RN interface.
The following command shows an example of a replay command using the to-delivery option.
Use a packet query to search the packets recorded by a specific Recorder Node (RN). The operation uses a Stenographer query string to filter only the interesting traffic. The query returns a URL to download and analyze the packets using Wireshark or other packet-analysis tools.
From enable mode, enter the query recorder-node command.
switch # query recorder-node name packet-data filter stenographer-query
The following is the meaning of each parameter:
name: Identify the RN.
packet-data filterstenographer-query: Look up only the packets that match the specified Stenographer query.
The following example illustrates the results returned:
Packet Object Query
The packet object query extracts unencrypted HTTP objects from packets matching the given stenographer filter. To run a packet object query, run the following query command:
Use a size query to analyze the number of packets and the total size recorded by a specific Recorder Node (RN). The operation uses a Stenographer query string to filter only the interesting traffic.
Enter the query recorder-node command from enable mode to run a size query.
# query recorder-node name size filter stenographer_query
The following is the meaning of each parameter:
name: Identify the RN.
size filterstenographer-query: Analyze only the packets that match the specified Stenographer query.
The following example illustrates the results returned:
Use the abort recorder-node command to stop the query running on the specified Recorder Node (RN). From enable mode, enter the following command:
controller-1# abort recorder-node name filter string
Replace name with the RN name, and use the filter keyword to identify the specific filter used to submit the query. If the specific running query is unknown, use an empty-string filter of "" to terminate any running query.
controller-1# abort recorder-node hq-bmf-packet-recorder-1 filter ""
Abort any request with the specified filter? This cannot be undone. enter "yes" (or "y") to
continue:
yes
Result : Success
~ Error(s) ~
None.
Viewing Query History
View Recorder Node (RN) submitted queries using the CLI.
To display query history, enter the following command:
dmf-controller> show recorder-node query-history
# Packet Recorder Query Type Start Duration
---|---------------|--------------|------------------------|------------------------------|--------|
1 HW-PR-2 after 10m ago analysis-hosts 2019-03-20 09:52:38.021000 PDT 3428
2 HW-PR-1 after 10m ago analysis-hosts 2019-03-20 09:52:38.021000 PDT 3428
3 HW-PR-2 after 10m ago abort 2019-03-20 09:52:40.439000 PDT 711
4 HW-PR-1 after 10m ago abort 2019-03-20 09:52:40.439000 PDT 711
---------------------------------output truncated---------------------------------------------------
Using RBAC to Manage Access to the DMF Recorder Node
Use Role-Based Access Control (RBAC) to manage access to the DANZ Monitoring Fabric (DMF) Recorder Node (RN) by associating the RN with an RBAC group.
To restrict access for a specific RN to a specific RBAC group, use the CLI as described in the following instructions.
RBAC Configuration Using the CLI
Identify the group to associate the Recorder Node (RN).
Enter the following command from config mode on the active DANZ Monitoring Fabric (DMF) controller:
controller-1(config)# group test
controller-1(config-group)#
Associate one or more RNs with the group.
Enter the following CLI command from the config-group submode:
This section describes monitoring and troubleshooting the Recorder Node (RN) status and operation. The RN stores packets on the main hard disk and the indices on the SSD volumes.
Viewing the Recorder Node Interface
To view information about the RN interface information, use the following command:
controller-1(config)# show topology recorder-node
# DMF IF Switch IF Name State Speed Rate Limit
-|------------|----------|----------|-----|------|----------|
1 RecNode-Intf Arista7050 ethernet1 up 25Gbps -
Viewing Recorder Node Operation
controller-1# show recorder-node device packet-rec-740 interfaces stats
Packet Recorder Name Rx Pkts Rx BytesRx Drop Rx Errors Tx Pkts Tx Bytes Tx Drop Tx Errors
---------------|----|-------------|---------------|--------|---------|--------|----------|-------|---------|
packet-rec-740 pri1 2640908588614 172081747460802 84204084 0 24630503 3053932660 0 0
Information about a Recorder Node (RN) interface used as a delivery port in a DANZ Monitoring Fabric (DMF) out-of-band policy appears in a list. It lists RN interfaces as dynamically added delivery interfaces.
Ctrl-2(config)# show policy PR-policy
Policy Name : PR-policy
Config Status : active - forward
Runtime Status : installed
Detailed Status : installed - installed to forward
Priority : 100
Overlap Priority : 0
# of switches with filter interfaces : 1
# of switches with delivery interfaces : 1
# of switches with service interfaces : 0
# of filter interfaces : 1
# of delivery interfaces : 1
# of core interfaces : 0
# of services : 0
# of pre service interfaces : 0
# of post service interfaces : 0
Push VLAN : 1
Post Match Filter Traffic : 1.51Gbps
Total Delivery Rate : 1.51Gbps
Total Pre Service Rate : -
Total Post Service Rate : -
Overlapping Policies : none
Component Policies : none
Installed Time : 2023-09-22 12:16:55 UTC
Installed Duration : 3 days, 4 hours
~ Match Rules ~
# Rule
-|-----------|
1 1 match any
~~~~~~~~~~~~~~~~~~~~~~~~~~~~~~~~~~~~~~~~~~~~~~~~~~~~~~ Filter Interface(s) ~~~~~~~~~~~~~~~~~~~~~~~~~~~~~~~~~~~~~~~~~~~~~~~~~~~~~~
# DMF IF Switch IF Name State Dir Packets Bytes Pkt Rate Bit Rate Counter Reset Time
-|-----------|-------------------|---------|-----|---|-----------|--------------|--------|--------|------------------------------|
1 Lab-traffic Arista-7050SX3-T3X5 ethernet7 up rx 97831460642 51981008309480 382563 1.51Gbps 2023-09-22 12:16:55.738000 UTC
~~~~~~~~~~~~~~~~~~~~~~~~~~~~~~~~~~~~~~~~~~~~~~~~~~~~~~~~ Delivery Interface(s) ~~~~~~~~~~~~~~~~~~~~~~~~~~~~~~~~~~~~~~~~~~~~~~~~~~~~~~~~
# DMF IF Switch IF Name State Dir Packets Bytes Pkt Rate Bit Rate Counter Reset Time
-|---------------|-------------------|----------|-----|---|-----------|--------------|--------|--------|------------------------------|
1 PR-intf Arista-7050SX3-T3X5 ethernet35 up tx 97831460642 51981008309480 382563 1.51Gbps 2023-09-22 12:16:55.738000 UTC
~ Service Interface(s) ~
None.
~ Core Interface(s) ~
None.
~ Failed Path(s) ~
None.
Ctrl-2(config)#
Viewing Errors and Warnings
The following table lists the errors and warnings a recorder node may display. In the CLI, display these errors and warnings by entering the following commands:
show
fabric errors
show fabric
warnings
show recorder-node errors
show recorder-node warnings
Table 3. Errors and Warnings
Type
Condition
Cause
Resolution
Error
Recorder Node (RN) management link down.
RN has not received controller LLDP.
Wait 30s if the recorder node is newly configured. Verify it is not connected to a switch port that is a DANZ Monitoring Fabric (DMF) interface.
Error
RN fabric link down.
Controller has not received RN LLDP.
Wait 30s if recorder node is newly configured. Check it is online otherwise.
Warning
Disk/RAID health degraded.
Possible hardware degradation.
Investigate specific warning reported. Could be temperature issue. Possibly replace indicated disk soon.
Warning
Low disk space.
Packet or index disk space has risen above threshold.
Prepare for disk full soon.
Warning
Disk full.
Packet or index disk space is full. Packets are being dropped or rotated depending on removal policy.
Do nothing if removal policy is rolling-FIFO. Consider erasing packets to free up space otherwise.
Warning
Recorder misconfiguration on a DMF interface.
A recorder node has been detected in the fabric on a switch interface that is configured as a filter or delivery interface.
Remove the conflicting interface configuration, or re-cable the recorder node to a switch interface not defined as a filter or delivery interface.
Changing the Recorder Node Default Configuration
Configuration settings are automatically downloaded to the Recorder Node (RN) from the DANZ Monitoring Fabric (DMF) Controller, eliminating the need for box-by-box configuration. However, the option exists to override the default configuration for the RN from the config-recorder-node submode for any RN.
Note:These options are available only from the CLI, not the DMF Controller GUI.
To change the CLI mode to config-recorder-node, enter the following command from config mode on the active DMF controller:
Replace instance with the alias to use for the RN. This alias is affiliated with the MAC hardware address using the mac command.
Use any of the following commands from the config-recorder-node submode to override the default configuration for the associated RN:
banner: Set the RN pre-login banner message
mac: Configure the MAC address for the RN
Additionally, the option exists to override the configurations shown below to use values specific to the RN or used in a merge-mode along with the configuration inherited from the DMF controller:
ntp: Configure RN to override default timezone and NTP parameters.
snmp-server: Configure RN SNMP parameters and traps.
logging: Enable RN logging to Controller.
tacacs: Set TACACS defaults, server IP address(es), timeouts and keys.
Use the following commands from the config-recorder-node submode to change the default configuration on the RN:
ntp override-global: Override global time configuration with RN time configuration.
snmp-server override-global: Override global SNMP configuration with RN SNMP configuration.
snmp-server trap override-global: Override global SNMP trap configuration with RN SNMP trap configuration.
logging override-global: Override global logging configuration with packet recorder logging configuration.
tacacs override-global: Override global TACACS configuration with RN TACACS configuration.
To configure the RN to work in a merge mode by merging its specific configuration with that of the DMF Controller, execute the following commands in the config-recorder-node submode:
ntp merge-global: Merge global time configuration with RN time configuration.
snmp-server merge-global: Merge global SNMP configuration with RN SNMP configuration.
snmp-server trap merge-global: Merge global SNMP trap configuration with RN SNMP trap configuration.
logging merge-global: Merge global logging configuration with RN logging configuration.
TACACS configuration does not have a merge option. It can either be inherited from the DMF Controller or overridden to use only the RN-specific configuration.
Large PCAP Queries
Access the RN via a web browser to run large PCAP queries to the Recorder Node (RN). This allows running packet queries directly to the RN without specifying the maximum byte or packet limit for the PCAP file (which is required when executing the query from the DANZ Monitoring Fabric (DMF) Controller).
To access the RN directly, use the URL https://RecorderNodeIP in a web browser, as shown below:
Figure 102. URL to Recorder Node
The following page will be displayed:
Figure 103. Recorder Node Page
Recorder Node IP Address: Enter the target RN IP address.
DMF Controller Username: Provide the DMF Controller username.
DMF Controller Password: Provide the password for authentication.
Stenographer Query Filter: Use the query filter to filter the query results to look for specific packets. For example, to search for packets with a source IP address of 10.0.0.145 in the last 10 minutes, use the following filter:
after 10m ago and src host 10.0.0.145
Stenographer Query ID: Starting in DMF 8.0, a Universally Unique Identifier (UUID) is required to run queries. To generate a UUID, run the following command on any Linux machine and use the result as the Stenographer query ID:
$ uuidgen
b01308db-65f2-4d7c-b884-bb908d111400
Save pcap as: Provide the file name for this PCAP query result.
Submit Request: Sends a query to the specified RN and saves the PCAP file with the provided file name to the default download location for the browser.
Recorder Node Management Migration L3ZTN
After completing the first boot (initial configuration), remove the Recorder Node (RN) from the old Controller and point it to a new Controller via the CLI in the case of a Layer-3 topology mode.
Note:For appliances to connect to the DANZ Monitoring Fabric (DMF) Controller in Layer-3 Zero Touch Network (L3ZTN) mode, configure the DMF Controller deployment mode as pre-configure.
To migrate management to a new Controller, follow the steps below:
Remove the RN and switch from the old Controller using the commands below:
controller-1(config)# no recorder-node device RecNode
controller-1(config)# no switch Arista7050
Add the switch to the new Controller.
SSH to the RN and configure the new Controller IP using the zerotouch l3ztn controller-ip command:
After pointing the RN to use the new Controller, reboot the RN.
Once the RN is back online, the DMF Controller receives the ZTN request.
After the DMF Controller has received a ZTN request from the RN, add it to the DMF Controller running-configuration using the below command:
controller-1(config)# recorder-node device RecNode
controller-1(config-recorder-node)# mac 24:6e:96:78:58:b4
Verify the addition of the RN to the new DMF Controller using the command below:
Recorder Node Show Commands
The following commands are available from the Recorder Node (RN):
Use the show version command to view the version and image information that RN is running on.
RecNode(config)# show version
Controller Version : DMF Recorder Node 8.1.0 (bigswitch/enable/dmf-8.1.x #5)
RecNode(config)#
Use the show controllers command to view the connected DANZ Monitoring Fabric (DMF) controllers to the recorder node.
Note: All cluster nodes appear in the command output if the RN is connected to a DMF Controller cluster.
RecNode(config)# show controllers
controller Role State Aux
---------------------|------|---------|---|
tcp://10.106.8.2:6653 master connected 0
tcp://10.106.8.3:6653 slave connected 0
tcp://10.106.8.3:6653 slave connected 1
tcp://10.106.8.3:6653 slave connected 2
tcp://10.106.8.2:6653 master connected 1
tcp://10.106.8.2:6653 master connected 2
RecNode(config)#
Ability to Deduplicate Packets - Query from Recorder Node
For Recorder Node queries, the recorded packets matching a specified query filter may contain duplicates when packet recording occurs at several different TAPs within the same network; i.e., as a packet moves through the network, it may be recorded multiple times. The dedup feature removes duplicate packets from the query results. By eliminating redundant information, packet deduplication improves query results' clarity, accuracy, and conciseness. Additionally, the dedup feature significantly reduces the size of query results obtained from packet query types.
Deduplicate Packets
In the DANZ Monitoring Fabric (DMF) Controller CLI, packet deduplication is available for the packet data, packet object, size, and replay query types. Deduplication is off by default for these queries. Add the dedup option to the end of the query command after all optional values (if any) have been selected to enable deduplication.
The following are command examples of enabling deduplication.
Specify a time window (in milliseconds) for deduplication. The time window defines the time required between timestamps of identical packets to no longer be considered duplicates of each other. For example, for a time window of 200 ms, two identical packets with timestamps that are 200 ms (or less) apart are duplicates of each other. In contrast, if the two identical packets had timestamps more than 200 ms apart, they would not be duplicates of each other.
The time window must be an integer between 0 and 999 (inclusive) with a default time window of 200 ms when deduplication is enabled and no set time window value.
To configure a time window value, use the dedup-window option followed by an integer value for the time window after the dedup option.
Enable egress sFlow®* to sample traffic sent to any DANZ Monitoring Fabric (DMF) Recorder Node (RN) attached to the fabric. Examining these sampled packets on a configured sFlow collector allows the identification of post-match-rule flows recorded by the RNs without performing a query against the RNs. While not explicitly required, Arista Networks highly recommends using the DMF Analytics Node (AN) as the configured sFlow collector, as it can automatically identify packets sampled utilizing this feature.
Platform Compatibility
All platforms apart from the following series:
DCS-7280R
DCS-7280R2
DCS-7500R
DCS-7020
DCS-7050X4
Configuration
The egress sFlow feature requires a configured sFlow collector. After configuring the sFlow collector, enter the following command from the config mode to enable the feature:
dmf-controller-1(config)# recorder-node sflow
To disable the feature, enter the command:
dmf-controller-1(config)# no recorder-node sflow
Mask DTMF Tones in RTP
The Mask Dual-tone Multi-Frequency (DTMF) in Real-time Transport Protocol (RTP) feature supports masking digits in voice data to hide sensitive information, such as credit card or social security numbers. Masking of sensitive data is a compliance issue that various agencies require to obfuscate information before storage.
The masking operation is a pipeline action executed on the DMF Service Node via a policy encompassing all Session Initiation Protocol (SIP) and RTP traffic. The Service Node parses SIP signaling and Session Description Protocol (SDP) bodies to identify UDP flows carrying RTP streams. For each identified flow, the node inspects the RTP payload for telephone-event packets (RFC 4733/2833) and maps digits 0–9 to a mask character (e.g., '*') to obfuscate the original input. All other packets are forwarded as is, with the sole exception of these masked telephone events. All current DMF platforms support this feature.
Configuration
The Service Node identifies UDP flows containing RTP telephone-event messages by performing stateful inspection of both SIP signaling and the associated RTP media. This identification requires routing both traffic types through the Service Node. Because RTP lacks a unique global identifier in the UDP header, Arista recommends isolating voice traffic via VLAN tagging or equivalent traffic-separation mechanisms. Include all candidate RTP traffic in the service policy to ensure comprehensive digit masking. There are two cases:
If no ports are specified, the action configures both tcp-port and udp-port to the default value of 5060. This setting applies exclusively to SIP/SDP packets and excludes RTP packets.
If custom ports are specified, the system configures the action with specified custom ports.
dmf-controller-1(config)# managed-service ms
dmf-controller-1(config-managed-srv)# 2 action sip-mask
dmf-controller-1(config-managed-srv-sip-mask)# tcp-port 5061
dmf-controller-1(config-managed-srv-sip-mask)# udp-port 5062
dmf-controller-1(config-managed-srv-sip-mask)# exit
dmf-controller-1(config-managed-srv)# show this
! managed-service
managed-service ms
service-interface switch core1 ethernet1
2 action sip-mask
tcp-port 5061
udp-port 5062
The sip-mask action maintains various counters to identify SIP parsing failures and related processing errors. View these values from the Controller by running the show debug
debug-countersservice-node command.
Resources
The Session Initiation Protocol is defined in RFC 3261.
Discovery: The Service Node parses the SIP (RFC 3261) signaling.
The Real-Time Transport Protocol is defined in RFC 3550.
Inspection: It monitors the resulting RTP (RFC 3550) stream for specific Telephone Event (RFC 4733) packets.
The Session Description Protocol is defined in RFC 8866.
Mapping: It extracts the media port and payload type information from the SDP (RFC 8866) body.
Configure Recorder Note Stats in Analytics Node
Configuration
Configure the DMF Controller with the Analytics Node (AN) IP address to enable statistics export.
Configure Analytics Node Access Lists
Important: Configure Access Control Lists (ACLs) for both redis and replicated-redis on the AN to allow the DMF Controller to establish the export channel.
Permit traffic from both the active and standby physical IP addresses of the DMF Controller. The following example illustrates the required commands:
dmf-controller-1> en
dmf-controller-1# config
dmf-controller-1#(config) config-analytics
dmf-controller-1(config-analytics)# analytics-server address 10.240.145.2
Important: Now configure access for redis AND replicated-redis on the AN
AN(config-cluster-access)# access-list <redis|replicated-redis>
AN(config-cluster-access-list)# 1 permit from <DMF-active-physical-IP/32>
AN(config-cluster-access-list)# 2 permit from <DMF-standby-physical-IP/32>
Verify Channel Status
Verify that the export channel is active using the show analytics status command on the DMF Controller.
Note: In the following example output, the Replicated Redis
Status is unhealthy. Both statuses must report healthy for full functionality.
dmf-controller-1(config-analytics)# show analytics status
# Analytics ip Redis Status Redis Timestamp Replicated Redis Status Replicated Redis Timestamp
-|------------|------------|------------------------------|-----------------------|------------------------------|
1 10.240.145.2 healthy 2026-01-16 05:30:11.061000 UTC unhealthy 2026-01-16 05:30:11.061000 UTC
Expect a query with packet deduplication enabled to take longer to complete than packet deduplication disabled. Hence, packet deduplication, by default, is off.
The maximum time window value permitted is 999 ms to ensure that TCP retransmissions are not regarded as duplicates, assuming that the receive timeout value for TCP retransmissions (of any kind) is at least 1 second. If the receive timeout value is less than 1 second (particularly, exactly 999 ms or less), then it is possible for TCP retransmissions to be regarded as duplicates when the time window value used is larger than the receive timeout value.
Due to memory constraints, removing some duplicates may not occur as expected. This scenario is likely to occur if a substantial amount of packets match the query filter, which all have timestamps within the specified time window from each other. We refer to this scenario as the query having exceeded the packet window capacity. To mitigate this from occurring, decrease the time window value or use a more specific query filter to reduce the number of packets matching the query filter at a given time.
Guidelines and Limitations for Enabling Egress sFlow
Consider the following guidelines and limitations while enabling Egress sFlow:
The Egress sFlow support for the Recorder Nodes (RN) feature requires a configured sFlow collector in a fabric configured to allow sFlows.
If a packet enters a switch through a filter interface with sFlow enabled and exits through a port connected to an RN while the feature is enabled, only one sFlow packet (i.e., the ingress sFlow packet) is sent to the collector.
The Egress sFlow feature does not identify which RN has recorded a given packet in a fabric when there are multiple RNs. This is fine in a normal case as the queries are issued to the RNs in aggregate rather than to individual RNs, and hence, the information that any RN has received a packet is sufficient. In some cases, it may be possible to make that determination from the outport of the sFlow packet, but that information may not be available in all cases. This is an inherent limitation of egress sFlow.
An enabled egress sFlow feature captures the packets sent to any RN with recording enabled, regardless of whether the RN is actively recording or not.
Recorder Node Recording State API Limitations
The ready state only occurs after the recording application has finished initializing if no recordable traffic has been received yet. The recording application must undergo its initialization process whenever the RN is rebooted, restarted, or after restarting the RN application from the DMF Controller. If the RN is in the active state and stops receiving packets, it will not regress into the ready state; it will remain in the active state.
Mask DTMF Tones in RTP Limitations
Limitations
This feature is currently limited to RTP containing telephone-event messages. Other tone encodings are not included.
All digits are masked. There is no reasonable way to match a particular pattern, as each digit is in a separate packet.
SIP over TLS is not supported.
There is limited support for SIP over TCP. SIP messages divided across multiple TCP packets may not be parsed correctly.
The sip-mask action can track up to 256K flows. When more flows are identified, the oldest existing flows are purged. View the flow count by running the show debug counters command.
Recorder Node Support for CVaaS
The Recorder Node (RN) supports being managed by CloudVision (CV) on-prem starting DMF 8.7.0. This feature extends support to CVaaS starting DMF 8.8.0. Recorder Node was not supported with CVaaS before 8.8.0 because of an RN requirement to store the query results file in CV while archiving the query results. However, this was not permitted on CVaaS as these files might contain data that cannot be stored in a cloud service. This feature supports CVaaS by allowing the RN to store query result files.
Note: This feature is available in all RN management modes (DMF, CV on-prem, and CVaaS); however, only CVaaS is currently using it.
Query Files and Storage
RN stores query files in the query archive directory. The system mounts the directory (/var/lib/query-archive) to a new storage volume called the archive volume. This volume (/dev/flvg/query-archive) is part of the RN’s main disk and can be 10 or 50GB in size, depending on the size of the main disk. This directory is mapped to a new file server on the RN, allowing retrieval of query files from the RN via a URL.
The RN manages stored query files without user input. The system automatically deletes files from the archive older than 7 days, deleting any files when the archive volume does not have enough space for a new query file to be stored. In this case, it first deletes the oldest files until enough space becomes available. Metadata queries require at least 256MB to be available on the volume, whereas the user can set this value for packet queries.
Stored Files State API
The RN state API includes a list of all query files currently stored in the archive. This new list is available at /applications/recorder-node/state/query/stored-files. Each entry of the list includes the following information describing the query file:
file-name: Name of stored query result file
query-id: ID of associated query request
creation-time: ISO8601 timestamp of when the file was created
file-size: Size of file in bytes
Note: When a file is deleted by the RN, the corresponding entry is removed from this list.
Query RPC API
All RN query RPC APIs include a new input parameter called storage-method for selecting the archiving method to use for the request. The new parameter is an enumeration that has the following choices:
no-store: (default) Result will not be archived
local: Store query result file on the local archive volume
upload: Upload query result file to a remote file server
For packet queries, an additional input parameter called max-result-size is available. This parameter controls the maximum size (in bytes) of the query result, which by default is 2GB.
Note: The max result size is applied for packet queries regardless of the storage method selected.
The RPC output for all queries now includes a file-url entry which is the location where the query result file is stored. This is an empty string when no storage method is selected. For the upload method, this is the upload URL provided in the query input. For the local method, this is a relative URL for downloading the file from the file server on the RN.
Platform Compatibility
This feature is available for both physical and virtual Recorder Nodes. The only difference between the two deployments is the size of the archive volume. For a physical RN, the volume size is 50GB. For the virtual RN, the volume size might be limited to 10GB in scenarios where the main disk (the disk of the platform where the virtual RN is deployed) is not sufficiently large.
Show Commands
The stored query files can be viewed from the RN CLI using show query stored-files. Below is an example of the output from this command.
pr1> show query stored-files
# Creation time File name File size Query id
-|-----------------------|---------------------------------------------------------------|---------|--------------------------------|
1 2025-06-12 17:56:12 UTC size_2025-06-12T17-56-12Z_luwIwp4rnInbkb1j24BW8pj3ua_FwaYV.json 42B luwIwp4rnInbkb1j24BW8pj3ua_FwaYV
2 2025-06-12 18:02:14 UTC size_2025-06-12T18-02-14Z_9AUJ277ZmpCTr07NszoEC0DCFggzixU2.json 43B 9AUJ277ZmpCTr07NszoEC0DCFggzixU2
Troubleshooting
For issues with accessing the file server, view the access log on the RN at: /var/log/nginx/packet-recorder.access.log.
For archiving errors returned by the query RPC, view the RN floodlight log at: /var/log/floodlight/floodlight.log. Error, warning, and info logs relating to this feature in the floodlight log have log ID prefix RNQRY. The floodlight log can be filtered by this prefix to find logs relating to this feature for troubleshooting purposes.
For issues with the setup of the archive volume or directory, view the storage.service log using the following command in RN bash: sudo journalctl -u storage.
RPC Errors
The following are new RPC errors that can be returned by a query if the local storage method is selected:
400: Invalid max result size, value exceeds total size of storage volume
If this occurs for a packet query where the max-result-size parameter has been configured, please try decreasing the value of this parameter. The value of the parameter should not exceed the size of the volume. The size of the volume is 10GB or 50GB based on the platform used (VM or physical RN).
If this occurs for a query where either the max-result-size parameter has not been configured or is not configurable, please try rebooting the RN.
500: Query file archive is unavailable, see floodlight log for details
This error is due to the file archive being unhealthy in some capacity. The error log associated with this error has log ID RNQRY7006. The exception included in this log indicates the specific issue resulting in the archive being considered unhealthy. Please try rebooting the RN.
Note:For issues where rebooting the device is suggested, the assumption is that a user has made changes to the archive in some way (e.g., reduced the volume size, removed the volume, moved the archive directory). If this is not the case, please create a support bundle and contact Arista TAC.
Considerations
If a file that the RN is trying to delete is currently open, whether a user manually opened it or the system opened it because it is currently being downloaded, the delete operation will fail. In this case, the RN does not retry deleting the file, but the system removes it from the stored files list. So, it will appear as if the file has been deleted, but in fact, it has not been deleted. Restarting the RN will re-initialize the stored files list based on the contents of the archive directory, at which point the removed file is tracked again in the list.
Users can manually delete files from the archive directory. However, this is not recommended unless necessary, as it causes the stored files list to be out of sync with the filesystem for a short time. Manually deleted files are removed from the stored files list within an hour of being deleted.
Users can store other files within the archive directory if desired. However, this is not recommended unless necessary since the RN only manages query files within this directory. The RN ignores all other files within this directory, so they will never be deleted or modified in any way. This is problematic if these files occupy a large amount of space on the volume, which may lead to queries failing due to a lack of available space.
This chapter describes configuring the managed services provided by the DANZ Monitoring Fabric (DMF) Service Node Appliance.
Overview
The DANZ Monitoring Fabric (DMF) Service Node has multiple interfaces connected to traffic for processing and analysis. Each interface can be programmed independently to provide any supported managed-service actions.
To create a managed service, identify a switch interface connected to the service node, specify the service action, and configure the service action options.
Configure a DMF policy to use the managed service by name. This action causes the Controller to forward traffic the policy selects to the service node. The processed traffic is returned to the monitoring fabric using the same interface and sent to the tools (delivery interfaces) defined in the DMF policy.
If the traffic volume the policy selects is too much for a single service node interface, define an LAG on the switch connected to the service node, then use the LAG interface when defining the managed service. All service node interfaces connected to the LAG are configured to perform the same action. The traffic the policy selects is automatically load-balanced among the LAG member interfaces and distributes the return traffic similarly.
Restriction: The Application Identification features described in the Managed Service section are Early Field Trial (EFT) and should not be used in production networks.
Administer Managed Services using the GUI
This release introduces a redesigned Managed Services dashboard, replacing the former interface.
To view, edit, or create DANZ Monitoring Fabric (DMF) managed services, select the Monitoring > Managed Services option.
Figure 1. Managed Services
This dashboard displays the Service Node appliance devices connected to the DMF Controller and the services configured on the Controller.
Overview and Summary
The Managed Services dashboard comprises the following tabs:
Devices (Default view)
Managed Services
Service Stats
Application Identification - EFT
GTP Correlation Profiles
IPFIX Templates
The following summary provides a high-level consolidation of the core modules used to manage and monitor network traffic. It outlines the logical progression from initial service configuration and action assignment to real-time performance analysis and data standardization. Understanding these integrated workflows enables more effective traffic processing, optimization, and troubleshooting, and supports consistent data reporting across the network infrastructure.
Managed Services and Actions
The Managed Services module serves as the core configuration hub for traffic processing, defining specific behaviors through the Actions menu, which includes specialized tools for:
Traffic Optimization: Slicing packets based on length or session data.
Performance Analysis: Configuring TCP Analysis and monitoring delivery metrics.
Rule-Based Processing: Implementing Post Service Match Rules, which become available after establishing a Header Strip action.
Performance Monitoring
The Service Stats tab transitions from configuration to active monitoring. It provides two primary methods for evaluating service health:
Quantitative Data: A detailed table displaying packet counts, byte counts, and bit rates (RX/TX/Applied).
Visual Trends: A real-time chart that updates every 10 seconds, allowing for the comparison of Applied, TX, and RX series across specific metrics.
Template Management
The IPFIX Templates section enables standardized data export. Defining specific Keys and Fields maintains consistent data structures for external reporting. The interface supports full lifecycle management of these templates, including creation, modification, and bulk deletion.
Operational Efficiency
Throughout these modules, consistent Table Actions streamline the administrative workflow:
The Duplicate and Edit functions reduce manual entry by allowing existing configurations to serve as templates.
Filtering and Multi-select capabilities enable the management of complex environments with multiple service nodes and interfaces.
The Export and Refresh tools ensure that data is always accessible and up to date for troubleshooting and documentation.
Devices
Navigate to Monitoring > Managed Services > Devices.
The Devices dashboard displays a table of devices including the Name, Description, MAC Address, IP Address, Connected, SKU, Serial Number, Zerotouch State, and Interface Count.
Use this dashboard to view and configure devices.
Figure 2. Managed Services - Devices Dashboard
Configure Devices
Add: Select + Add Device to open the creation menu. Enter the Device Name, Description, and MAC Address.
Edit: Select the box for a device and select Edit to modify its configuration. The menu displays the current device data. Update the necessary fields and select Save to apply changes.
Delete: Check one or more devices in the table and select Delete to remove them.
Export: Select Export to download the device data in CSV or JSON format to the local downloads folder.
Refresh: The system automatically refreshes data every 60 seconds. Hover over Refresh to view the time remaining until the next update. Select Refresh to update the data immediately.
Add Device
Select + Add Device to open the creation menu. Enter the Device Name, Description, and MAC Address.
Figure 3. Add Device
Figure 4. Add Device Parameters
Edit Device
Select the box for a device and select Edit to modify its configuration. The menu displays the current device data. Update the necessary fields and select Save to apply changes.
Figure 5. Edit Device Details
Delete Device(s)
Check one or more devices in the table and select Delete to remove them. Confirm the deletion.
Figure 6. Delete Devices
Refresh: By default, the system refreshes data every 60 seconds. Hovering over Refresh displays the time remaining until the next update. When required, click Refresh to update the data immediately.
Figure 7. Refresh
Devices Details
View Device Details
Select a device name in the table to access the device details view.
Default View: The system opens the Interfaces dashboard by default.
Device Switching: Use the device drop-down menu to switch between devices.
Figure 8. View Device Details
Interfaces
The Interfaces dashboard lists all interfaces associated with the selected device. The table includes the following columns:
Interface
Config Flags
State Flags
Advertised Features
Supported Features
Current Features
Fabric Connection
Interface Number
Hardware Address
Figure 9. Interface Dashboard
Interface Stats
Select Interface Stats to view interface statistics. The table displays the following columns:
Interface Name
RX Packet Count
RX Bytes
RX Packet Drop Count
RX Error Count
TX Packet Count
TX Bytes
TX Packet Drop Count
TX Error Count
Figure 10. Interface Stats Dashboard
Storage Health
Select Storage Health to view the device's storage status. This view displays health indicators for:
Status
Controllers
Virtual Drives
It also includes a detailed table of Physical Drives.
Figure 11. Storage Health Dashboard
Recording Tab
Select Recording to view storage recording details. This view includes tables for:
Packet Mount
Recording Threads
Index Mount
Figure 12. Recording Dashboard
Managed Services
The Managed Services dashboard displays a table of configured services and includes the following columns:
Name
Description
Actions
Installed
Service Interface
Service Node Interfaces
Policies
Use this dashboard to view and configure Managed Services.
Figure 13. Managed Services Dashboard
Figure 14. Managed Services Dashboard - Populated
Configure a Managed Service
Create - Select + Create Managed Service to open the creation menu. Enter the Managed Service Name, Description, and configure the interfaces. Configure either a Service Interface or Service Node Interfaces.
Figure 15. Create Managed Service
Configure Service Interface
Configure the Service Interface by selecting the Switch and its Interface.
Figure 16. Configure Service Interface
Configure Service Node Interface
Install a managed service directly on a switch-less Service Node (SN) by configuring the Service Node Interface. Select the Service Node and the specific Interface.
Configure multiple Service Node Interfaces for a single Managed Service to install the same service across multiple interfaces.
Figure 17. Configure Service Node Interface
Select Save to apply the configuration.
Configure Managed Service Actions
Configure actions using the Managed Services Details window. This drawer opens automatically after creating a Managed Service, or by selecting a Managed Service name from the table.
The UI supports the following actions:
Deduplication
App ID Filter
Filter
To configure an action, select + Add Action in Managed Services Details to open the setup menu.
Figure 18. Add Action
Aggregate GRETAP
Select Aggregate GRETAP from the Action drop-down to open the configuration menu. Configure the following fields:
Delivery Interface
UDP Port (Default: 4739)
Collector IP
MTU (Default: 1500)
Idle Timeout (Default: 5000 ms)
Figure 19. Configure Aggregate GRETAP
Aggregated sFlow
Select Aggregate sFlow from the Action drop-down to open the configuration menu. Configure the following fields:
Delivery Interface
UDP Port (Default: 4739)
Collector IP
MTU (Default: 1500)
Idle Timeout (Default: 5000 ms)
Figure 20. Configure Aggregated sFlow
App ID
Application Identification - Early Field Trial (EFT)
Select AppID from the Action drop-down to open the configuration menu. Configure the following fields:
Delivery Interface
UDP Port (Default: 4739)
Collector IP
MTU (Default: 1500)
Figure 21. Configure APP ID
App ID Filter Action
Application Identification Filter - Early Field Trial (EFT)
Select App ID Filter from the Action drop-down to open the configuration menu. Configure the following fields:
Filter
App Categories
App Names
Figure 22. Configure App ID Filter Action
Deduplication Action
Select Deduplication from the Action drop-down to open the configuration menu. Configure the following fields:
Packet Handling
Window Size
Anchor
Offset
Figure 23. Configure Deduplication Action
The DANZ Monitoring Fabric (DMF) Service Node enhances the efficiency of network monitoring tools by eliminating duplicate packets. Duplicate packets can be introduced into the out-of-band monitoring data stream by receiving the same flow from multiple TAP or SPAN ports spread across the production network. Deduplication eliminates these duplicate packets and enables more efficient use of passive monitoring tools.
The DMF Service Node provides four modes of deduplication for different types of duplicate packets.
Full packet deduplication: deduplicates incoming packets that are identical at the L3/L4 layers.
Payload routed packet deduplication: Routed Deduplication with L4 Payload and Salt. This skips TCP/UDP headers in hashing, allowing duplicate detection based on identical payloads even if header fields like timestamps differ.
Routed packet deduplication: as packets traverse an IP network, the MAC address changes from hop to hop. Routed packet deduplication enables users to match packet contents starting from the L3 header.
L4 Payload Start: NATed packet deduplication: to perform NATed deduplication, the service node compares packets in the configured window that are identical starting from the L4 payload. To use NATed packet deduplication, perform the following fields as required:
Offset: the number of bytes from the anchor where the deduplication check begins.
Window Size: The time window in which the service looks for duplicate packets is configurable. Select a value among these choices: 2ms (the default), 4ms, 6ms, and 8ms.
GUI Configuration
Choose the desired managed service from the Managed Service Dashboard and select + Add Action.
Figure 24. Add Action - Deduplication
Use the Configured Managed Service Action (name) and enter a sequence number and select Deduplication from the drop-down Action list.
Offset - Applies to Anchor Offset function and uses the number of bytes from the anchor where the deduplication check begins.
Full Packet - All bytes in packet.
Header Routed Packet - Header routed frame.
Payload Routed Packet - Payload routed frame.
Window Size - Applies to all Packet Handling functions. Configure the time window where the service looks for duplicate packets. Select a value from these choices: 2ms (the default), 4ms, 6ms, and 8ms.
Figure 26. Action: - Deduplication Parameters
After completing the necessary configuration, select Save followed by Done in the Managed Service Details window.
Routed Deduplication with L4 Payload and Salt
The DMF Controller supports a payload-routed-packet deduplication option. This feature allows service nodes to combine the L4 payload start anchor point with routed salt (L3 IP addresses, L4 source/destination ports, and other L3 header fields).
Anchoring the deduplication range at the L4 payload start ensures that frames with identical payload content are identified as duplicates, even when TCP headers—such as frequently updated timestamps—differ. This method effectively skips TCP/UDP headers and options during hash computation.
Functional Benefits
Optimized Bandwidth: The Service Node identifies and drops retransmitted packets containing identical data, preventing unnecessary traffic from reaching monitoring tools.
Precise Flow Identification: Using routed salt ensures the system maintains visibility into L3 and L4 flow identifiers while focusing the deduplication logic on the payload.
Reduced Processing Overhead: Monitoring tools receive only unique payload content, lowering the computational load on analytics engines.
Configuration and Functional Impact
Adding the payload-routed-packet option provides granular control over how the system processes retransmitted frames.
Deduplication Logic: The Service Node uses the same routed salt to maintain flow identification, but shifts the hash computation range to start after the transport-layer headers.
Data Integrity: DMF identifies frames as duplicates only when their payloads match within the same flow, ensuring that distinct data remains intact while redundant retransmissions are filtered.
Backward Compatibility: DMF maintains existing deduplication behavior under the name header-routed-packet. Automatic configuration migration ensures that current deployments maintain their existing behavior upon upgrade without manual intervention.
All dedup supporting Service Nodes support Routed Deduplication with L4 Payload and Salt.
Configuration
In the deduplication managed service configuration, the implementation replaces the single routed-packet option with two distinct settings for the region command. To access these options, first define a deduplication action using the [index] action dedup command within the config-managed-srv mode.
The region command defines the scope of the hash computation using the following four values:
full-packet: Performs complete packet deduplication starting from the beginning of the frame.
header-routed-packet: Enables L4 header-based routed deduplication using routed salt (L3 IP addresses and L4 ports).
payload-routed-packet: Enables L4 payload-based routed deduplication using routed salt, effectively skipping transport-layer headers to focus on payload content.
anchor-offset: Supports advanced custom configurations for specific byte ranges. This option facilitates L4 header and payload-based deduplication without incorporating salted fields.
Note: The existing show command structure supports this enhancement.
Filter Action
Select Filter from the Action drop-down to open the configuration menu. Configure a Default Action and optionally a Forwarding VLAN for forward actions.
The default action applies to all ACL rules upon installation but can be overridden for individual rules.
Select Add ACL to configure multiple ACL rules.
Figure 27. Configure Filter Action
Figure 28. Configure Filter Action with ACLs
Flow Latency and Drops
Select Flow Latency and Drops from the Action drop-down. The configuration menu has the following tabs:
Info
Tap Point Pair
Tap Point Multicast Groups
Info Tab
Select the Info tab to open the configuration menu. Configure the following fields:
Delivery Interface
Collector IP
UDP Port
MTU
Delivery Requirement
Report Types
Figure 29. Configure Flow Latency and Drops
Tap Point Pair Tab
Select the Tap Point Pair tab to view the configuration table. The table displays the following columns:
Source Type
Source Name
Destination Type
Destination Name
Figure 30. Configure Tap Point Pair
Add Entry: Select Add to open the configuration menu.
Source Type: The Source Type drop-down includes the following options:
Filter Interface
Policy Name
Filter Interface Group
Name Selection: The Name drop-down options update dynamically based on the selected Source Type.
Figure 31. Configure Tap Point Pair Filter Interface
Tap Point Multicast Groups Tab
Select the Tap Point Multicast Groups tab to access the configuration.
Use the multi-select drop-down to integrate Multicast groups with Flow Latency and Drops actions.
Figure 32. Configure Tap Point Multicast Groups
GTP Correlation
Select GTP Correlation from the Action drop-down to open the configuration menu. Configure the following fields:
Idle Timeout
Sampling Rate
Correlation Profile
APN Group
Rewrite Option
Drop Control
Figure 33. Configuring GTP Correlation
Correlation Profile Selection
Select one of the following options for the Correlation Profile. The menu will update dynamically to display the corresponding drop-down field:
IMSI Group
IMEI Group
MSISDN Group
Header Strip
Select Header Strip from the Action drop-down to open the configuration menu. Configure the Anchor, Offset, and L2 Header options.
L2 Header Options
Choose one of the following configurations for the L2 Header:
Option 1: Use Existing L2 Header
Assumes an existing L2 header is present.
Retains the existing Source MAC, Destination MAC, and EtherType without modification.
Option 2: Inherit from Stripped L2 Header
Inherits Source MAC and Destination MAC from the stripped L2 header.
Select one of the following EtherType options:
Use original EtherType
Insert Inet EtherType
Use custom EtherType
Option 3: Add Custom L2 Header
Adds a completely custom L2 header.
Select one of the following EtherType options:
Insert Inet EtherType
Add custom EtherType
Figure 34. Configure Header Strip
Header Strip Actions
Decapsulation Actions
The Action drop-down includes the following specific header decapsulation types:
16-Byte Header Decap
ERSPAN Header Decap
Geneve Header Decap
L3 MPLS Header Decap
LISP Header Decap
VNTag Header Decap
VXLAN Header Decap
Select any of these options to open the corresponding configuration menu. Use the menu to configure the Drop Decap setting.
This action removes specific headers from the traffic selected by the associated DANZ Monitoring Fabric (DMF) policy. Alternatively, define custom header stripping based on the starting position of the Layer-3 header, the Layer-4 header, the Layer-4 payload, or the first byte in the packet.
Use the following decap actions isolated from the header-strip configuration stanza:
decap-erspan: remove the Encapsulated Remote Switch Port Analyzer (ERSPAN) header.
decap-cisco-fabric-path: remove the Cisco FabricPath protocol header.
decap-l3-mpls: remove the Layer-3 Multi-protocol Label Switching (MPLS) header.
decap-lisp: remove the LISP header.
decap-vxlan [udp-portvxlan port]: remove the Virtual Extensible LAN (VXLAN) header.
decap-geneve: remove the Geneve header.
Note:For the Header Strip and Decap actions, apply post-service rules to select traffic after stripping the original headers.
To customize the header-strip action, use one of the following keywords to strip up to the specified location in each packet:
l3-header-start
l4-header-start
l4-payload-start
packet-start
Input a positive integer representing the offset from which the strip action begins. When omitting an offset, the header stripping starts from the first byte in the packet.
GUI Configuration
Under the Action drop-down, select the desired Header Strip action.
Figure 35. Managed Service Action - Header Strip
After assigning the required actions to the header stripping service, select Next or Post-Service Match.
The system displays the Post Service Match page, used in conjunction with the header strip service action.
Figure 36. Managed Service Action - Header Strip VXLAN Header DecapFigure 37. Create Managed Service: Post Service Match for Header Strip Action
IPFIX
Select IPFIX from the Action drop-down to open the configuration menu. Configure the following fields:
Delivery Interface
UDP Port
Collector IP
MTU
Inactive Timeout
Active Timeout
Template Timeout
IPFIX Template
Figure 38. Configure IPFIX
Mask
Mask
Select Mask from the Action drop-down to open the configuration menu. Configure the following fields:
Match Pattern
Anchor
Offset
Match Characters
Match Characters Configuration
Enable Match Characters to display and configure the following additional fields:
Mask Start
Mask End
Figure 39. Configure Header Strip Actions
NetFlow
Select NetFlow from the Action drop-down to open the configuration menu. Configure the following fields:
Delivery Interface
UDP Port
Collector IP
MTU
Inactive Timeout
Active Timeout
Flows
Per-Interface Records
Figure 40. Configure NetFlow
Pattern Drop
Select Pattern Drop from the Action drop-down to open the configuration menu. Configure the following fields:
Pattern
Anchor
Offset
Figure 41. Configure Pattern Drop
Pattern Match
Select Pattern Match from the Action drop-down to open the configuration menu. Configure the following fields:
Pattern
Anchor
Offset
Figure 42. Configure Pattern Match
Record
Select Record from the Action drop-down to open the configuration menu.
Regex Session
Select Regex Session from the Action drop-down to open the configuration menu. Configure the following fields:
Anchor
Offset
Pattern
IP Protocol
Regex Session Table Size
TCP Idle Timeout
UDP Timeout
Figure 43. Configure Regex Session
SIP Mask
Select SIP Mask from the Action drop-down to open the configuration menu. Configure the following fields:
UDP Port
TCP Port
Figure 44. Configure SIP Mask
Sample
Select Sample from the Action drop-down to open the configuration menu. Configure the following fields:
Max Tokens
Tokens Per Refresh
Figure 45. Configure Sample
Session Slice
Select Session Slice from the Action drop-down to open the configuration menu. Configure the following fields:
Slice After (based on number of Packets)
Idle Timeout
Figure 46. Configure Session Slice
Slice
Select Slice from the Action drop-down to open the configuration menu. Configure the following fields:
Insert Original Packet length
Anchor
Offset
Figure 47. Configure Slice
Timestamp
Select Timestamp from the Action drop-down to open the configuration menu.
TCP Analysis
Select TCP Analysis from the Action drop-down to open the configuration menu. Configure the following fields:
Delivery Interface
UDP Port
Collector IP
MTU
Include Dapper Elements
Max Samples
Figure 48. Configure TCP Analysis
UDP Replication
Select UDP Replication from the Action drop-down to open the configuration menu. Configure the following fields:
After completing the necessary configuration, select Save.
The saved configuration can be found under Actions within the Managed Services Details.
Post Service Match
Post Service Match Rules
Prerequisite: Add a Header Strip action or one of the Header Strip Decap actions before configuring Post Service Match Rules.
Figure 49. Configure Post Service Match Rules
Add Rule Availability
After adding a Header Strip or Header Strip Decap action, the Add Rule option appears in two locations:
The left navigation panel.
The center of the empty state dashboard.
Figure 50. Configure Rule Availability
Configuring a Post Service Match Rule
Select Add Rule to open the Post Service Match Rule configuration dialog.
Figure 51. Configure Post Service Match Rule
Rule Listing
After successfully configuring the Post Service Match Rule, the rule appears in the table within the Managed Services Details.
Figure 52. Managed Services Details - Post Service Match Rule
Figure 53. Managed Services Details
Figure 54. Table Actions
Edit
Select a Managed Service row and then Edit to modify its configuration. The window automatically populates with the selected Managed Service's data. After making the necessary changes, select Save.
Figure 55. Edit Managed Service - Service Interface
Figure 56. Edit Managed Service - Service Node Interface
Monitor Service Stats
Select one or more Managed Service rows and select Monitor Service Stats to view service statistics and performance metrics in the Service Stats tab. This is crucial for troubleshooting and performance monitoring.
Figure 57. Monitor Service Stats
Figure 58. Monitor Managed Service
Duplicate
Select a Managed Service row and select Duplicate to create a new Managed Service with the same configuration as the selected one. The new service can then be modified. This is useful for quickly creating similar Managed Service configurations.
Figure 59. Duplicate Managed Service
Delete
Select one or more Managed Service rows and select Delete to remove the selected Managed Service(s).
Figure 60. Delete Managed Service
Export
Select Export to download the Managed Services data content in CSV or JSON format to the browser's download folder.
Refresh
By default, the system refreshes data every 60 seconds. Hover over Refresh to view the time remaining until the next update. When required, select Refresh to update the data immediately.
Managed Service Details
To view the details of a Managed Service, select the name of the desired service from the table. This opens the details drawer, which prominently displays the following key information:
Managed Service Name
Description
Service Interface / Service Node Interface
Modifying Configuration
Select Edit to open the configuration window and modify the selected Managed Service settings.
Monitoring Statistics
Select Monitor Service Stats to navigate directly to the statistics monitoring view for this specific Managed Service.
Actions Section
This section allows users to manage the actions associated with the Managed Service. Capabilities include:
Viewing action details
Expanding or collapsing details
Adding new actions
Editing existing actions
Deleting existing actions
Figure 61. Managed Service Details
Figure 62. Managed Service Details
Aggregate GRETAP
Select Aggregate GRETAP from the Action drop-down to open the configuration menu. Configure the following fields:
Delivery Interface - select from a list of available interfaces.
UDP Port - Default value of4739
Collector IP - Configure an IP address as the Collector IP.
MTU - Default value of 1500
Idle Timeout - Default value of5000 ms
Figure 63. Configure Aggregate GRETAP
Aggregated sFlow
Select Aggregate sFlow from the Action drop-down to open the configuration menu. Configure the following fields:
Delivery Interface
UDP Port (Default: 4739)
Collector IP
MTU (Default: 1500)
Idle Timeout (Default: 5000 ms)
Figure 64. Configure Aggregated sFlow
App ID
Application Identification - Early Field Trial (EFT)
Restriction: The Application Identification features described in the Managed Service section are Early Field Trial (EFT) and should not be used in production networks.
The DANZ Monitoring Fabric (DMF) Application Identification feature allows for the monitoring of applications identified with Deep Packet Inspection (DPI) into packet flows received via filter interfaces and generates IPFIX flow records. These IPFIX flow records are transmitted to a configured collector device via the L3 delivery interface. The feature provides a filtering function by forwarding or dropping packets from specific applications before sending the packet to the analysis tools.
Note: Application identification is supported on Service Nodes (DCA-DM-SC and DCA-DM-SC2) and Service Nodes (DCA-DM-SDL and DCA-DM-SEL).
Select App ID from the Action drop-down to open the configuration menu. Configure the following fields:
Delivery Interface
UDP Port (Default: 4739)
Collector IP
MTU (Default: 1500)
Figure 65. Configure APP ID
App ID Filter
Application Identification Filter - Early Field Trial (EFT)
Restriction: The Application Identification features described in the Managed Service section are Early Field Trial (EFT) and should not be used in production networks.
Select App ID Filter from the Action drop-down to open the configuration menu. Configure the following fields:
Filter
App Categories
App Names
Figure 66. Configure App ID Filter Action
Configuring App ID and AP ID Filter
App ID and App ID Filter are in the Managed Service workflow. Perform the following steps to complete the configuration.
Navigate to the Monitoring > Managed Services page. Select the table action + icon to add a new managed service.
Figure 67. Managed Services - App ID
Configure the Name, Switch, and Interface inputs in the Info step.
Figure 68. Info Step
In the Actions step, select the + icon to add a new managed service action.
Figure 69. Add App ID Action
To Add the App ID Action, select App ID from the action selection input:
Figure 70. Select App ID
Fill in the Delivery Interface, Collector IP, UDP Port, and MTU inputs and select Append to include the action in the managed service:
Figure 71. Delivery Interface
To add the App ID Filter Action, select App ID Filter from the action selection input:
Figure 72. Select App ID Filter
Select the Filter input as Forward or Drop action:
Figure 73. Select Filter Input
Use the App Names section to add app names.
Select a category from the App Categories list and select App Names from the list to include in the App ID Filter.
Repeat the above step to add more app names as necessary.
Figure 74. Associate App Names
The selected App Names and App Categories are now listed. Use the x icon to remove any app names, if necessary:
Figure 75. Application Names
Select Save to add the action to the managed service and Save to save the managed service.
For existing managed services, add App ID or App ID Filter using the Edit workflow of a managed service.
Deduplication
The DANZ Monitoring Fabric (DMF) Service Node enhances the efficiency of network monitoring tools by eliminating duplicate packets. Duplicate packets can be introduced into the out-of-band monitoring data stream by receiving the same flow from multiple TAP or SPAN ports spread across the production network. Deduplication eliminates these duplicate packets and enables more efficient use of passive monitoring tools.
The DMF Service Node provides four modes of deduplication for different types of duplicate packets.
Full packet deduplication: deduplicates incoming packets that are identical at the L3/L4 layers.
Payload routed packet deduplication: Routed Deduplication with L4 Payload and Salt. This skips TCP/UDP headers in hashing, allowing duplicate detection based on identical payloads even if header fields like timestamps differ.
Routed packet deduplication: as packets traverse an IP network, the MAC address changes from hop to hop. Routed packet deduplication enables users to match packet contents starting from the L3 header.
L4 Payload Start: NATed packet deduplication: to perform NATed deduplication, the service node compares packets in the configured window that are identical starting from the L4 payload. To use NATed packet deduplication, perform the following fields as required:
Offset: the number of bytes from the anchor where the deduplication check begins.
Window Size: The time window in which the service looks for duplicate packets is configurable. Select a value among these choices: 2ms (the default), 4ms, 6ms, and 8ms.
GUI Configuration
Choose the desired managed service from the Managed Service Dashboard and select + Add Action.
Figure 76. Add Action - Deduplication
Use the Configured Managed Service Action (name) and enter a sequence number and select Deduplication from the drop-down Action list.
Offset: Applies to Anchor Offset function and is the number of bytes from the anchor where the deduplication check begins.
Full Packet: All bytes in packet.
Header Routed Packet: Header routed frame.
Payload Routed Packet: Payload routed frame.
Window Size: Applies to all Packet Handling functions. The time window in which the service looks for duplicate packets is configurable. Select a value among these choices: 2ms (the default), 4ms, 6ms, and 8ms.
Figure 78. Action: - Deduplication Parameters
After completing the necessary configuration, select Save followed by Done in the Managed Service Details window.
Filter Action
Select Filter from the Action drop-down to open the configuration menu. Configure a Default Action and optionally a Forwarding VLAN for forward actions.
The default action applies to all ACL rules upon installation but can be overridden for individual rules.
Select Add ACL to configure multiple ACL rules.
Figure 79. Configure Filter Action
Figure 80. Configure Filter Action with ACLs
Enter a Sequence number.
Select an IP protocol from the IP Protocol list.
Select an action, Drop or Forward, from the Action list.
Enter a forwarding VLAN number in the Push VLAN field.
Enter a source IP address in the Source IP Address field.
Enter a source IP mask in the Source IP Mask field.
Add a source port number ora range of source ports using the Source Port menu.
Enter a destination IP address in the Dest. IP Address field.
Enter a destination IP mask in the Dest. IP Mask field.
Add a source port number ora range of source ports using the Dest. Port menu.
Click Save to save the configuration on the switch.
Flow Latency and Drops
Latency and drop information help determine if there is a loss in a particular flow and where the loss occurred. A Service Node action configured as a DANZ Monitoring Fabric (DMF) managed service has multiple separate taps or spans in the production network and can measure the latency of a flow traversing through any pair of these points. It can also detect packet drops between any two points in the network if the packet only appears on one point within a specified time frame, currently set to 200ms.
Latency and drop analysis require Precision Time Protocol (PTP) time-stamped packets. The DMF PTP timestamping feature applies these timestamps as packets enter the monitoring fabric.
The Service Node accumulates latency values by flow and sends IPFIX data records with each flow's 5-tuple and ingress and egress identifiers. It sends IPFIX data records to the Analytics Node after collecting a specified number of values for a flow or when a timeout occurs for the flow entry. The threshold count is 10,000 packets, and the flow timeout is 4 seconds.
Note: This feature is only supported in push-per-filter mode. Only basic statistics, such as min, max, and mean, are available. These statistics are the computed difference in timestamps, or latency, between two tap point pairs of packets within a flow.
Use the DMF Analytics Node to build custom dashboards to view and check the data.
Attention: The flow diff latency and drop analysis feature is switch dependent and requires PTP timestamping. It is supported on 7280R3 and 7800R3 switches.
Select Flow Latency and Drops from the Action drop-down. The configuration menu is divided into the following tabs:
Info
Tap Point Pair
Tap Point Multicast Groups
Info Tab
Select the Info tab to open the configuration menu. Configure the following fields:
Delivery Interface
Collector IP
UDP Port
MTU
Delivery Requirement
Report Types
Figure 81. Configure Flow Latency and Drops
Tap Point Pair Tab
Select the Tap Point Pair tab to view the configuration table. The table displays the following columns:
Source Type
Source Name
Destination Type
Destination Name
Figure 82. Configure Tap Point Pair
Add Entry: Select Add to open the configuration menu.
Source Type: The Source Type drop-down includes the following options:
Filter Interface
Policy Name
Filter Interface Group
Name Selection: The Name drop-down options update dynamically based on the selected Source Type.
Figure 83. Configure Tap Point Pair Filter Interface
Tap Point Multicast Groups Tab
Select the Tap Point Multicast Groups tab to access the configuration.
Use the multi-select drop-down to integrate Multicast groups with Flow Latency and Drops actions.
Configuring Flow Latency and Drops
Configure Flow Diff Latency and Drop Analysis using the DANZ Monitoring Fabric (DMF) GUI.
Delivery Requirement & Report Types
The Flow Latency and Drops action within Managed Services includes two new configuration options:
Delivery Requirement
All Destinations (default): The system drops packets unless every destination tap point receives the packet.
Any Destination: The system drops packets only if no destination tap point receives the packet.
Figure 84. Delivery Requirement
Report Types
Latency Report: This toggle enables or disables latency reports (default: enabled).
Drop Report: This toggle enables or disables drop reports (default: enabled).
Both the action configuration form and the action summary view display these fields.
Figure 85. Report Types - Latency and Drop Report
Procedure Summary
To access the Flow Latency and Drops action, navigate to:
Select Header Strip from the Action drop-down to open the configuration menu. Configure the Anchor, Offset, and L2 Header options.
L2 Header Options
Choose one of the following configurations for the L2 Header:
Option 1: Use Existing L2 Header
Assumes an existing L2 header is present.
Retains the existing Source MAC, Destination MAC, and EtherType without modification.
Option 2: Inherit from Stripped L2 Header
Inherits Source MAC and Destination MAC from the stripped L2 header.
Select one of the following EtherType options:
Use original EtherType
Insert Inet EtherType
Use custom EtherType
Option 3: Add Custom L2 Header
Adds a completely custom L2 header.
Select one of the following EtherType options:
Insert Inet EtherType
Add custom EtherType
Figure 90. Configure Header Strip
Header Strip Actions
Decapsulation Actions
The Action drop-down includes the following specific header decapsulation types:
16-Byte Header Decap
ERSPAN Header Decap
Geneve Header Decap
L3 MPLS Header Decap
LISP Header Decap
VNTag Header Decap
VXLAN Header Decap
Select any of these options to open the corresponding configuration menu. Use the menu to configure the Drop Decap setting.
This action removes specific headers from the traffic selected by the associated DANZ Monitoring Fabric (DMF) policy. Alternatively, define custom header stripping based on the starting position of the Layer-3 header, the Layer-4 header, the Layer-4 payload, or the first byte in the packet.
Use the following decap actions isolated from the header-strip configuration stanza:
decap-erspan: remove the Encapsulated Remote Switch Port Analyzer (ERSPAN) header.
decap-cisco-fabric-path: remove the Cisco FabricPath protocol header.
decap-l3-mpls: remove the Layer-3 Multi-protocol Label Switching (MPLS) header.
decap-lisp: remove the LISP header.
decap-vxlan [udp-portvxlan port]: remove the Virtual Extensible LAN (VXLAN) header.
decap-geneve: remove the Geneve header.
Note:For the Header Strip and Decap actions, apply post-service rules to select traffic after stripping the original headers.
To customize the header-strip action, use one of the following keywords to strip up to the specified location in each packet:
l3-header-start
l4-header-start
l4-payload-start
packet-start
Input a positive integer representing the offset from which the strip action begins. When omitting an offset, the header stripping starts from the first byte in the packet.
GUI Configuration
Under the Action drop-down, select the desired Header Strip action.
Figure 91. Managed Service Action - Header Strip
After assigning the required actions to the header stripping service, select Next or Post-Service Match.
The system displays the Post Service Match page, used in conjunction with the header strip service action.
Select IPFIX from the Action drop-down to open the configuration menu. Configure the following fields:
Delivery Interface
UDP Port
Collector IP
MTU
Inactive Timeout
Active Timeout
Template Timeout
IPFIX Template
Figure 93. Configure IPFIX
IPFIX and Netflow Actions
IP Flow Information Export (IP FIX), also known as NetFlow v10, is an IETF standard defined in RFC 7011. The IPFIX generator (agent) gathers and transmits information about flows, sets of packets that contain all the keys specified by the IPFIX template. The generator observes the packets received in each flow and forwards the information to the IPFIX collector (server) in the form as a flowset.
Starting with the DANZ Monitoring Fabric (DMF)-7.1.0 release, NetFlow v9 (Cisco proprietary) and IPFIX/NetFlow v10 are both supported. Configuration of the IPFIX managed service is similar to configuration for earlier versions of NetFlow except for the UDP port definition. NetFlow v5 collectors typically listen over UDP port 2055, while IFPIX collectors listen over UDP port 4739.
NetFlow records are typically exported using User Datagram Protocol (UDP) and collected using a flow collector. For a NetFlow service, the service node takes incoming traffic and generates NetFlow records. The service node drops the original packets, and the generated flow records, containing metadata about each flow, are forwarded out of the service node interface.
IPFIX Templates
The IPFIX Templates dashboard provides a table view of all configured templates. The table includes the following columns:
Name
Template ID
Keys
Fields
Figure 94. IPFIX Templates Dashboard
The IPFIX template consists of the key element IDs representing IP flow, field element IDs representing actions the exporter has to perform over IP flows matching key element IDs, the template ID number for uniqueness, collector information, and eviction timers.
To define a template, configure keys of interest representing the IP flow and fields that identify the values measured by the exporter, the exporter information, and the eviction timers. To define the template, select the Monitoring > Managed Service > IPFIX Template option from the DANZ Monitoring Fabric (DMF) GUI or enter the ipfix-template template-name command in config mode, replacing template-name with a unique identifier for the template instance.
IPFIX Keys
Use an IPFIX key to specify the characteristics of the traffic to monitor, such as source and destination MAC or IP address, VLAN ID, Layer-4 port number, and QoS marking. The generator includes flows in a flow set having all the attributes specified by the keys in the template applied. The flowset is updated only for packets that have all the specified attributes. If a single key is missing, the packet is ignored.
To see a listing of the keys supported in the current release of the DANZ Monitoring Fabric (DMF) Service Node, select the Monitoring > Managed Service > IPFIX Template option from the DMF GUI or type help key in config-ipxif-template submode.
The following are the keys supported in the current release:
Table 2. Supported Keys
destination-ipv4-address
ip-version
destination-ipv6-address
policy-vlan-id
destination-mac-address
records-per-dmf-interface
destination-transport-port
source-ipv4-address
dot1q-priority
source-ipv6-address
dot1q-vlan-id
source-mac-address
ethernet-type
source-transport-port
icmp-type-code-ipv4
tcp-source-port (introduced in DMF 8.8)
icmp-type-code-ipv6
tcp-destination-port (introduced in DMF 8.8)
ip-class-of-service
udp-source-port (introduced in DMF 8.8)
ip-diff-serv-code-point
udp-destination-port (introduced DMF 8.8)
ip-protocol-identifier
vlan id
ip-ttl
Note: The policy-vlan-id and records-per-dmf-interface keys are Arista Proprietary Flow elements. The policy-vlan-id key helps to query per-policy flow information at Arista Analytics-node (Collector) in push-per-policy deployment mode. The records-per-dmf-interface key helps to identify filter interfaces tapping the traffic. The following limitations apply at the time of IPFIX template creation:
The Controller will not allow the key combination of source-mac-address and records-per-dmf-interface in push-per-policy mode.
The Controller will not allow the key combinations of policy-vlan-id and records-per-dmf-interface in push-per-filter mode.
IPFIX Fields
A field defines each value updated for the packets the generator receives that match the specified keys. For example, include fields in the template to record the number of packets, the largest and smallest packet sizes, or the start and end times of the flows.
To see a listing of the fields supported in the current release of the DANZ Monitoring Fabric (DMF) Service Node, select the Monitoring > Managed Service > IPFIX Template option from the DMF GUI, or type help in config-ipxif-template submode. The following are the fields supported:
flow-end-milliseconds
flow-end-reason
flow-end-seconds
flow-start-milliseconds
flow-start-seconds
maximum-ip-total-length
maximum-layer2-total-length
maximum-ttl
minimum-ip-total-length
minimum-layer2-total-length
minimum-ttl
octet-delta-count
packet-delta-count
tcp-control-bits
Active and Inactive Timers
After the number of minutes specified by the active timer, the flow set is closed and forwarded to the IPFIX collector. The default active timer is one minute. During the number of seconds set by the inactive timer, if no packets that match the flow definition are received, the flow set is closed and forwarded without waiting for the active timer to expire. The default value for the inactive time is 15 seconds.
Example Flowset
The following is a Wireshark view of an IPFIX flowset.
Figure 95. Example IPFIX Flowset in Wireshark
The following is a running-config that shows the IPFIX template used to generate this flowset.
Example IPFIX Template
! ipfix-template
ipfix-template Perf-temp
template-id 22222
key destination-ipv4-address
key destination-transport-port
key dot1q-vlan-id
key source-ipv4-address
key source-transport-port
field flow-end-milliseconds
field flow-end-reason
field flow-start-milliseconds
field maximum-ttl
field minimum-ttl
field packet-delta-count
Define an IPFIX Template
To define an IPFIX template, perform the following steps:
Select the Monitoring > Managed Services option.
On the DMF Managed Services page, select IPFIX Templates.
The system displays the IPFIX Templates section.
Figure 96. IPFIX Templates
To create a new template, select the provision (+) icon in the IPFIX Templates section.
Figure 97. Create IPFIX Template
To add an IPFIX key to the template, select Keys. The system displays the following dialog.
Figure 98. Select IPFIX Keys
Select the keys to add to the template.
To add an IPFIX field to the template, select the Settings control in the Fields section. The system displays the following dialog:
Figure 99. Select IPFIX Fields
Select each field to add to the template.
On the Create IPFIX Template page, select Save.
The new template is added to the IPFIX Templates table, with each key and field listed in the appropriate column. Use this customized template to apply when defining an IPFIX-managed service.
Define an IPFIX Service Action
Select IPFIX from the Action selection list on the Create Managed Service > Action page.
Figure 100. Selecting IPFIX Action in Create Managed Service
Enter the following required configuration details:
Assign a delivery interface.
Configure the collector IP address.
Identify the IPFIX template.
Select from the following optional parameters:
Inactive timeout - the interval of inactivity that marks a flow inactive.
Active timeout - length of time between each IPFIX flows for a specific flow.
Source IP - source address to use for the IPFIX flowsets.
UDP port - UDP port to use for sending IPFIX flowsets.
MTU - MTU to use for sending IPFIX flowsets.
After completing the configuration, select Next, and then select Save.
Mask
The Masking action can hide specific characters in a packet, such as a password or credit card number, based on offsets from different anchors and by matching characters using regular (regex) expressions. The Mask Service Action applies the specified mask to the matched packet region.
Select Mask from the Action drop-down to open the configuration menu. Configure the following fields:
Match Pattern
Anchor
Offset
Match Characters
Match Characters Configuration
Enable Match Characters to display and configure the following additional fields:
Select NetFlow from the Action drop-down to open the configuration menu. Configure the following fields:
Delivery Interface
UDP Port
Collector IP
MTU
Inactive Timeout
Active Timeout
Flows
Per-Interface Records
Figure 102. Configure NetFlow
Pattern Drop
Select Pattern Drop from the Action drop-down to open the configuration menu. Configure the following fields:
Pattern
Anchor
Offset
Figure 103. Configure Pattern Drop
The Pattern Drop Service Action drops matching traffic.
Pattern matching allows content-based filtering beyond Layer-2, Layer-3, or Layer-4 Headers. This functionality allows filtering on the following packet fields and values:
URLs and user agents in the HTTP header
Patterns in BitTorrent packets
Encapsulation headers for specific parameters, including GTP, VXLAN, and VN-Tag
Subscriber device IP (user-endpoint IP)
Pattern matching allows Session-aware Adaptive Packet Filtering (SAPF) to identify HTTPS transactions on non-standard SSL ports. It can filter custom applications and separate control traffic from user data traffic.
Pattern matching is also helpful in enforcing IT policies, such as identifying hosts using unsupported operating systems or dropping unsupported traffic. For example, the Windows OS version can be identified and filtered based on the user-agent field in the HTTP header. The user-agent field may appear at variable offsets, so a regular expression search is used to identify the specified value wherever it occurs in the packet.
GUI Configuration
Figure 104. Create Managed Service: Pattern Drop Action
Pattern Match
Select Pattern Match from the Action drop-down to open the configuration menu. Configure the following fields:
Pattern
Anchor
Offset
The pattern-match service action matches and forwards matching traffic and is similar to the pattern-drop service action.
Pattern matching allows content-based filtering beyond Layer-2, Layer-3, or Layer-4 Headers. This functionality allows filtering on the following packet fields and values:
URLs and user agents in the HTTP header
patterns in BitTorrent packets
encapsulation headers for specific parameters including, GTP, VXLAN, and VN-Tag
subscriber device IP (user-endpoint IP)
Pattern matching allows Session Aware Adaptive Packet Filtering and can identify HTTPS transactions on non-standard SSL ports. It can filter custom applications and can separate control traffic from user data traffic.
Pattern matching allows Session-aware Adaptive Packet Filtering (SAPF) to identify HTTPS transactions on non-standard SSL ports. It can filter custom applications and separate control traffic from user data traffic.
Pattern matching is also helpful in enforcing IT policies, such as identifying hosts using unsupported operating systems or dropping unsupported traffic. For example, the Windows OS version can be identified and filtered based on the user-agent field in the HTTP header. The user-agent field may appear at variable offsets, so a regular expression search is used to identify the specified value wherever it occurs in the packet.
GUI Configuration
Figure 105. Configure Pattern Match
Packet Recording
This release adds a new managed service action, called Record, to the Service Node (SN). This action enables packet recording using an SN similar to a Recorder Node (RN) and supports basic packet recording and querying capabilities.
The SN accumulates packets, writes packet data to local storage disks, and indexes information based on configured fields. Various query types retrieve recorded packets, analyze traffic patterns, and investigate network issues.
The Controller includes the managed service action record to enable packet recording on an SN.
The DCA-DM-SNR660 SKU exclusively supports the record action, as this hardware includes the dedicated storage disks required for packet capture. Consequently, this feature is available on switchless physical units but remains unsupported on virtual SNs.
Table 3. Support Matrix
Deployment Type
Support Status - Record Feature
Physical SN (Switchless)
Supported
Virtual SN
Not Supported
Important: Ensure the hardware is a physical SNR660 model; virtual instances lack the disk architecture to handle recording tasks.
Select Record from the Action drop-down to open the configuration menu.
Figure 106. Select Record
Configuring Packet Recording
Configure Recording Settings
The DMF GUI provides an interface to configure recording settings on SNs. Customize indexing fields when adding or editing an SN through the Managed Services dashboard.
Add Device with Recording Settings
Navigate to Monitoring > Managed Services > Devices.
Select Add Device to open the configuration panel.
Fill in the required fields:
Device Name
Description (optional)
MAC Address
Set Configure Recording Settings to On to define indexing for recorded packets (default: off).
Select the desired Indexing fields from the drop-down menu.
Commit the changes using Save.
Note:
By default, the system pre-selects the following indexing fields: VLAN 1, IPv4 Src., IPv4 Dest., IPv6 Src., IPv6 Dest., IP Protocol, Port Src., and Port Dest.
The Configure Recording Settings selection controls only the indexing configuration for packet recording; it does not enable or disable the recording action itself.
Figure 107. Add Device Recording Settings
Figure 108. Indexing Fields
Edit Recording Settings
To modify recording settings on an existing SN:
Navigate to Monitoring > Managed Services > Devices.
Highlight the device from the table and choose the Edit action.
Enable Configure Recording Settings to enter the configuration mode.
Modify the indexing fields as needed.
Commit the changes using Save.
Figure 109. Edit Recording Settings
View Record Indexing
The Record Indexing column in the Devices table displays the enabled indexing fields for each device. Search and filter devices based on their specific indexing configuration.
Figure 110. View Record Indexing
Edit Configuration (Recording)
Access global recording configuration settings from the Managed Services dashboard (Monitoring > Managed Services) via Edit Configuration. These settings apply to both Recorder Nodes and SNs.
Figure 111. Query Service Nodes
Figure 112. Edit Configuration
View Query History
Select View Query History on the Managed Services dashboard (Monitoring > Managed Services) to navigate to the Query History dashboard. This area displays query records for both Recorder Nodes and SNs.
Figure 113. Query Service Nodes
Query Service Node
Select Query Service Nodes on the Managed Services dashboard (Monitoring > Managed Services) to open the Query Recording Devices window. Both Recorder Nodes and SNs are available in the Recording Devices drop-down. When selecting both types, the UI enables only the options supported by both device types.
Additional Parameters: Fail Fast, Dedup Time Window
Figure 114. Query Recording Devices
Device Details Recording Tab
A Recording tab is available in the device details dashboard (Monitoring > Managed Services > Devices > Device Name). This section displays the following recording-related information for the selected device:
Storage: Index Disk and Packet Disk utilization.
Recording Threads: CPU Core, Cached Files, Max Cached Files, and Tracked Files.
Packet Mount / Index Mount: Volume, mount point, file system, and health status.
Figure 115. Recording Tab
Service Action Invalid Alert: If issues occur with a record action on a Managed Service, a Service Action Invalid warning alert appears in the notification area (bell icon in the header).
Select the bell icon to view alert details.
Regex Session
Select Regex Session from the Action drop-down to open the configuration menu. Configure the following fields:
Anchor
Offset
Pattern
IP Protocol
Regex Session Table Size
TCP Idle Timeout
UDP Timeout
Figure 116. Configure Regex Session
SIP Mask
Select SIP Mask from the Action drop-down to open the configuration menu. Configure the following fields:
UDP Port
TCP Port
Figure 117. Configure SIP Mask
Sample
Select Sample from the Action drop-down to open the configuration menu. Configure the following fields:
Max Tokens
Tokens Per Refresh
Figure 118. Configure Sample
Session Slice
Session-slice keeps track of TCP and UDP sessions (distinguished by source and destination IP address and port) and counts the number of packets sent in each direction (client-to-server and vice versa). After recognizing the session, the action transmits a user-configured number of packets to the tool node.
For TCP packets, session-slice tracks the number of packets sent in each direction after establishing the TCP handshake. Slicing begins after the packet count in a direction has reached the configured threshold in both directions.
For UDP packets, slicing begins after reaching the configured threshold in either direction.
By default, session-slice will operate on both TCP and UDP sessions but is configurable to operate on only one or the other.
Note: The count of packets in one direction may exceed the user-configured threshold because fewer packets have arrived in the other direction. Counts in both directions must be greater than or equal to the threshold before dropping packets.
Refer to the DANZ Monitoring Fabric (DMF) Verified Scale Guide for session-slicing performance numbers.
Select Session Slice from the Action drop-down to open the configuration menu. Configure the following fields:
Slice After (based on number of Packets)
Idle Timeout
Figure 119. Configure Session Slice
Configure Session Slicing
Perform the following steps to configure session slicing.
Navigate to Monitoring > Managed Services > Managed Services.
Figure 120. Managed Services
Select the + icon to create a new managed service.
Figure 121. Create Managed Service
Enter a Name for the managed service.
Figure 122. Managed Service Name
Select a Switch from the drop-down list.
Figure 123. Manage Service Switch
Select an Interface from the drop-down list.
Figure 124. Managed Service Interface Added
Click Save.
Select the + icon to select a managed service action.
Figure 125. Configure Managed Service Action List
Choose Session Slice from the drop-down list. Adjust the Slice After and Idle Timeout parameters, as required.
Figure 126. Configure Managed Service Action Session Slice
Select Append and then Save to add the session slice managed service.
Slice
The Slice Service Action slices the given number of packets based on the specified starting point in the packet. Packet slicing reduces packet size to increase processing and monitoring throughput. Passive monitoring tools process fewer bits while maintaining each packet's vital, relevant portions. Packet slicing can significantly increase the capacity of forensic recording tools. Apply packet slicing by specifying the number of bytes to forward based on an offset from the following locations in the packet:
Packet start
L3 header start
L4 header start
L4 payload start
Note: The slicing service can currently only parse TCP/UDP/ICMP/ICMP6/GRE/SCTP/ESP protocols.
Select Slice from the Action drop-down to open the configuration menu. Configure the following fields:
Insert Original Packet length
Anchor
Offset
Figure 127. Configure Slice
This page allows inserting an additional header containing the original header length.
TCP Analysis (Dapper)
The Dapper action (derived from Brown University research) identifies TCP session issues by measuring specific connection attributes. This analysis determines whether performance degradation stems from the client, server, or network devices. All current Service Node platforms support the Dapper action.
Figure 128. Dapper Action
The action monitors TCP session packets, tracks extensive statistics, and periodically exports them via IPFIX records to a collector. For every session direction, the system generates:
One Start-Session record.
One or more Data records.
One End-Session record.
The collector evaluates these statistics, utilizing six distinct IPFIX templates to diagnose the root cause of network problems.
Start-Session Record
The system transmits the Start-Session record for each direction immediately after session establishment (upon Client ACK). This record captures the initial attributes negotiated during the handshake.
Table 4. Template 6668, IPv4 Start-Session
Offset
ID
Dapper Field
Type
Description
0
8
ipv4_src
ipv4Address
IPv4 source address
1
12
ipv4_dst
ipv4Address
IPv4 destination address
2
7
tcp_src
unsigned16
TCP source address
3
11
tcp_dst
unsigned16
TCP destination address
4
239
biflow_direction
unsigned8
Direction of session (0=unknown, 1=initiator, 2=reverseInitiator)
5
152
start_milliseconds
dateTimeMilliseconds
Session start time in milliseconds since epoch
6
218
tcp_syn_total_count
unsigned64
Number of TCP packets with SYN flag sent (0 if we did not see initiation)
7
32774
window_size
unsigned32
Initial window size in octets
8
32771
expected_flight_size
unsigned32
Expected flight size in octets
9
32822
switch_mac
macAddress
Ethernet address of filter switch
10
32823
switch_port
unsigned16
Port on filter switch
11
6
tcp_control_bits
unsigned16
TCP flags set during initiation (SYN, SYN | ACK, unset if we did not see initiation)
Table 5. Template 6669, IPv6 Start-Session
Offset
ID
Dapper Field
Type
Description
0
27
ipv6_src
ipv6Address
IPv6 source address
1
28
ipv6_dst
ipv6Address
IPv6 destination address
2
7
tcp_src
unsigned16
TCP source address
3
11
tcp_dst
unsigned16
TCP destination address
4
239
biflow_direction
unsigned8
Direction of session (0=unknown, 1=initiator, 2=reverseInitiator)
5
152
start_milliseconds
dateTimeMilliseconds
Session start time in milliseconds since epoch
6
218
tcp_syn_total_count
unsigned64
Number of TCP packets with SYN flag sent (0 if we did not see initiation)
7
32774
window_size
unsigned32
Initial window size in octets
8
32771
expected_flight_size
unsigned32
Expected flight size in octets
9
32822
switch_mac
macAddress
Ethernet address of filter switch
10
32823
switch_port
unsigned16
Port on filter switch
11
6
tcp_control_bits
unsigned16
TCP flags set during initiation (SYN, SYN | ACK, unset if we did not see initiation)
Data Record
The system transmits Data records for each session direction at periodic intervals. It analyzes packet streams up to a configured limit to match data/acknowledgment pairs, recording delay and size metrics. Most statistics reflect averages derived from the sample period.
Note: The system reports fields marked with an asterisk (*) only when the dapper compatibility setting is false.
Table 6. Template 6666, IPv4 Data
Offset
ID
Dapper Field
Type
Description
0
8
ipv4_src
ipv4Address
IPv4 source address
1
12
ipv4_dst
ipv4Address
IPv4 destination address
2
7
tcp_src
unsigned16
TCP source address
3
11
tcp_dst
unsigned16
TCP destination address
4
239
biflow_direction
unsigned8
Direction of session (0=unknown, 1=initiator, 2=reverseInitiator)
5
32768
report_timer
unsigned32
The number of samples in round-trip-time calculations (matching sync/ack pairs)
6
32828
reaction_time
unsigned32
Average time between receiving an ACK and the next data packet
7
32770
flight_size
unsigned32
Average flight size over samples in octets
8
32771
expected_flight_size
unsigned32
Average expected flight size in octets
9
32829
round_trip_time
unsigned32
Average round-trip-time between sync and matching ack in microseconds
10
32773
retransmissions
unsigned32
Counter of retransmitted packets received during sample period
11
32774
window_size
unsigned32
Average window size reported during sample period in octets
12
32775
ecn
unsigned32
Counter of how many packets had ECN flag set during sample period
13*
2
packet_delta
unsigned32
Number of packets received during sample period
14*
1
octet_delta
unsigned64
Number of bytes received during sample period
15*
32830
first_rtt
unsigned32
First round trip time in period in microseconds
16*
32831
min_rtt
unsigned32
Minimum round trip time during period in microseconds
17*
32832
max_rtt
unsigned32
Maximum round time trip during period in microseconds
17*
32833
rtt_standard_deviation
unsigned32
The standard deviation of round trip time measurements during period
18*
32834
recovery_time
unsigned32
Average time between an initial data packet and a retransmission
Table 7. Template 6667, IPv6 Data
Offset
ID
Dapper Field
Type
Description
0
27
ipv6_src
ipv4Address
IPv4 source address
1
28
ipv6_dst
ipv4Address
IPv4 destination address
2
7
tcp_src
unsigned16
TCP source address
3
11
tcp_dst
unsigned16
TCP destination address
4
239
biflow_direction
unsigned8
Direction of session (0=unknown, 1=initiator, 2=reverseInitiator)
5
32768
report_timer
unsigned32
The number of samples in round-trip-time calculations (matching sync/ack pairs)
6
32828
reaction_time
unsigned32
Average time between receiving an ACK and the next data packet
7
32770
flight_size
unsigned32
Average flight size over samples in octets
8
32771
expected_flight_size
unsigned32
Average expected flight size in octets
9
32829
round_trip_time
unsigned32
Average round-trip-time between sync and matching ack in microseconds
10
32773
retransmissions
unsigned32
Counter of retransmitted packets received during sample period
11
32774
window_size
unsigned32
Average window size reported during sample period in octets
12
32775
ecn
unsigned32
Counter of how many packets had ECN flag set during sample period
13*
2
packet_delta
unsigned32
Number of packets received during sample period
14*
1
octet_delta
unsigned64
Number of bytes received during sample period
15*
32830
first_rtt
unsigned32
First round trip time in period in microseconds
16*
32831
min_rtt
unsigned32
Minimum round trip time during period in microseconds
17*
32832
max_rtt
unsigned32
Maximum round time trip during period in microseconds
17*
32833
rtt_standard_deviation
unsigned32
The standard deviation of round trip time measurements during period
18*
32834
recovery_time
unsigned32
Average time between an initial data packet and a retransmission
End-Session Record
Upon session completion (via FIN, RST, or inactivity timeout), the system transmits an End-Session record for each direction containing the termination reason. If statistics remain pending at the end of the session, the system generates a final Data record before the End-Session record
Table 8. Template 6670, IPv4 end-session:
Offset
ID
Dapper Field
Type
Description
0
8
ipv4_src
ipv4Address
IPv4 source address
1
12
ipv4_dst
ipv4Address
IPv4 destination address
2
7
tcp_src
unsigned16
TCP source address
3
11
tcp_dst
unsigned16
TCP destination address
4
239
biflow_direction
unsigned8
Direction of session (0=unknown, 1=initiator, 2=reverseInitiator)
5
152
end_milliseconds
dateTimeMilliseconds
Session end time in milliseconds since epoch
6
32822
switch_mac
macAddress
Ethernet address of filter switch
7
32823
switch_port
unsigned16
Port on filter switch
8
6
tcp_control_bits
unsigned16
TCP flags set during termination (FIN, RST, unset if session was timed out)
Table 9. Template 6671, IPv6 end-session
Offset
ID
Dapper Field
Type
Description
0
27
ipv6_src
ipv6Address
IPv4 source address
1
28
ipv6_dst
ipv6Address
IPv4 destination address
2
7
tcp_src
unsigned16
TCP source address
3
11
tcp_dst
unsigned16
TCP destination address
4
239
biflow_direction
unsigned8
Direction of session (0=unknown, 1=initiator, 2=reverseInitiator)
5
152
end_milliseconds
dateTimeMilliseconds
Session end time in milliseconds since epoch
6
32822
switch_mac
macAddress
Ethernet address of filter switch
7
32823
switch_port
unsigned16
Port on filter switch
8
6
tcp_control_bits
unsigned16
TCP flags set during termination (FIN, RST, unset if session was timed out)
Select TCP Analysis from the Action drop-down to open the configuration menu. Configure the following fields:
Delivery Interface
UDP Port
Collector IP
MTU
Include Dapper Elements
Max Samples
Figure 129. Configure TCP Analysis
Timestamp
Select Timestamp from the Action drop-down to open the configuration menu.
The UDP-replication service action copies UDP messages, such as Syslog or NetFlow messages, and sends the copied packets to a new destination IP address.
Configure a rate limit when enabling UDP replication. When upgrading from a version of DANZ Monitoring Fabric (DMF) before release 6.3.1, the UDP-replication configuration is not applied until a rate limit is applied to the delivery interface.
The following example illustrates applying a rate limit to a delivery interface used for UDP replication:
Note: No other service action can be applied after a UDP-replication service action.
GUI Configuration
Select UDP Replication from the Action drop-down to open the configuration menu. Configure the following fields:
Delivery Interface
Input Packet Destination IP
Output Packet Destination IP
Figure 131. Managed Services - UDP Replication
Use the UDP-replication service to copy UDP traffic, such as Syslog messages or NetFlow packets, and send the copied packets to a new destination IP address. This function sends traffic to more destination syslog servers or NetFlow collectors than would otherwise be allowed.
Add the IP address in the dialog that appears.
Adding Multiple Output IPs
Figure 132. Configure Output Packet Destination IP
For the header-strip service action only, configure the policy rules for matching traffic after applying the header-strip service action. After completing pages 1-4, select Append and enable the checkbox to apply the policy.
Select Save to save the managed service.
Monitoring Managed Services
To identify managed services bound to a service node interface and the health status of the respective interface, use the following commands:
controller-1# show managed-service-device SN-Name interfaces
controller-1# show managed-service-device SN-Name stats
For example, the following command shows the managed services handled by the Service Node Interface (SNI):
Note:The show managed-service-deviceSN-NamestatsManaged-service-name command filters the statistics of a specific managed service.
The Load column shows no, low, moderate, high, and critical health indicators. These health indicators are represented by green, yellow, and red under DANZ Monitoring Fabric > Managed Services > Devices > Service Stats. They reflect the processor load on the service node interface at that instant but do not show the bandwidth of the respective data port (SNI) handling traffic, as shown in the following sample snapshot of the Service Stats output.
Figure 133. Service Node Interface Load Indicator
Multiple Services Per Service Node Interface
View the information in Monitoring > Managed Services > Devices > Service Stats.
Figure 134. Service Stats
Service Stats
The Service Stats dashboard provides performance visibility through two distinct views: Table View and Chart View.
Table View
The table displays detailed service statistics, automatically refreshing every minute. It supports exporting data in JSON or CSV format.
Columns displayed:
Service Node Name
Interface Name
Service Name
Action
Load
RX Packet Count / RX Byte Count / RX Bit Rate
TX Packet Count / TX Byte Count / TX Bit Rate
Applied Packets / Applied Bytes / Applied Bit Rate
Chart View
The chart view displays a time series chart for a single managed service. Data points on the chart are updated every 10 seconds to provide near real-time visualization of performance trends.
Figure 135. Service Stats
Filter
The Service Stats view includes filtering options to narrow down the displayed data. Filters are available for:
Managed Services
Service Nodes
Both filters support multi-select, allowing multiple options to be selected simultaneously. Filters can be cleared as needed to reset the view.
Figure 136. Service Stats Filters
Chart View
The chart visualizes data for a single managed service, updating every 10 seconds. It displays a time series line graph based on a selected metric, such as:
Packet Count
Byte Count
Bit Rate
Figure 137. Chart View
Chart Filter
Figure 138. Chart Filters
The chart includes a single filter for selecting a managed service. A service can be selected, or the filter cleared as needed.
Figure 139. Single Filters
Upon selecting a metric, the chart displays three distinct line series:
Applied
TX
RX
GTP Correlation Profiles
In mobile core environments (LTE/5G), traffic is encapsulated using the GPRS Tunneling Protocol (GTP), which separates signaling (GTP-C) from user data (GTP-U). GTP Correlation Profiles within the DANZ Monitoring Fabric (DMF) enable the Service Node to associate these two planes statefully.
By correlating the Tunnel Endpoint Identifier (TEID) from the user plane with the International Mobile Subscriber Identity (IMSI) from the control plane, the fabric provides subscriber-aware visibility.
A GTP Correlation Profile defines how the Service Node processes and tracks mobile sessions:
Stateful Session Mapping - The Service Node monitors GTP-C "Create Session" requests to build a real-time mapping table of IMSI, MSISDN, and TEID.
Flow Pinning (Sticky Load Balancing) - Ensures that all GTP-C and GTP-U packets belonging to a specific subscriber session are forwarded to the same tool port or monitoring probe, maintaining session integrity for analytics.
Filtering and Whitelisting - Enables granular traffic steering based on subscriber identity, such as monitoring only "VIP" IMSIs or specific APNs.
Multi-Interface Support - Supports correlation across various 3GPP interfaces, including S11, S5/S8, and S1-U.
Figure 140. Configuring GTP Correlation Profiles
Adding Access Point Name (APN) Groups
Use the following steps to add APN Groups to the configuration:
Click the + in the APN Groups section.
Figure 141. Creating APN Group
Enter a name for the APN Group. (Required)
Click the + to configure an APN Group Rule.
Figure 142. Configuring an APN Group Rule
Select a Sequence number and an Operation as either Drop or Match.
Enter a Value using 0 to 50 APN digits, letters, or periods. Optionally, preface the value with an asterisk (*) to match by wildcard.
Click Append to add the APN Group Rule.
Click Save to save the configuration.
Adding International Mobile Equipment Identity (IMEI) Groups
Use the following steps to add IMEI Groups to the configuration:
Click the + in the IMEI Groups section.
Figure 143. Create IMEI Group
Enter a name for the IMEI Group. (Required)
Click the + to configure an IMEI Group Rule.
Figure 144. Adding an IMEI Group Rule
Select a Sequence number and an Operation as either Drop or Match.
Enter a Value using 14 digit IMEI or 0 to 13 digits followed by an asterisk (*) to match by wildcard.
Click Append to add the IMEI Group Rule.
Click Save to save the configuration.
Adding International Mobile Subscriber Identity (IMSI) Groups
Use the following steps to add IMSI Groups to the configuration:
Click the + in the IMSI Groups section.
Figure 145. Create an IMSI Group
Enter a name for the IMSI Group. (Required)
Click the + to configure an IMEI Group Rule.
Figure 146. Creating an IMSI Group Rule
Select a Sequence number and an Operation as either Drop or Match.
Enter a Value using 15-16 digit IMSI number or 0 to 15 digits followed by an asterisk (*) to match by wildcard.
Click Append to add the IMSI Group Rule.
Click Save to save the configuration.
Adding Mobile Station International Subscriber Directory Number (MSISDN) Groups
Use the following steps to add MSISDN Groups to the configuration:
Click the + in the MSISDN Groups section.
Figure 147. Creating an MSISDN Group
Enter a name for the MSISDN Group. (Required)
Click the + to configure an MSISDN Group Rule.
Figure 148. Adding an MSISDN Group Rule
Select a Sequence number and an Operation as either Drop or Match.
Enter a Value using 1-15 digit MSISDN number or 0 to 15 digits followed by an asterisk (*) to match by wildcard.
Click Append to add the MSISDN Group Rule.
Click Save to save the configuration.
IPFIX Templates
The IPFIX Templates dashboard provides a table view of all configured templates. The table includes the following columns:
Name
Template ID
Keys
Fields
Figure 149. IPFIX Templates Dashboard
Configure an IPFIX Template
To add an IPFIX Template, select Create IPFIX Template. This opens a menu containing fields for the template Name, Template ID, Keys, and Fields.
After completing the configuration, select Save to apply the changes.
Figure 150. Create IPFIX Template
Table Actions
Figure 151. Table Actions
The following operations are available for managing IPFIX Templates:
Edit: Selecting a row enables the Edit control, which opens the Edit IPFIX Template window. The window automatically populates with the selected template's data. After modifying the configuration, select Save.
Delete: Selecting one or more rows enables the Delete control. Selecting this button opens a confirmation window; select Yes to remove the chosen templates.
Export: Select Export to download the IPFIX Template data in CSV or JSON format.
Refresh: The system refreshes data every 60 seconds by default. Hover over Refresh to view the time remaining until the next update. To update the data immediately, select Refresh.
Figure 152. Edit IPFIX Template
Selecting a row enables the Edit control, which opens the Edit IPFIX Template window. After modifying the configuration, select Save.
Delete
Select a template from the dashboard list. Select Delete and confirm the deletion.
Figure 153. Delete Template from List
Figure 154. Delete IPFIX Templates
Refresh
Hover over Refresh to view the time remaining until the next update. To update the data immediately, select Refresh.
Figure 155. Refresh Data
Configuring the Arista Analytics Node
Arista Analytics Node capabilities are enhanced to handle NetFlow V5/V9 and IPFIX Packets. All these flow data are represented with the Netflow index.
Note: NetFlow flow record generation is enhanced for selecting VXLAN traffic. For VXLAN traffic, flow processing is based on inner headers, with the VNI as part of the key for flow lookup because IP addresses can overlap between VNIs.
Figure 156. NetFlow Managed Service
NetFlow records are exported using User Datagram Protocol (UDP) to one or more specified NetFlow collectors. Use the DMF Service Node to configure the NetFlow collector IP address and the destination UDP port. The default UDP port is 2055.
Note: No other service action, except the UDP replication service, can be applied after a NetFlow service action because part of the NetFlow action is to drop the packets.
From the Arista Analytics Node dashboard, apply filter rules to display specific flow information.
The following are the options available on this page:
Delivery interface: interface to use for delivering NetFlow records to collectors.
Note: The next-hop address must be resolved for the service to be active.
Collector IP: identify the NetFlow collector IP address.
Inactive timeout: use the inactive-timeout command to configure the interval of inactivity before NetFlow times out. The default is 15 seconds.
Source IP: specify a source IP address to use as the source of the NetFlow packets.
Active timeout: use active timeout to configure a period that a NetFlow can be generated continuously before it is automatically terminated. The default is one minute.
UDP port: change the UDP port number used for the NetFlow packets. The default is 2055.
Flows: specify the maximum number of NetFlow packets allowed. The allowed range is 32768 to 1048576. The default is 262144.
Per-interface records: identify the filter interface where the NetFlow packets were originally received. This information can be used to identify the hop-by-hop path from the filter interface to the NetFlow collector.
MTU: change the Maximum Transmission Unit (MTU) used for NetFlow packets.
Navigate to the Monitoring > Managed Services page.
Figure 158. DMF Managed Services
Under the Managed Services section, select the + icon to create a new managed service. Go to the Actions, and select the Sample option in the Action drop-down. Enter values for Max tokens and Tokens per refresh.
Figure 159. Configure Managed Service Action
Select Append and then Save.
Post Service Match Rule
Post Service Match
Post Service Match Rules
Prerequisite: Add a Header Strip action or one of the Header Strip Decap actions before configuring Post Service Match Rules.
Figure 160. Configure Post Service Match Rules
Add Rule Availability
After adding a Header Strip or Header Strip Decap action, the Add Rule option appears in two locations:
The left navigation panel.
The center of the empty state dashboard.
Figure 161. Configure Rule Availability
Configuring a Post Service Match Rule
Select Add Rule to open the Post Service Match Rule configuration dialog.
Figure 162. Configure Post Service Match Rule
Rule Listing
After successfully configuring the Post Service Match Rule, the rule appears in the table within the Managed Services Details.
Figure 163. Managed Services Details - Post Service Match Rule
Figure 164. Managed Services Details
Figure 165. Table Actions
Edit
Select a Managed Service row and then Edit to modify its configuration. The window will automatically populate with the selected Managed Service's data. After making the necessary changes, select Save.
Figure 166. Edit Managed Service - Service Interface
Figure 167. Edit Managed Service - Service Node Interface
Configure Filter Managed Service Action
The Filter Managed Service Action filters packets on the Service Node (SN) interface and supports optional VLAN tagging. Utilizing ACL rules, the system forwards or drops matched traffic. Traffic tagged with a VLAN exits the interface (Tx) after processing through the action chain. VLAN tagging specifically facilitates traffic steering in Switch-less SN deployments, where the forwarding plane relies on VLANs. This configuration produces no functional impact when the SN connects directly to a DMF switch within the fabric.
The feature is compatible with all platforms.
Configuration
Managed service configuration supports Service Nodes connected to a DMF switch or operating in switch-less mode. The configured interface type (installation point) determines how the service is programmed. Configure the Filter Managed Service Action feature using the CLI.A Summary section provides a consolidated reference of the Filter Managed Service Action specifications, configuration limits, and operational behaviors.
Navigate to Monitoring > Managed Services.
Figure 168. Managed Services
Select Managed Services, and then + Create Managed Service.
Figure 169. Create Managed Service
Configure a Service Interface
Configuring the Service Interface triggers a validation sequence. The system verifies that the SN connects to a DMF switch and that a policy utilizes the service. The Controller proceeds with installation on the SN only after passing these checks.
Navigate to Interfaces, and choose Service Interface to begin the setup.
Configuration Steps
Initialize: Provide a Name and an optional Description for the interface.
Map: Designate a Switch Name and Interface Name from the available drop-down menus.
Finalize: Select Save to commit the configuration.
Figure 170. Configure a Service Interface
Creating the Managed Service opens the Managed Service Details window, which displays the Service Interface.
Figure 171. Managed Service Details
Configure a Service Node Interface
Configuring the Service Node Interface designates the managed service for switch-less operation. This mode applies when the SN lacks a physical connection to a DMF switch or when the Controller is unable to discover the link. The Controller installs the managed service immediately upon valid configuration, without requiring policy association. However, any DMF policy configured with this service will fail due to the absence of a reachability path from the fabric.
Access Edit within the Managed Service Details window to modify existing interface settings.
Configuration Steps
Navigate: Go to Interfaces and choose Service Node Interfaces.
Populate: Link the Service Node and Interface fields from the available drop-down menus.
Manage Entries: Use + Add to include additional entries or the trash icon to remove them.
Finalize: Select Save to commit the configuration.
Figure 172. Configure a Service Node Interface
Creating the Service Node Interface(s) updates the Managed Service Details window to display the new entries.
Figure 173. Managed Service Details
Configure Filter Action: The Filter action functions at any position within the managed service action sequence. Configuring it as the initial action filters and tags traffic on the service node interface, passing only the filtered traffic to subsequent actions in the chain.
Access + Add Action within the Managed Service Details window to begin the configuration.
Configuration Steps
Initialize: Define the Managed Service Action by assigning a Sequence number.
Define Action: Designate Filter as the primary Action type.
Specify Parameters: Provide a Push VLAN if required, and set the forwarding behavior to Forward or Drop.
Establish Logic: Configuring Filter as the initial action in the sequence filters and tags traffic on the Service Node Interface, passing only the filtered traffic to subsequent actions.
Finalize: Select Save to commit the configuration.
Figure 174. Filter Action
ACL Rule Management
The system supports precise traffic filtering via ACL rules. Construct high-priority Drop rules to block specific patterns, such as UDP traffic from a designated subnet.
Configuration Steps
Initialize: Within the Configure Managed Service Action window, access + Add ACL.
Define Parameters: Enter the following networking details for the filter:
Source IP Address and Mask
Source Port
Destination IP Address and Mask
Destination Port
Manage Entries: Use + Add ACL to include additional rules or the trash icon to remove them.
Finalize: Select Save to commit the configuration.
Figure 175. Drop Rules
Wildcard Rules and Rule Expansion
Wildcard rules facilitate matching on any IP address or port number. The configuration uses 0.0.0.0 to match any IPv4 address and ::0 to match any IPv6 address. Additionally, the any keyword matches any IPv4 or IPv6 packet.
Omitting specific parameters triggers the following default behaviors:
Port Match: Omitting a port match defaults to the entire port range.
IP Field: Leaving the IP address field blank in the GUI implies a wildcard match.
Max Rule Limits
Each Filter managed service action supports a maximum of 2048 rules. The Controller calculates this total based on the expanded runtime rules rather than the initial configuration lines.
The system tracks IPv4 and IPv6 rules in separate tables, with each table supporting 1024 entries post-expansion.
Capacity Handling: Upon reaching table capacity, the system halts the installation of further expanded rules.
Overflow Behavior: The Controller skips any configured rule if the corresponding table (IPv4 or IPv6) is full.
Viewing Statistics
To view the Managed Services Service Stats select the desired link in the Managed Services dashboard.
Figure 176. Managed Service Name
Select Monitor Service Stats within the Managed Service Details window to view Service Stats.
Figure 177. Service Stats
Applied statistics vary based on the specific action type. For the Filter action, these metrics quantify the traffic matching the configured ACL rules:
Applied Packets: Total count of matched packets.
Applied Bytes: Total count of matched bytes.
Applied Bit Rate: Current data rate of matched traffic.
Summary
The following table provides a consolidated reference of the Filter Managed Service Action specifications, configuration limits, and operational behaviors.
Table 10. Filter Managed Service Action Specifications
Feature
Specification
Primary Function
Packet filtering via ACL rules with optional VLAN tagging.
GUI Capabilities
Supports ACL rule creation and modification. Blank IP fields in the interface denote wildcard matches. Allows insertion of high-priority drop rules.
Deployment Modes
Supported on both Switch-Connected and Switch-less Service Nodes.
Rule Capacity
2048 Total Rules (1024 IPv4 / 1024 IPv6) post-runtime expansion.
The Controller expands wildcard rules into specific IPv4/IPv6 and TCP/UDP entries.
VLAN Behavior
VLAN tags persist on egress (Tx), facilitating traffic steering in switch-less deployments.
Configure a Backup Managed Service
Redundancy of Managed Services in the same DMF Policy
This method enables a second managed service to function as a backup within the same DANZ Monitoring Fabric (DMF) policy. The backup service activates only if the primary service becomes unavailable. It can reside on the same service node or core switch, or across different nodes and switches.
Note: Transitioning from active to backup managed service requires reprogramming switches and associated managed appliances. This reprogramming, done seamlessly, will result in a slight traffic loss.
To assign a managed service as a backup service in a DANZ Monitoring Fabric (DMF) policy, perform the following steps:
Select Monitoring > Policies and select + Create Policy.
Figure 178. Create Policy
Configure the policy as required. From the Services section, select + Add Service(s).
Select the primary managed service from the Managed Service selection list followed by the backup service from the Backup Service.
Figure 181. Managed Service with Backup Service
Commit the backup service using Add [n] Service. The newly added service appears under Services.
Figure 182. Backup Service
Select Create Policy to finish the configuration.
Important: Before setting up the policy and backup service, ensure that all underlying interfaces and dependent service groups are active and defined. Otherwise, the system may generate warnings and alerts.
Administer Managed Services using the CLI
Changing the Service Node Default Configuration
Configuration settings are automatically downloaded to the service node from the DANZ Monitoring Fabric (DMF) Controller to eliminate the need for box-by-box configuration. However, the option exists to override the default configuration for a service node from the config-service-node submode for any service node.
Note: These options are available only from the CLI and are not included in the DMF GUI.
To change the CLI mode to config-service-node, enter the following command from config mode on the Active DMF controller:
Replace service_node_alias with the alias to use for the service node. This alias is affiliated with the hardware MAC address of the service node using the mac command. The hardware MAC address configuration is mandatory for the service node to interact with the DMF Controller.
Use any of the following commands from the config-service-node submode to override the default configuration for the associated service node:
admin password: set the password to log in to the service node as an admin user.
banner: set the service node pre-login banner message.
description: set a brief description.
logging: enable service node logging to the Controller.
mac: configure a MAC address for the service node.
ntp: configure the service node to override default parameters.
snmp-server: configure an SNMP trap host to receive SNMP traps from the service node.
Define a Managed Service
Important:Managed Service action Keyword Requirement
Beginning with DMF version 8.9, the action keyword is required to add or modify actions within a managed service. This keyword is a mandatory token across all managed service submodes, providing a consistent way to define service behaviors. The availability of the action token within submodes allows for the direct addition or editing of actions without returning to the primary managed service configuration level. This streamlined command structure allows multiple actions—such as deduplication and IPFIX—to be defined or adjusted within a single configuration workflow. This applies to all Service Node platforms.
Managed Service Configuration
Service configuration via the CLI requires the [index] action [type] command syntax.
Example
The following demonstrates defining a deduplication action using index 1 and then moving directly into an IPFIX action configuration using index 2 without exiting the submode.
Note: The IPFIX, NetFlow, and udp-replicate service actions enable a separate submode for defining one or more specific configurations. One of these services must be the last service applied to the traffic selected by the policy.
Use a port channel instead of an interface to increase the bandwidth available to the managed service. The following example enables lag-interface1 for the service interface:
Note: When connecting a LAG interface to the DANZ Monitoring Fabric (DMF) Service Node appliance, member links should be of the same speed and can span across multiple service nodes. The maximum number of supported member links per LAG interface is 32, which varies based on the switch platform. Please refer to the hardware guide for the exact details of the supported configuration.
Apply the managed service within a policy like any other service, as shown in the following examples for deduplication, NetFlow, pattern matching (forwarding), and packet slicing services.
Note: Multiple DMF policies can use the same managed service, for example, a packet slicing managed service.
Sharing Managed Services Across Policies
A DANZ Monitoring Fabric (DMF) Controller allows sharing of managed services utilizing L3 delivery interfaces (e.g., NetFlow, IPFIX, app ID, etc.) across multiple policies. Prior to the DMF 8.7.0 release, DMF did not support managed service sharing because the L3 delivery interface was an optional setting in a policy configuration. However, sharing is now supported because the managed service configuration must now specify the L3 delivery interface.
When multiple policies (overlapping or non-overlapping) share the same Managed Service, the system will ensure that post-service traffic from all these policies is forwarded to appropriate delivery interfaces using a dynamically created post-service policy.
This change applies to the following managed service actions using L3 deliveries on all platforms that support managed services:
Netflow
IPFIX
UDP Replicate
TCP Analysis
App ID
Flow Diff
Configuration
There are no new configurations in the Sharing Managed Services Across Policies feature, but several configuration validations surrounding the managed service configuration within a policy have changed:
Removed the validation that prevented adding an L3 header modifying managed service to multiple policies.
A validation was added to enforce the order of shared managed services.
When sharing multiple managed services with at least one action that requires an L3 delivery interface, the only valid case is where non-UDP
replicate L3 services are followed by UDP
replicate:
Invalid: any non UDP replicate → any non UDP replicate.
Invalid: UDP replicate → any non UDP
replicate.
Invalid: UDP replicate → UDP
replicate.
Valid: any non UDP replicate → UDP
replicate.
There are two fundamental exceptions to the earlier examples:
The push-per-filter mode doesn’t allow multiple header modifying services in a policy.
Flow diff is only supported in push-per-filter mode and cannot be chained with UDP replicate.
The following is a sample configuration sharing a Netflow managed service across two policies.
Important: Beginning with DMF version 8.9, the action keyword is required to add or modify actions within a managed service.
In push-per-policy mode, both p1 and p2 are expected to be installed to send traffic to the ms-netflow pre-service interface, and a dynamic post-service policy p1_p2__post_to_delivery__ is created to carry the traffic from the post-service interface of ms-netflow to l3-d1.
In push-per-filter mode, a post service policy is created regardless of whether a managed service is shared or not. The result is two post service policies, p1__post_to_delivery__ and p2__post_to_delivery__, which will carry traffic from their respective configured policies to the delivery interface via the configured services.
The following section shows the runtime state of these policies.
Show Commands
While no new show commands accompany the Sharing Managed Services Across Policies feature, use the following existing commands to verify the configuration.
Important: Beginning with DMF version 8.9, the action keyword is required to add or modify actions within a managed service.
Use the show running-config switch sw1 interface l3
interface command to view the configured L3 interface:
Use the show running-config policy to view the policy running config:
dmf-controller> show running-config policy
! policy
policy p1
action forward
filter-interface f1
use-managed-service ms-netflow sequence 2
use-managed-service ms-non-shareable sequence 1
1 match any
policy p2
action forward
filter-interface f2
use-managed-service ms-netflow sequence 1
1 match any
Use the show switch sw1 interface l3 interface command to view the runtime status of the interface:
dmf-controller> show switch sw1 interface ethernet31
# IF Name MAC Address Config State Adv. Features Curr Features Supported Features
-|----------|--------------------------|------|-----|-------------|-------------|------------------|
1 ethernet31 5c:16:c7:14:46:bb (Arista) up up 10g 10g 10g
Use the show managed-service command to view the runtime status of the managed services:
dmf-controller># show managed-service
~~~~~~~~~~~~~~~~~~~~~~~~~~~~~~~~~~~~~~~~~~~~~~~~~~~~ Managed-service ~~~~~~~~~~~~~~~~~~~~~~~~~~~~~~~~~~~~~~~~~~~~~~~~~
# Service Name Switch Switch Interface Installed Max Post-Service BW Max Pre-Service BW Total Post-Service BW Total Pre-Service BW
-|----------------|------|----------------|---------|-------------------|------------------|---------------------|--------------------|
1 ms-netflow sw1 ethernet1 True 10Gbps 10Gbps 974bps 66bps
2 ms-non-shareable sw1 ethernet2 True 10Gbps 10Gbps 960bps 66bps
Push-per-policy Mode
The show policy command displays a brief version of runtime state of all policies, including those created dynamically:
dmf-controller> show policy
# Policy Name Action Runtime Status Type Priority Overlap Priority Push VLAN Filter BW Delivery BW Post Match Filter Traffic Delivery Traffic Services Installed Time Installed Duration Ptp Timestamping
-|-------------------------|-------|--------------|----------|--------|----------------|---------|---------|-----------|-------------------------|----------------|----------------|-----------------------|-------------------|----------------|
1 p1 forward installed Configured 100 0 1 10Gbps 10Gbps - - ms-non-shareable 2025-02-20 18:18:33 UTC 20 minutes, 46 secs False
2 p2 forward installed Configured 100 0 2 10Gbps 10Gbps - - 2025-02-20 18:18:33 UTC 20 minutes, 46 secs False
3 p1_p2__post_to_delivery__ forward installed Dynamic 100 0 3 10Gbps 10Gbps - - 2025-02-20 18:18:33 UTC 20 minutes, 46 secs False
The show policy policy name command provides a more detailed view of a policy at runtime.
Since a new post-service policy is required for shared services in push-per-policy mode (in the push-per-filter mode, a post-service policy, shared or not, is always created), the configured policies are adjusted accordingly. So, p1 and p2 will neither have a ms-netflow service nor will l3-d1 be the delivery interface.
p1 carries traffic from f1 to ms-non-shareable and then delivers it to ms-netflow.
dmf-controller> show policy p1
Policy Name : p1
Config Status : active - forward
Runtime Status : installed
Detailed Status : installed - installed to forward
Priority : 100
Overlap Priority : 0
# of switches with filter interfaces : 1
# of switches with delivery interfaces : 1
# of switches with service interfaces : 1
# of filter interfaces : 1
# of delivery interfaces : 1
# of core interfaces : 0
# of services : 1
# of pre service interfaces : 1
# of post service interfaces : 1
Push VLAN : 1
Post Match Filter Traffic : -
Total Delivery Rate : -
Total Pre Service Rate : -
Total Post Service Rate : -
Overlapping Policies : p1_p2__post_to_delivery__,
Component Policies : none
Runtime Service Names : ms-non-shareable
Installed Time : 2025-02-20 18:18:33 UTC
Installed Duration : 23 minutes, 18 secs
Timestamping enabled : False
~ Match Rules ~
# Rule
-|-----------|
1 1 match any
~~~~~~~~~~~~~~~~~~~~~~~~~~~~~~~~~ Filter Interface(s) ~~~~~~~~~~~~~~~~~~~~~~~~~~~~~~~~~
# DMF IF Switch IF Name State Dir Packets Bytes Pkt Rate Bit Rate Counter Reset Time
-|------|------|----------|-----|---|-------|-----|--------|--------|------------------|
1 f1 sw1 ethernet11 up rx 0 0 0 -
~~~~~~~~~~~~~~~~~~~~~~~~~~~~~~~~~~~~~~~~~~~~~~ Delivery Interface(s) ~~~~~~~~~~~~~~~~~~~~~~~~~~~~~~~~~~~~~~~~~~~~~~
# DMF IF Switch IF Name State Dir Packets Bytes Pkt Rate Bit Rate Counter Reset Time
-|----------------------------------|------|---------|-----|---|-------|-----|--------|--------|------------------|
1 sw1 -ethernet1-to-managed-service sw1 ethernet1 up tx 2 140 0 -
~~~~~~~~~~~~~~~~~~~~~~~~~~~~~~~~~~~~~~~~~~~~ Service Interface(s) ~~~~~~~~~~~~~~~~~~~~~~~~~~~~~~~~~~~~~~~~~~~~
# Service name Role Switch IF Name State Dir Packets Bytes Pkt Rate Bit Rate Counter Reset Time
-|----------------|------------|------|---------|-----|---|-------|-----|--------|--------|------------------|
1 ms-non-shareable pre-service sw1 ethernet2 up tx 0 0 0 -
2 ms-non-shareable post-service sw1 ethernet2 up rx 2 140 0 -
~ Core Interface(s) ~
None.
~ Failed Path(s) ~
None.
p2 carries traffic from f2 to ms-netflow.
dmf-controller> show policy p2
Policy Name : p2
Config Status : active - forward
Runtime Status : installed
Detailed Status : installed - installed to forward
Priority : 100
Overlap Priority : 0
# of switches with filter interfaces : 1
# of switches with delivery interfaces : 1
# of switches with service interfaces : 0
# of filter interfaces : 1
# of delivery interfaces : 1
# of core interfaces : 0
# of services : 0
# of pre service interfaces : 0
# of post service interfaces : 0
Push VLAN : 2
Post Match Filter Traffic : -
Total Delivery Rate : -
Total Pre Service Rate : -
Total Post Service Rate : -
Overlapping Policies : p1_p2__post_to_delivery__,
Component Policies : none
Installed Time : 2025-02-20 18:18:33 UTC
Installed Duration : 23 minutes, 21 secs
Timestamping enabled : False
~ Match Rules ~
# Rule
-|-----------|
1 1 match any
~~~~~~~~~~~~~~~~~~~~~~~~~~~~~~~~~ Filter Interface(s) ~~~~~~~~~~~~~~~~~~~~~~~~~~~~~~~~~
# DMF IF Switch IF Name State Dir Packets Bytes Pkt Rate Bit Rate Counter Reset Time
-|------|------|----------|-----|---|-------|-----|--------|--------|------------------|
1 f2 sw1 ethernet12 up rx 0 0 0 -
~~~~~~~~~~~~~~~~~~~~~~~~~~~~~~~~~~~~~~~~~~~~~~ Delivery Interface(s) ~~~~~~~~~~~~~~~~~~~~~~~~~~~~~~~~~~~~~~~~~~~~~~
# DMF IF Switch IF Name State Dir Packets Bytes Pkt Rate Bit Rate Counter Reset Time
-|----------------------------------|------|---------|-----|---|-------|-----|--------|--------|------------------|
1 sw1-ethernet1-to-managed-service sw1 ethernet1 up tx 0 0 0 -
~ Service Interface(s) ~
None.
~ Core Interface(s) ~
None.
~ Failed Path(s) ~
None.
p1_p2__post_to_delivery__ receives traffic from ms-netflow, and then delivers it to l3-d1.
dmf-controller> show policy p1_p2__post_to_delivery__
Policy Name : p1_p2__post_to_delivery__
Config Status : active - forward
Runtime Status : installed
Detailed Status : installed - installed to forward
Priority : 100
Overlap Priority : 0
# of switches with filter interfaces : 1
# of switches with delivery interfaces : 1
# of switches with service interfaces : 0
# of filter interfaces : 1
# of delivery interfaces : 1
# of core interfaces : 0
# of services : 0
# of pre service interfaces : 0
# of post service interfaces : 0
Push VLAN : 3
Post Match Filter Traffic : -
Total Delivery Rate : -
Total Pre Service Rate : -
Total Post Service Rate : -
Overlapping Policies : none
Component Policies : p1, p2,
Installed Time : 2025-02-20 18:18:33 UTC
Installed Duration : 23 minutes, 28 secs
Timestamping enabled : False
~ Match Rules ~
None.
~~~~~~~~~~~~~~~~~~~~~~~~~~~~~~~~~~~~~~~~~~~~~~~ Filter Interface(s) ~~~~~~~~~~~~~~~~~~~~~~~~~~~~~~~~~~~~~~~~~~~~~~~
# DMF IF Switch IF Name State Dir Packets Bytes Pkt Rate Bit Rate Counter Reset Time
-|----------------------------------|------|---------|-----|---|-------|-----|--------|--------|------------------|
1 sw1-ethernet1-to-managed-service sw1 ethernet1 up rx 1 70 0 -
~~~~~~~~~~~~~~~~~~~~~~~~~~~~~~~~ Delivery Interface(s) ~~~~~~~~~~~~~~~~~~~~~~~~~~~~~~~~
# DMF IF Switch IF Name State Dir Packets Bytes Pkt Rate Bit Rate Counter Reset Time
-|------|------|----------|-----|---|-------|-----|--------|--------|------------------|
1 l3-d1 sw1 ethernet31 up tx 1 70 0 -
~ Service Interface(s) ~
None.
~ Core Interface(s) ~
None.
~ Failed Path(s) ~
None.
Another way of visualizing this runtime state is illustrated in the following diagram:
Figure 183. Example - Runtime State
Push-per-filter Mode
The show
policy command displays a brief version of the runtime state of all policies, including any created dynamically:
The show policy policy name command provides a more detailed view of a policy at runtime:
p1 carries traffic from f1 to ms-non-shareable service.
dmf-controller> show policy p1
Policy Name : p1
Config Status : active - forward
Runtime Status : installed
Detailed Status : installed - installed to forward
Priority : 100
Overlap Priority : 0
# of switches with filter interfaces : 1
# of switches with delivery interfaces : 1
# of switches with service interfaces : 0
# of filter interfaces : 1
# of delivery interfaces : 1
# of core interfaces : 0
# of services : 0
# of pre service interfaces : 0
# of post service interfaces : 0
Push VLAN : 0
Post Match Filter Traffic : -
Total Delivery Rate : -
Total Pre Service Rate : -
Total Post Service Rate : -
Overlapping Policies : p1__post_to_delivery__,
Component Policies : none
Installed Time : 2025-02-20 19:13:39 UTC
Installed Duration : 17 minutes, 55 secs
Timestamping enabled : False
~ Match Rules ~
# Rule
-|-----------|
1 1 match any
~~~~~~~~~~~~~~~~~~~~~~~~~~~~~~~~~ Filter Interface(s) ~~~~~~~~~~~~~~~~~~~~~~~~~~~~~~~~~
# DMF IF Switch IF Name State Dir Packets Bytes Pkt Rate Bit Rate Counter Reset Time
-|------|------|----------|-----|---|-------|-----|--------|--------|------------------|
1 f1 sw1 ethernet11 up rx 0 0 0 -
~~~~~~~~~~~~~~~~~~~~~~~~~~~~~~~~~~~~~~~~~~~~~~ Delivery Interface(s) ~~~~~~~~~~~~~~~~~~~~~~~~~~~~~~~~~~~~~~~~~~~~~~
# DMF IF Switch IF Name State Dir Packets Bytes Pkt Rate Bit Rate Counter Reset Time
-|----------------------------------|------|---------|-----|---|-------|-----|--------|--------|------------------|
1 sw1-ethernet2-to-managed-service sw1 ethernet2 up tx 0 0 0 -
~ Service Interface(s) ~
None.
~ Core Interface(s) ~
None.
~ Failed Path(s) ~
None.
p2 carries traffic from f1 to ms-netflow service.
dmf-controller> show policy p2
Policy Name : p2
Config Status : active - forward
Runtime Status : installed
Detailed Status : installed - installed to forward
Priority : 100
Overlap Priority : 0
# of switches with filter interfaces : 1
# of switches with delivery interfaces : 1
# of switches with service interfaces : 0
# of filter interfaces : 1
# of delivery interfaces : 1
# of core interfaces : 0
# of services : 0
# of pre service interfaces : 0
# of post service interfaces : 0
Push VLAN : 0
Post Match Filter Traffic : -
Total Delivery Rate : -
Total Pre Service Rate : -
Total Post Service Rate : -
Overlapping Policies : p2__post_to_delivery__,
Component Policies : none
Installed Time : 2025-02-20 19:13:39 UTC
Installed Duration : 18 minutes, 44 secs
Timestamping enabled : False
~ Match Rules ~
# Rule
-|-----------|
1 1 match any
~~~~~~~~~~~~~~~~~~~~~~~~~~~~~~~~~ Filter Interface(s) ~~~~~~~~~~~~~~~~~~~~~~~~~~~~~~~~~
# DMF IF Switch IF Name State Dir Packets Bytes Pkt Rate Bit Rate Counter Reset Time
-|------|------|----------|-----|---|-------|-----|--------|--------|------------------|
1 f2 sw1 ethernet12 up rx 0 0 0 -
~~~~~~~~~~~~~~~~~~~~~~~~~~~~~~~~~~~~~~~~~~~~~~ Delivery Interface(s) ~~~~~~~~~~~~~~~~~~~~~~~~~~~~~~~~~~~~~~~~~~~~~~
# DMF IF Switch IF Name State Dir Packets Bytes Pkt Rate Bit Rate Counter Reset Time
-|----------------------------------|------|---------|-----|---|-------|-----|--------|--------|------------------|
1 sw1-ethernet1-to-managed-service sw1 ethernet1 up tx 0 0 0 -
~ Service Interface(s) ~
None.
~ Core Interface(s) ~
None.
~ Failed Path(s) ~
None.
p1__post_to_delivery__ carries traffic from ms-non-shareable to ms-netflow and then to l3-d1.
dmf-controller> show policy p1__post_to_delivery__
Policy Name : p1__post_to_delivery__
Config Status : active - forward
Runtime Status : installed
Detailed Status : installed - installed to forward
Priority : 100
Overlap Priority : 0
# of switches with filter interfaces : 1
# of switches with delivery interfaces : 1
# of switches with service interfaces : 1
# of filter interfaces : 1
# of delivery interfaces : 1
# of core interfaces : 0
# of services : 1
# of pre service interfaces : 1
# of post service interfaces : 1
Push VLAN : 0
Post Match Filter Traffic : -
Total Delivery Rate : -
Total Pre Service Rate : -
Total Post Service Rate : -
Overlapping Policies : none
Component Policies : p1,
Runtime Service Names : none
Timestamping enabled : False
~ Match Rules ~
None.
~~~~~~~~~~~~~~~~~~~~~~~~~~~~~~~~~~~~~~~~~~~~~~~ Filter Interface(s) ~~~~~~~~~~~~~~~~~~~~~~~~~~~~~~~~~~~~~~~~~~~~~~~
# DMF IF Switch IF Name State Dir Packets Bytes Pkt Rate Bit Rate Counter Reset Time
-|----------------------------------|------|---------|-----|---|-------|-----|--------|--------|------------------|
1 sw1-ethernet2-to-managed-service sw1 ethernet2 up rx 0 0 0 -
~~~~~~~~~~~~~~~~~~~~~~~~~~~~~~~~ Delivery Interface(s) ~~~~~~~~~~~~~~~~~~~~~~~~~~~~~~~~
# DMF IF Switch IF Name State Dir Packets Bytes Pkt Rate Bit Rate Counter Reset Time
-|------|------|----------|-----|---|-------|-----|--------|--------|------------------|
1 l3-d1 sw1 ethernet31 up tx 0 0 0 -
~~~~~~~~~~~~~~~~~~~~~~~~~~~~~~~~~~~~~~~~~~ Service Interface(s) ~~~~~~~~~~~~~~~~~~~~~~~~~~~~~~~~~~~~~~~~~~
# Service name Role Switch IF Name State Dir Packets Bytes Pkt Rate Bit Rate Counter Reset Time
-|------------|------------|------|---------|-----|---|-------|-----|--------|--------|------------------|
1 ms-netflow pre-service sw1 ethernet1 up tx 0 0 0 -
2 ms-netflow post-service sw1 ethernet1 up rx 0 0 0 -
~ Core Interface(s) ~
None.
~ Failed Path(s) ~
None.
p2__post_to_delivery__ carries traffic from ms-netflow to l3-d1.
dmf-controller> show policy p2__post_to_delivery__
Policy Name : p2__post_to_delivery__
Config Status : active - forward
Runtime Status : installed
Detailed Status : installed - installed to forward
Priority : 100
Overlap Priority : 0
# of switches with filter interfaces : 1
# of switches with delivery interfaces : 1
# of switches with service interfaces : 0
# of filter interfaces : 1
# of delivery interfaces : 1
# of core interfaces : 0
# of services : 0
# of pre service interfaces : 0
# of post service interfaces : 0
Push VLAN : 0
Post Match Filter Traffic : -
Total Delivery Rate : -
Total Pre Service Rate : -
Total Post Service Rate : -
Overlapping Policies : none
Component Policies : p2,
Installed Time : 2025-02-20 19:13:39 UTC
Installed Duration : 22 minutes, 19 secs
Timestamping enabled : False
~ Match Rules ~
None.
~~~~~~~~~~~~~~~~~~~~~~~~~~~~~~~~~~~~~~~~~~~~~~~ Filter Interface(s) ~~~~~~~~~~~~~~~~~~~~~~~~~~~~~~~~~~~~~~~~~~~~~~~
# DMF IF Switch IF Name State Dir Packets Bytes Pkt Rate Bit Rate Counter Reset Time
-|----------------------------------|------|---------|-----|---|-------|-----|--------|--------|------------------|
1 sw1-ethernet1-to-managed-service sw1 ethernet1 up rx 0 0 0 -
~~~~~~~~~~~~~~~~~~~~~~~~~~~~~~~~ Delivery Interface(s) ~~~~~~~~~~~~~~~~~~~~~~~~~~~~~~~~
# DMF IF Switch IF Name State Dir Packets Bytes Pkt Rate Bit Rate Counter Reset Time
-|------|------|----------|-----|---|-------|-----|--------|--------|------------------|
1 l3-d1 sw1 ethernet31 up tx 0 0 0 -
~ Service Interface(s) ~
None.
~ Core Interface(s) ~
None.
~ Failed Path(s) ~
None.
Another way of visualizing this runtime state is illustrated in the following diagram:
Figure 184. Example - Runtime State
Troubleshooting
If any failures occur by the sharing of L3 managed services between policies, ensure the order of services shared by all policies is the same, i.e., the order of services matters and partially sharing the sequence is not allowed:
Policy p1 cannot have ms1 → ms2, while policy p2 already has ms2 → ms1.
Policy p1 cannot have ms1 → ms2, while policy p2 only has ms1.
Limitations
When creating a post-service policy, configured policies are modified at runtime. So, the runtime state of a configured policy will show the modified delivery interfaces and services. You must use configured and dynamic policies to visualize the complete path.
Not all managed service actions can be shared.
Shared managed services must be the last in the sequence, and in the same order for all policies using it. Partial sharing of a sub-sequence of services is not allowed. Policy p1 cannot have ms1 → ms2, while policy p2 only has ms1.
Application Identification
The DANZ Monitoring Fabric (DMF) Application Identification feature allows for the monitoring of applications identified with Deep Packet Inspection (DPI) into packet flows received via filter interfaces and generates IPFIX flow records. These IPFIX flow records are transmitted to a configured collector device via the L3 delivery interface. The feature provides a filtering function by forwarding or dropping packets from specific applications before sending the packet to the analysis tools.
Note: Application identification is supported on Service Nodes (DCA-DM-SC and DCA-DM-SC2) and Service Nodes (DCA-DM-SDL and DCA-DM-SEL).
Restriction: The Application Identification features described in the Managed Service section are Early Field Trial (EFT) and should not be used in production networks.
Using the CLI to Configure Application Identification
Configure the feature through the Controller in managed services.
There are two application identification services to configure:
Restriction: The Application Identification features described in the Managed Service section are Early Field Trial (EFT) and should not be used in production networks.
Perform the following steps to configure app-id:
Create a managed service and enter the service interface.
Choose the app-id managed service using the seq
num app-id command.
Note: The above command should enter the app-id submode, which supports two configuration parameters: collector and l3-delivery-interface. Both are required.
To configure the IPFIX collector IP address, enter the following command: collector ip-address.
The UDP port and MTU parameters are optional; the default values are 4739 and 1500, respectively.
Enter the command: l3-delivery-interface delivery interface
name to configure the delivery interface.
Add this managed service to a policy. The policy will not have a physical delivery interface.
Important: Beginning with DMF version 8.9, the action keyword is required to add or modify actions within a managed service.
The following shows an example of an app-id configuration that sends IPFIX application records to the Collector (analytics node) at IP address 192.168.1.1 over the configured delivery interface named app-to-analytics:
After configuring the app-id, refer to the analytics node for application reports and visualizations. For instance, a flow is classified internally with the following tuple: ip, tcp, http, google, and google_maps. Consequently, the analytics node displays the most specific app ID for this flow as google_maps under appName.
On the Analytics Node, there are AppIDs 0-4 representing applications according to their numerical IDs. 0 is the most specific application identified in that flow, while 4 is the least. In the example above, ID 0 would be the numerical ID for google_maps, ID1 google, ID2 http, ID3 tcp, and ID4 IP address. Use the appName in place of these since these require an ID to name mapping to interpret.
Figure 185. AppIDs
Using the CLI to Configure app-id-filter
Restriction: The Application Identification features described in the Managed Service section are Early Field Trial (EFT) and should not be used in production networks.
Perform the following steps to configure app-id-filter:
Create a managed service and enter the service interface.
Choose the app-id managed service using the seq
num app-id-filter command.
Note: The above command should enter the app-id-filter submode, which supports three configuration parameters: app, app-category, and filter-mode. The category app is required, while app-category and filter-mode are optional. The option filter-mode has a default value of forward.
Enter the command: app application
name to configure the application name.
Tip: Press the Tab key after entering the app keyword to see all possible application names. Type in a partial name and press the Tab to see all possible choices to auto-complete the name. The application name provided must match a name in this list of app names. A service node must be connected to the Controller for this list to appear. Any number of apps can be entered one at a time using the app application-name command. An example of a (partial) list of names:
dmf-controller-1 (config-managed-srv-app-id-filter)# app ibm
ibm ibm_as_central ibm_as_dtaq ibm_as_netprt ibm_as_srvmap ibm_iseries ibm_tsm
ibm_app ibm_as_database ibm_as_file ibm_as_rmtcmd ibm_db2 ibm_tealeaf
Filter applications by category using the app-category category name command. Currently, the applications contained in these categories are not displayed.
The filter-mode parameter supports two modes: forward and drop. Enter filter-mode forward to allow the packets to be forwarded based on the configured applications. Enter filter-mode drop to drop these packets.
An example of an app-id-filter configuration that drops all Facebook and IBM Tealeaf packets:
managed-service MS
service-interface switch CORE-SWITCH-1 ethernet2
!
1 action app-id-filter
app facebook
app ibm_tealeaf
filter-mode drop
CAUTION: The app-id-filter configuration filters based on flows. For example, if a session is internally identified with the following tuple: ip, tcp, http, google, or google_maps, adding any of these parameters to the filter list permits or drops all the packets matching after determining classification (e.g., adding tcp to the filter list permits or blocks packets from the aforementioned 5-tuple flow as well as all other tcp flows). Use caution when filtering using the lower-layer protocols and apps. Also, when forwarding an application, packets will be dropped at the beginning of the session until the application is identified. When dropping, packets at the beginning of the session will be passed until the application is identified.
Using the CLI to Configure app-id and app-id-filter Combined
Restriction: The Application Identification features described in the Managed Service section are Early Field Trial (EFT) and should not be used in production networks.
Follow the configuration steps described in the services earlier to configure app-id-filter and app-id together. However, in this case, app-id should use a higher seq num than app-id-filter. Thus, the traffic is processed through the app-id-filter policy first, then through app-id.
This behavior can be helpful to monitor certain types of traffic. The following example illustrates a combined app-id-filter and app-id configuration.
Important: Beginning with DMF version 8.9, the action keyword is required to add or modify actions within a managed service.
Note: The two drawbacks of this configuration are app-id dropping all traffic except facebook, and this type of service chaining can cause a performance hit and high memory utilization.
Dynamic Signature Updates (Beta Version)
Restriction: The Application Identification features described in the Managed Service section are Early Field Trial (EFT) and should not be used in production networks.
This beta feature allows the app-id and app-id-filter services to classify newly supported applications at runtime rather than waiting for an update in the next DANZ Monitoring Fabric (DMF) release. Perform such runtime service updates during a maintenance cycle. There can be issues with backward compatibility if attempting to revert to an older bundle. Adopt only supported versions. In the Controller’s CLI, perform the following recommended steps:
Remove all policies containing app-id or app-id-filter. Remove the app-id and app-id-filter managed services from the policies using the command: no use-managed-service in policy config.
Arista Networks recommends this step to avoid errors and service node reboots during the update process. A warning message is printed right before confirming a push. Proceeding without this step may work but is not recommended as there is a risk of service node reboots.
Note: Arista Networks provides the specific update file in the command example below.
To pull the signature file onto the Controller node, use the command:
dmf-controller-1(config)# app-id fetch-signature-file file://file.tar.gz
Fetch successful.
Checksum : abcdefgh12345
Fetch time : 2023-08-02 22:20:49.422000 UTC
Filename : file.tar.gz
To view files currently saved on the Controller node after the fetch operation is successful, use the following command:
dmf-controller-1(config)# app-id list-signature-files
# Signature-file Checksum Fetch time
-|-----------------|-----------------|------------------------------|
1 file.tar.gz abcdefgh12345 2023-08-02 22:20:49.422000 UTC
Note: Only the files listed by this command can be pushed to service nodes.
Push the file from the Controller to the service nodes using the following command:
dmf-controller-1(config)# app-id push-signature-file file.tar.gz
App ID update: WARNING: This push will affect all service nodes
App ID update: Remove policies configured with app-id or app-id-filter before continuing to avoid errors
App ID update: Signature file: file.tar.gz
App ID update: Push app ID signatures to all Service Nodes? Update ("y" or "yes" to continue): yes
Push successful.
Checksum : abcdefgh12345
Fetch time : 2023-08-02 22:20:49.422000 UTC
Filename : file.tar.gz
Sn push time : 2023-08-02 22:21:49.422000 UTC
Add the app-id and app-id-filter managed services back to the policies.
As a result of adding app-id, service nodes can now identify and report new applications to the analytics node.
After adding back app-id-filter, new application names should appear in the app-id-filter Controller app list. To test this, enter app-id-filter submode and press the Tab to see the full list of applications. New identified applications should appear in this list.
To delete a signature file from the Controller, use the command below.
Note: DMF only allows deleting a signature file that is not actively in use by any service node, which needs to keep a working file in case of issues—attempting to delete an active file causes the command to fail.
dmf-controller-1(config)# app-id delete-signature-file file.tar.gz
Delete successful for file: file.tar.gz
Useful Information
The fetch and delete operations are synced with standby controllers as follows:
fetch: after a successful fetch on the active Controller, it invokes the fetch RPC on the standby Controller by providing a signed HTTP URL as the source. This URL points to an internal REST API that provides the recently fetched signature file.
delete: the active Controller invokes the delete RPC call on the standby controllers.
The Controller stores the signature files in this location: /var/lib/capture/appidsignatureupdate.
On a service node, files are overwritten and always contain the complete set of applications.
Note: An analytics node cannot display these applications in the current version.
This step is only for informational purposes:
Verify the bundle version on the service node by entering the show service-node app-id-bundle-version command in the service node CLI, as shown below.
Figure 186. Before Update
Figure 187. After Update
Show Commands
Service Node
In the service node CLI, use the following show command:
show service-node app-id-bundle-version
This command shows the version of the bundle in use. An app-id or app-id-filter instance must be configured, or an error message is displayed.
dmf-servicenode-1# show app-id bundle-version
Name : bundle_version
Data : 1.680.0-22 (build date Sep 26 2023)
dmf-servicenode-1#
Controller
To obtain more information about the running version on a Service Node, or when the last push attempt was made and the outcome, use the following Controller CLI commands:
show app-id push-results optional SN
name
show service-node SN name app-id
dmf-controller-1# show app-id push-results
# Name IP Address Current Version Current Push Time Previous Version Previous Push Time Last Attempt Version Last Attempt Time Last Attempt Result Last Attempt Failure Reason
-|-----------------|--------------|---------------|------------------------------|----------------|------------------------------|--------------------|------------------------------|-------------------|---------------------------|
1 dmf-servicenode-1 10.240.180.124 1.660.2-33 2023-12-06 11:13:36.662000 PST 1.680.0-22 2023-09-29 16:21:11.034000 PDT 1.660.2-33 2023-12-06 11:13:34.085000 PST success
dmf-controller-1# show service-node dmf-servicenode-1 app-id
# Name IP Address Current Version Current Push Time Previous Version Previous Push Time Last Attempt Version Last Attempt Time Last Attempt Result Last Attempt Failure Reason
-|-----------------|--------------|---------------|------------------------------|----------------|------------------|--------------------|-----------------|-------------------|---------------------------|
1 dmf-servicenode-1 10.240.180.124 1.680.0-22 2023-09-29 16:21:11.034000 PDT
The show app-id signature-files command displays the validated files that are available to push to Service Nodes.
dmf-controller-1# show app-id signature-files
# Signature-file Checksum Fetch time
-|-----------------|-----------------|------------------------------|
1 file1.tar.gz abcdefgh12345 2023-08-02 22:20:49.422000 UTC
2 file2.tar.gz ijklmnop67890 2023-08-03 07:10:22.123000 UTC
The show analytics app-info filter-interface-name command displays aggregated information over the last 5 minutes about the applications seen on a given filter interface, sorted by unique flow count. This command also has an optional size option to limit the number of results, default is all.
Note: This command only works in push-per-filter mode.
dmf-controller-1# show analytics app-info filter-interface f1 size 3
# App name Flow count
-|--------|----------|
1 app1 1000
2 app2 900
3 app3 800
Syslog Messages
Syslog messages for configuring the app-id and app-id-filter services appear in a service node’s syslog through journalctl.
A Service Node syslog registers events for the app-idadd, modify, and delete actions.
These events contain the keywords dpi and dpi-filter, which correspond to app-id and app-id-filter.
For example:
Adding dpi for port,
Modifying dpi for port,
Deleting dpi for port,
Adding dpi filter for port,
Modifying dpi filter for port,
Deleting dpi filter for port,
App appname does not exist - An invalid app name was entered.
The addition, modification, or deletion of app names in an app-id-filter managed-service in the Controller node’s CLI influences the policy refresh activity, and these events register in floodlight.log.
Scale
Max concurrent sessions are currently set to permit less than 200,000 active flows per core. Performance may drop the more concurrent flows there are. This value is a maximum value to prevent the service from overloading. Surpassing this threshold may cause some flows not to be processed, and the new flows will not be identified or filtered. Entries for inactive flows will time out after a few minutes for ongoing sessions and a few seconds after the session ends.
If there are many inactive sessions, DMF holds the flow contexts, reducing the number of available flows used for DPI. The timeouts are approximately 7 minutes for TCP sessions and 1 minute for UDP.
Heavy application traffic load degrades performance.
Troubleshooting
If IPFIX reports do not appear on an Analytics Node (AN) or Collector, ensure the UDP port is configured correctly and verify the AN receives traffic.
If the app-id-filter app list does not appear, ensure a Service Node (SN) is connected using the show service-node command on the Controller.
For app-id-filter, enter at least one valid application from the list that appears using <Tab>. If not, the policy will fail to install with an error message app-id-filter specified without at least one name TLV identifying application.
A flow may contain other IDs and protocols when using app-id-filter. For example, the specific application for a flow may be google_maps, but there may be protocols or broader applications under it, such as ssh, http, or google. Adding google_maps will filter this flow. However, adding ssh will also filter this flow. Therefore, adding any of these to the filter list will cause packets of this flow to be forwarded or dropped.
An IPFIX element, BSN type 14, that existed in DMF version 8.4 was removed in 8.6.
During a dynamic signature update, if a SN reboot occurs, it will likely boot up with the correct version. To avoid issues of traffic loss, perform the update during a maintenance window. Also, during an update, the SN will temporarily not send LLDP packets to the Controller and disconnect for a short while.
After a dynamic signature update, do not change configurations or push another signature file for several minutes. The update will take some time to process. If there are any VFT changes, it may lead to warning messages in floodlight, such as:
Sync job 2853: still waiting after 50002 ms
Stuck switch update: R740-25G[00:00:e4:43:4b:bb:38:ca], duration=50002ms, stage=COMMIT
These messages may also appear when configuring DPI on a large number of ports.
Limitations
When using a drop filter, a few packets may slip through the filter before determining an application ID for a flow, and when using a forward filter, a few packets may not be forwarded. Such a small amount is estimated to be between 1 and 6 packets at the beginning of a flow.
When using a drop filter, add the unknown app ID to the filter list to drop any unidentified traffic if these packets are unwanted.
The Controller must be connected to a Service Node for the app-id-filter app list to appear. If the list does not appear and the application names are unknown, use the app-id to send reports to the analytics node. Use the application names seen there to configure an app-id-filter. The name must match exactly.
Since app-category does not currently show the applications included in that category, do not use it when targeting specific apps. Categories like basic, which include all basic networking protocols like TCP and UDP, may affect all flows.
For app-id, a report is only generated for a fully classified flow after that flow has been fully classified. Therefore, the number of reported applications may not match the total number of flows. These reports are sent after enough applications are identified on the Service Node. If many applications are identified, DMF sends the reports quickly. However, DMF sends these reports every 10 seconds when identifying only a few applications.
DMF treats a bidirectional flow as part of the same n-tuple. As such, generated reports contain the client's source IP address and the server's destination IP address.
While configuring many ports with the app-id, there may occasionally be a few Rx drops on the 16 port machines at a high traffic rate in the first couple of seconds.
The feature uses a cache that maps dest ip and port to the application. Caching may vary the performance depending on the traffic profile.
The app-id and app-id-filter services are more resource-intensive than other services. Combining them in a service chain or configuring many instances of them may lead to degradation in performance.
At scale, such as configuring 16 ports on the R740 DCA-DM-SEL, app-id may take a few minutes to set up on all these ports, and this is also true when doing a dynamic signature update.
The show analytics app-info command only works in push-per-filter VLAN mode.
Mapping an interface-name with identified application IDs from source traffic received via the filter interface at Analytics Dashboard is allowed in Push-Per-Filter Mode only.
Deduplication Action
The DANZ Monitoring Fabric (DMF) Service Node enhances the efficiency of network monitoring tools by eliminating duplicate packets. Duplicate packets can be introduced into the out-of-band monitoring data stream by receiving the same flow from multiple TAP or SPAN ports spread across the production network. Deduplication eliminates these duplicate packets and enables more efficient use of passive monitoring tools.
The DMF Service Node provides four modes of deduplication for different types of duplicate packets.
Full packet deduplication: deduplicates incoming packets that are identical at the L3/L4 layers.
Payload routed packet deduplication: Routed Deduplication with L4 Payload and Salt. This skips TCP/UDP headers in hashing, allowing duplicate detection based on identical payloads even if header fields like timestamps differ.
Routed packet deduplication: as packets traverse an IP network, the MAC address changes from hop to hop. Routed packet deduplication enables users to match packet contents starting from the L3 header.
L4 Payload Start: NATed packet deduplication: to perform NATed deduplication, the service node compares packets in the configured window that are identical starting from the L4 payload. To use NATed packet deduplication, perform the following fields as required:
Offset: the number of bytes from the anchor where the deduplication check begins.
Window Size: The time window in which the service looks for duplicate packets is configurable. Select a value among these choices: 2ms (the default), 4ms, 6ms, and 8ms.
CLI Configuration
Important: Beginning with DMF version 8.9, the action keyword is required to add or modify actions within a managed service.
Controller-1(config)# show running-config managed-service MS-DEDUP-FULL-PACKET
! managed-service
managed-service MS-DEDUP-FULL-PACKET
description 'This is a service that does Full Packet Deduplication'
1 action dedup full-packet window 8
service-interface switch CORE-SWITCH-1 ethernet13/1
Controller-1(config)#
Controller-1(config)# show running-config managed-service MS-DEDUP-ROUTED-PACKET
! managed-service
managed-service MS-DEDUP-ROUTED-PACKET
description 'This is a service that does Routed Packet Deduplication'
1 action dedup routed-packet window 8
service-interface switch CORE-SWITCH-1 ethernet13/2
Controller-1(config)#
Controller-1(config)# show running-config managed-service MS-DEDUP-NATTED-PACKET
! managed-service
managed-service MS-DEDUP-NATTED-PACKET
description 'This is a service that does Natted Packet Deduplication'
1 action dedup anchor-offset l4-payload-start 0 window 8
service-interface switch CORE-SWITCH-1 ethernet13/3
Controller-1(config)#
Note: The existing command is augmented to show the deduplication percentage. The command syntax is show managed-service-device Service-Node-Name stats dedup-service-name dedup.
Controller-1(config)# show managed-service-device DMF-SN-R740-1 stats MS-DEDUP dedup
~~~~~~~~~~~~~~~~ Stats ~~~~~~~~~~~~~~~~
Interface Name : sni16
Function : dedup
Service Name : MS-DEDUP
Rx packets : 9924950
Rx bytes : 4216466684
Rx Bit Rate : 1.40Gbps
Applied packets : 9923032
Applied bytes : 4216337540
Applied Bit Rate : 1.40Gbps
Tx packets : 9796381
Tx bytes : 4207106113
Tx Bit Rate : 1.39Gbps
Deduped frame count : 126651
Deduped percent : 1.2763336851075358
Load : low
Controller-1(config)#
Routed Deduplication
The DMF Controller supports a payload-routed-packet deduplication option. This feature allows service nodes to combine the L4 payload start anchor point with routed salt (L3 IP addresses, L4 source/destination ports, and other L3 header fields).
Anchoring the deduplication range at the L4 payload start ensures that frames with identical payload content are identified as duplicates, even when TCP headers—such as frequently updated timestamps—differ. This method effectively skips TCP/UDP headers and options during hash computation.
Functional Benefits
Optimized Bandwidth: The Service Node identifies and drops retransmitted packets containing identical data, preventing unnecessary traffic from reaching monitoring tools.
Precise Flow Identification: Using routed salt ensures the system maintains visibility into L3 and L4 flow identifiers while focusing the deduplication logic on the payload.
Reduced Processing Overhead: Monitoring tools receive only unique payload content, lowering the computational load on analytics engines.
Configuration and Functional Impact
Adding the payload-routed-packet option provides granular control over how the system processes retransmitted frames.
Deduplication Logic: The Service Node uses the same routed salt to maintain flow identification, but shifts the hash computation range to start after the transport-layer headers.
Data Integrity: DMF identifies frames as duplicates only when their payloads match within the same flow, ensuring that distinct data remains intact while redundant retransmissions are filtered.
Backward Compatibility: DMF maintains existing deduplication behavior under the name header-routed-packet. Automatic configuration migration ensures that current deployments maintain their existing behavior upon upgrade without manual intervention.
All dedup supporting Service Nodes support Routed Deduplication with L4 Payload and Salt.
Configuration
In the deduplication managed service configuration, the implementation replaces the single routed-packet option with two distinct settings for the region command. To access these options, first define a deduplication action using the [index] action dedup command within the config-managed-srv mode.
The region command defines the scope of the hash computation using the following four values:
full-packet: Performs complete packet deduplication starting from the beginning of the frame.
header-routed-packet: Enables L4 header-based routed deduplication using routed salt (L3 IP addresses and L4 ports).
payload-routed-packet: Enables L4 payload-based routed deduplication using routed salt, effectively skipping transport-layer headers to focus on payload content.
anchor-offset: Supports advanced custom configurations for specific byte ranges. This option facilitates L4 header and payload-based deduplication without incorporating salted fields.
Routed Deduplication with L4 Payload and Salt
The DMF Controller supports a payload-routed-packet deduplication option. This feature allows service nodes to combine the L4 payload start anchor point with routed salt (L3 IP addresses, L4 source/destination ports, and other L3 header fields).
Anchoring the deduplication range at the L4 payload start ensures that frames with identical payload content are identified as duplicates, even when TCP headers—such as frequently updated timestamps—differ. This method effectively skips TCP/UDP headers and options during hash computation.
Functional Benefits
Optimized Bandwidth: The Service Node identifies and drops retransmitted packets containing identical data, preventing unnecessary traffic from reaching monitoring tools.
Precise Flow Identification: Using routed salt ensures the system maintains visibility into L3 and L4 flow identifiers while focusing the deduplication logic on the payload.
Reduced Processing Overhead: Monitoring tools receive only unique payload content, lowering the computational load on analytics engines.
Configuration and Functional Impact
Adding the payload-routed-packet option provides granular control over how the system processes retransmitted frames.
Deduplication Logic: The Service Node uses the same routed salt to maintain flow identification, but shifts the hash computation range to start after the transport-layer headers.
Data Integrity: DMF identifies frames as duplicates only when their payloads match within the same flow, ensuring that distinct data remains intact while redundant retransmissions are filtered.
Backward Compatibility: DMF maintains existing deduplication behavior under the name header-routed-packet. Automatic configuration migration ensures that current deployments maintain their existing behavior upon upgrade without manual intervention.
All dedup supporting Service Nodes support Routed Deduplication with L4 Payload and Salt.
Configuration
In the deduplication managed service configuration, the implementation replaces the single routed-packet option with two distinct settings for the region command. To access these options, first define a deduplication action using the [index] action dedup command within the config-managed-srv mode.
The region command defines the scope of the hash computation using the following four values:
full-packet: Performs complete packet deduplication starting from the beginning of the frame.
header-routed-packet: Enables L4 header-based routed deduplication using routed salt (L3 IP addresses and L4 ports).
payload-routed-packet: Enables L4 payload-based routed deduplication using routed salt, effectively skipping transport-layer headers to focus on payload content.
anchor-offset: Supports advanced custom configurations for specific byte ranges. This option facilitates L4 header and payload-based deduplication without incorporating salted fields.
Command Line Interface
The following example demonstrates entering the managed service mode and the deduplication action sub-mode to apply the desired region.
Important: Beginning with DMF version 8.9, the action keyword is required to add or modify actions within a managed service.
Note: The existing show command structure supports this enhancement.
Flow Diff Latency and Drop Analysis
Latency and drop information help determine if there is a loss in a particular flow and where the loss occurred. A Service Node action configured as a DANZ Monitoring Fabric (DMF) managed service has multiple separate taps or spans in the production network and can measure the latency of a flow traversing through any pair of these points. It can also detect packet drops between any two points in the network if the packet only appears on one point within a specified time frame, currently set to 200ms.
Latency and drop analysis require Precision Time Protocol (PTP) time-stamped packets. The DMF PTP timestamping feature applies these timestamps as packets enter the monitoring fabric.
The Service Node accumulates latency values by flow and sends IPFIX data records with each flow's 5-tuple and ingress and egress identifiers. It sends IPFIX data records to the Analytics Node after collecting a specified number of values for a flow or when a timeout occurs for the flow entry. The threshold count is 10,000 packets, and the flow timeout is 4 seconds.
Note: This feature is only supported in push-per-filter mode. Only basic statistics, such as min, max, and mean, are available. These statistics are the computed difference in timestamps, or latency, between two tap point pairs of packets within a flow.
Use the DMF Analytics Node to build custom dashboards to view and check the data.
Attention: The flow diff latency and drop analysis feature is switch dependent and requires PTP timestamping. It is supported on 7280R3 and 7800R3 switches.
Configure Flow Diff Latency and Drop Analysis
Configure this feature through the Controller as a Service Node action in managed services using the managed service action flow-diff. Arista recommends using a dedicated flow-diff service policy for this feature to work effectively.
Flow-diff configuration configures multiple tap point pairs, or a multicast group with sources, receivers, and group IPs. DMF analyzes traffic flowing between these tap points for latency or drops. A tap point pair comprises a source and a destination tap point, identified by the filter interface or filter interface group. Whereas the multicast groups can be seen as a tap point triplet consisting of sources, receivers, and group IP.
Filter interfaces carrying both unicast and multicast traffic will need to be configured as part of tap-point-pair and tap-point-multicast-group in separate managed services.
Based on the configuration, configuring the Service Node with traffic metadata tells the Service Node where to look for tap point information, timestamps, and the IPFIX collector.
Configure appropriate DMF Policies to deliver traffic tapped from tap point pairs in the network to the configured Service Node interface for analysis.
Configuration Steps for flow-diff.
Create a managed service and enter the service interface.
Choose the flow-diff service action with the command: seq num flow-diff
Note: The command will enter the flow-diff submode, which supports the following configuration parameters: collector, l3-delivery-interface, tap-point-pair, and tap-point-multicast-group. These are required parameters.
Important: The configuration requires at least one tap-point-pair or tap-point-multicast-group.
Configure the IPFIX collector IP address by entering the following command: collector ip-address (the UDP port and MTU parameters are optional; the default values are 4739 and 1500, respectively).
Configure the delivery interface by entering the command l3-delivery-interface delivery interface
name.
Configure the points for flow-diff and drop analysis using tap-point-pair parameters as specified in the following section. Multiple options to identify the tap-point include filter-interface and filter-interface-group. This command requires a source and a destination tap point.
Configure a multicast tap point using tap-point-multicast-group and provide an existing multicast group name.
Optional parameters with their default configurations are:
delivery-requirement: all-destinations
report-type: latency and drop
latency-table-size: large
sample-count-threshold: 10000
packet-timeout: 200ms
flow-timeout: 4000ms
For delivery-requirement, the all-destinations flag indicates that the packet must appear on every destination interface otherwise a drop report will occur. any-destination means it only needs to be seen at one interface in the destination interface group.
The report-type value determines what types of reports are generated by the flow-diff action. While in the report-type submode set latency or drop. To unset, use no latency or no
drop. By default both types are set.
The latency-table-size value determines the memory footprint of flow-diff action on the Service Node. The Service Node manages this abstract concept entirely, allowing for functional evolution to meet architectural requirements.
The sample-count-threshold value specifies the number of samples needed to generate a latency report. Every time a packet times out, it generates a sample for that flow. DMF generates a report if the flow reaches the sample threshold and resets the flow stats.
The packet-timeout value is the time interval in which timestamps are collected for a packet. It must be larger than the time it takes the same packet to appear at all tap points. Every timeout generates a sample for the flow associated with the packet.
As of DMF release 8.9, the flow-timeout value now reports the flow latency after the flow timeout value elapses. The system evicts the flow and generates a report. This change differs from earlier releases, which used the time after a flow stopped receiving packets and refreshed the timeout whenever the system received a new packet.
Important: Beginning with DMF version 8.9, the action keyword is required to add or modify actions within a managed service.
The following example illustrates configuring flow-diff using the steps mentioned earlier:
Configure unicast tap points using tap-point-pair parameters in the flow-diff submode specifying two identifiers: filter interface name, and filter-interface-group.
The filter-interface-group option takes in any configured filter interface group used to represent a collection of tap points in push-per-filter mode. This is an optional command to use when a group of tap points exists, all expecting traffic from the same source or group of source tap points for ease of configuration. For example:
Instead of having two separate tap-point-pairs to represent A → B, A → C, use a filter-interface-groupG = [B, C], and only one tap-point-pair A → G.
dmf-controller-1(config-managed-srv-flow-diff)# tap-point-pair source type A destination filter-interface-group G
With a topology like A → C and B → C, configure a filter-interface-groupG = [A, B], and tap-point-pair G → C.
dmf-controller-1(config-managed-srv-flow-diff)# tap-point-pair source filter-interface-group G destination type C
Multicast Tap Points
Configure multicast tap points using tap-point-multicast-group parameters in the flow-diff submode specifying the multicast group names.
dmf-controller-1(config-managed-srv-flow-diff)# tap-point-multicast-group multicast group name
Multicast group is flattened by the group IPs and converted into tap point triplets of the form of sources, receivers, and group-ip. When a multicast group is used as a tap point, then the receiver group in the multicast group config only applies to packets destined for the group IP address. This allows the action to be configured for multiple multicast groups that have the same source, but different destinations.
Restrictions
There are some restrictions to keep in mind while configuring tap-point-pairs and tap-point-multicast-groups:
A source and destination must exist and cannot refer to the same tap point.
A multicast group must have sources, receivers, and group IPs configured, and the sources and receivers must not overlap.
The configured filter-interface-group must not partially overlap with other groups, including the multicast group sources and receivers used by the same flow-diff managed service and cannot have more than 128 members. The same applies to any multicast group being used by flow-diff.
When configuring multiple tap-point-pairs using filter-interface and filter-interface-group, or tap-point-mulitcast-group, if a filter interface is used individually, it can only be referenced in a filter-interface-group or multicast-group sources or receiver groups if these groups only consist of that one filter interface.
The configuration supports a maximum of 4094 unique tap point groups. This limit applies globally to the fabric and encompasses all flow-diff services. Tap point group uniqueness depends on the constituent filter interfaces. For example, an individual filter interface F1 and a filter interface group FG1 containing only that same interface F1 represent the same unique group. Similarly, a multicast group utilizing either the individual interface F1 or the single-interface group FG1 as a source or receiver refers to the same underlying interface group.
If an interface group has more than one LAG grouping where each LAG contains multiple ids, only one member id of each LAG is required. Subsequent ids of the LAG will not have latency computed if they are found.
The existence of the delivery-requirement flag changes the drop reporting for interface group pairs. When set to any-destination, the packet only needs to be seen on any one of the configured destination interfaces, when set to all-destinations, the packet must arrive on all matching destinations, otherwise the system generates a drop report for each interface where the packet was unseen.
Configuring Multicast Group
Multicast groups configuration requires filter interfaces as sources and receivers, and valid IPv4 addresses. There is no group size limit applied here, but the flow-diff service will fail if the sources and receivers have more than 128 filter interfaces.
Configure the policies so that the same packet can be tapped from two independent points in the network and then sent to the Service Node.
After creating a policy, add the managed service with flow-diff action as shown in the following example:
dmf-controller-1 (config-policy)# use-managed-service service name sequence 1
There are several things to consider while configuring policies in push-per-filter mode:
Only one policy can contain the flow-diff service action.
A policy should have all filter-interfaces and filter-interface-groups configured as tap points in the flow-diff configuration. Any missing filter interfaces and groups in a policy may result in reporting drops as these packets do not forward from one end of the tap-point-pair to the Service Node. Similarly, for the tap-point-multicast-group, the configuration must include the filter interfaces and groups used as sources and receivers in the policy.
It’s also advisable not to add any filter interfaces (groups) that are not in the tap-point-pairs or tap-point-multicast-groups as their latency and drop analysis will not be done, causing unnecessary packets to be forwarded to the Service Node, which are then reported as unexpected.
Ensure accurate timestamping and avoid unexpected report types by correctly ordering the source and destination for tap point pairs. Tap point pairs are not bidirectional so to compute latencies for both directions add the reverse ordering of the tap point pair.
Policies must have PTP timestamping enabled. To do so, use the following command:
This feature depends on configuring PTP timestamping for the packet stream going through the tap points. Refer to the Resources section for more information on setting up PTP timestamping functionality. Arista strongly recommends using replace-src-mac for this feature until revised, as performance and Service Node compatibility may vary for add-header-after-l2.
Analytics Node
IPFIX reports received on the analytics node can be of one of the following types, indicated by the reportType field:
0 is a valid latency report with the latency computed between the two tap point pairs.
1 means it is a drop report, which means the packet didn’t arrive at its destination. If the egress identifier field is also 0, the packet was only received at one tap point. If the egress identifier contains a nonzero value, that means one or a few of the LAG groupings associated with a destination interface group did not receive any packets associated with an id in that LAG. The egress identifier field is filled with the id of one of the members in that LAG group.
2 means unexpected, which can be caused by packets with identifiers not included in any tap point pairs or a misordering of timestamps where the destination comes before the source tap.
3 means overflow, where this same packet appears at too many tap points. The system ignores packets that surpass the maximum tap points. Currently, this should not exceed 40, including the source tap point.
VXLAN
When using VXLAN, the headers of these packets must be decapsulated before they can be processed by flow-diff on the Service Node. The filter switch must perform the decapsulation. If encapsulated packets appear at one tap point and non-encapsulated packets at the other endpoint, the service requires both of these packets to be decapsulated. Arista recommends using the following process to ensure flow-diff works correctly.
Configure the filter interface receiving the VXLAN encapsulated traffic to perform decapsulation.
If the receiving VXLAN traffic appears with non-default port number 4789, configure the filter switch with a non-default port number as shown in the following example:
filter-switch-1# configure
filter-switch-1(config)# interface Vxlan 1
filter-switch-1(config-if-Vx1)# vxlan udp-port customer port
interface Vxlan1
vxlan udp-port customer port
Show Commands
The following show commands provide helpful information.
Important: Beginning with DMF version 8.9, the action keyword is required to add or modify actions within a managed service.
The show running-config managed-service managed
service command helps verify whether the flow-diff configuration is complete.
The show managed-services managed service command provides status information about the service.
dmf-controller-1(config)# show managed-services flow-diff
# Service Name Switch Switch Interface Installed Max Post-Service BW Max Pre-Service BW Total Post-Service BW Total Pre-Service BW
-|------------|---------------|----------------|---------|-------------------|------------------|---------------------|--------------------|
1 flow-diff DCS-7050CX3-32S ethernet2/4 True 25Gbps 25Gbps 624Kbps 432Mbps
The show running-config policy policy command checks whether the policy flow-diff service exists, whether use-timestamping is enabled, and the use of the correct filter interfaces.
dmf-controller-1(config)# show running-config policy p1
! policy
policy p1
action forward
filter-interface egress
filter-interface ingress
use-managed-service ms1 sequence 1
use-timestamping
1 match any
The show policy policy command provides detailed information about a policy and whether any errors are related to the flow-diff service. The Service Interfaces tab section shows the packets transmitted to the Service Node and IPFIX packets received from the Service Node.
dmf-controller-1 (config)# show policy flow-diff-1
Policy Name : flow-diff-1
Config Status : active - forward
Runtime Status : installed
Detailed Status : installed - installed to forward
Priority : 100
Overlap Priority : 0
# of switches with filter interfaces : 1
# of switches with delivery interfaces : 1
# of switches with service interfaces : 1
# of filter interfaces : 1
# of delivery interfaces : 1
# of core interfaces : 4
# of services : 1
# of pre service interfaces : 1
# of post service interfaces : 1
Push VLAN : 2
Post Match Filter Traffic : 215Mbps
Total Delivery Rate : -
Total Pre Service Rate : 217Mbps
Total Post Service Rate : -
Overlapping Policies : none
Component Policies : none
Runtime Service Names : flow-diff
Installed Time : 2023-11-16 18:15:27 PST
Installed Duration : 19 minutes, 45 secs
~ Match Rules ~
# Rule
-|-----------|
1 1 match any
~~~~~~~~~~~~~~~~~~~~~~~~~~~~~~~~~~~~~~~~~~~~ Filter Interface(s) ~~~~~~~~~~~~~~~~~~~~~~~~~~~~~~~~~~~~~~~~~~~~
# DMF IF Switch IF Name State Dir Packets Bytes Pkt Rate Bit Rate Counter Reset Time
-|------|--------|----------|-----|---|--------|-----------|--------|--------|------------------------------|
1 BP1 7280SR3E Ethernet25 up rx 24319476 27484991953 23313 215Mbps 2023-11-16 18:18:18.837000 PST
~~~~~~~~~~~~~~~~~~~~~~~~~~~~~~~~~~~~~~~~~ Delivery Interface(s) ~~~~~~~~~~~~~~~~~~~~~~~~~~~~~~~~~~~~~~~~~
# DMF IF Switch IF Name State Dir Packets Bytes Pkt Rate Bit Rate Counter Reset Time
-|-------|---------|----------|-----|---|-------|------|--------|--------|------------------------------|
1 AN-Data 7050SX3-1 ethernet41 up tx 81 117222 0 - 2023-11-16 18:18:18.837000 PST
~~~~~~~~~~~~~~~~~~~~~~~~~~~~~~~~~~~~~~~~~~~~~~~~~~~~~~~~~ Service Interface(s) ~~~~~~~~~~~~~~~~~~~~~~~~~~~~~~~~~~~~~~~~~~~~~~~~~~~~~~~~~
# Service name Role Switch IF Name State Dir Packets Bytes Pkt Rate Bit Rate Counter Reset Time
-|------------|------------|---------------|-----------|-----|---|--------|-----------|--------|--------|------------------------------|
1 flow-diff pre-service DCS-7050CX3-32S ethernet2/4 up tx 23950846 27175761734 23418 217Mbps 2023-11-16 18:18:18.837000 PST
2 flow-diff post-service DCS-7050CX3-32S ethernet2/4 up rx 81 117546 0 - 2023-11-16 18:18:18.837000 PST
~~~~~~~~~~~~~~~~~~~~~~~~~~~~~~~~~~~~~~~~~~~~~ Core Interface(s) ~~~~~~~~~~~~~~~~~~~~~~~~~~~~~~~~~~~~~~~~~~~~~
# Switch IF Name State Dir Packets Bytes Pkt Rate Bit Rate Counter Reset Time
-|---------------|----------|-----|---|--------|-----------|--------|--------|------------------------------|
1 7050SX3-1 ethernet7 up rx 23950773 27175675524 23415 217Mbps 2023-11-16 18:18:18.837000 PST
2 7050SX3-1 ethernet56 up rx 81 117222 0 - 2023-11-16 18:18:18.837000 PST
3 7050SX3-1 ethernet56 up tx 23950773 27175675524 23415 217Mbps 2023-11-16 18:18:18.837000 PST
4 7280SR3E Ethernet7 up tx 24319476 27484991953 23313 215Mbps 2023-11-16 18:18:18.837000 PST
5 DCS-7050CX3-32S ethernet28 up tx 81 117546 0 - 2023-11-16 18:18:18.837000 PST
6 DCS-7050CX3-32S ethernet28 up rx 23950846 27175761734 23418 217Mbps 2023-11-16 18:18:18.837000 PST
~ Failed Path(s) ~
None.
The show running-config multicast-group name displays the user-configured multicast groups.
The Flow Diff Latency and Drop Analysis feature does not create Syslog messages.
Troubleshooting
DMF Controller
Policies dictate how and what packets are directed to the Service Node. Policies must be able to stream packets from two distinct tap points so that the same packet gets delivered to the Service Node for flow-diff and drop analysis.
Possible reasons for flow-diff and drop analysis not working are:
In push-per-filter mode, the policy bound to managed service with flow-diff action is missing filter interfaces or groups that constitute a tap-point-pair.
A policy programmed to use managed service with flow-diff action can fail for several reasons:
The L3 delivery interface or Collector configuration is missing.
The tap-point-pair configuration is incomplete:
The source or destination tap points are missing.
Using a policy-name identifier in push-per-filter mode.
The tap-point-multicast-group configuration is incomplete:
multicast group doesn’t exist.
sources, receivers, or group-ips are empty.
sources and receivers overlap.
source or receivers have more than 128 filter interfaces, including the interfaces comprising a filter interface group.
There are more than 4094 distinct tap point groups configured. These limits are global across all flow-diff managed services. For example, filter-interface f1 and filter-interface-group fg1 with only f1 in it is considered the same tap point group.
filter-interface-groups overlap with each other within the same managed service or have more than 128 group members.
filter-interface is being used individually as a tap point and as a part of some filter-interface-group or a multicast-group, where the group also includes other interfaces, thus resulting in partial overlap.
Partial overlap of interfaces in filter-interface-groups and multicast-groups within a flow-diff service.
Reasons for failure are available in the runtime state of the policy and viewed using the show policy policy
name command.
A lack of computed latency reports can mean two things:
Not reaching the sample-count-threshold value. Either lower the sample-count-threshold value until reports are generated or increase the amount of unique packets per flow.
Flows not evicting. The time specified in flow-timeout may be too large and may need to be adjusted to a lower value. Flows will expire when reaching the flow-timeout value. After a flow expires, the system generates a report for that flow.
report-type config has neither latency nor drop option configured.
The delivery-requirement config can also impact the reports since it determines what’s considered a drop or not.
For packet-timeout, this value must be larger than the time expected to receive the same packet on every tap-point. For A->B, if it takes 20ms for the packet to appear at B, the packet-timeout must be larger than this time frame to collect timestamps for both these tap points and compute a latency in one sample.
Note: When using a rate limit, the packet-timeout value may need to be increased.
If all the reports are type 2 unexpected, ensure the taps are in the correct order as configured on the Controller. Also, check the topology is correct and that there are no unexpected taps. If there are only a few unexpected reports, it is most likely an issue with the switch ordering the timestamps. You can ignore these or add the reverse direction onto the topology to turn these into type 0 reports. If there are many drop reports, confirm that the same packet is received at all relevant taps within the packet-timeout window, which defaults to 200ms.
Limitations
This feature is only supported in push-per-filter mode. Any config in push-per-policy mode will not work as intended.
A maximum of 4094 distinct tap points are allowed.
Only 40 timestamped instances of a packet are allowed.
The filter-interface-group used as a tap point must not overlap with any other group within the same managed service and must not have more than 128 members.
The multicast-group used as a tap point must not have its sources and receivers overlap with any other group within that managed service and must not have more than 128 members each.
A filter interface cannot be used as a tap point and simultaneously as a part of a filter-interface-group or multicast-groupsource or receiver, unless the groups have this filter interface as the only member and no other interface.
There is no chaining if a packet flows through three or more tap points in an A->B->C->...->Z topology. The only computed latency reports is for tap-point-pairs A->B, A->C, …, and A->Z if these links are specified, but B->C, C->D, etc., will not be computed.
Service Node interfaces can have multiple lcores depending on the SKU. An lcore is a logical core which processes traffic on an interface. Hardware RSS firmware in some Service Node SKU currently cannot parse L2 header timestamps, so all packets are sent to the same lcore; however, RSS does distribute packets correctly to multiple lcores when using src-mac timestamping.
Each packet from the L3 header and onward gets hashed to a 64-bit value; if two packets hash to the same value, assume the underlying packets are the same.
Currently, on the flow-diff action in the Service Node, if packets are duplicated so that N copies of the same packet are received:
N-1 latencies are computed.
The ingress identifier is the earliest timestamp.
The system reports timestamps as unsigned 32-bit values, with the maximum timestamp being 2^32-1, corresponding to approximately 4.29 seconds.
Only minmeanmax latencies are currently reported.
If there are switch timestamping issues, then these statistics may have high outliers.
Synchronize the time between switches for this feature to work properly, or latency calculation may be inaccurate.
Packets are hashed from the L3 header onward, meaning if there is any corrupted data past the L3 header, it will lead to drop reports. The same packet must appear at two tap points to generate a computed latency report.
In A->B, if B packets appear before A, an unexpected type report is generated.
At whichever tap point the packet first appears with the earliest timestamp, it is considered the source.
While switching the latency configuration, the system may generate a couple of unexpected or drop reports at the beginning.
A LAG may affect RSS on the service node which may affect performance.
Users must have good knowledge of network topology when setting up tap points and configuring timeout or sample threshold values. Improper configuration may lead to drop or unexpected reports.
Occasionally switch timestamping causes the system to generate a few type 2unexpected reports.
The system may generate drop reports from certain protocols, such as OSPF.
The amount of packets per second and packet size influences performance since packets are individually hashed. The amount of tap point pairs and interface groups also affects performance.
This action removes specific headers from the traffic selected by the associated DANZ Monitoring Fabric (DMF) policy. Alternatively, define custom header stripping based on the starting position of the Layer-3 header, the Layer-4 header, the Layer-4 payload, or the first byte in the packet.
Use the following decap actions isolated from the header-strip configuration stanza:
decap-erspan: remove the Encapsulated Remote Switch Port Analyzer (ERSPAN) header.
decap-cisco-fabric-path: remove the Cisco FabricPath protocol header.
decap-l3-mpls: remove the Layer-3 Multi-protocol Label Switching (MPLS) header.
decap-lisp: remove the LISP header.
decap-vxlan [udp-portvxlan port]: remove the Virtual Extensible LAN (VXLAN) header.
decap-geneve: remove the Geneve header.
Note:For the Header Strip and Decap actions, apply post-service rules to select traffic after stripping the original headers.
To customize the header-strip action, use one of the following keywords to strip up to the specified location in each packet:
l3-header-start
l4-header-start
l4-payload-start
packet-start
Input a positive integer representing the offset from which the strip action begins. When omitting an offset, the header stripping starts from the first byte in the packet.
CLI Configuration
The header-strip service action strips the header and replaces it in one of the following ways:
Add the original L2 src-mac, and dst-mac.
Add the original L2 src-mac, dst-mac, and ether-type.
Specify and add a custom src-mac, dst-mac, and ether-type.
The following are examples of custom header stripping:
Important: Beginning with DMF version 8.9, the action keyword is required to add or modify actions within a managed service.
This example strips the header and replaces it with the original L2 src-mac and dst-mac.
The post-service match configuration option enables matching on inner packet fields after the DANZ Monitoring Fabric (DMF) Service Node performs header stripping. This option is applied on the post-service interface after the service node completes the strip service action. Feature benefits include the following:
The fabric can remain in L3/L4 mode. It is not necessary to change to offset match mode.
Easier configuration.
All match conditions are available for the inner packet.
The policy requires only one managed service to perform the strip service action.
With this feature enabled, DMF knows exactly where to apply the post-service match. The following example illustrates this configuration.
Important: Beginning with DMF version 8.9, the action keyword is required to add or modify actions within a managed service.
IP Flow Information Export (IP FIX), also known as NetFlow v10, is an IETF standard defined in RFC 7011. The IPFIX generator (agent) gathers and transmits information about flows, which are sets of packets that contain all the keys specified by the IPFIX template. The generator observes the packets received in each flow and forwards the information to the IPFIX collector (server) in the form as a flowset.
Starting with the DANZ Monitoring Fabric (DMF)-7.1.0 release, NetFlow v9 (Cisco proprietary) and IPFIX/NetFlow v10 are both supported. Configuration of the IPFIX managed service is similar to configuration for earlier versions of NetFlow except for the UDP port definition. NetFlow v5 collectors typically listen over UDP port 2055, while IFPIX collectors listen over UDP port 4739.
NetFlow records are typically exported using User Datagram Protocol (UDP) and collected using a flow collector. For a NetFlow service, the service node takes incoming traffic and generates NetFlow records. The service node drops the original packets, and the generated flow records, containing metadata about each flow, are forwarded out of the service node interface.
The fields specify the measurements to be included in the flowset.
Use the existing IPFIX template commands in the config mode to use the keys introduced in DMF 8.8.0.
tcp-source-port
tcp-destination-port
udp-source-port
udp-destination-port
controller-1(config)#
controller-1(config)# ipfix-template tcp-traffic
controller-1(config-ipfix-template)# key tcp-destination-port
controller-1(config-ipfix-template)# show this
! ipfix-template
ipfix-template tcp-traffic
key tcp-destination-port
Use the same method for all keys added as part of this feature - tcp-destination-port, tcp-source-port, udp-destination-port, and udp-source-port.
Use the template when defining the IPFIX action.
Show Commands
The show commands specific to the new keys introduced in DMF 8.8.0 have not changed. If the new keys are used in any IPFIX template, they are displayed along with other keys.
View the keys used in a given IPFIX template using the following commands:
controller-1(config-ipfix-template)# show ipfix-template port-based-traffic
~~~~~~~~~~~~~~~~~~~~~~~~~~~~~~~~ Ipfix-templates ~~~~~~~~~~~~~~~~~~~~~~~~~~~~~~~~
# Template Name Keys Fields
-|------------------|----------------------------------------------------|------|
1 port-based-traffic ethernet-type, tcp-destination-port, tcp-source-port
To view the IPFIX templates, enter the following command:
config# show running-config ipfix-template
! ipfix-template
ipfix-template IPFIX-IP
template-id 1974
key destination-ipv4-address
key destination-ipv6-address
key ethernet-type
key source-ipv4-address
key source-ipv6-address
field flow-end-milliseconds
field flow-end-reason
field flow-start-milliseconds
field minimum-ttl
field tcp-control-bits
------------------------output truncated------------------------
Records Per Interface Netflow using DST-MAC Rewrite
Destination MAC rewrite for the records-per-interface NetFlow and IPFIX feature is the default setting and applies to switches running Extensible Operating System (EOS) and SWL and is supported on all platforms.
A configuration option exists for using src-mac when overwriting the dst-mac isn't preferred.
Configurations using the CLI
Important: Beginning with DMF version 8.9, the action keyword is required to add or modify actions within a managed service.
Global Configuration
The global configuration is a central place to choose which rewrite option to use for the records-per-interface. The following example illustrates using rewrite-src-mac or rewrite-dst-mac in conjunction with the filter-mac-rewrite command.
The filter-mac-rewrite rewrite-src-mac command cannot be used on the filter interface that is part of the policy using timestamping replace-src-mac. However, the command works when using a timestamping
add-header-after-l2 configuration.
Packet-masking Action
The packet-masking action can hide specific characters in a packet, such as a password or credit card number, based on offsets from different anchors and by matching characters using regular (regex) expressions.
The mask service action applies the specified mask to the matched packet region.
CLI Configuration
Important: Beginning with DMF version 8.9, the action keyword is required to add or modify actions within a managed service.
Controller-1(config)# show running-config managed-service MS-PACKET-MASK
! managed-service
managed-service MS-PACKET-MASK
description "This service masks pattern matching an email address in payload with X"
1 action mask ([a-zA-Z0-9._-]+@[a-zA-Z0-9._-]+.[a-zA-Z0-9_-]+)
service-interface switch CORE-SWITCH-1 ethernet13/1
Pattern-match Action
The pattern-match service action matches and forwards matching traffic and is similar to the pattern-drop service action.
Pattern matching allows content-based filtering beyond Layer-2, Layer-3, or Layer-4 Headers. This functionality allows filtering on the following packet fields and values:
URLs and user agents in the HTTP header
patterns in BitTorrent packets
encapsulation headers for specific parameters including, GTP, VXLAN, and VN-Tag
subscriber device IP (user-endpoint IP)
Pattern matching allows Session Aware Adaptive Packet Filtering and can identify HTTPS transactions on non-standard SSL ports. It can filter custom applications and can separate control traffic from user data traffic.
Pattern matching allows Session-aware Adaptive Packet Filtering (SAPF) to identify HTTPS transactions on non-standard SSL ports. It can filter custom applications and separate control traffic from user data traffic.
Pattern matching is also helpful in enforcing IT policies, such as identifying hosts using unsupported operating systems or dropping unsupported traffic. For example, the Windows OS version can be identified and filtered based on the user-agent field in the HTTP header. The user-agent field may appear at variable offsets, so a regular expression search is used to identify the specified value wherever it occurs in the packet.
CLI Configuration
Use the pattern-matchpattern keyword to enable the pattern-matching service action. Specify the pattern to match for packets to submit to the packet slicing operation.
The following example matches traffic with the string Windows NT
5.(0-1) anywhere in the packet and delivers the packets to the delivery interface TOOL-PORT-TO-WIRESHARK-1. This service is optional and is applied to TCP traffic to destination port 80.
Important: Beginning with DMF version 8.9, the action keyword is required to add or modify actions within a managed service.
The pattern-drop service action drops matching traffic.
Pattern matching allows content-based filtering beyond Layer-2, Layer-3, or Layer-4 Headers. This functionality allows filtering on the following packet fields and values:
URLs and user agents in the HTTP header
patterns in BitTorrent packets
encapsulation headers for specific parameters, including GTP, VXLAN, and VN-Tag
subscriber device IP (user-endpoint IP)
Pattern matching allows Session-aware Adaptive Packet Filtering (SAPF) to identify HTTPS transactions on non-standard SSL ports. It can filter custom applications and separate control traffic from user data traffic.
Pattern matching is also helpful in enforcing IT policies, such as identifying hosts using unsupported operating systems or dropping unsupported traffic. For example, the Windows OS version can be identified and filtered based on the user-agent field in the HTTP header. The user-agent field may appear at variable offsets, so a regular expression search is used to identify the specified value wherever it occurs in the packet.
CLI Configuration
Important: Beginning with DMF version 8.9, the action keyword is required to add or modify actions within a managed service.
Controller-1(config)# show running-config managed-service MS-PACKET-MASK
! managed-service
managed-service MS-PACKET-MASK
description "This service drops traffic that has an email address in its payload"
1 action pattern-drop ([a-zA-Z0-9._-]+@[a-zA-Z0-9._-]+.[a-zA-Z0-9_-]+)
service-interface switch CORE-SWITCH-1 ethernet13/1
Slice Action
The slice service action slices the given number of packets based on the specified starting point in the packet. Packet slicing reduces packet size to increase processing and monitoring throughput. Passive monitoring tools process fewer bits while maintaining each packet's vital, relevant portions. Packet slicing can significantly increase the capacity of forensic recording tools. Apply packet slicing by specifying the number of bytes to forward based on an offset from the following locations in the packet:
Packet start
L3 header start
L4 header start
L4 payload start
Note: The slicing service can currently only parse TCP/UDP/ICMP/ICMP6/GRE/SCTP/ESP protocols.
CLI Configuration
Important: Beginning with DMF version 8.9, the action keyword is required to add or modify actions within a managed service.
Use the slice keyword to enable the packet slicing service action and insert an additional header containing the original header length, as shown in the following example:
The following example truncates the packet from the first byte of the Layer-4 payload, preserving just the original Ethernet header. The service is optional and is applied to all TCP traffic from port 80 with the destination IP address 10.2.19.119
The Timestamp Service Action identifies and timestamps every packet it receives with the time the service node receives the packet for matching traffic.
CLI Configuration
Important: Beginning with DMF version 8.9, the action keyword is required to add or modify actions within a managed service.
The UDP-replication service action copies UDP messages, such as Syslog or NetFlow messages, and sends the copied packets to a new destination IP address.
Configure a rate limit when enabling UDP replication. When upgrading from a version of DANZ Monitoring Fabric (DMF) before release 6.3.1, the UDP-replication configuration is not applied until a rate limit is applied to the delivery interface.
The following example illustrates applying a rate limit to a delivery interface used for UDP replication:
Note: No other service action can be applied after a UDP-replication service action.
CLI Configuration
Enter the 1 udp-replicate command and identify the configuration name (the submode changes to the config-managed-srv-udp-replicate submode) to view and configure a specific UDP-replication configuration.
Important: Beginning with DMF version 8.9, the action keyword is required to add or modify actions within a managed service.
The Service Node forwards packets based on the max-tokens and tokens-per-refresh parameters using the DANZ Monitoring Fabric (DMF) Sample Service feature. The sample service uses one token to forward one packet.
After consuming all the initial tokens from the max-tokens bucket, the system drops subsequent packets until the max-tokens bucket refills using the tokens-per-refresh counter at a recurring predefined time interval of 10ms. Packet sizes do not affect this service.
Arista Networks recommends keeping the tokens-per-refresh value at or below max-tokens. For example, max-tokens =
1000 and tokens-per-refresh = 500.
Setting the max-tokens value to 1000 means that the initial number of tokens is 1000, and the maximum number of tokens stored at any time is 1000.
The max-tokens bucket will be zero when the Service Node has forwarded 1000 packets before the first 10 ms period ends, leading to a situation where the Service Node is no longer forwarding packets. After every 10ms time interval, if the tokens-per-refresh value is set to 500, the max-tokens bucket is refilled using the tokens-per-refresh configured value, 500 tokens in this case, to pass packets the service tries to use immediately.
Suppose the traffic rate is higher than the refresh amount added. In that case, available tokens will eventually drop back to 0, and every 10ms, only 500 packets will be forwarded, with subsequent packets being dropped.
If the traffic rate is lower than the refresh amount added, a surplus of tokens will result in all packets passing. Since the system only consumes some of the tokens before the next refresh interval, available tokens will accumulate until they reach the max-tokens value of 1000. After 1000, the system does not store any surplus tokens above the max-tokens value.
To estimate the maximum possible packets passed per second (pps), use the calculation (1000ms/10ms) * tokens-per-refresh and assume the max-tokens value is larger than tokens-per-refresh. For example, if the tokens-per-refresh value is 5000, then 500000 pps are passed.
The Sample Service feature can be used as a standalone Managed Service or chained with other Managed Services.
Use Cases and Compatibility
Applies to Service Nodes
Limit traffic to tools that cannot handle a large amount of traffic.
Use the Sample Service before another managed service to decrease the load on that service.
The Sample Service is applicable when needing only a portion of the total packets without specifically choosing which packets to forward.
Sample Service Configuration
Create a managed service and enter the service interface.
Choose the sample managed service with the seq
num sample command.
There are two required configuration values: max-tokens and tokens-per-refresh. There are no default values, and the service requires both values.
The max-tokens value is the maximum size of tokens in the token bucket. The service will start with the number of tokens specified when first configured. Each packet passed consumes one token. If no tokens remain, packet forwarding stops. Configure the max-tokens value from a range of 1 to the maximum uint64 (unsigned integer) value of 9,223,372,036,854,775,807.
DMF refreshes the token bucket every 10 ms. The tokens-per-refresh value is the number of tokens added to the token bucket on each refresh. Each packet passed consumes one token, and when the number of tokens drops to zero, the system drops all subsequent packets until the next refresh. The number of tokens in the bucket cannot exceed the value of max-tokens. Configure the tokens-per-refresh value from a range of 1 to the maximum uint64 (unsigned integer) value of 9,223,372,036,854,775,807.
The following example illustrates a typical Sample Service configuration:
Important: Beginning with DMF version 8.9, the action keyword is required to add or modify actions within a managed service.
dmf-controller-1(config-managed-srv-sample)# show this
! managed-service
managed-service MS
!
3 action sample
max-tokens 50000
tokens-per-refresh 20000
Add the managed service to the policy.
Show Commands
Use the show running-config managed-service sample_service_name command to view pertinent details. In this example, the sample_service_name is techpubs.
If the number of packets forwarded by the Service Node interfaces is few, the max-tokens and tokens-per-refresh values likely need to be higher.
If fewer packets than the tokens-per-refresh value forward, ensure the max-tokens value is larger than the tokens-per-refresh value. The system discards any surplus refresh tokens above the max-tokens value.
When all traffic forwards, the initial max-tokens value is too large, or the tokens refreshed by tokens-per-refresh are higher than the packet rate.
When experiencing packet drops after the first 10ms post commencement of traffic, it may be due to a low tokens-per-refresh value. For example, calculate the minimum value of max-tokens and tokens-per-refresh that would lead to forwarding all packets.
Calculation Example
Traffic Rate : 400 Mbps
Packet Size - 64 bytes
400 Mbps = 400000000 bps
400000000 bps = 50000000 Bps
50000000 Bps = 595238 pps (Includes 20 bytes of inter packet gap in addition to the 64 bytes)
1000 ms = 595238 pps
1 ms = 595.238 pps
10 ms = 5952 pps
max-tokens : 5952 (the minimum value)
tokens-per-refresh : 5952 ( the minimum value)
Limitations
In the current implementation, the Service Sample action is bursty. The token consumption rate is not configured to withhold tokens over time, so a large burst of incoming packets can immediately consume all the tokens in the bucket. There is currently no way to select what traffic is forwarded or dropped; it only depends on when the packets arrive concerning the refresh interval.
Setting the max-tokens and tokens-per-refresh values too high will forward all packets. The maximum value is 9,223,372,036,854,775,807, but Arista Networks recommends staying within the maximum values stated under the description section.
Sharing L3 Delivery Interfaces Across Services
Overview
A DMF Controller will allow multiple managed services to share a delivery interface with an IP address, commonly called an L3 delivery interface. These interfaces redirect the packets processed by managed services to the required tool nodes for further analysis. Sharing an L3 delivery interface is useful when applying different actions to a packet that otherwise cannot be chained together in one managed service when sending it to the same destination.
Currently, only a few managed service actions require L3 delivery interfaces. Since these actions must be the terminating action in a given service action chain, DMF allows different services to use the same L3 delivery interface.
This feature applies to all platforms that support managed services with L3 delivery interfaces and the following managed service actions using L3 deliveries:
Netflow
IPFIX
UDP Replicate
TCP Analysis
App ID
Flow Diff
Note: DMF 8.8 supports multiple L3 delivery interfaces on the same subnet and gateway. Refer to the show running-config command example in the Show Commands section.
Configuration
Log into the DMF Controller, select a switch, and create an L3 delivery interface.
Important: Beginning with DMF version 8.9, the action keyword is required to add or modify actions within a managed service.
Create two or more managed services with the actions described previously as the last entry in the sequence. Use the l3-d1 interface created earlier as the l3-delivery-interface for these services. The configuration commands needed may be different for each action. For example, using a managed service with netflow action and another with the udp-replicate action as shown in the following command sequences:
Use the show switch switch1 interface l3
interface command to view the runtime status of the interface:
dmf-controller-1> show switch switch1 interface ethernet31
# IF Name MAC Address Config State Adv. Features Curr Features Supported Features
-|----------|--------------------------|------|-----|-------------|-------------|------------------|
1 ethernet31 5c:16:c7:14:46:bb (Arista) up up 10g 10g 10g
Use the show managed-service command to view the runtime status of the managed services:
dmf-controller-1> show managed-service
~~~~~~~~~~~~~~~~~~~~~~~~~~~~~~~~~~~~~~~~~~~~~~~~~~~~ Managed-service ~~~~~~~~~~~~~~~~~~~~~~~~~~~~~~~~~~~~~~~~~~~~~~~~~
# Service Name Switch Switch Interface Installed Max Post-Service BW Max Pre-Service BW Total Post-Service BW Total Pre-Service BW
-|------------|------|----------------|---------|-------------------|------------------|---------------------|--------------------|
1 ms1 switch1 ethernet2 True 10Gbps 10Gbps 1.02Kbps 99bps
2 ms2 switch1 ethernet1 True 10Gbps 10Gbps 1.02Kbps 99bps
Redundancy of Managed Services Using Two DMF Policies
In this method, users can employ a second policy with a second managed service to provide redundancy. The idea here is to duplicate the policies but assign a lower policy priority to the second DANZ Monitoring Fabric (DMF) policy. In this case, the backup policy (and, by extension, the backup service) will always be active but only receive relevant traffic once the primary policy goes down. This method provides true redundancy at the policy, service-node, and core switch levels but uses additional network and node resources.
Important: Beginning with DMF version 8.9, the action keyword is required to add or modify actions within a managed service.
The DANZ Monitoring Fabric (DMF) supports traffic filtering to specific services hosted in the public cloud and redirecting filtered traffic to customer tools. DMF achieves this functionality by reading the source and destination IP addresses of specific flows, identifying the Autonomous System number they belong to, tagging the flows with their respective AS numbers, and redirecting them to customer tools for consumption.
The following is the list of services supported:
amazon: traffic with src/dst IP belonging to Amazon
ebay: traffic with src/dst IP belonging to eBay
facebook: traffic with src/dst IP belonging to Facebook
google: traffic with src/dst IP belonging to Google
microsoft: traffic with src/dst IP belonging to Microsoft
netflix: traffic with src/dst IP belonging to Netflix
office365: traffic for Microsoft Office365
sharepoint: traffic for Microsoft Sharepoint
skype: traffic for Microsoft Skype
twitter: traffic with src/dst IP belonging to Twitter
default: traffic not matching other rules in this service. Supported types are match or drop.
The option drop instructs the DMF Service Node to drop packets matching the configured application.
The option match instructs the DMF Service Node to deliver packets to the delivery interfaces connected to the customer tool.
A default drop action is auto-applied as the last rule, except when configuring the last rule as match default. It instructs the DMF Service Node to drop packets when either of the following conditions occurs:
The stream's source IP address or destination IP address doesn't belong to any AS number.
The stream's source IP address or destination IP address is affiliated with an AS number but has no specific action set.
Cloud Services Filtering Configuration
Important: Beginning with DMF version 8.9, the action keyword is required to add or modify actions within a managed service.
Managed Service Configuration
Controller(config)# managed-service name
Controller(config-managed-srv)#
Controller(config-managed-srv-appfilter)# 1 drop sharepoint
Controller(config-managed-srv-appfilter)# 2 match google
Controller(config-managed-srv-appfilter)# show this
! managed-service
managed-service sf3
service-interface switch CORE-SWITCH-1 ethernet13/1
!
1 service-app-filter
1 drop sharepoint
2 match google
A policy having a managed service with app-filter as the managed service, but with no matches specified will fail to install. The example below shows a policy incomplete-policy having failed due to the absence of a Match/Drop rule in the managed service incomplete-managed-service.
Controller(config)# show running-config managed-service incomplete-managed-service
! managed-service
managed-service incomplete-managed-service
1 action app-filter
Controller(config)# show running-config policy R730-sf3
! policy
policy incomplete-policy
action forward
delivery-interface TOOL-PORT-1
filter-interface TAP-PORT-1
use-managed-service incomplete-managed-service sequence 1
1 match any
Controller(config-managed-srv-appfilter)# show policy incomplete-policy
Policy Name : incomplete-policy
Config Status : active - forward
Runtime Status : one or more required service down
Detailed Status : one or more required service down - installed to
forward
Priority : 100
Overlap Priority : 0
TCP Analysis (Dapper)
The Dapper action (derived from Brown University research) identifies TCP session issues by measuring specific connection attributes. This analysis determines whether performance degradation stems from the client, server, or network devices. All current Service Node platforms support the Dapper action.
Figure 188. Dapper Action
The action monitors TCP session packets, tracks extensive statistics, and periodically exports them via IPFIX records to a collector. For every session direction, the system generates:
One Start-Session record.
One or more Data records.
One End-Session record.
The collector evaluates these statistics, utilizing six distinct IPFIX templates to diagnose the root cause of network problems.
Start-Session Record
The system transmits the Start-Session record for each direction immediately after session establishment (upon Client ACK). This record captures the initial attributes negotiated during the handshake.
Table 11. Template 6668, IPv4 Start-Session
Offset
ID
Dapper Field
Type
Description
0
8
ipv4_src
ipv4Address
IPv4 source address
1
12
ipv4_dst
ipv4Address
IPv4 destination address
2
7
tcp_src
unsigned16
TCP source address
3
11
tcp_dst
unsigned16
TCP destination address
4
239
biflow_direction
unsigned8
Direction of session (0=unknown, 1=initiator, 2=reverseInitiator)
5
152
start_milliseconds
dateTimeMilliseconds
Session start time in milliseconds since epoch
6
218
tcp_syn_total_count
unsigned64
Number of TCP packets with SYN flag sent (0 if we did not see initiation)
7
32774
window_size
unsigned32
Initial window size in octets
8
32771
expected_flight_size
unsigned32
Expected flight size in octets
9
32822
switch_mac
macAddress
Ethernet address of filter switch
10
32823
switch_port
unsigned16
Port on filter switch
11
6
tcp_control_bits
unsigned16
TCP flags set during initiation (SYN, SYN | ACK, unset if we did not see initiation)
Table 12. Template 6669, IPv6 Start-Session
Offset
ID
Dapper Field
Type
Description
0
27
ipv6_src
ipv6Address
IPv6 source address
1
28
ipv6_dst
ipv6Address
IPv6 destination address
2
7
tcp_src
unsigned16
TCP source address
3
11
tcp_dst
unsigned16
TCP destination address
4
239
biflow_direction
unsigned8
Direction of session (0=unknown, 1=initiator, 2=reverseInitiator)
5
152
start_milliseconds
dateTimeMilliseconds
Session start time in milliseconds since epoch
6
218
tcp_syn_total_count
unsigned64
Number of TCP packets with SYN flag sent (0 if we did not see initiation)
7
32774
window_size
unsigned32
Initial window size in octets
8
32771
expected_flight_size
unsigned32
Expected flight size in octets
9
32822
switch_mac
macAddress
Ethernet address of filter switch
10
32823
switch_port
unsigned16
Port on filter switch
11
6
tcp_control_bits
unsigned16
TCP flags set during initiation (SYN, SYN | ACK, unset if we did not see initiation)
Data Record
The system transmits Data records for each session direction at periodic intervals. It analyzes packet streams up to a configured limit to match data/acknowledgment pairs, recording delay and size metrics. Most statistics reflect averages derived from the sample period.
Note: The system reports fields marked with an asterisk (*) only when the dapper compatibility setting is false.
Table 13. Template 6666, IPv4 Data
Offset
ID
Dapper Field
Type
Description
0
8
ipv4_src
ipv4Address
IPv4 source address
1
12
ipv4_dst
ipv4Address
IPv4 destination address
2
7
tcp_src
unsigned16
TCP source address
3
11
tcp_dst
unsigned16
TCP destination address
4
239
biflow_direction
unsigned8
Direction of session (0=unknown, 1=initiator, 2=reverseInitiator)
5
32768
report_timer
unsigned32
The number of samples in round-trip-time calculations (matching sync/ack pairs)
6
32828
reaction_time
unsigned32
Average time between receiving an ACK and the next data packet
7
32770
flight_size
unsigned32
Average flight size over samples in octets
8
32771
expected_flight_size
unsigned32
Average expected flight size in octets
9
32829
round_trip_time
unsigned32
Average round-trip-time between sync and matching ack in microseconds
10
32773
retransmissions
unsigned32
Counter of retransmitted packets received during sample period
11
32774
window_size
unsigned32
Average window size reported during sample period in octets
12
32775
ecn
unsigned32
Counter of how many packets had ECN flag set during sample period
13*
2
packet_delta
unsigned32
Number of packets received during sample period
14*
1
octet_delta
unsigned64
Number of bytes received during sample period
15*
32830
first_rtt
unsigned32
First round trip time in period in microseconds
16*
32831
min_rtt
unsigned32
Minimum round trip time during period in microseconds
17*
32832
max_rtt
unsigned32
Maximum round time trip during period in microseconds
17*
32833
rtt_standard_deviation
unsigned32
The standard deviation of round trip time measurements during period
18*
32834
recovery_time
unsigned32
Average time between an initial data packet and a retransmission
Table 14. Template 6667, IPv6 Data
Offset
ID
Dapper Field
Type
Description
0
27
ipv6_src
ipv4Address
IPv4 source address
1
28
ipv6_dst
ipv4Address
IPv4 destination address
2
7
tcp_src
unsigned16
TCP source address
3
11
tcp_dst
unsigned16
TCP destination address
4
239
biflow_direction
unsigned8
Direction of session (0=unknown, 1=initiator, 2=reverseInitiator)
5
32768
report_timer
unsigned32
The number of samples in round-trip-time calculations (matching sync/ack pairs)
6
32828
reaction_time
unsigned32
Average time between receiving an ACK and the next data packet
7
32770
flight_size
unsigned32
Average flight size over samples in octets
8
32771
expected_flight_size
unsigned32
Average expected flight size in octets
9
32829
round_trip_time
unsigned32
Average round-trip-time between sync and matching ack in microseconds
10
32773
retransmissions
unsigned32
Counter of retransmitted packets received during sample period
11
32774
window_size
unsigned32
Average window size reported during sample period in octets
12
32775
ecn
unsigned32
Counter of how many packets had ECN flag set during sample period
13*
2
packet_delta
unsigned32
Number of packets received during sample period
14*
1
octet_delta
unsigned64
Number of bytes received during sample period
15*
32830
first_rtt
unsigned32
First round trip time in period in microseconds
16*
32831
min_rtt
unsigned32
Minimum round trip time during period in microseconds
17*
32832
max_rtt
unsigned32
Maximum round time trip during period in microseconds
17*
32833
rtt_standard_deviation
unsigned32
The standard deviation of round trip time measurements during period
18*
32834
recovery_time
unsigned32
Average time between an initial data packet and a retransmission
End-Session Record
Upon session completion (via FIN, RST, or inactivity timeout), the system transmits an End-Session record for each direction containing the termination reason. If statistics remain pending at the end of the session, the system generates a final Data record before the End-Session record
Table 15. Template 6670, IPv4 end-session:
Offset
ID
Dapper Field
Type
Description
0
8
ipv4_src
ipv4Address
IPv4 source address
1
12
ipv4_dst
ipv4Address
IPv4 destination address
2
7
tcp_src
unsigned16
TCP source address
3
11
tcp_dst
unsigned16
TCP destination address
4
239
biflow_direction
unsigned8
Direction of session (0=unknown, 1=initiator, 2=reverseInitiator)
5
152
end_milliseconds
dateTimeMilliseconds
Session end time in milliseconds since epoch
6
32822
switch_mac
macAddress
Ethernet address of filter switch
7
32823
switch_port
unsigned16
Port on filter switch
8
6
tcp_control_bits
unsigned16
TCP flags set during termination (FIN, RST, unset if session was timed out)
Table 16. Template 6671, IPv6 end-session
Offset
ID
Dapper Field
Type
Description
0
27
ipv6_src
ipv6Address
IPv4 source address
1
28
ipv6_dst
ipv6Address
IPv4 destination address
2
7
tcp_src
unsigned16
TCP source address
3
11
tcp_dst
unsigned16
TCP destination address
4
239
biflow_direction
unsigned8
Direction of session (0=unknown, 1=initiator, 2=reverseInitiator)
5
152
end_milliseconds
dateTimeMilliseconds
Session end time in milliseconds since epoch
6
32822
switch_mac
macAddress
Ethernet address of filter switch
7
32823
switch_port
unsigned16
Port on filter switch
8
6
tcp_control_bits
unsigned16
TCP flags set during termination (FIN, RST, unset if session was timed out)
TCP Analysis CLI Configuration
Configure the TCP Analysis feature via the Controller using the managed services framework.
Configuration Steps for TCP Analysis
Define Managed Service: Create a managed service and enter the service interface configuration mode.
Select Action: Enable the TCP analysis function using the command seq num tcp-analysis. This command enters the tcp-analysis submode.
Configure Collector (Required): Define the IPFIX collector destination.
Enter the command: collector ip-address
The UDP port defaults to 4739 and the MTU to 1500, if not specified.
Configure Delivery Interface (Required): Specify the logical interface for exporting records.
Enter the command: l3-delivery-interface delivery
interface name
Configure Sampling (Optional): Set the maximum packet processing limit between data reports.
Enter the command: max-samples-per-report value
Default:128 packets.
Configure Reporting Scope (Optional): Restrict statistics to the original Dapper research set.
Enter the command: include-dapper-elements
Behavior: Enabling this command limits the output to standard Dapper statistics. Omitting it enables the Service Node to report additional extended statistics.
Apply Policy: Associate the managed service with a policy.
The policy itself does not require a physical delivery interface.
The following example configures a TCP Analysis action to export IPFIX records to a DMF Analytics Node (Collector IP 192.168.1.1) via the tcp-analysis-to-analytics interface.
The tcp-analysis action requires the presence of tap points within the fabric.
Important: Configure tap points to deliver exactly one copy of every packet for each TCP session to the action. If utilizing multiple tap points, restrict the configuration to capture in a single direction to prevent packet duplication.
TCP Analysis Show Commands
The following show commands provide helpful information.
Use the show running-config managed-service managed
service command to verify the completeness of the tcp-analysis configuration.
Use the show managed-services managed service command to display operational status and information for the specified service.
dmf-controller-1(config)# show managed-services tcp-analysis
# Service Name Switch Switch Interface Installed Max Post-Service BW Max Pre-Service BW Total Post-Service BW Total Pre-Service BW
-|------------|---------------|----------------|---------|-------------------|------------------|---------------------|--------------------|
1 tcp-analysis DCS-7050CX3-32S ethernet2/4 True 25Gbps 25Gbps 624Kbps 432Mbps
Use the show running-config policy policy command to verify that the tcp-analysis service is correctly associated with the specified policy.
dmf-controller-1(config)# show running-config policy p1
! policy
policy p1
action forward
filter-interface ingress
use-managed-service ms1 sequence 1
1 match any
Use the show policy policy command to display detailed policy information and identify errors related to the tcp-analysis service.
The Service Interfaces column provides the following traffic statistics:
Tx: Packets transmitted to the Service Node for analysis.
Rx: IPFIX packets received from the Service Node.
dmf-controller-1 (config)# show policy tcp-analysis-1
Policy Name : tcp-analysis-1
Config Status : active - forward
Runtime Status : installed
Detailed Status : installed - installed to forward
Priority : 100
Overlap Priority : 0
# of switches with filter interfaces : 1
# of switches with delivery interfaces : 1
# of switches with service interfaces : 1
# of filter interfaces : 1
# of delivery interfaces : 1
# of core interfaces : 4
# of services : 1
# of pre service interfaces : 1
# of post service interfaces : 1
Push VLAN : 2
Post Match Filter Traffic : 215Mbps
Total Delivery Rate : -
Total Pre Service Rate : 217Mbps
Total Post Service Rate : -
Overlapping Policies : none
Component Policies : none
Runtime Service Names : tcp-analysis
Installed Time : 2023-11-16 18:15:27 PST
Installed Duration : 19 minutes, 45 secs
~ Match Rules ~
# Rule
-|-----------|
1 1 match any
~~~~~~~~~~~~~~~~~~~~~~~~~~~~~~~~~~~~~~~~~~~~ Filter Interface(s) ~~~~~~~~~~~~~~~~~~~~~~~~~~~~~~~~~~~~~~~~~~~~
# DMF IF Switch IF Name State Dir Packets Bytes Pkt Rate Bit Rate Counter Reset Time
-|------|--------|----------|-----|---|--------|-----------|--------|--------|------------------------------|
1 BP1 7280SR3E Ethernet25 up rx 24319476 27484991953 23313 215Mbps 2023-11-16 18:18:18.837000 PST
~~~~~~~~~~~~~~~~~~~~~~~~~~~~~~~~~~~~~~~~~ Delivery Interface(s) ~~~~~~~~~~~~~~~~~~~~~~~~~~~~~~~~~~~~~~~~~
# DMF IF Switch IF Name State Dir Packets Bytes Pkt Rate Bit Rate Counter Reset Time
-|-------|---------|----------|-----|---|-------|------|--------|--------|------------------------------|
1 AN-Data 7050SX3-1 ethernet41 up tx 81 117222 0 - 2023-11-16 18:18:18.837000 PST
~~~~~~~~~~~~~~~~~~~~~~~~~~~~~~~~~~~~~~~~~~~~~~~~~~~~~~~~~ Service Interface(s) ~~~~~~~~~~~~~~~~~~~~~~~~~~~~~~~~~~~~~~~~~~~~~~~~~~~~~~~~~
# Service name Role Switch IF Name State Dir Packets Bytes Pkt Rate Bit Rate Counter Reset Time
-|------------|------------|---------------|-----------|-----|---|--------|-----------|--------|--------|------------------------------|
1 tcp-analysis pre-service DCS-7050CX3-32S ethernet2/4 up tx 23950846 27175761734 23418 217Mbps 2023-11-16 18:18:18.837000 PST
2 tcp-analysis post-service DCS-7050CX3-32S ethernet2/4 up rx 81 117546 0 - 2023-11-16 18:18:18.837000 PST
~~~~~~~~~~~~~~~~~~~~~~~~~~~~~~~~~~~~~~~~~~~~~ Core Interface(s) ~~~~~~~~~~~~~~~~~~~~~~~~~~~~~~~~~~~~~~~~~~~~~
# Switch IF Name State Dir Packets Bytes Pkt Rate Bit Rate Counter Reset Time
-|---------------|----------|-----|---|--------|-----------|--------|--------|------------------------------|
1 7050SX3-1 ethernet7 up rx 23950773 27175675524 23415 217Mbps 2023-11-16 18:18:18.837000 PST
2 7050SX3-1 ethernet56 up rx 81 117222 0 - 2023-11-16 18:18:18.837000 PST
3 7050SX3-1 ethernet56 up tx 23950773 27175675524 23415 217Mbps 2023-11-16 18:18:18.837000 PST
4 7280SR3E Ethernet7 up tx 24319476 27484991953 23313 215Mbps 2023-11-16 18:18:18.837000 PST
5 DCS-7050CX3-32S ethernet28 up tx 81 117546 0 - 2023-11-16 18:18:18.837000 PST
6 DCS-7050CX3-32S ethernet28 up rx 23950846 27175761734 23418 217Mbps 2023-11-16 18:18:18.837000 PST
~ Failed Path(s) ~
None.
Packet Recording via the Service Node
This release adds a new managed service action, called Record, to the Service Node (SN). This action enables packet recording using an SN similar to a Recorder Node (RN) and supports basic packet recording and querying capabilities.
The SN accumulates packets, writes packet data to local storage disks, and indexes information based on configured fields. Various query types retrieve recorded packets, analyze traffic patterns, and investigate network issues.
The Controller includes the managed service action record to enable packet recording on an SN.
The DCA-DM-SNR660 SKU exclusively supports the record action, as this hardware includes the dedicated storage disks required for packet capture. Consequently, this feature is available on switchless physical units but remains unsupported on virtual SNs.
Table 17. Support Matrix
Deployment Type
Support Status - Record Feature
Physical SN (Switchless)
Supported
Virtual SN
Not Supported
Important: Ensure the hardware is a physical SNR660 model; virtual instances lack the disk architecture to handle recording tasks.
Using the CLI to Configure Packet Recording
Managed Service and Policy Configuration
Configure packet recording through the Controller as an SN action in managed services. The managed service action record applies only to SNs that support recording. The action requires no additional configuration values. Use the show service-node SN-NAME property command to verify the recording capability of an SN.
The record action must occupy the last position in a managed service sequence. While multiple services can include a record action, configure only one record action per SN to prevent system performance impact.
Important: Beginning with DMF version 8.9, the action keyword is required to add or modify actions within a managed service.
Policy configuration with a record managed service requires adherence to these constraints:
Traffic terminates at the SN; therefore, do not configure a delivery interface—policies with both a delivery
interface and a record service fail.
Policies must exclude all other managed services. The system throws a validation exception if other services exist.
The record managed service must remain non-optional.
Multiple policies can share the record managed service.
Indexing
The indexing config mode defines the packet header fields that an SN indexes for recorded traffic. Indexed fields allow specific criteria for filtering packets during queries. For example, indexing the IP protocol enables queries for all TCP packets recorded within a specific time range. Indexing facilitates faster queries based on packet attributes.
The available indexing fields are the following:
mac-src: Index the source MAC of recorded frames
mac-dst: Index the destination MAC of recorded frames
ipv4-src: Index IPv4 source address
ipv4-dst: Index IPv4 destination address
ipv6-src: Index IPv6 source address
ipv6-dst: Index IPv6 destination address
ip-proto: Index IP protocol
port-src: Index source port
port-dst: Index destination port
vlan-1: Index outer VLAN ID
vlan-2: Index inner/middle VLAN ID
vlan-3: Index innermost VLAN ID
mpls: Index MPLS label
community-id: Index the community ID
mw-device-id: Index MetaWatch device ID if MetaWatch trailer is present
mw-port-id: Index MetaWatch port ID if MetaWatch trailer is present
By default, the system enables the following fields: vlan-1, ipv4-src, ipv4-dst, ipv6-src, ipv6-dst, ip-proto, port-src, port-dst.
Note: While the indexing configuration applies to all SNs, only SNs that support recording use these settings. Configuring indexing on an SN without recording support results in no functional impact.
Enter the following commands to configure indexing:
Disable indexing for a specific field using the no prefix.
dmf-controller-1(config-service-node-recording-indexing)# no field-name
Global Query Settings
Global query settings apply fabric-wide to all recording devices.
Max Result Size
Set the maximum size of query results using the max-result-size parameter. This parameter specifies the maximum query result size in bytes. A value of zero indicates "unlimited," allowing the result to occupy all available storage space for query results. The default value is 268435456 bytes (256 MB).
The following command enables sFlow®* for the recorder across the fabric:
dmf-controller-1(config)# recorder-node sflow
RBAC Permissions (Optional)
Role-Based Access Control (RBAC) permissions enable group access for running export and analysis queries on a specific SN. The following commands grant these permissions to a group other than ADMIN or SYSTEM:
dmf-controller-1(config)# group group-name
dmf-controller-1(config-group)# entity entity-name
dmf-controller-1(config-group-entity)# associate recorder-node sn1
dmf-controller-1(config-group-entity)# permissions export
dmf-controller-1(config-group-entity)# permissions use
Show Commands
Use the show service-node [all | name] property command to determine which SNs support recording. Verify this support before configuring managed services. Configuring a managed service with a record action on an unsupported SN generates a fabric warning and causes the policy to fail for that service.
dmf-controller-1> show service-node sn1 property
Service Node : sn1
Dzgre : unsupported
Recording : supported
Use the show service-node name table contents
record command to verify that the SN successfully programs the record gentable. The SN will not record packets if the record gentable is missing.
dmf-controller-1> show service-node sn1 table contents record
~~~~~~~~~~~~~~~~~~~~ Records ~~~~~~~~~~~~~~~~~~~~
Device name Record Entry key Entry value
--------------------|------|---------|-----------|
sn1 0 Port(1)
Managed Service
The show service-node name interface stats command provides details about service interface health by displaying drops or errors. These drops and errors occur before packets reach the recording service.
dmf-controller-1# c1(config)# show service-node sn1 interface stats
Service node Name Rx Pkts Rx Bytes Rx Drop Rx Errors Tx Pkts Tx Bytes Tx Drop Tx Errors
------------|----|-------|--------|-------|---------|-------|--------|-------|---------|
sn1 sni1 78 16242 0 0 565 66285 0 0
sn1 sni2 79 16316 0 0 565 66051 0 0
For action-specific statistics, the show managed-service-device sn-name stats command displays rx, tx, and applied packet/byte counters for the service using recording. For the record action, applied counters describe packets written to disk. A discrepancy between the rx and applied counters indicates a potential issue with disk IO, such as packets failing to write to disk.
Note: Since record is a terminating action, tx counters are expected to be 0.
dmf-controller-1> show managed-service-device sn1 stats
~~~~~~~~~~~~~~~~~~~~~~~~~~~~~~~~~~~~~~~~~~~~~~~~~~~~~~~~~~~~~~~~~~~~~~~~~~~ Stats ~~~~~~~~~~~~~~~~~~~~~~~~~~~~~~~~~~~~~~~~~~~~~~~~~~~~~~~~~~~~~~~~~~~~~~~~~~~
# Interface Name Service Name Action Load Rx packets Rx bytes Rx Bit Rate Applied packets Applied bytes Applied Bit Rate Tx packets Tx bytes Tx Bit Rate
-|--------------|-------------|------|----|----------|-----------|-----------|---------------|-------------|----------------|----------|--------|-----------|
1 sni1 ms1 record low 46021696 11782283982 102Kbps 46021696 11782283982 102Kbps 0 0 -
The show policy policy command provides detailed information about a policy and identifies any errors related to the record service. The Service Interfaces section displays packets transmitted to the SN and IPFIX packets received from the SN. These stats appear under the pre-service role; packets do not egress from the SN post-service.
Note: Policies using the recording service do not display a delivery interface.
dmf-controller-1> show policy policy1
Policy Name : policy1
Config Status : active - forward
Runtime Status : installed
Detailed Status : installed - Installed to forward
Priority : 100
Overlap Priority : 0
# of switches with filter interfaces : 1
# of switches with delivery interfaces : 0
# of switches with service interfaces : 1
# of filter interfaces : 1
# of delivery interfaces : 0
# of core interfaces : 0
# of services : 1
# of pre service interfaces : 1
# of post service interfaces : 1
Push VLAN : 2
Post Match Filter Traffic : -
Total Delivery Rate : -
Total Pre Service Rate : -
Total Post Service Rate : -
Overlapping Policies : none
Component Policies : none
Runtime Service Names : ms1
Installed Time : 2025-10-29 17:20:38 UTC
Installed Duration : 11 hours, 8 minutes
Timestamping enabled : False
~ Match Rules ~
# Rule
-|-----------|
1 1 match any
~~~~~~~~~~~~~~~~~~~~~~~~~~~~~~~~~~~~~~~~~~~~~~~~~~~~ Filter Interface(s) ~~~~~~~~~~~~~~~~~~~~~~~~~~~~~~~~~~~~~~~~~~~~~~~~~~~~
# DMF IF Switch IF Name State Dir Packets Bytes Pkt Rate Bit Rate Counter Reset Time
-|------|---------------------------|------------|-----|---|-------|--------|--------|--------|------------------------------|
1 F1 dmf-r267-tb2-7280dr3am-54-1 Ethernet25/1 up rx 60000 30720000 0 - 2025-10-29 15:55:36.435000 UTC
~ Delivery Interface(s) ~
None.
~~~~~~~~~~~~~~~~~~~~~~~~~~~~~~~~~~~~~~~~~~~~~~~~~~~~~~~~~~~~~ Service Interface(s) ~~~~~~~~~~~~~~~~~~~~~~~~~~~~~~~~~~~~~~~~~~~~~~~~~~~~~~~~~~~~~
# Service name Role Switch IF Name State Dir Packets Bytes Pkt Rate Bit Rate Counter Reset Time
-|------------|------------|---------------------------|-----------|-----|---|-------|--------|--------|--------|------------------------------|
1 ms1 pre-service dmf-r267-tb2-7280dr3am-54-1 Ethernet4/1 up tx 60000 30720000 0 - 2025-10-29 15:55:36.435000 UTC
2 ms1 post-service dmf-r267-tb2-7280dr3am-54-1 Ethernet4/1 up rx 0 0 0 - 2025-10-29 15:55:36.435000 UTC
~ Core Interface(s) ~
None.
~ Failed Path(s) ~
None.
If the managed service is down, the show fabric warnings
service-action-invalid command provides troubleshooting details.
dmf-controller-1> show fabric warnings service-action-invalid
~~~~~~~~~~~~~~~~~~~~~~~~~ Service with an invalid action ~~~~~~~~~~~~~~~~~~~~~~~~~~
# Name Warning
-|-------|-------------------------------------------------------------------------|
1 record2 Managed service record2 has invalid action record; Recording action is not supported on service node
Recording Health
The following commands display recording health stats for an SN.
Mount Health
The show service-node name recording
mount-health command displays the status of the file system mount points.
dmf-controller-1> show service-node sn1 recording mount-health
Collection Time : 2025-10-30 04:40:38 UTC
~~~~~~~~~~~~~~~~~~ Index Mount(s) ~~~~~~~~~~~~~~~~~~
Volume Mount Point File System Mount Point Health
---------|-----------|-----------|------------------|
/dev/sdb1 /idx xfs healthy
~~~~~~~~~~~~~~~~~~ Packet Mount(s) ~~~~~~~~~~~~~~~~~~
Volume Mount Point File System Mount Point Health
---------|-----------|-----------|------------------|
/dev/sda1 /pkt xfs healthy
Query Service Health
The show service-node name recording
query-health command verifies the status of the core query service (Stenographer). This output tracks file initialization and caching metrics across recording instances.
The show service-node name recording
storage-health command provides a detailed breakdown of disk utilization for both packet data and indexing metadata.
dmf-controller-1> show service-node sn1 recording storage-health
Collection Time : 2025-10-30 04:46:40 UTC
Index Utilization : 0%
Index Free : 1.73TB
Index Total : 1.74TB
Backup Index Utilization : 0%
Backup Index Free : 0B
Backup Index Total : 0B
Packet Utilization : 0%
Packet Free : 28.9TB
Packet Total : 29.1TB
Backup Packet Utilization : 0%
Backup Packet Free : 0B
Backup Packet Total : 0B
Queries
SNs support several query types for retrieving and analyzing recorded data. While the UI supports all query types, the CLI supports only a subset.
Supported Query Types
window: Displays the time range of available recorded packets.
size: Reports the number of packets and total data size matching a filter.
packet-data: Generates a PCAP file of the filtered traffic.
packet-object: Generates a TGZ archive of the filtered traffic.
analysis-http-tree: Analyzes HTTP traffic in a tree structure.
analysis-http-srv-tree: Analyzes HTTP server traffic in a tree structure.
Use the query recorder-node name packet-data filter
"string" or query
recorder-node name packet-object filter
"string" commands to generate download URLs for traffic files.
Use the abort recorder-node name filter
"string" command to cancel ongoing queries. SNs currently support cancellation by the filter string rather than by query ID.
dmf-controller-1> abort recorder-node sn1 filter "before 5s ago"
Abort any request with the specified filter? This cannot be undone. enter "yes" (or "y") to continue: y
None.
Query Cancellation Verification
Executing the abort recorder-node name filter command terminates any ongoing queries matching the specified filter. For example, a packet-object query running in a separate terminal displays a cancellation error when aborted:
Use the show recorder-node query-history command to audit previously executed queries, including the Query string, Type, Start time, and Duration.
dmf-controller-1> show recorder-node query-history
# Recording Device Query Type Start Duration
---|--------------------|----------------------------------------------------------|-------------|-----------------------|--------|
1 dmf-rack267-tb2-sn-1 after 1m ago packet-data 2025-10-29 10:01:24 UTC 5258
2 dmf-rack267-tb2-sn-1 after 2025-10-29T10:00:24Z packet-data 2025-10-29 10:01:24 UTC 5258
3 dmf-rack267-tb2-sn-1 after 1m ago packet-data 2025-10-29 10:02:16 UTC 5201
4 dmf-rack267-tb2-sn-1 after 2025-10-29T10:01:16Z packet-data 2025-10-29 10:02:16 UTC 5201
5 dmf-rack267-tb2-sn-1 after 1m ago size 2025-10-29 10:03:35 UTC 5220
6 dmf-rack267-tb2-sn-1 after 2025-10-29T10:02:35Z size 2025-10-29 10:03:35 UTC 5220
7 dmf-rack267-tb2-sn-1 before 1m ago size 2025-10-29 10:05:46 UTC 5219
8 dmf-rack267-tb2-sn-1 before 2025-10-29T10:04:46Z size 2025-10-29 10:05:46 UTC 5219
9 dmf-rack267-tb2-sn-1 before 2025-10-29T10:09:02Z size 2025-10-29 10:10:02 UTC 5196
10 dmf-rack267-tb2-sn-1 before 1m ago size 2025-10-29 10:10:02 UTC 5196
11 dmf-rack267-tb2-sn-1 before 2025-10-29T10:09:25Z size 2025-10-29 10:10:25 UTC 5212
12 dmf-rack267-tb2-sn-1 before 1m ago size 2025-10-29 10:10:25 UTC 5212
13 dmf-rack267-tb2-sn-1 before 1m ago size 2025-10-29 10:10:44 UTC 5194
14 dmf-rack267-tb2-sn-1 before 2025-10-29T10:09:44Z size 2025-10-29 10:10:44 UTC 5194
15 dmf-rack267-tb2-sn-1 before 2025-10-29T10:17:33Z size 2025-10-29 10:18:33 UTC 5208
16 dmf-rack267-tb2-sn-1 before 1m ago size 2025-10-29 10:18:33 UTC 5208
17 dmf-rack267-tb2-sn-1 before 1m ago size 2025-10-29 10:20:19 UTC 5214
18 dmf-rack267-tb2-sn-1 before 2025-10-29T10:19:19Z size 2025-10-29 10:20:19 UTC 5214
19 dmf-rack267-tb2-sn-1 before 2025-10-29T10:16:51Z packet-data 2025-10-29 10:26:51 UTC 5547
20 dmf-rack267-tb2-sn-1 before 10m ago packet-data 2025-10-29 10:26:51 UTC 5547
21 dmf-rack267-tb2-sn-1 before 10m ago packet-data 2025-10-29 10:55:36 UTC 5554
Quick Verification Commands
Confirm Recording Support: Use the show
service-node property command to ensure the SN hardware supports recording.
Verify Table Programming: Use the show
service-node table contents record command to confirm the recording gentable is active.
Audit Disk Writes: Use the show
managed-service-device stats command to compare Rx packets against Applied packets, ensuring data is successfully written to disk.
Troubleshooting
The following steps facilitate troubleshooting when the record action is configured on a Service Node but is not performing as expected:
Use the show service-node name property command to check if the Service Node supports recording.
Check for any managed service action related warnings using the show
fabric warnings service-action-invalid command.
Use the show managed-service name command to verify if the service is installed.
Use the show service-node name interface
stats command to show the Rx/Tx stats including drops and errors.
Verify policy status, as a policy using the record managed service can fail if a delivery interface is added to the configuration, or if the record service is inactive due to the reasons mentioned above.
Use the show policy name command to verify if the traffic is being sent to the service interface. This command does not confirm if the Service Node is actually recording the packets to the disk, but the output provides an indication that the policy configuration is working as expected and the issue is likely on the Service Node.
If the Controller side config appears correct, verify if the Service Node is informed of recording being enabled. This verification is performed by checking if the record gentable is successfully programmed on the Service Node. Use the show service-node name table contents
record command to verify the table.
If there is any discrepancy between the interface stats and the data recorded on the SN, use the following command to check the Service Node disk and recording engine health.
dmf-controller-1> show service-node name recording [mount-health | query-health | storage-health]
If a query fails to run, verify the necessary permissions by checking allowed queries with the show recorder-node allowed-queries command.
Use the show debug debug-counters name description command to view SN debug counters pertaining to writing packets to disk.
The following example shows the record debug counters which appear under normal operating conditions.
Additional record debug counters that indicate potential issues include:
missing_tmc : missing traffic metadata config
no_timestamp : no timestamp in traffic metadata
in_flight_empty : unable to allocate write-block
write_error : write error
packets_lost : number of packets which write failed
active_null : number of packets lost due to insufficient blocks/buffers
post_error : failure when posting request
cqe_op_unknown : uring cqe op unknown
completion_user_data : uring completion user_data value out of bounds
record_file_exhaustion : unable to allocate files entry
open_fail : unable to open/create record file
chown_fail : unable to chown record file
Limitations
The Service Node will not provide memory and cpu stats for recording-specific applications, as the device can support other features while recording, so resource usage is not exclusive to packet recording.
In this release, the Service Node supports only a subset of the queries available on a Recorder Node. The Service Node does not support the following queries:
sip-conversations
tcp-conversations
udp-conversations
analysis-dns-tree
http-request
host
rtp-stream
http-statistics
event
The Service Node also excludes support for the following operations:
Erasing packets from a SN (delete recorder-node name ...).
Replay packets (replay recorder-node name ...).
Ongoing queries (show recorder-node
queries).
Query cancellation is only doable using filter, and not by id. In other words, abort
recorder-node name id ... is not supported.
Service Nodes do not support the packet storage management options available for Recorder Nodes. Instead, the Service Node uses a fixed storage management policy. After the packet or index disk reaches 95% capacity, the system automatically deletes the oldest stored packets. The device will delete the minimum amount of packets required to fall below this threshold. In Recorder Node terms, the Service Node uses a max-disk-utilization of 95 and a disk-full-policy of rolling-fifo.
The Recorder Node dashboard on the Analytics Node does not include the Service Nodes under disk utilization chart Recorder Node Disk, or under Recorder Node Statuses. Currently, it only displays the service interface and policy stats.
Session Slicing for TCP and UDP Sessions
Session-slice keeps track of TCP and UDP sessions (distinguished by source and destination IP address and port) and counts the number of packets sent in each direction (client-to-server and vice versa). After recognizing the session, the action transmits a user-configured number of packets to the tool node.
For TCP packets, session-slice tracks the number of packets sent in each direction after establishing the TCP handshake. Slicing begins after the packet count in a direction has reached the configured threshold in both directions.
For UDP packets, slicing begins after reaching the configured threshold in either direction.
By default, session-slice will operate on both TCP and UDP sessions but is configurable to operate on only one or the other.
Note: The count of packets in one direction may exceed the user-configured threshold because fewer packets have arrived in the other direction. Counts in both directions must be greater than or equal to the threshold before dropping packets.
Refer to the DANZ Monitoring Fabric (DMF) Verified Scale Guide for session-slicing performance numbers.
Configure session-slice in managed services through the Controller as a Service Node action.
Configure session-slice in managed services through the Controller as a Service Node action.
Important: Beginning with DMF version 8.9, the action keyword is required to add or modify actions within a managed service.
Configuration Steps
Create a managed service and enter the service interface.
Choose the session-slice service action with the command: seq num session-slice
Note: The seq num session-slice command opens the session-slice submode, which supports two configuration parameters: slice-after and idle-timeout.
Use slice-after to configure the packet threshold, after which the Service Node will stop forwarding packets to tool nodes.
Use idle-timeout to configure the timeout in milliseconds before an idle connection is removed from the cache. idle-timeout is an optional command with a default value of 60000 ms.
The show managed-services managed service command provides status information about the service.
dmf-controller-1(config)# show managed-services managed_service_1
# Service Name Switch Switch Interface Installed Max Post-Service BW Max Pre-Service BW Total Post-Service BW Total Pre-Service BW
-|-----------------|---------------|----------------|---------|-------------------|------------------|---------------------|--------------------|
1 managed_service_1 DCS-7050CX3-32S ethernet2/4 True 25Gbps 25Gbps 624Kbps 432Mbps
Regex-Session Action
Description
The regex-session action enables matching of Regular Expression patterns against packet content. When a packet matches the specified pattern, its session is tracked based on configured timeouts and other parameters including, anchor, offset, and ip-proto.
Table 18. Configuration Parameters
Parameter
Description
Optional
pattern
Regular expression to match against packet content.
No
anchor
Anchor where to start regex matching. The default is packet-start.
Yes
offset
Offset from anchor where to start regex matching. The default is 0.
Yes
tcp-idle-timeout
The number of milliseconds a TCP connection may be idle before it is removed from the session cache. The default is 60000 milliseconds.
Yes
udp-idle-timeout
The number of milliseconds a UDP connection may be idle before it is removed from the session cache. The default is 60000 milliseconds.
Yes
ip-proto
Protocol to track. 6=TCP or 17=UDP. If not specified, both protocols are tracked.
Yes
Configuration
Command Line Interface
Important: Beginning with DMF version 8.9, the action keyword is required to add or modify actions within a managed service.
Configure the regex-session action under the managed-service submode. To configure regex-session parameters, enter the regex-session submode and configure the parameters in the regex-session submode.
Configuration Notes:
Configuring an anchor requires specifying an offset value.
The pattern must be a valid Java regular expression.
DMF only supports TCP and UDP protocols for tracking.
dmf-controller-1(config)# managed-service Test
dmf-controller-1(config-managed-srv)# 1 action regex-session
dmf-controller-1(config-managed-srv-regex-session)# pattern [a-zA-Z0-9._%+-]+@[a-zA-Z0-9.-]+\.[a-zA-Z]{2,}
Configure optional parameters.
dmf-controller-1(config-managed-srv-regex-session)# ip-proto
<Ip-proto> Protocol to track. 6=TCP or 17=UDP. If not specified, both protocols are tracked.
dmf-controller-1(config-managed-srv-regex-session)# ip-proto 6
dmf-controller-1(config-managed-srv-regex-session)# anchor l3-header-start l4-payload-start ; >
l4-header-start packet-start | <cr>
dmf-controller-1(config-managed-srv-regex-session)# anchor l3-header-start
Offset from configured anchor
dmf-controller-1(config-managed-srv-regex-session)# anchor l3-header-start 10
dmf-controller-1(config-managed-srv-regex-session)# tcp-idle-timeout 50000
dmf-controller-1(config-managed-srv-regex-session)# udp-idle-timeout 65000
Show Commands
The show commands specific to regex-session have not changed from standard managed service commands. If a managed service includes regex-session actions, the output displays those actions and their parameters along with the other configured actions.
dmf-controller-1(config-managed-srv)# show running-config managed-service Test
! managed-service
managed-service Test
!
1 regex-session
anchor l3-header-start 10
ip-proto 6
pattern [a-zA-Z0-9._%+-]+@[a-zA-Z0-9.-]+\.[a-zA-Z]{2,}
tcp-idle-timeout 50000
udp-idle-timeout 65000
Filter Managed Service Action
The Filter Managed Service Action filters packets on the Service Node (SN) interface and supports optional VLAN tagging. Utilizing ACL rules, the system forwards or drops matched traffic. Traffic tagged with a VLAN exits the interface (Tx) after processing through the action chain. VLAN tagging specifically facilitates traffic steering in Switch-less SN deployments, where the forwarding plane relies on VLANs. This configuration produces no functional impact when the SN connects directly to a DMF switch within the fabric.
The feature is compatible with all platforms.
Configuration
Managed service configuration supports Service Nodes connected to a DMF switch or operating in switch-less mode. The configured interface type (installation point) determines how the service is programmed. Configure the Filter Managed Service Action feature using the GUI or CLI. A Summary section provides a consolidated reference of the Filter Managed Service Action specifications, configuration limits, and operational behaviors.
Using the CLI to Configure Filter Managed Service Action
Configure a managed service using the following command.
dmf-controller-1>
dmf-controller-1> en
dmf-controller-1# config
dmf-controller-1(config)# managed-service ms1
Configure a Service Interface
Configuring the Service Interface triggers a validation sequence. The system verifies that the SN connects to a DMF switch and that a policy utilizes the service. The Controller proceeds with installation on the SN only after passing these checks.
Configuring the Service Node Interface designates the managed service for switch-less operation. This mode applies when the SN lacks a physical connection to a DMF switch or when the Controller is unable to discover the link. The Controller installs the managed service immediately upon valid configuration, without requiring policy association. However, any DMF policy configured with this service will fail due to the absence of a reachability path from the fabric.
The Filter action functions at any position within the managed service action sequence. Configuring it as the initial action filters and tags traffic on the service node interface, passing only the filtered traffic to subsequent actions in the chain.
Important: Beginning with DMF version 8.9, the action keyword is required to add or modify actions within a managed service.
The Filter configuration supports defining a default action and an optional forwarding VLAN. The system applies this default behavior to every ACL rule upon installation, though individual rules can override it.
In the following example, the configuration tags matching packets with VLAN 100 and forwards them to the service node interface Tx (post-processing).
ACL definitions begin with a sequence number that determines the packet matching order (lowest to highest). The logic supports 5-tuple matching based on:
Source/Destination IP
Source/Destination Port
Protocol Number
Rule Configuration Examples
Action Override (Drop) Specific ACL rules can override the global default action. The following command drops TCP traffic from Source IP 1.1.1.1 to Destination IP 2.2.2.2, provided the packet does not match a lower-sequence rule.
dmf-controller-1(config-managed-srv-filter)# 10 drop src-ip 1.1.1.1 dst-ip 2.2.2.2 ip-proto 6
Subnet Matching Source and Destination IP fields support subnet masks to match specific host ranges.
3. Port Ranges The configuration accepts individual ports or port ranges. The following rule matches TCP traffic from the specified Source IP/Port to any destination port within the range 1–100.
The Controller expands missing matches at runtime to generate complete rules. A complete rule strictly requires Source/DestinationIP, Source/Destination Port, and Protocol Number.
IP Expansion: If the configuration lacks a specific IP match, the Controller generates ACL rules for both IPv4 and IPv6 using the corresponding wildcard values.
Protocol Expansion: If the protocol remains undefined, the Controller expands the entry into separate ACL rules for TCP and UDP traffic.
Expansion Example: Configuring a single rule, such as 11 drop
any, triggers the Controller to generate four distinct rules to cover all IP versions and protocols:
Each Filter managed service action supports a maximum of 2048 rules. The Controller calculates this total based on the expanded runtime rules rather than the initial configuration lines.
The system tracks IPv4 and IPv6 rules in separate tables, with each table supporting 1024 entries post-expansion.
Capacity Handling: Upon reaching table capacity, the system halts the installation of further expanded rules.
Overflow Behavior: The Controller skips any configured rule if the corresponding table (IPv4 or IPv6) is full.
Show Commands
Use the show running-config managed-service Service
name command to display the complete configuration for a managed service.
The following example illustrates a managed service (ms1) configured with a Filter function on a switch-less Service Node (sn1). The deployment targets interfaces sni1 and sni2, implementing two forward rules and one drop rule.
Use the show managed-service Service name command to verify that the system successfully installed the managed service on the Service Node.
For switch-less Service Node deployments, the output omits the switch name and interface details.
dmf-controller-1# show managed-service
~~~~~~~~~~~~~~~~~~~~~~~~~~~~~~~~~~~~~~~~~~~~~~~~~~~~~~~~~ Managed-service ~~~~~~~~~~~~~~~~~~~~~~~~~~~~~~~~~~~~~~~~~~~~~~~~~~~~~~~~~
# Service Name Switch Switch Interface Installed Max Post-Service BW Max Pre-Service BW Total Post-Service BW Total Pre-Service BW
-|------------|------|----------------|---------|-------------------|------------------|---------------------|--------------------|
1 ms1 True 2Gbps 2Gbps 792bps 2.19Kbps
Use the show managed-service-device Service node
name command to verify the actions installed on Service Node interfaces. The output displays the service name for each interface and provides statistics for each configured action within the managed service.
dmf-controller-1# show managed-service-device sn1
~~~~~~~~~~~~~ Device ~~~~~~~~~~~~~
Service Node Name : sn1
Service Node IP : 10.243.254.159
~~~~~~~~~~~~~~~~~~~~~~~~~ Interfaces ~~~~~~~~~~~~~~~~~~~~~~~~~
# Service Node Interface Switch Switch Interface Service Name
-|------------|---------|------|----------------|------------|
1 sn1 sni1 ms1
2 sn1 sni2 ms1
~~~~~~~~~~~~~~~~~~~~~~~~~~~~~~~~~~~~~~~~~~~~~~~~~~~~~~~~~~~~~~~~~~~~~~~~~~~~~~ Stats ~~~~~~~~~~~~~~~~~~~~~~~~~~~~~~~~~~~~~~~~~~~~~~~~~~~~~~~~~~~~~~~~~~~~~~~~~~~~~~
# Service Node Interface Name Function Service Name Rx packets Rx bytes Rx Bit Rate Applied packets Applied bytes Applied Bit Rate Tx packets Tx bytes Tx Bit Rate
-|------------|--------------|--------|------------|----------|--------|-----------|---------------|-------------|----------------|----------|--------|-----------|
1 sn1 sni1 filter ms1 303 18180 319bps 303 18180 319bps 0 0 -
2 sn1 sni2 filter ms1 304 18250 319bps 304 18250 319bps 0 0 -
Applied statistics vary based on the specific action type. For the Filter action, these metrics quantify the traffic matching the configured ACL rules:
Applied packets: Total count of matched packets.
Applied bytes: Total count of matched bytes.
Applied rate: Current data rate of matched traffic.
Troubleshooting
Verify Managed Service Installation: Execute the show
managed-service command to confirm successful installation. Absence from the output indicates configuration processing failures or runtime errors.
Verify Action Sequence: Execute the show
managed-service-device command to confirm the action sequence installation on all service node interfaces. Consult the Service Node and Controller logs for detailed information on specific installation failure.
Verify Packet Flow and Logic: Analyze Rx/Tx statistics using show managed-service-device Service node
name stats and show service-node Service node name interface stats to validate traffic processing. For example, comparable Tx and Rx counts on an interface configured with a drop filter action indicate that the ACL rules are not matching packets.
Resources
Switch-less Service Node TOI for deploying managed services on a Service Node not connected to a switch in DMF fabric.
VN-TAG Decapsulation
VN-TAG Decapsulation (decap) provides native support for removing the VN-TAG header within the DMF platform. Execution occurs directly on the DMF Service Node to process traffic frames. The Controller schema and standard CLI workflow facilitate comprehensive control-plane support. All DMF Service Nodes support this feature.
Configuration
Configure the feature using the decap-vntag action within a managed service, which enables the Service Node to identify the VN-TAG (by inspecting up to seven VLAN tags) and remove the header before forwarding the resulting frame.
Show Commands
The show running-config managed-service command outputs the configuration of the decap-vntag action for a given managed-service.
dmf-controller-1# show running-config managed-service
! managed-service
managed-service vntag-s1
!
1 action decap-vntag
drop
The show running-config policy policy-name command displays the policy configuration, including the decap-vntag managed service.
dmf-controller-1# show running-config policy drop-decap-vntag
! policy
policy drop-decap-vntag
action forward
delivery-interface delivery1
filter-interface filter1
start on-date-time 2025-09-19T08:49:06.138000+00:00
use-managed-service vntag-s1 sequence 1 optional
1 match any
Controller Schema Additions
The decap action feature adds a new entry for the decap-vntag action to the managed-service-action type.
typedef managed-service-action {
description "Defines the actions supported by a managed service";
type enumeration {
...
...
enum decap-vntag {
description "Remove VNTag header";
}
...
...
}
}
The option decap-vntag is a supported managed-service action.
Configure a managed-service with the decap-vntag action in the config mode. Use the optional drop parameter to discard any incoming packets that do not contain a VN-TAG.
Important: Beginning with DMF version 8.9, the action keyword is required to add or modify actions within a managed service.
dmf-controller-1# en
dmf-controller-1# config
dmf-controller-1(config)# managed-service vntag-s1
dmf-controller-1(config-managed-srv)# 1 action decap-vntag
dmf-controller-1(config-managed-srv-decap-vntag)# drop
dmf-controller-1(config-managed-srv-decap-vntag)# show this
! managed-service
managed-service vntag-s1
!
1 action decap-vntag
drop
Create a policy with a filter-interface, delivery-interface, and action. Add a decap-vntagmanaged-service in the policy using following commands:
dmf-controller-1# en
dmf-controller-1# config
dmf-controller-1(config)# policy drop-decap-vntag
dmf-controller-1(config-policy)# use-managed-service vntag-s1 sequence 1
dmf-controller-1(config-policy)# show this
! policy
policy drop-decap-vntag
action forward
delivery-interface delivery1
filter-interface filter1
start on-date-time 2025-09-19T08:49:06.138000+00:00
use-managed-service vntag-s1 sequence 1
1 match any
Implementation
Service Node decap action Implementation
The Service Node actively decapsulates VN-TAG frames by examining up to seven VLAN tags to locate the VN-TAG header precisely. After locating the VN-TAG, the Service Node removes the single header and forwards the clean frame. The action's statistics track the entire process:
rx-frame/rx-byte: Counts frames received by the action.
applied-frame/applied-count: Identifies frames that contain a VN-TAG.
tx-frame/tx-bytes: Tracks the final count of frames forwarded after decapsulation.
Note: Disable symmetric hashing for LAG configurations. The system treats VN-tagged packets as Layer 2 traffic and uses Layer 2 headers to distribute them among LAG member interfaces.
Configuring the Arista Analytics Node
Arista Analytics Node capabilities are enhanced to handle NetFlow V5/V9 and IPFIX Packets. All these flow data are represented with the Netflow index.
Note: NetFlow flow record generation is enhanced for selecting VXLAN traffic. For VXLAN traffic, flow processing is based on inner headers, with the VNI as part of the key for flow lookup because IP addresses can overlap between VNIs.
Figure 189. NetFlow Managed Service
NetFlow records are exported using User Datagram Protocol (UDP) to one or more specified NetFlow collectors. Use the DMF Service Node to configure the NetFlow collector IP address and the destination UDP port. The default UDP port is 2055.
Note: No other service action, except the UDP replication service, can be applied after a NetFlow service action because part of the NetFlow action is to drop the packets.
Use the show managed-services command to display the ARP resolution status.
Note: The DANZ Monitoring Fabric (DMF) Controller resolves ARP messages for each NetFlow collector IP address on the delivery interface that matches the defined subnet. The subnets defined on the delivery interfaces cannot overlap and must be unique for each delivery interface.
Enter the 1 netflow command and identify the configuration name and the submode changes to the config-managed-srv-netflow mode for viewing and configuring a specific NetFlow configuration.
Important: Beginning with DMF version 8.9, the action keyword is required to add or modify actions within a managed service.
The DMF Service Node replicates NetFlow packets received without changing the source IP address. Packets that do not match the specified destination IP address and packets that are not IPv4 or UDP are passed through. To configure a NetFlow-managed service, perform the following steps:
Configure the IP address on the delivery interface.
This IP address is the next-hop IP address from the DANZ Monitoring Fabric towards the NetFlow collector.
Note: The rate limit must be configured when enabling Netflow. When upgrading from a version of DMF before release 6.3.1, the Netflow configuration is not applied until a rate limit is applied to the delivery interface.
Configure the NetFlow managed service using the 1 netflow command followed by an identifier for the specific NetFlow configuration.
The IP address, in IPV4 dotted-decimal notation, is required. The MTU and UDP port are required when changing these parameters from the defaults. Enable the records-per-interface option to allow identification of the filter interfaces from which the Netflow originated. Configure the Arista Analytics Node to display this information, as described in the DMF User Guide.
The following example illustrates changing the Netflow UDPF port to 9991.
collector 10.181.19.31 udp-port 9991
Note: The IP address must be in the same subnet as the configured next hop and unique. It cannot be the same as the Controller, service node, or any monitoring fabric switch IP address.
Configure the DMF policy with the forward action and add the managed service to the policy.
Note: A DMF policy does not require any configuration related to a delivery interface for NetFlow policies because the DMF Controller automatically assigns the delivery interface.
The example below shows the configuration required to implement two NetFlow service instances (MS-NETFLOW-1 and MS-NETFLOW-1).
The service-node capability is augmented to support more than one service action per service-node interface. Though this feature is economical regarding per-interface cost, it could cause packet drops in high-volume traffic environments. Arista Networks recommends using this feature judiciously.
Important: Beginning with DMF version 8.9, the action keyword is required to add or modify actions within a managed service.
Example
controller-1# show running-config managed-service Test
! managed-service
managed-service Test
service-interface switch CORE-SWITCH-1 ethernet13/1
1 action dedup full-packet window 2
2 action mask BIGSWITCH
3 action slice l4-payload-start 0
!
4 action netflow an-collector
collector 10.106.6.15 udp-port 2055 mtu 1500
This feature replaces the service-action command with sequential numbers. The allowed range of sequence numbers is 1 -20000. In the above example, the sequence numbering impacts the order in which the managed services influence the traffic.
Note: After upgrading to DANZ Monitoring Fabric (DMF) release 8.1.0 and later, the service-action CLI is automatically replaced with sequence number(s).
Specific managed service statistics can be viewed via the following CLI command:
Note: The following limitations apply to this mode of configuration:
The NetFlow/IPFIX-action configuration should not be followed by the timestamp service action.
Ensure the UDP-replication action configuration is the last service in the sequence.
The header-stripping service with post-service-match rule configured should not be followed by the NetFlow, IPFIX, udp-replication, timestamp and TCP-analysis services.
When configuring a header strip and slice action, the header strip action must precede the slice action.
Using SNMP to Monitor DPDK Service Node Interfaces
Directly fetch the counters and status of the service node interfaces handling traffic (DPDK interfaces). The following are the supported OIDs.
After the first boot (initial configuration) is completed, in the case of Layer-3 topology mode an administrator can move a Service Node (SN) from an old DANZ Monitoring Fabric (DMF) Controller to a new one via the CLI.
Note:For appliances to connect to the Controller in Layer-3 Zero Touch Network (L3ZTN) mode, you must configure the Controller's deployment mode as pre-configure.
To migrate a Service Node's management to a new Controller, follow the steps outlined below:
Remove the Service Node from the old Controller using the following command:
controller-1(config)# no service-node service-node-1
Connect the data NICs' sni interfaces to the new core fabric switch ports.
SSH to the Service Node and configure the new Controller's IP address using the zerotouch l3ztn controller-ip command:
Get the management MAC address (of interface bond0) of the Service Node using the following command:
service-node-1(config)# show local-node interfaces
~~~~~~~~~~~~~~~~~~~~~~~~~~~~~~~~~~~~~~~~~~~~~~~~~ Interfaces ~~~~~~~~~~~~~~~~~~~~~~~~~~~~~~~~~~~~~~~~~~~~~~~~~
Interface Master Hardware address Permanent hardware address Operstate Carrier Bond mode Bond role
---------|------|------------------------|--------------------------|---------|-------|-------------|---------|
bond0 78:ac:44:94:2b:b6 (Dell) up up active-backup
Add the Service Node and its bond0 interface's MAC address (obtained in the step above) to the new Controller:
controller-2(config)# service-node service-node-1
controller-2(config-service-node)# mac 78:ac:44:94:2b:b6
After associating the Service Node with the new Controller, reboot the Service Node.
Once the Service Node is back online, the Controller should receive a ZTN request. If the Service Node's image differs from the Service Node image file on the new Controller, the mismatch triggers the Service Node to perform an auto-upgrade of the image and to reboot twice.
controller-2# show zerotouch request
41 78:ac:44:94:2b:b6 (Dell) 10.240.156.10 get-manifest 2024-06-12 23:14:42.284000 UTC ok The request has succeeded
56 24:6e:96:78:58:b4 (Dell) 10.240.156.91 get-manifest 2024-06-12 23:13:38.633000 UTC ok The request has succeeded
Then the Service Node should appear as a member of the new DMF fabric, which you can verify by using the following command:
controller-2# show service-node service-node-1 details
Redundancy of Managed Services in Same DMF Policy
In this method, users can use a second managed service as a backup service in the same DANZ Monitoring Fabric (DMF) policy. The backup service is activated only when the primary service becomes unavailable. The backup service can be on the same service node or core switch or a different service node and core switch.
Note: Transitioning from active to backup managed service requires reprogramming switches and associated managed appliances. This reprogramming, done seamlessly, will result in a slight traffic loss.
Using the CLI to Configure a Backup Managed Service
Important: Beginning with DMF version 8.9, the action keyword is required to add or modify actions within a managed service.
To implement backup-managed services, perform the following steps:
Configure the policy referring to the backup managed service.
policy SLICE-PACKETS
action forward
delivery-interface TOOL-PORT-1
filter-interface TAP-PORT-1
use-managed-service MS-SLICE-1 sequence 1 backup-managed-service MS-SLICE-2
1 match ip
Packet Slicing on the 7280 Switch
This feature removes unwanted or unneeded bytes from a packet at a configurable byte position (offset). This approach is beneficial when the data of interest is situated within the headers or early in the packet payload. This action reduces the volume of the monitoring stream, particularly in cases where payload data is not necessary.
Another use case for packet slicing (slice action) can be removing payload data to ensure compliance with the captured traffic.
Within the DANZ Monitoring Fabric (DMF) fabric, two types of slice-managed services (packet slicing service) now exist. These types are distinguished based on whether installing the service on a service node or on an interface of a supported switch. The scope of this document is limited to the slice-managed service configured on a switch. The managed service interface is the switch interface used to configure this service.
All DMF 8.4 and above compatible 7280 switches support this feature. Use the show switch all property command to check which switch in DMF fabric supports this feature. The feature is supported if the Min
Truncate Offset and Max Truncate Offset properties have a non-zero value.
# show switch all property
# Switch Min Truncate Offset ... Max Truncate Offset
-|------|-------------------| ... |---------------------------------
1 7280 100 ... 9236
2 core1 ...
Note: The CLI output example above is truncated for illustrative purposes. The actual output will differ.
Using the CLI to Configure Packet Slicing - 7280 Switch
Configure a slice-managed service on a switch using the following steps.
Important: Beginning with DMF version 8.9, the action keyword is required to add or modify actions within a managed service.
Create a managed service using the managed-service service
name command.
Add slice action with packet-start anchor and an offset value between the supported range as reported by the show switch all property command.
Configure the service interface under the config-managed-srv submode using the service-interface switch switch-nameinterface-name command as shown in the following example.
This feature requires the service interface to be in MAC loopback mode.
To set the service interface in MAC loopback mode, navigate to the config-switch-if submode and configure using the loopback-mode mac command, as shown in the following example.
(config)# switch 7280-J2-J2C
(config-switch)# interface Ethernet10/1
(config-switch-if)# loopback-mode mac
Once a managed service for slice action exists, any policy can use it.
Enter the config-policy submode, and chain the managed service using the use-managed-service service same sequence sequence command.
Key points to consider while configuring the slice action on a supported switch:
Only the packet-start anchor is supported.
Ensure the offset is within the Min/Max truncate size bounds reported by the show
switch all property command. If the configured value is beyond the bound, then DMF chooses the closest value of the range.
For example, if a user configures the offset as 64, and the min truncate offset reported by switch properties is 100, then the offset used is 100. If the configured offset is 10,000 and the max truncate offset reported by the switch properties is 9236, then the offset used is 9236.
A configured offset for slice-managed service includes FCS when programmed on a switch interface, which means an offset of 100 will result in a packet size of 96 bytes (accounting for 4-byte FCS).
Configuring an offset below 17 is not allowed.
The same service interface cannot chain multiple managed services.
The insert-original-packet-length option is not applicable for switch-based slice-managed service.
CLI Show Commands
Use the show policy policy name command to see the runtime state of a policy using the slice-managed service. The command shows the service interface information and stats.
Controller# show policy packet-slicing-policy
Policy Name : packet-slicing-policy
Config Status : active - forward
Runtime Status : installed
Detailed Status : installed - installed to forward
Priority : 100
Overlap Priority : 0
# of switches with filter interfaces : 1
# of switches with delivery interfaces : 1
# of switches with service interfaces : 1
# of filter interfaces : 1
# of delivery interfaces : 1
# of core interfaces : 0
# of services : 1
# of pre service interfaces : 1
# of post service interfaces : 1
Push VLAN : 1
Post Match Filter Traffic : -
Total Delivery Rate : -
Total Pre Service Rate : -
Total Post Service Rate: -
Overlapping Policies : none
Component Policies : none
Runtime Service Names : packet-slicing-7280
Installed Time : 2023-08-09 19:00:40 UTC
Installed Duration : 1 hour, 17 minutes
~ Match Rules ~
# Rule
-|-----------|
1 1 match any
~~~~~~~~~~~~~~~~~~~~~~~~~~~~~~~~~~~~~~~~ Filter Interface(s) ~~~~~~~~~~~~~~~~~~~~~~~~~~~~~~~~~~~~~~~~
# DMF IF Switch IF Name State Dir Packets Bytes Pkt Rate Bit Rate Counter Reset Time
-|------|------|-----------|-----|---|-------|-----|--------|--------|------------------------------|
1 f1 7280 Ethernet2/1 up rx 0 0 0 - 2023-08-09 19:00:40.305000 UTC
~~~~~~~~~~~~~~~~~~~~~~~~~~~~~~~~~~~~~~~ Delivery Interface(s) ~~~~~~~~~~~~~~~~~~~~~~~~~~~~~~~~~~~~~~~
# DMF IF Switch IF Name State Dir Packets Bytes Pkt Rate Bit Rate Counter Reset Time
-|------|------|-----------|-----|---|-------|-----|--------|--------|------------------------------|
1 d1 7280 Ethernet3/1 up tx 0 0 0 - 2023-08-09 19:00:40.306000 UTC
~~~~~~~~~~~~~~~~~~~~~~~~~~~~~~~~~~~~~~~~~~~~~~~~~ Service Interface(s) ~~~~~~~~~~~~~~~~~~~~~~~~~~~~~~~~~~~~~~~~~~~~~~~~~
# Service name Role Switch IF Name State Dir Packets Bytes Pkt Rate Bit Rate Counter Reset Time
-|-------------------|----|------|------------|-----|---|-------|-----|--------|--------|------------------------------|
1 packet-slicing-7280 pre 7280 Ethernet10/1 up tx 0 0 0 - 2023-08-09 19:00:40.305000 UTC
2 packet-slicing-7280 post 7280 Ethernet10/1 up rx 0 0 0 - 2023-08-09 19:00:40.306000 UTC
~ Core Interface(s) ~
None.
~ Failed Path(s) ~
None.
Use the show managed-services command to view the status of all the managed services, including the packet-slicing managed service on a switch.
Controller# show managed-services
~~~~~~~~~~~~~~~~~~~~~~~~~~~~~~~~~~~~~~~~~~~~~~~~~~~~~~~~~~~~ Managed-services ~~~~~~~~~~~~~~~~~~~~~~~~~~~~~~~~~~~~~~~~~~~~~~~~~~~~~~~~~~~~
# Service Name Switch Switch Interface Installed Max Post-Service BW Max Pre-Service BW Total Post-Service BW Total Pre-Service BW
-|-------------------|------|----------------|---------|-------------------|------------------|---------------------|--------------------|
1 packet-slicing-7280 7280 Ethernet10/1 True 400Gbps 400Gbps 80bps 80bps
~~~~~~~~~~~~~~~~~~~~~~~~~~~~~~~~~~~~~~ Actions of Service Names ~~~~~~~~~~~~~~~~~~~~~~~~~~~~~~~~~~~~~~
# Service Name Sequence Service Action Slice Anchor Insert original packet length Slice Offset
-|-------------------|--------|--------------|------------|-----------------------------|------------|
1 packet-slicing-7280 1 slice packet-start False 101
Using the GUI to Configure Packet Slicing - 7820 Switch
Perform the following steps to configure or edit a managed service.
Managed Service Configuration
To configure or edit a managed service, navigate to the DMF Managed Services page from the Monitoring menu and select Managed Services.
Figure 191. DMF Managed Services Add Managed Service
Configure a managed service interface on a switch that supports packet slicing. Make sure to deselect the Show Managed Device Switches Only checkbox.
Figure 192. Create Managed Service
Configure a new managed service action using Add Managed service action. The action chain supports only one action when configuring packet slicing on a switch.
Figure 193. Add Managed service action
Use Action > Slice with Anchor > Packet Start to configure the packet slicing managed service on a switch.
Figure 194. Configure Managed Service Action
Select Append to continue. The slice action appears on the Managed Services page.
Figure 195. Slice Action Added
Interface Loopback Configuration
The managed service interface used for slice action must be in MAC loopback mode.
Configure the loopback mode in the Fabric > Interfaces page by selecting the configuration icon of the interface.
Figure 196. Interfaces
Note: The image above has been edited for documentation purposes. The actual output will differ.
Enable the toggle for MAC Loopback Mode (set the toggle to Yes).
Figure 197. Edit Interface
After all configuration changes are done Save the changes.
Policy Configuration
Create a new policy from the DMF Policies page.
Figure 198. DMF Policies Page
Add the previously configured packet slicing managed service.
Figure 199. Create Policy
Select Add Service under the + Add Service(s) option shown above.
Figure 200. Add Service
Figure 201. Service Type - Service - Slice Action
Select Add 1 Service and the slice-managed service (packet-slicing-policy) appears in the Create Policy page.
Figure 202. Manage Service Added
Select Create Policy and the new policy appears in DMF Policies.
Figure 203. DMF Policy Configured
Note: The images above have been edited for documentation purposes. The actual outputs may differ.
Troubleshooting Packet Slicing
The show switch all property command provides upper and lower bounds of packet slicing action’s offset. If bounds are present, the feature is supported; otherwise, the switch does not support the packet slicing feature.
The show fabric errors managed-service-error command provides information when DANZ Monitoring Fabric (DMF) fails to install a configured packet slicing managed service on a switch.
The following are some of the failure cases:
The managed service interface is down.
More than one action is configured on a managed service interface of the switch.
The managed service interface on a switch is neither a physical interface nor a LAG port.
A non-slice managed service is configured on a managed service interface of a switch.
The switch does not support packet slicing managed service, and its interface is configured with slice action.
Slice action configured on a switch interface is not using a packet-start anchor.
The managed service interface is not in MAC loopback mode.
Use the following commands to troubleshoot packet-slicing issues.
Controller# show fabric errors managed-service-error
~~~~~~~~~~~~~~~~~~~~~~~~~~~~~~~~~~~~~~~~~~~~~~~~~~~~~~~~~~~~~~~~~~ Managed Service related error ~~~~~~~~~~~~~~~~~~~~~~~~~~~~~~~~~~~~~~~~~~~~~~~~~~~~~~~~~~~~~~~~~~
# Error Service Name
-|---------------------------------------------------------------------------------------------------------------------------------------------|-------------------|
1 Pre-service interface 7280-Ethernet10/1-to-managed-service on switch 7280 is inactive; Service interface Ethernet10/1 on switch 7280 is down packet-slicing-7280
2 Post-service interface 7280-Ethernet10/1-to-managed-service on switch 7280 is inactive; Service interface Ethernet10/1 on switch 7280 is down packet-slicing-7280
The show switch switch name interface interface
name dmf-stats command provides Rx and Tx rate information for the managed service interface.
Controller# show switch 7280 interface Ethernet10/1 dmf-stats
# Switch DPID Name State Rx Rate Pkt Rate Peak Rate Peak Pkt Rate TX Rate Pkt Rate Peak Rate Peak Pkt Rate Pkt Drop Rate
-|-----------|------------|-----|-------|--------|---------|-------------|-------|--------|---------|-------------|-------------|
1 7280 Ethernet10/1 down - 0 128bps 0 - 0 128bps 0 0
The show switch switch name interface interface
name stats command provides Rx and Tx counter information for the managed service interface.
Controller# show switch 7280 interface Ethernet10/1 stats
# Name Rx Pkts Rx Bytes Rx Drop Tx Pkts Tx Bytes Tx Drop
-|------------|-------|--------|-------|-------|--------|-------|
1 Ethernet10/1 22 843477 0 5140 845937 0
Packet Slicing Considerations
Managed service action chaining is not supported when using a switch interface as a managed service interface.
When configured for a supported switch, the managed service interface for slice action can only be a physical interface or a LAG.
When using packet slicing managed service, packets ingressing on the managed service interface are not counted in the ingress interface counters, affecting the output of the show switch switch name interface interface name stats and show switch switch name interface interface name dmf-stats commands. This issue does not impact byte counters; all byte counters will show the original packet size, not the truncated size.
A Dynamic Overlap policy causes all DMF-8.7.0 compatible 7820 switches to append an additional Vlan Tag Post Slice Service action. The default behavior of a fabric deployed in Push-per-Policy mode handles Single Vlan Strip at the delivery interface, removing the additional VLAN tag and leaving the original policy VLAN tag intact. In a non-default fabric deployment (Push-per-filter), to deliver the original packet to the tool node after a slice action, enable strip-two-vlan on the delivery interface.
VXLAN Stripping on the 7280R3 Switch
Virtual Extensible LAN Header Stripping
Virtual Extensible LAN (VXLAN) Header Stripping supports the delivery of decapsulated packets to tools and devices in a DANZ Monitoring Fabric (DMF) fabric. This feature removes the VXLAN header, previously established in a tunnel for reaching the TAP Aggregation switch or inherent to the tapped traffic within the DMF. Within the fabric, DMF supports the installation of the strip VXLAN service on a filter interface or a filter-and-delivery interface of a supported switch.
Platform Compatibility
For DMF deployments, the target platform is DCS-7280R3.
Use the show switch
all property command to verify which switch in the DMF fabric supports this feature.
The feature is supported if the Strip Header
Supported property has the value BSN_STRIP_HEADER_CAPS_VXLAN.
Note: The following example is displayed differently for documentation purposes than what appears when using the CLI.
# show switch all property
# : 1
Switch : lyd599
Max Phys Port : 1000000
Min Lag Port : 1000001
Max Lag Port : 1000256
Min Tunnel Port : 15000001
Max Tunnel Port : 15001024
Max Lag Comps : 64
Tunnel Supported : BSN_TUNNEL_L2GRE
UDF Supported : BSN_UDF_6X2_BYTES
Enhanced Hash Supported : BSN_ENHANCED_HASH_L2GRE,BSN_ENHANCED_HASH_L3,BSN_ENHANCED_HASH_L2,
BSN_ENHANCED_HASH_MPLS,BSN_ENHANCED_HASH_SYMMETRIC
Strip Header Supported : BSN_STRIP_HEADER_CAPS_VXLAN
Min Rate Limit : 1Mbps
Max Multicast Replication Groups : 0
Max Multicast Replication Entries : 0
PTP Timestamp Supported Capabilities : ptp-timestamp-cap-replace-smac, ptp-timestamp-cap-header-64bit,
ptp-timestamp-cap-header-48bit, ptp-timestamp-cap-flow-based,
ptp-timestamp-cap-add-header-after-l2
Min Truncate Offset : 100
Max Truncate Offset : 9236
Using the CLI to Configure VXLAN Header Stripping
Configuration
Use the following steps to configure strip-vxlan on a switch:
Set the optional field strip-vxlan-udp-port at switch configuration, and the default udp-port for strip-vxlan is 4789.
Enable or disable strip-vxlan on a filter or both-filter-and-delivery interface using the role both-filter-and-delivery interface-name filter-interface strip-vxlan command.
> enable
# config
(config)# switch switch-name
(config-switch)# strip-vxlan-udp-port udp-port-number
(config-switch)# interface interface-name
(config-switch-if)# role both-filter-and-delivery interface-name filter-interface strip-vxlan
(config-switch-if)# role both-filter-and-delivery interface-name filter-interface no-strip-vxlan
(config)# show running-config
After enabling a filter interface with strip-vxlan, any policy can use it. From the config-policy submode, add the filter-interface to the policy:
Use the show policy policy name command to see the runtime state of a policy using a filter interface with strip-vxlan configured. It will also show the service interface information and stats.
# show policy strip-vxlan
Policy Name : strip-vxlan
Config Status : active - forward
Runtime Status : installed
Detailed Status : installed - installed to forward
Priority : 100
Overlap Priority : 0
# of switches with filter interfaces : 1
# of switches with delivery interfaces : 1
# of switches with service interfaces : 0
# of filter interfaces : 1
# of delivery interfaces : 1
# of core interfaces : 0
# of services : 0
# of pre service interfaces : 0
# of post service interfaces : 0
Push VLAN : 1
Post Match Filter Traffic : -
Total Delivery Rate : -
Total Pre Service Rate : -
Total Post Service Rate : -
Overlapping Policies : none
Component Policies : none
Installed Time : 2024-05-02 19:54:27 UTC
Installed Duration : 1 minute, 18 secs
Timestamping enabled : False
~ Match Rules ~
# Rule
-|-----------|
1 1 match any
~~~~~~~~~~~~~~~~~~~~~~~~~~~~~~~~~~~~~~~~ Filter Interface(s) ~~~~~~~~~~~~~~~~~~~~~~~~~~~~~~~~~~~~~~~~
# DMF IF Switch IF Name State Dir Packets Bytes Pkt Rate Bit Rate Counter Reset Time
-|------|------|-----------|-----|---|-------|-----|--------|--------|------------------------------|
1 f1 lyd598 Ethernet1/1 up rx 0 0 0 - 2024-05-02 19:54:27.141000 UTC
~~~~~~~~~~~~~~~~~~~~~~~~~~~~~~~~~~~~~~~ Delivery Interface(s) ~~~~~~~~~~~~~~~~~~~~~~~~~~~~~~~~~~~~~~~
# DMF IF Switch IF Name State Dir Packets Bytes Pkt Rate Bit Rate Counter Reset Time
-|------|------|-----------|-----|---|-------|-----|--------|--------|------------------------------|
1 d1 lyd598 Ethernet2/1 up tx 0 0 0 - 2024-05-02 19:54:27.141000 UTC
~ Service Interface(s) ~
None.
~ Core Interface(s) ~
None.
~ Failed Path(s) ~
None.
Using the GUI to Configure VXLAN Header Stripping
Filter Interface Configuration
To configure or edit a filter interface, proceed to Interfaces from the Monitoring menu and select Interfaces > Filter Interfaces.
Figure 204. Filter Interfaces
Figure 205. DMF Interfaces
Configure a filter interface on a switch that supports strip-vxlan.
Figure 206. Configure Filter Interface
Enable or Disable Strip VXLAN.
Figure 207. Enable Strip VXLAN
Figure 208. DMF Interfaces Updated
Policy Configuration
Create a new policy using DMF Policies and add the filter interface with strip VXLAN enabled.
Figure 209. Create Policy
Figure 210. Strip VXLAN Header
Select Add port(s) under the Traffic Sources option and add the Filter Interface.
Figure 211. Selected Traffic Sources
Add another delivery interface and create the policy.
Figure 212. Policy Created
Syslog Messages
There are no syslog messages associated with this feature.
Troubleshooting
The show switch all property command provides the Strip Header Supported property of the switch. If the value BSN_STRIP_HEADER_CAPS_VXLAN is present, the feature is supported; otherwise, the switch does not support this feature.
The show fabric warnings feature-unsupported-on-device command provides information when DMF fails to enable strip-vxlan on an unsupported switch.
The show switch switch-name table strip-vxlan-header command provides the gentable details.
The following are examples of several failure cases:
The filter interface is down.
The interface with strip-vxlan is neither a filter interface nor a filter-and-delivery interface.
The switch does not support strip-vxlan.
Tunneling / UDF is enabled simultaneously with strip-vxlan.
Unsupported pipeline mode with strip-vxlan enabled (strip-vxlan requires a specific pipeline mode strip-vxlan-match-push-vlan).
Limitations
When configured for a supported switch, the filter interface for decap-vxlan action can only be a physical interface or a LAG.
It is not possible to enable strip-vxlan simultaneously with tunneling / UDF.
When enabling strip-vxlan on one or more switch interfaces on the same switch, other filter interfaces on the same switch cannot be matched on the VXLAN header.
This chapter describes viewing information about the DANZ Monitoring Fabric (DMF) and connected production networks.
Monitor DMF Interfaces
Select the Menu control to view statistics for the specific interface and select Monitor Stats. The system displays the following dialog box.
Figure 1. Monitor Interface Stats
This window displays statistics for up to four selected interfaces and provides a line graph (sparkline) that indicates changes in packet rate or bandwidth utilization. The auto-refresh rate for these statistics is ten seconds—mouse over the sparkline to view the range of values represented. To clear statistics for an interface, select the Menu control and select Clear Stats.
To view statistics for multiple interfaces, enable the checkbox to the left of the Menu control for each interface, select the Menu control in table, and select Monitor Selected Stats.
Figure 2. Monitoring > Interfaces
To view the interfaces assigned a specific role, use the Monitoring > Interfaces command and select the Filter, Delivery, or Service sub-option from the menu.
Viewing Oversubscription Statistics
To view peak bit rate statistics used to monitor bandwidth utilization due to oversubscription, select the Menu in the Interfaces table, select Show/Hide Columns, and enable the Peak Bit Rate checkbox on the dialog box that appears.
After enabling the Peak Bit Rate column, a column appears in the Interfaces table that indicates the relative bandwidth utilization of each interface. When using less than 50% of the bandwidth, the bar appears in green; 50-75% changes the bar to yellow, and over 75% switches the bar color to red.
To display statistics for a specific interface, select Monitor Stats from the Menu control to the left of the row.
To reset the statistics counters, select Clear Stats from the Menu control.
Note: DANZ Monitoring Fabric (DMF) Controllers generate SNMP traps for link saturation and packet loss. For more information, please refer to the DMF Deployment Guide - SNMP Trap Generation for Packet Drops and Link Saturation chapter.
View Fabric-Connected Devices
To view a display of the devices connected to the Controller, select Fabric > Connected Devices from the main menu. The system displays the following screen.
Figure 3. Connected Devices
The Switch Interfaces table displays the unique devices connected to each out-of-band filter or delivery switch.It lists each interface's MAC address (Chassis ID) on every device connected to the fabric as a separate device.
The Unique Device Names table lists all unique device names with a count of interfaces in parentheses. Selecting a link in a row in this list filters the contents of the Switch Interfaces table.
To view a display of the devices discovered by the Controller through the Link Aggregation Control Protocol (LACP), select Fabric > Connected LACP from the main menu.
The system displays the following screen.
Figure 4. Connected LACP
This page displays the devices discovered by the Controller through LACP.
Capacity Planning - Current versus Verified Scale
Before DMF release 8.9, the DMF fabric lacked direct visibility into current scale metrics relative to verified scale limits. This feature exposes real-time scale data against verified benchmarks via REST APIs, GUI, and CLI commands. The verified scale represents the capacity tested under reference conditions. The feature is compatible with all platforms and no new configuration is necessary; the feature uses existing settings to provide immediate visibility into the scale.
Navigate to Monitoring and select Fabric Scale.
Figure 5. Fabric Scale
The Fabric Scale dashboard contains two main sections, Fabric Scale Metrics and Category Scale Metrics.
Figure 6. Fabric Scale Dashboard
Fabric Scale Metrics
The first section provides a high-level overview of Fabric Scale Metrics.
Figure 7. Fabric Scale Metrics
All fabric-level scale metrics are displayed visually and compared against verified limits, with meter-range indicators highlighting utilization levels. Each meter represents the relationship between the current usage and the verified supported limit.
Hovering over a meter displays an information card showing the calculated values for:
Figure 8. Meter Rollover Data
Current
Available
Verified
In addition to the meters, Verified Scale summary cards display for Per-Switch Scale Metrics, Per-Policy Scale Metrics, and Per-Address Group Scale Metrics, providing a quick reference to the supported scale limits for these categories.
Category-Level Scale Metrics
The second section, Category Scale Metrics, provides a detailed, categorized view of scale metrics at a more granular level.
Figure 9. Category Scale Metrics
This section is organized by:
Switches
Policies
Address Groups
Based on the selection, DMF displays a corresponding table allowing review of validated scale usage details for the selected category.
Color Coding
The meter color reflects the current scale utilization:
Blue: ≤ 70%
Orange: ≤ 95%
Red: > 95%
Display Mode
Select the Utili. (%) or the Count drop-down to view the metrics as percentages or counts. The dashboard updates with the chosen view.
To display the currently configured interfaces, enter the show interface-names command, as shown in the following example.
Ctrl-2> show interface-names
~~~~~~~~~~~~~~~~~~~~~~~~~~~~~~~~~~~~~~~~~~~ Filter Interface(s) ~~~~~~~~~~~~~~~~~~~~~~~~~~~~~~~~~~~~~~~~~~~
# DMF IF Switch IF Name Dir State Speed VLAN Tag Analytics Ip address Connected Device
-|-----------|-------------------|---------|---|-----|------|--------|---------|----------|----------------|
1 Lab-traffic Arista-7050SX3-T3X5 ethernet7 rx up 10Gbps 0 True
~ Delivery Interface(s) ~
None.
~ Service Interface(s) ~
None.
~~~~~~~~~~~~~~~~~~~~~~~~~~~~~~~~ Recorder Fabric Interface(s) ~~~~~~~~~~~~~~~~~~~~~~~~~~~~~~~~
# DMF IF Switch IF Name Dir State Speed Connected Device
-|---------------|-------------------|----------|-------------|-----|------|------------------|
1 PR-NewHW-Intf Arista-7050SX3-T3X5 ethernet25 bidirectional up 25Gbps PR-NewHW ens1f0
2 RMA-CNrail-intf Arista-7050SX3-T3X5 ethernet35 bidirectional up 25Gbps RMA-CNrail ens1f0
Note: The name is used when configuring a policy.
To display a summary of the current DANZ Monitoring Fabric (DMF) configuration, enter the show fabric command, as in the following example.
controller-1# show fabric
~~~~~~~~~~~~~~~~~~~~~ Aggregate Network State ~~~~~~~~~~~~~~~~~~~~~
Number of switches : 3
Inport masking : False
Start time : 2018-03-16 15:42:43.322000 PDT
Number of unmanaged services : 0
Filter efficiency : 0:1
Number of switches with service interfaces : 0
Total delivery traffic (bps) : 168bps
Number of managed service instances : 2
Number of service interfaces : 0
Match mode : l3-l4-offset-match
Number of delivery interfaces : 6
Max pre-service BW (bps) : 20Gbps
Auto VLAN mode : push-per-policy
Number of switches with delivery interfaces : 2
Number of managed devices : 1
Uptime : 5 hours, 4 minutes
Total ingress traffic (bps) : 160bps
Max filter BW (bps) : 221Gbps
Auto Delivery Interface Strip VLAN : True
Number of core interfaces : 12
Overlap : True
Number of switches with filter interfaces : 2
State : Enabled
Max delivery BW (bps) : 231Gbps
Total pre-service traffic (bps) : 200bps
Track hosts : True
Number of filter interfaces : 5
Number of active policies : 2
Number of policies : 5
~~~~~~~~~~~~~ Aggregate Interface Statistics ~~~~~~~~~~~~~
# Interface Type Dir Packets Bytes Pkt Rate Bit Rate
-|------------------|---|-------|------|--------|--------|
1 Filter Interface rx 2444 455611 0 160bps
2 Delivery Interface tx 4050 421227 0 168bps
---------------------example truncated--------------------
controller-1#
View Switch Configuration
To verify the switch interface configuration, enter the show topology command, as shown in the following example.
controller> show topology
~~~~~~~~~~~~~~~~~~~~~ Filter Interface(s) ~~~~~~~~~~~~~~~~~~~~~
# DMF IF Switch IF Name state speed Connected Device
-|---------|-----------|--------|-----|-------|----------------|
1 f1 filter-sw-1 s11-eth1 up 10 Gbps
2 f2 filter-sw-1 s11-eth2 up 10 Gbps
~~~~~~~~~~~~~~~~~~~~ Delivery Interface(s) ~~~~~~~~~~~~~~~~~~~~
# DMF IF Switch IF Name state speed Connected Device
-|---------|-----------|--------|-----|-------|----------------|
1 d1 filter-sw-2 s12-eth1 up 10 Gbps
2 d2 filter-sw-2 s12-eth2 up 10 Gbps
~~~~~~~~~~~~~~~~~~~~~~~~~ Service Interface(s) ~~~~~~~~~~~~~~~~~~~~~~~~~
# DMF IF Switch IF Name Dir state speed Connected Device
-|----------------|---------|-------|---|-----|-------|----------------|
1 post-serv-intf-1 core-sw-1 s9-eth2 up 10 Gbps
2 pre-serv-intf-1 core-sw-1 s9-eth1 up 10 Gbps
~~~~~~~~~~~~~~~~~~~~~~~~ Core Interface(s) ~~~~~~~~~~~~~~~~~~~~~~~~
# Src Switch Src IF Src Speed Dst Switch Dst IF Dst Speed
-|-------------|--------|---------|-------------|--------|---------|
1 core-sw-3 s13-eth2 10 Gbps delivery-sw-2 s15-eth3 10 Gbps
2 core-sw-3 s13-eth1 10 Gbps delivery-sw-1 s14-eth3 10 Gbps
3 filter-sw-1 s11-eth3 10 Gbps core-sw-2 s10-eth1 10 Gbps
4 core-sw-2 s10-eth1 10 Gbps filter-sw-1 s11-eth3 10 Gbps
5 delivery-sw-2 s15-eth3 10 Gbps core-sw-3 s13-eth2 10 Gbps
6 core-sw-2 s10-eth2 10 Gbps filter-sw-2 s12-eth3 10 Gbps
7 filter-sw-2 s12-eth3 10 Gbps core-sw-2 s10-eth2 10 Gbps
8 delivery-sw-1 s14-eth3 10 Gbps core-sw-3 s13-eth1 10 Gbps
~~~~~~~~~~~~~~~~~~~~~~~~~~~~~~~~~~~~ Statistics ~~~~~~~~~~~~~~~~~~~~~~~~~~~~~~~~~~~~
# DMF IF Switch IF Role State Packets Bytes Pkt Rate Bit Rate
--|---------|-------------|--------|--------|-----|-------|------|--------|--------|
1 f1 filter-sw-1 s11-eth1 filter up 0 0 0 -
2 f2 filter-sw-1 s11-eth2 filter up 0 0 0 -
3 d1 filter-sw-2 s12-eth1 delivery up 8 600 0 -
4 d2 filter-sw-2 s12-eth2 delivery up 8 600 0 32 bps
6 - core-sw-3 s13-eth1 core up 3432 257400 0 32 bps
7 - delivery-sw-2 s15-eth3 core up 3431 257325 0 32 bps
8 - delivery-sw-1 s14-eth3 core up 3430 257250 0 32 bps
9 - core-sw-2 s10-eth1 core up 3429 257175 0 32 bps
10 - filter-sw-1 s11-eth3 core up 3431 257325 0 32 bps
11 - core-sw-3 s13-eth2 core up 3432 257400 0 32 bps
12 - filter-sw-2 s12-eth3 core up 3429 257175 0 32 bps
View Connected Devices and LAGs
Some information on devices in the production network, discovered using LLDP and CDP, can be seen using the show connected-devices command. The data helps determine if filter interfaces are connected to the intended production device.
The show connected-devicescommand from login mode displays the devices connected to the DANZ Monitoring Fabric (DMF). This command displays information about devices connected to DMF switch interfaces. DMF extracts the information from link-level protocol packets such as LLDP, CDP, and UDLD and ignores expired link-level data.
Users can see the most recent events related to particular connected devices via the CLI command show connected-devices history device_alias.
Connecting a DMF switch interface to a SPAN port may result in inaccurate information because some vendor devices mirror link-level packets to the SPAN port.
To display details about the link aggregation groups connected to the DMF switch interfaces use the show connected-lacp command. DMF extracts the information from LACP protocol packets and expired LACP information is ignored as illustrated in the following.
Viewing Information about a Connected Production Network
Once the monitoring fabric is set up and connected to packet feeds from the production network, DANZ Monitoring Fabric (DMF) starts to gather information about the production network. By default, DMF provides a view of all hosts in the production network visible from the filter interfaces. View this information on the GUI page under Monitoring > Host Tracker. As shown below, the output displays the host MAC address, IP address, when and on which filter interface traffic from the host was seen, and DHCP lease information. To display this information, enter the show tracked-hosts command, as shown in the following example.
# show tracked-hosts
# IP Address MAC Address Host name Filter interfaces VLANs Last seen Extra info
---|---------------|--------------------------------------------------------|-----------------------------------|------------------------|-------|---------|
1 10.0.0.3 40:a6:d9:7c:9f:9f Apple wireless-poe-1 0 1 hours
2 10.0.0.6 98:fe:94:1c:37:06 Apple wireless-poe-1 0 42 min
3 10.0.0.6 dc:2b:61:81:64:45 Apple wireless-poe-1 0 3 hours
4 10.0.0.7 20:c9:d0:48:f3:3d Apple wireless-poe-1 0 2 hours
5 10.0.0.11 60:03:08:9b:4f:48 Apple wireless-poe-1 0 13 min
6 10.0.1.3 14:10:9f:e4:e6:bf Apple wireless-poe-1 0 51 min
--------------------------------------------------------------------output truncated----------------------------------------------------------------------
DMF also tracks the DNS names of hosts by capturing and analyzing packets using several different protocols. To manage host-name tracking, from config-analytics mode, use the track command, which has the following syntax:
[no] track { arp | dns | dhcp | icmp }
For example, the following command enables tracking using DNS:
controller-1(config)# analytics
controller-1(config-analytics)# track dns
Note:DNS traffic will not be included in DMF policies when enabling DNS for tracking.
Exclude host tracking for a specific filter interface using the no-analytics option with the role command.
This command disables all host tracking on interface TAP-PORT-01.
Capacity Planning - Current versus Verified Scale
Before DMF release 8.9, the DMF fabric lacked direct visibility into current scale metrics relative to verified scale limits. This feature exposes real-time scale data against verified benchmarks via REST APIs, the GUI, and CLI commands. The verified scale represents the capacity tested under reference conditions. The feature is compatible with all platforms and no new configuration is necessary; the feature uses existing settings to provide immediate visibility into the scale.
Show Commands
The scale feature introduces new CLI commands under the existing show
fabric command structure. These commands provide visibility into current fabric resource usage compared to verified scale across different categories.
show fabric scale - Display fabric-wide current scale and verified scale.
show fabric scale category - Display verified scale for specified category.
show fabric scale categoryidentifier-Display current scale and verified scale for specified identifier.
show fabric scale category
all-Display current scale and verified scale for all instances of the specified category.
show fabric scale category all
metric-name - Display current scale values for the specified metric across all instances of the specified category, along with the metric's verified scale.
Important:
The category can be a switch, policy, or address-group.
An identifier is the specific name within the category (switch name, policy name, or address-group name).
dmf-controller-1> show fabric scale <tab>
address-group switch | <cr>
policy ;
dmf-controller-1> show fabric scale switch
~~~~~ Per-Switch Scale Metrics ~~~~~
# Metric Verified Scale
-|-------------------|--------------|
1 filter-interfaces 128
2 delivery-interfaces 128
3 managed-services 40
Notes:
Verified scale represents capacity that has been tested under
reference conditions.
dmf-controller-1> show fabric scale switch <tab>
all core1 delivery1 filter1 ; | > <cr>
dmf-controller-1> show fabric scale switch core1
~~~~~~~~~~~~~~~~~~~~ Switch Scale Metrics ~~~~~~~~~~~~~~~~~~~~
# Switch Name Metric Current Scale Verified Scale
-|-----------|-------------------|-------------|--------------|
1 core1 filter-interfaces 0 128
2 core1 delivery-interfaces 0 128
3 core1 managed-services 2 40
Notes:
Verified scale represents capacity that has been tested under reference conditions
dmf-controller-1> show fabric scale switch all
~~~~~~~~~~~~~~~~~~~~ Switch Scale Metrics ~~~~~~~~~~~~~~~~~~~~
# Switch Name Metric Current Scale Verified Scale
-|-----------|-------------------|-------------|--------------|
1 core1 filter-interfaces 0 128
2 core1 delivery-interfaces 0 128
3 core1 managed-services 2 40
4 delivery1 filter-interfaces 0 128
5 delivery1 delivery-interfaces 3 128
6 delivery1 managed-services 0 40
7 filter1 filter-interfaces 1 128
8 filter1 delivery-interfaces 2 128
9 filter1 managed-services 0 40
Notes:
Verified scale represents capacity that has been tested under reference conditions.
dmf-controller-1> show fabric scale policy all
~~~~~~~~~~~~~~~~~~~ Policy Scale Metrics ~~~~~~~~~~~~~~~~~~~
# Policy Name Metric Current Scale Verified Scale
-|-----------|-----------------|-------------|--------------|
1 slc filter-interfaces 5 1000
2 slc services-chained 4 4
Notes:
Verified scale represents capacity that has been tested under reference conditions.
dmf-controller-1> show fabric scale address-group all
~~~~~~~~~~~~~~~~~~ Address Group Scale Metrics ~~~~~~~~~~~~~~~~~~
# Address Group Name Metric Current Scale Verified Scale
-|------------------|--------------|-------------|--------------|
1 temp ipv4-addresses 1 20000
2 v6 ipv6-addresses 2 100
Notes:
Verified scale represents capacity that has been tested under reference conditions.
dmf-controller-1> show fabric scale switch all <tab>
delivery-interfaces managed-services | <cr>
filter-interfaces ; >
dmf-controller-1> show fabric scale switch all delivery-interfaces
Metric : delivery-interfaces
Verified Scale : 128
~~~ Switch Scale Metrics ~~~
# Switch Name Current Scale
-|-----------|-------------|
1 core1 0
2 delivery1 3
3 filter1 2
Notes:
Verified scale represents capacity that has been tested under reference conditions.
Syslog Messages - Scale
WARN
SCALE4000: Verified scale file not found at {file path}.
ERROR
SCALE7000: Unable to read verified scale file {file path} due to security violation.
SCALE7001: Failed to load verified scale from {file path}.
This chapter describes the policies to work and configure in the DANZ Monitoring Fabric (DMF).
Overview
A policy selects the traffic to be copied from a production network to one or more tools for analysis. To define a policy, identify the traffic source(s) (filter interfaces), the match rules to select the type of traffic, and the destination tool(s) (delivery interfaces). The DANZ Monitoring Fabric (DMF) Controller automatically forwards the selected traffic based on the fabric topology. Define match rules to select interesting traffic for forwarding to the tools connected to the specified delivery interfaces. Users can also send traffic to be processed by a managed service, such as time stamping, slicing, or deduplication, on a DMF service node. Forward the output from the service node to the appropriate tool for analysis.
While policies can be simple, they can also be more complicated when optimizing hardware resources, such as switching TCAM space. Also, DMF provides different switching modes to optimize policies based on use cases and switch capabilities. Arista Networks recommends planning the switching mode before configuring policies in a production deployment.
While retaining all information from the previous version, the new policy page features a new layout and design and offers additional functionality for easier viewing, monitoring, and troubleshooting of policies.
Figure 1. DMF Policies
Header Action Items
Refresh Button
Figure 2. Refresh Button
The page refreshes every 60 seconds automatically. Select Refresh to manually refresh the page.
Create Policy Button
Figure 3. Create Policy Button
Select + Create Policy to open the policy creation page.
Clear Stats Button
Figure 4. Clear Stats Button
Select Clear Stats to clear all DMF interface's runtime stats.
Quick Filters
Show Quick Filters Button
Figure 5. Show Quick Filters
By default, the feature is toggled on and displays four quick filter options. When toggled off, the four quick filters are no longer displayed.
Figure 6. Four Filter Options
Four quick filter cards display the policy counts that meet the filter criteria and the filter name. The quick filter cards support multi-select.
Radio Buttons
Figure 7. Table View / Interface View
Switch page views between Table View and Interface View. Refer to the Table View and Interface View sections below for more information.
Table View
The table view is the default landing view of the Policies Page.
The page displays an empty table with the Create Policy control when no configured policies exist.
Figure 8. DMF Policies
Conversely, when configured policies exist, the table view displays the list of policies.
Figure 9. List of Policies
Action Buttons
Several buttons in the policy table provide quick access to corresponding functionality. These are:
Figure 10. Action Buttons
Delete
Disabled by default (when no policies are selected).
Enabled when one or more policies are selected.
Used to delete selected policies.
Edit
Disabled by default (when no policies are selected).
Enabled only when a policy is selected.
Navigate to the editing workflow (the new policy edit workflow).
Duplicate
Disabled by default (when no policy is elected).
Enabled only when one policy is selected.
Navigate to the create policy workflow (the new policy create workflow) with an empty name input field while retaining the same settings from the selected policy.
Table View Filters
Figure 11. Filter Views
Select Filter to open the filter menu.
Policy Filter(s)
There are four quick policy filters. The first three filters overlap with the quick filters; thus, enabling or disabling them will trigger changes to the quick filter control.
DMF Interface Name(s)
Filters out policies by DMF interfaces that are selected from the drop-down list.
Searchable
Allows multiple selections applying OR logic.
Policies Table
Figure 12. Policy Table
The Policy table displays all policies; each column shows the number of interfaces and services corresponding to that policy.
Figure 13. Search
Table Search
The Policy table supports search functionality. Select the magnifying glass icon in the last column to activate the search input fields and search the results by the context of each column.
Table Search: The Policy table supports search functionality. Select the magnifying glass icon in the last column to activate the search input fields. Search results by the context of each column.
Figure 14. Table Search
Figure 15. Expand Icon
Expand Policy + Icon
Hidden for an unconfigured policy. Select the expand + icon to view the policy's interfaces and services information.
Figure 16. Expanded View Example
Figure 17. Expand Group
Interfaces Group Expand + Icon
For policies configured with an interface group, an expand + icon with group displays by default. Select the group expand + icon to view the detailed information on the interfaces belonging to that group.
Figure 18. Filter Interface Details
Policy Name Tooltip
Hovering over policy names displays the tooltips for the policy, including Configuration / Runtime / Details state.
Figure 19. Tooltip
Policy Error Icon
Figure 20. Policy Error Icon
Policies with errors will display this icon after the policy name.
Figure 21. Error with Policy Name
Selecting the error icon will display an error window with detailed information.
Figure 22. Detailed Error Information
Checkbox
Figure 23. Checkbox
Disabled for unconfigured policies. Use the checkbox to select a policy and the applicable function buttons (described above) as required.
Table Interaction
All columns support sorting.
Selecting a policy name opens the policy table split view. The table on the left displays the policy names. The table on the right provides two tabs showing Configuration and Operational Details.
Use the icon to view the information in full-screen mode or the X icon to close the split view and return to the table view.
Figure 24. DMF Policies
Configuration Details
Access the Configuration Details tab by selecting a policy in either Table View or Interface View. This tab displays all of the configured settings for the selected policy.
The top row of the Configuration Details tab displays the selected policy name and an Edit and Delete control. Edit opens the Edit Policy configuration page with policy information prefilled, and Delete opens a confirmation dialog window before deleting a policy. The default Table View opens after deleting a policy.
Figure 25. Configuration Details
The second component of the Configuration Details is the Quick Facts box. This component displays the Description, Action, Push VLAN, Priority, Active, Scheduling Start Time, Policy Run Duration, PTP Timestamping, and Root Switch values.
Description: An info icon shows the entire description in a tooltip.
Action: Forward, Drop, Capture, or None.
Active: Policy active status, Yes or No.
Scheduling Start Time: Either Automatically or the DateTime it is scheduled to start, in terms of the current Time Zone configured on the DMF. When setting DateTime to Now during policy creation, the time of creation will be the Scheduling start time.
Automatic: The policy will always run. There's no expiration.
Now: The policy starts from now, and duration and packet expiration may apply. The policy runs from now with no expiration.
Figure 26. Start Time
Run Policy: The duration the policy should run. The default value is Always. Set a time limit (i.e., 4 hours) or a packet limit (i.e., 1,000 packets) The tooltip explains that the policy will stop running when reaching either of the limits.
The third component is the Rules Table, which displays all Match Traffic rules configured for the policy. The default value is Allow All Traffic. Optionally, configure Deny All Traffic.
Figure 27. Allow All Traffic
Figure 28. Deny All Traffic
When configuring custom rules, the Rules Table is displayed. The table is horizontally scrollable, and each column is searchable and sortable. The Edit Policy feature provides rule management, including Edit, Add, and Delete functionality.
Figure 29. Rules Table
The next component is the Interface Info Columns.
Figure 30. Information Columns
There are three primary columns: Traffic Sources, Services, and Destination Tools.
The Traffic Sources column includes Filter Interfaces, vCenters, and CloudVision Portal associated with the policy.
The Services column includes Managed Services and Services associated with the policy.
The Destination Tools column includes Delivery interfaces and RN Fabric Interfaces associated with the policy.
These columns display the DMF Interface name in the interface card, and the name includes a link to the Interfaces page. The switch name and physical interface name appear in this format: SWITCH-NAME / INTERFACE-NAME under the DMF interface name. The bit rate and packet rate operational state data appear for each interface. Each column is only displayed if the policy has one or more interfaces of that type.
Figure 31. Traffic Sources
The services column renders for all policies that have at least one service. The service name appears for each card, which contains a link to either the Services or Managed Services page. Under the service name, the service type (Managed Service or Service) appears if the service has a backup name that also appears.
Figure 32. Managed Service
There is a special case for policies that have CloudVision port mirroring sessions. To differentiate the CloudVision source interfaces from the auto-generated DMF filter interfaces, DMF creates two columns: CloudVision and Filter Interfaces.
The cards in the CloudVision column show the connected CloudVision portal and the number of port mirroring sessions for each device in the CloudVision portal. Filter Interfaces and vCenters are now in the Filter Interfaces column. There are no differences between the Services and Destination Tools columns.
The last component only displays for policies with CloudVision port mirroring sessions.
Figure 33. Port Mirroring Sessions
The Port Mirroring Session Entries table shows all configured Port Mirroring Sessions for a CloudVision portal. The Device, Source Interface, Monitor Type, Tunnel Source, Tunnel Endpoint, SPAN Interface, and Direction columns display the same values configured in the Port Mirroring Table in the Add Traffic Sources component in the Create Policy flow. Each column is sortable.
For more information on the configuration flow for CloudVision port mirroring, please refer to the documentation in the Create Policy section.
Operational Details
Selecting the Operational Details Tab navigates to the Operational Details view.
Figure 34. Operational Details
Figure 35. Action Buttons
Edit: Selecting Edit opens the Editing Policy window for making changes to the policy.
Delete: Selecting Delete deletes the policy.
Edit Layout: Selecting Edit Layout opens the editing layout window. Move the widgets by dragging the components in order of user preference. Select Save to save the changes. DMF preserves the order of the widgets when the same user logs back in.
Figure 36. Edit Layout
Widgets
Status / Information
Status and information include basic operational information about the policy.
Figure 37. Operational Information
Installed Duration
Hover over the info icon to see the installed time in the UTC time zone.
Figure 38. Install Time
Top Filter and Delivery Interfaces by Traffic
Figure 39. Top Filter and Delivery Interfaces by Traffic
Figure 40. Select Metric
Select the Metric Drop-down menu and choose the metrics to display in the chart. Only the selected metrics appear in the Badge, Labels, and Bar Chart.
Badge: Colored dots and text indicate the content represented by different bars in the bar chart.
Interface Name
Figure 41. Labels
Hover over the interface name to see the full name in the tooltips.
Labels: Display the number and unit corresponding to the bar.
Bar Chart: Displays the numerical value of traffic.
Empty State
Display title, last updated time, and disabled metric drop-down.
Edit Policy opens the edit policy window.
Top Core Interfaces by Traffic
Figure 42. Top Core Interfaces by Traffic
The Core Interfaces by Traffic chart is similar to Filter Interfaces / Delivery Interfacesby Traffic charts, which have Metric Drop-down, Badge, Interface Name, Labels, and Bar Charts with similar functionality.
Errors & Dropped Packets
Figure 43. Errors
The Errors chart is similar to Filter Interfaces / Delivery Interfaces by Traffic charts, which have Metric Drop-down, Badge, Interface Name, Labels, and Bar Charts with similar functionality. Hovering over the bar displays all error counts and rate information.
Figure 44. Packets Dropped
The Dropped Packets chart is similar to Filter Interfaces / Delivery Interfaces by Traffic charts, which have Badge, Interface Name, Labels, and Bar Charts with similar functionality. Hovering over the bar displays all packet dropped counts and rate information.
Optimized Matches
Displays optimized match rules.
Figure 45. Optimized Matches
Interface View
As a new feature of the DMF Policies page, the Interface view offers an alternative way to view policies, allowing for an intuitive visualization of all policies-related interfaces.
Figure 46. Interface View
Policies Column
Figure 47. Policies Column
A Policies header displaying count. The column shows the total count when no filters are applied, or the filtered policies count in the format of x Associated.
The drop-down menu enables data sorting using multiple attributes.
Delete deletes the selected policies.
Edit opens the selected policy in edit mode.
The Filter drop-down is similar to the table view filters but without an interface filtering option.
Figure 48. Filter
A list of policies with quick facts and user interactions.
The checkbox enables policy selection for deletion and editing.
Badges with different colors indicate policy run time status.
Policy name with tooltip on hover displaying configuration, runtime, and detailed status.
Current Traffic display in bps.
Selecting View Information highlights the policy:
Only shows the interfaces associated with the selected policy in the DMF Interfaces tab.
Enable Configuration Details and Operational Details.
Selecting an active policy card deselects the previously selected policy:
Deemphasizes the policy and resets card styles and tabs accessibility.
Reveals all the interfaces in DMF Interfaces.
Interface card highlights in the DMF Interfaces tab can co-exist, leading to a more granular search.
DMF Interfaces
Figure 49. DMF Interfaces
Active tab by default
Header Row
Stat selector: Choose between Utilization, Bit Rate, and Packet Rate to display in the subsequent interface info cards.
Sorter selector: Choose between Utilization and interface name to sort the interfaces in ascending or descending order.
Filter drop-down:
Utilization range filter
Switch name selector
DMF interface name selector
Interface Column
Header: Specifies interface category and count, showing X Associated when filters apply and X Total otherwise.
Interface Information Card
Interface name
Stat
Utilization
Bit Rate
Packet Rate
Text: Display detailed information about the selected stat of the current interface.
Interaction
Selecting one policy card:
The selected policy card highlights and filters interfaces to only those configured to the policy and hides interfaces not configured in the selected policy.
Figure 50. Policy Card
Selecting one interface card:
The selected interface card highlights and filters policies to only those configured to the interface and hides interfaces not configured in the filtered policies mentioned above.
Figure 51. Single Interface Card
Selecting multiple interface cards (any columns):
The selected interface cards highlight and filter policies to only those configured on the selected interfaces and hide interfaces not configured in the filtered policies mentioned above.
Figure 52. Multiple Interface Cards
Highlighted policy and interface cards can co-exist, leading to a more granular search.
Figure 53. Policy and Interface Cards
Configuration Details
The GUI is similar to Table View > Configuration Details. Please refer to the Configuration Details section.
Operational Details
The GUI is similar to Table View > Operational Details. Please refer to theOperational Details section.
Policy Elements
Each policy includes the following configuration elements:
Filter interfaces: these identify the ingress ports for analyzing the traffic for this policy. Choose individual filter interfaces or one or more filter interface groups. Select the Select All Filter Interfaces option, intended for small-scale deployments.
Delivery interfaces: these identify the egress ports for analyzing the traffic as part of this policy. Choose individual delivery interfaces or one or more delivery interface groups. Like filter interfaces, a Select All Delivery Interfaces option is available for small deployments.
Action: identifies the policy action applied to the inbound traffic. The following actions are available:
Forward: forwards matching traffic at filter ports to the delivery ports defined in a given policy. Select at least one or more filter and delivery interfaces.
Drop: drops matched traffic at the Filter ports. A policy with a drop action is often used in combination with another lower-priority policy to forward all traffic except the dropped traffic to tools. Use Drop to measure the bandwidth of matching traffic without forwarding it to a tool. Select at least one or more filter interfaces.
Capture: sends the selected traffic to a physical interface on the controller to be saved in a PCAP file. This option works only on a hardware Controller appliance. Select at least one or more filter interfaces. A policy with a capture action can only run for a short period. For continuous packet capture, use the DANZ Monitoring Fabric (DMF) recorder node. Refer to the chapter DMF Recorder Node for details.
Note:The policy will not be installed if an action is not selected.
Match rules: used to select traffic. The selected traffic is treated based on the action, with the most common action being Forward, i.e., forward-matched traffic to delivery interfaces. If a match rule is not specified or the match rule is Deny All Traffic, the policy is not installed. One policy can specify multiple match rules, differentiating each rule by its rule number.
Note: The rule numbers do not define the order in which the rules will be installed or processed. The numbering allows a user to list them in order.
Managed services (optional): identifies additional operations to perform, such as packet slicing, time stamping, packet deduplication, packet obfuscation, etc., before sending the traffic to the selected delivery interfaces.
Status (optional): enables or disables the policy using the active or inactive sub-command from the config-policy sub-model. By default, a policy is active when initially configured.
Priority (optional): unless a user specifies, all policies have a priority of 100. When sharing filter/ingress ports across policies, a policy with a higher priority will get access to matching traffic first. Traffic not matched by the policies with the higher priority then gets processed according to policies with lower priority. Overlapping policies are also not created when two policies have different priorities defined.
Push VLAN (optional): when a user configures the Auto VLAN Mode push as push-per-policy (i.e., to Push Unique VLAN on Policies, every policy configured on DMF gets a unique VLAN ID. Typically, this VLAN ID is in the range of 1-4094 and auto-increments by 1. However, to specific policy with a specific VLAN ID, first define a smaller VLAN range using the command auto-vlan-range and then pick a VLAN outside that range to attach to a specific policy. This attachment of a specific VLAN to a specific policy can be done in the CLI using the CLI command push-vlan or in the GUI by selecting Push VLAN from the Advanced Options drop-down and then specifying the VLAN ID.
Root switch (optional): when a core switch (or core link) goes down, existing policies using that switch are rerouted using other core switches. When that switch comes back, the policy does not move back. In some cases, this causes traffic overload. One way to overcome this problem is to specify a root switch in each policy. The policy is rerouted through other switches when the root switch goes down. When the root switch comes back, DMF reroutes the policy through the root switch again.
Policies can include multiple filter and delivery interfaces, and services are optional. Traffic that matches the rules in any policy affiliated with a filter interface forwards to all the delivery interfaces defined in the policy.
Except for a capture action policy, a policy runs indefinitely once activated. Optionally schedule the policy by specifying a starting time and period for which the policy should run and specify the number of received packets in the tool, after which the policy automatically deactivates.
Note:
Create and configure all interfaces and service definitions before creating a policy that uses them.
Use only existing interfaces and service definitions when creating a policy. When creating a policy with interfaces or service definitions that do not exist, the policy may enter an inconsistent state.
If this happens, delete the policy, create the interfaces and service definitions, and then recreate the policy.
Configure a Policy
There are two possible entry points for creating a policy. The first is via Create Policy, continuously displayed on the top-right corner of the DMF Policies page, or the second is via Create Policy, which appears on the central panel of the same page when no configured policies exist.
Figure 54. DMF Policies
Selecting Create Policy opens the new Policy Creation configuration page, which supports moving, minimizing, expanding, collapsing, and closing the window using the respective icons in the menu bar.
Figure 55. Create Policy
Figure 56. UI Controls
Move: Select (and hold) any part of the title section of the window or the icon to drag and reposition as required. Moving the window in full-size mode is not possible.
Expand: Use the icon to enlarge the window.
Minimize: Use the icon to minimize the window and the icon to return to the standard view.
Proceed to the following sections for create and manage policies.
Create a New Policy
Create a New Policy
To create a new Policy, complete the required fields in the Policy Details section and configure settings under the Port Selection tab (optional) and the Match Traffic tab (optional). Please refer to the Policy Details, Port Selection Tab, and Match Traffic Tab sections for more detailed information on configuring settings.
Once configured, select Create Policy to save the changes and finish the policy creation.
Figure 57. Create Policy
Policy Details
Figure 58. Policy Details
Enter the primary information for the policy:
Policy Name (must be unique)
Description
Policy Action: Capture, Drop, Forward (default)
Note: The Destination Tools column is not available when Drop and Capture actions are selected.
Push VLAN
Priority: By default, set to 100 if no value is specified.
Active: By default, set to enabled.
Advanced Options: By default, disabled.
When Advanced Options is enabled, the following configuration settings are available:
Figure 59. Advanced Options
Scheduling: There are four options:
Automatic: The policy runs indefinitely.
Now: The policy starts running immediately; use Run Time to determine when the policy should stop.
Set Time: Set a specific date and time to start the policy.
Figure 60. Scheduling
Set Delay: Start the policy using relative time options.
Figure 61. Set Delay
Run Time: There are two options:
Always: (default).
For Duration: Selecting For Duration allows using Time Input to set the time number and the Unit selector to set the time unit. Select the checkbox to use Packet Input and enter the required packet number (1000, by default).
Figure 62. Run Time
PTP Timestamping: Disabled by default.
Root Switch: By default, set to a locked state. Select the lock icon to unlock and select a root switch.
Additional Controls
Figure 63. Collapse
Figure 64. Show
Collapse and Show: Visually hide or unhide the basic policy configurations to manage the view of the other configuration fields.
Traffic Sources
The Traffic Sources column displays the associated traffic sources in the policy.
Figure 65. Traffic Sources
To add Sources, select Add Port(s). The page allows adding Filter Interfaces and Filter Interface Groups, vCenters, NSX, or CloudVision Portals.
Note: The left column has three multiple groups. Select the corresponding type of traffic source to view the available selections. After making all desired selections, confirm them using Add N Sources.
Figure 66. Add Sources
Search for interfaces using the search bar and the available information in the interface tiles. Selecting the icon reveals sorting and filtering options using Display Data, which includes:
Sort - By default, DMF sorts the data in descending Bit Rate order. Optionally, sort the data by ascending Bit Rate order or alphabetically.
Bit Rate (default), Utilization percentage, orPacket Rate
Switch Name
Interface Name(s)
Figure 67. Traffic Sources Display Data
DMF sorts Interface Groups, vCenters, NSX, and CloudVision Portals alphabetically (A-Z, by default).
Figure 68. Sort Traffic Sources
When a Filter Interface has not been created yet, Create has two selections: CreateFilter Interfaces and Filter Interface Groups.
Figure 69. Filter Interfaces / Filter Interface Groups
Selecting Create Filter Interface opens a form to configure a Filter Interface. Enter the required settings to configure the new Filter Interface.
Figure 70. Configure Filter Interface
Alternatively, the left column allows the selection of an existing connected device to pre-populate the Switch Name and Interface Name fields and to configure a Filter Interface based on a connected device. Select Create and Select to create the Filter Interface and associate it with the current policy.
Figure 71. Associate Filter Interface
To create multiple Filter Interface(s), select Create another to create an interface using the current configuration. This action clears the form to allow the creation of an additional Filter Interface.
Figure 72. Add Multiple Filter Interfaces
Note:Select (n) interface associates all created Filter Interfaces to the current policy.
Select Create Filter Interface Group to create a group of filter interfaces.
Figure 73. Create Filter Interface Group
Select one or more filter interfaces to create a Filter Interface Group.
Figure 74. Add Filter Interfaces
Select Create Group to create the Filter Interface Group and associate the group with the current policy.
Figure 75. Create Group
Expand the group tile to view interfaces within an Interface Group.
Figure 76. Expand Details
Note: Selecting the x icon on the top right of each tile disassociates the Filter Interface from the current policy. Selecting Undo restores the association.
Figure 77. Disassociate Filter Interface
CloudVision Portals
The Create Policy window lists CloudVision Portals connected to DMF and includes the CloudVision Portal name, the portal hostname, and the current software version. Select a card to add a CloudVision Port Mirroring Table. The card displays similar information and the default Tunnel Endpoint.
Figure 78. CloudVision Portals
An empty port mirroring table initializes to add rows to the table for configuring port mirroring sessions.
Use the following guidelines to configure a port mirroring session:
Each row must contain a Device and Source Interface. This interface in the CloudVision production network will mirror traffic to DMF.
Each interface must select a Monitor Type: GRE Tunnel or SPAN.
Note: SPAN requires a physical connection from the CloudVision Portal to DMF. The default value for Tunnel Endpoint is the CloudVision Portal’s Default Tunnel Endpoint.
Each device must have the same Tunnel Endpoint and Tunnel Source values across the policies. Each interface on a device must have an identical destination configuration (GRE Tunnel, GRE Tunnel Source, and SPAN Interface) across the policies.
The default traffic direction is Bidirectional but configurable to Ingress or Egress.
After configuring the Port Mirroring Table, select Add Sources to return to the Main Page of the Create Policy configuration page.
Figure 79. Edit Policy
After configuring Port Mirroring, the card appears in the Traffic Sources section. To edit the Port Mirroring Table, select the X Entries link.
Services
The Services column displays the Services and Managed Services associated with the policy. Add Service(s) opens a new page to specify additional services.
Figure 80. Services Add Services
View All Services and View All Managed Services open the DMF Services and Managed Services pages, respectively. Add Service opens a configuration panel to specify Service information. If there are Services associated with this policy, they are listed and available to edit.
Figure 81. View All Services / View All Managed Services
For each Service, specify:
Service Type: Managed or Unmanaged.
Service: Name of the Service (required).
Optional: Whether the Service is optional.
Backup Service: Name of the backup Service.
Del. Service: If the Managed Service type is selected, whether to use it as a Delivery Service.
Select Add Another to populate a new row to add another Service. Add (n) Services associates the Services with the policy.
Figure 82. Add Another Service
After adding the services, they appear in the Services column. Select the x icon on the Service tile to disassociate the Service from the policy. While remaining on the page, if required, re-associate the Service by selecting Undo.
Figure 83. Service Added
Destination Tools
The Destination Tools column displays the associated Destination Tool ports to a given policy.
Figure 84. Destination Tools
Use Add Port(s) to add more destinations. The configuration page allows adding Delivery Interfaces, Delivery Interface Groups, or Recorder Node Fabric Interfaces.
Note: The left column has two multiple groups. Select the corresponding type of Destination Tools to see the available selections. After making the desired selections, confirm using Add (n) Interfaces.
Figure 85. Add Interfaces
Interfaces can be searched by the available information in the interface tiles using the search bar. Selecting the icon reveals sorting and filtering options using Display Data, which includes:
Sort - By default, DMF sorts the data in descending Bit Rate order. Optionally, sort the data by ascending Bit Rate order or alphabetically.
Bit Rate (default), Utilization percentage, or Packet Rate
Switch Name
Interface Name(s)
Figure 86. Filter Destination Tools
Sort Interface Groups alphabetically (A-Z, by default).
Figure 87. Sort Interface Groups
Sort Recorder Node Fabric Interfaces alphabetically (A-Z, by default) and filter by Bit Rate.
Figure 88. Sort Recorder Nodes
Suppose there is still a need to create Destinations (Delivery Interfaces). In that case, Create has two selections: CreateDelivery Interfaces and Delivery Interface Groups.
Figure 89. Create Delivery Interfaces / Delivery Interface Groups
Selecting Delivery Interface opens a form to configure a Delivery Interface. Enter the required settings to configure the new Delivery Interface.
Figure 90. Configure Delivery Interface
Alternatively, the left column allows the selection of an existing connected device to pre-populate the Switch Name and Interface Name fields and to configure a Delivery Interface based on a connected device. Select Create and Select to create the Delivery Interface and associate it with the current policy.
Figure 91. Associate Delivery Interface
To create multiple Delivery Interfaces, select Create another to create an interface using the current configuration. This action clears the form to allow the creation of an additional Delivery Interface.
Figure 92. Multiple Delivery Interfaces
Select (n) interface associates all created Delivery Interfaces to the current policy.
Figure 93. Select Number of Interfaces & Associate
Select Create Delivery Interface Group to create a group of delivery interfaces.
Figure 94. Create Delivery Interface Group
Select one or more delivery interfaces to create a Delivery Interface Group.
Figure 95. Multiple Delivery Interfaces
Select Create Group to create the Delivery Interface Group and associate the group with the current policy.
Figure 96. Associate Delivery Interface Group
Expand the group tile to view interfaces within an Interface Group.
Figure 97. Expand Details
Stat Picker
Use the Stat: Packet Rate drop-down to select view specific data for the associated interfaces.
Figure 98. None
The data options are:
Utilization
Figure 99. Utilization
Bit Rate (default)
Figure 100. Bit Rate
Packet Rate
Figure 101. Packet Rate
Match Traffic and Match Traffic Rules
Match Traffic
Use the Match Traffic tab to configure rules for the current policy.
Figure 102. Match Traffic
There are four options to configure traffic rules.
Figure 103. Configuration Options
Select the Allow All Traffic or Deny All Traffic radio button to quickly configure a rule for all traffic.
Navigate to the Rule Details configuration panel using Configure A Rule. Refer to the Custom Rule, Match Rule Shortcut, and Match Rule Group sections for more information.
Import Rules opens the import rule configuration dialog and supports importing .txt files using drag and drop or Browse.
Example Text File
1 match ip
2 match tcp
3 match tcp src-port 80
4 match tcp dst-port 25
Figure 104. Import Rules
Select Preview to verify the import result.
Figure 105. Preview
While using the Preview Imported Rule table, select Edit to open the Edit Rule configuration panel.
Figure 106. Edit Rule
Select Confirm when finished, and use Import x Rules to import the rules.
Custom Rule
Select Configure a Rule to open the Configure A Traffic Rule window.
Figure 107. Configure a Traffic rule
By default, the configuration method is Custom Rule with several fields disabled by default; hover over the question mark icon for more information on enabling an input field.
Figure 108. Help Icon
Specific EtherTypes will open an Additional Configurations panel.
Figure 109. Additional Configurations
Select the drop-down icon to display additional configurations (Source, Destination, Offset Match). Hovering over Offset Match allows viewing requirements to enable the Offset Match.
Figure 110. Offset Match
Custom EtherTypes
By default, the EtherType lists all known EtherType names and their hexadecimal values. DMF 8.8.0 allows custom EtherType input. The accepted input types are numbers in decimal or hexadecimal format with values greater than 1535 and less than or equal to 65535. Begin by typing the value in the EtherType input field.
Figure 111. Create EtherType
Select Create inputted value to create and select the custom EtherType for the Traffic Rule.
Note: All values are converted to hexadecimal automatically.
Figure 112. Custom EtherType
Important:
Only 1 EtherType can be defined for a rule.
Creating an EtherType for a rule does not save it as a Select option for other rules. You must recreate custom rules each time they are to be used.
EtherType must be in decimal or hexadecimal format (denoted with the prefix “0x”).
EtherType must be greater than 1535 and less than or equal to 65535. Otherwise, the system displays the following error message:
Figure 113. Custom EtherType Error Message
Match Rule Shortcut
To access the Match Rule Shortcut, select the drop-down icon and choose Match Rule Shortcut.
Figure 114. Match Rule Shortcut
Select the Select Rule Shortcut selector and choose the required shortcut rules (supports multi-selection).
Figure 115. Shortcut Rule List
After selecting the rule shortcut:
All selected rules appear as a card in the selector.
Delete selected rules using the x icons.
Select Customize Shortcut to edit a rule shortcut.
Figure 116. Edit Shortcut
After editing, select Save Edit to return to the Match Rule Shortcut view.
Figure 117. Save Edits
After configuring the shortcut rules, select Add (n) Rules to finish the configuration.
Match Rule Group
To access the Match Rule Group, select the drop-down and choose Match Rule Group.
Figure 118. Match Rule Group
To select a rule group, select the drop-down under Rule Group. All rule groups appear in the menu. Select one. There is no multi-select available. Repeat the Match Rule Group steps to add more than one rule group.
Figure 119. Rule Group List
After configuring the rule group, select Add Rule to finish the configuration.
Figure 120. Add Rule
Rules Table
All configured rules appear in the Rules Table.
Figure 121. Rules Table
Import Rules
Figure 122. Import Rules
Similar in function to Import Rules on the start page. Refer to Start Page -> Import Rules for more information.
Export Select Rules
Figure 123. Export Select Rules
Disabled by default when no rule is selected.
Enabled when one or more than one rule is selected.
Select to export selected rules information as a .txt file.
Delete
Figure 124. Delete
Disabled by default when no rule is selected.
Enabled when one or more than one rule is selected.
Select to delete the selected rules.
Create New Rule and Create Rule Group buttons
Figure 125. Create New Rule / Create Rule Group
The control appears as Create New Rule when no rule is selected. Select to open the Create New Rule screen.
When one or more rules are selected, the control changes to Create Rule Group. Select to open the Create Rule Group screen.
Figure 126. Create Rule Group
The Rule Group Name is required. Select Create Group to confirm the rule group creation.
Table Actions
Figure 127. Edit / Delete
Select Edit to edit the rule view.
Select Delete to delete the rule.
Table Search
Figure 128. Table Search
The Rules Table supports search functionality. Select the magnifying glass icon to activate the search input fields and search the results by the context of each column.
Checkbox
Figure 129. Checkbox
Check the box to select a rule and use the function buttons described above.
Expandable Group Rules
Group Rules in the Rule Table display as the group's name with an expand icon.
Figure 130. Expand
Select the expand icon to see the rules included in the group.
Figure 131. Expanded Column
Persist UDF Input Format
The DMF 8.7 Controller remembers the original User Defined Field (UDF) input format across clients. After configuring UDF, the input reflects the original input format, supporting cross-client consistency.
DMF supports three types of UDF input format:
32-bit hex string prefixed with 0x
32-bit unsigned integer
Dotted Quad IPv4 address string
Navigate to Monitoring > Policies.
Figure 132. DMF Policies Dashboard
The workflow is contained in the Create or Edit Policy configuration under the Match Traffic tab.
Enable Offset Match using the checkbox (if required). While configuring an Offset Match attribute in a new rule or editing an existing rule, select the Input Format input and enter the Value and Mask inputs in the appropriate format.
Select Add Rule or Confirm Edit to save the rule.
Use Create Policy or Save Policy to save the policy configuration.
Note:The Offset Match is only allowed if Match Mode is set to L3-L4 Offset Match on the DMF Features page.
Figure 133. DMF Feature - Match Mode
During subsequent editing of the rule of the policy, DMF preserves and populates the Input Format, Value, and Mask inputs with the previously saved values.
DMF supports only the three UDF input patterns described earlier.
The optimized UDFMatch contains value/mask in the user-configured format, but the value/mask of the UDFMatch may not match the configured value/mask. The Controller reports the actual internal value/mask in the form that the user configured.
Multi-vCenter VM Support in Single Policy
The Multi-vCenter VM Support in Single Policy feature enhances scalability and configuration management by allowing the inclusion of Virtual Machines (VMs) from multiple vCenters within a single policy. DMF supports configuring match rules to include multiple VMs across disparate vCenters, unifying policy application and reducing configuration overhead. Whereas, in prior releases, integrating a large number of vCenters with a single DMF fabric required a separate policy for each instance.
DMF User Interface Configuration
Navigate to Monitoring > Policies.
Figure 135. Monitoring > Policies
Select Create Policy.
Figure 136. Create Policy
Select Match Traffic followed by Configure A Rule.
Figure 137. Match Traffic > Configure Rule
EtherTypes, such as IPv4 or IPv6, require source or destination IP addresses.
Selecting Virtual Machine as the type populates the VM name drop-down menu with every virtual machine associated with vCenter and Nutanix instances.
Figure 138. Additional Configurations
Both menus support text-based searches by vCenter or VM name.
Figure 139. Text-based Search
If the expected vCenters are not visible refer to the Troubleshooting section for more information.
Using the Packet Capture Action in a Policy
Capture packets into a PCAP file for later processing or analysis. DANZ Monitoring Fabric (DMF) stores the captured packets on the DMF Controller hardware appliance. This feature provides a quick look at a small amount of traffic. For continuous packet capture and storage, use the DMF Recorder Node, described in the chapter DMF Recorder Node.
Note: Storing PCAP files is supported only with the hardware appliance, as running the Controller in a virtual machine is impossible. The DMF hardware appliance normally provides 200 GB of storage capacity, but the hardware appliance is optionally available with 1 TB of storage capacity.
To enable this feature, connect one of the DMF Controller hardware interfaces to a fabric switch interface defined as a DMF delivery interface.
Note: The location of the DMF packet capture port varies by hardware model. The example shown in the figure is for the DCA-DM-CDL hardware appliance. Refer to the DMF Hardware Guide for the location of the DMF package capture ports.
Table 1. Ports
1
1G Management Port
2
DMF Packet Capture
Figure 141. Capturing Packets on the DMF Appliance
To capture packets, define a policy with filter ports and match rules to select the interesting traffic. Specify the capture action in the policy, then schedule the policy for a duration or packet count. In the illustrated example, a service exists in the policy to modify the packets before capture, but this is optional.
By default, when the policy action is capture, the policy is only active after scheduling the policy. Packet captures are always saved on the master (active) Controller. In case of HA failover, previous packet captures remain on the Controller where they were initially saved.
By default, DMF automatically removes PCAP files after seven days. Change the default value using the following CLI command with the command option if preferred:
controller-1(config)# packet-capture retention-days <tab-key>
<retention-days> Configure packet capture file retention period in days. Default is 7 days
controller-1(config)#
This example creates the policy POLICY1 and enters the config-policy submode.
Configure one or more match rules to identify the aggregated traffic from the filter interfaces assigned to the policy, as in the following example.
controller-1(config-policy)# 10 match full ether-type ip dst-ip 10.0.0.50 255.255.255.255
This matching rule (10) selects IP traffic with a destination address 10.0.0.50.
Assign one or more filter interfaces, which are monitoring fabric edge ports connected to production network TAP or SPAN ports and defined using the interface command from the config-switch-if submode.
Note: Define the filter interfaces used before configuring the policy.
To include all monitoring fabric interfaces assigned the filter role, use the all keyword, as in the following example:
controller-1(config-policy)# filter-interface all
Assign one or more delivery interfaces, which monitor fabric edge ports connected to destination tools and defined using the interface command from the config-switch-if submode.
Define the delivery interfaces used in the policy before configuring the policy. To include all monitoring fabric interfaces assigned the delivery role, use the all keyword, as in the following example:
controller-1(config-policy)# delivery-interface all
Define the action to take on matching traffic, as in the following example:
controller-1(config-policy)# action forward
The forward action activates the policy so matching traffic immediately starts being forwarded to the delivery ports identified in the policy. The other actions are capture and drop.
A policy is active when the configuration of the policy is complete, and a valid path exists through the network from a minimum of one of the filter ports to at least one of the delivery ports.
When inserting a service in the policy, the policy can only become active and begin forwarding when at least one delivery port is reachable from all the post-service ports defined within the service.
To verify the operational state of the policy enter the show policy command.
controller-1# show policy GENERATE-IPFIX-NETWORK-TAP-1
Policy Name : GENERATE-IPFIX-NETWORK-TAP-1
Config Status : active - forward
Runtime Status : installed
Detailed Status : installed - installed to forward
Priority : 100
Overlap Priority : 0
# of switches with filter interfaces : 1
# of switches with delivery interfaces : 1
# of switches with service interfaces : 0
# of filter interfaces : 1
# of delivery interfaces : 1
# of core interfaces : 0
# of services : 0
# of pre service interfaces : 0
# of post service interfaces : 0
Push VLAN : 3
Post Match Filter Traffic : -
Total Delivery Rate : -
Total Pre Service Rate : -
Total Post Service Rate : -
Overlapping Policies : none
Component Policies : none
~ Match Rules ~
# Rule
-|-----------|
1 1 match any
~~~~~~~~~~~~~~~~~~~~~~~~~~~~~~~~~~~~~~~~~~~~~~~~~~~ Filter Interface(s) ~~~~~~~~~~~~~~~~~~~~~~~~~~~~~~~~~~~~~~~~~~~~~~~~~~~
# DMF IF Switch IF Name State Dir Packets Bytes Pkt Rate Bit Rate Counter Reset Time
-|-------------|---------------|----------|-----|---|---------|-----------|--------|--------|------------------------------|
1 TAP-TRAFFIC-2 FILTER-SWITCH-1 ethernet16 up rx 182876967 69995305364 0 - 2022-10-31 23:13:10.177000 PDT
~~~~~~~~~~~~~~~~~~~~~~~~~~~~~~~~~~~~~~~~~~~~~~~~~~ Delivery Interface(s) ~~~~~~~~~~~~~~~~~~~~~~~~~~~~~~~~~~~~~~~~~~~~~~~~~~
# DMF IF Switch IF Name State Dir Packets Bytes Pkt Rate Bit Rate Counter Reset Time
-|-------------|---------------|----------|-----|---|---------|-----------|--------|--------|------------------------------|
1 TAP-TRAFFIC-1 FILTER-SWITCH-1 ethernet15 up tx 182876967 69995305364 0 - 2022-10-31 23:13:10.177000 PDT
~ Service Interface(s) ~
None.
~ Core Interface(s) ~
None.
~ Failed Path(s) ~
None.
controller-1#
Note: If two policies have the same filter and delivery interfaces and the same priority with similar match conditions, then incorrect statistics can result for one or both policies. To alleviate this issue, either increase the priority or change the match conditions in one of the policies.
Detailed status in show policy command shows detailed information about a policy status. If for any reason a policy fails, the detailed status shows why the policy failed. One cause of policy failure is the TCAM reaching its total capacity.When this happens, the detailed status shows a message like Table ing_flow2 is full
<switch_DPID>.
ing_flow1- used for programming analytics tracking like DNS, DHCP, ICMP, TCP control packets, and ARP.
ing_flow2 is the TCAM table used for programming data forwarding.
To delete an existing policy, use the no policy command and identify the policy to delete, as in the following example:
controller-1(config-policy)# no policy policy-name-1
Warning: submode exited due to deleted object
When deleting a policy, DMF deletes all traffic rules associated with the policy.
Stop, Start, and Schedule a Policy
Enter the active or inactive command from the config-policy submode to enable or disable a policy.
To stop an action that is currently active, enter the stop command from the config-policy submode for the policy, as in the following example:
By default, if the policy action is forward or drop, the policy is active unless it is manually stopped or disabled.
To start a stopped or inactive policy immediately, enter the start now command from the config-policy submode for the policy, as in the following example:
controller-1(config)# policy policy1
controller-1(config-policy)# start now
For a policy with the forward action, the start now command causes the policy to run indefinitely. However, policies with the capture action run capture for 1 minute unless otherwise specified, after which the policy becomes inactive. This action prevents a capture from running indefinitely and utilizes the appliance storage capacity.
Examples
Use the start command with other options to schedule a stopped or inactive policy.
The following summarizes the usage of each keyword:
now: start the action immediately.
seconds-from-now: start the action after waiting for the specified number of seconds. For example, 300+ start the action in 5 minutes.
on-date-time: starts the action on the specified date and time. Use the format %Y-%m-%dT%H:%M:%S.
duration: Assign a value in seconds.
The start ? command lists the supported options:
controller-1(config-policy)# start ?
now Start the policy immediately
on-date-time Start the policy at a specific date and time
seconds-from-now Start the policy this many seconds from now
controller-1(config-policy)#
The start now ? command lists the supported now options:
controller-1(config-policy)# start now ?
duration Duration the policy should remain active starting from its start-time
<Command-end> <cr>: Return to execute command
; command separator
| pipe to command
> redirect
controller-1(config-policy)#
To set the duration, include the seconds keyword after the specified value. Omitting this keyword results in an Unexpected end of command error.
controller-1(config-policy)# start now duration 60 seconds
Use the start seconds-from-now command to specify when the policy should start and enter the desired start time:
controller-1(config-policy)# start seconds-from-now
<Seconds> Integer number of seconds until policy should start
controller-1(config-policy)# start seconds-from-now 30
duration Duration the policy should remain active starting from its start-time
<Command-end> <cr>: Return to execute command
; command separator
| pipe to command
> redirect
controller-1(config-policy)#
Use the start on-date-time command to specify when the policy should start on a specific date and time and enter the desired values:
controller-1(config-policy)# start on-date-time
<Start-time> The time to start the policy at (e.g. "2025-01-01T01:01:30" or "Friday at 5pm" or "15:30"; see help start on-date-time for more)
controller-1(config-policy)# start on-date-time "Friday at 5pm"
duration Duration the policy should remain active starting from its start-time
<Command-end> <cr>: Return to execute command
; command separator
| pipe to command
> redirect
controller-1(config-policy)#
Clear a Policy
To remove a specific DANZ Monitoring Fabric (DMF) policy, use the no keyword before the policy command, as in the following example:
controller-1(config)# no policy sample_policy
This command removes the policy sample_policy.
To clear all policies at once, enter the following command:
controller-1(config)# clear-all-configured-policy
View Policies
To display the policies currently configured in the DANZ Monitoring Fabric (DMF) fabric, enter the show policy command, as in the following example:
This output provides the following information about each policy.
#: a numeric identifier assigned to the policy.
Policy Name: name of the policy.
Action: Forward, Capture, or Drop.
Runtime Status: a policy is active only when the policy configuration is complete, and a valid path exists through the network from a minimum of one of the filter ports to at least one of the delivery ports (and moves on through the service ports if that is specified). When inserting a service in the policy, the policy can only become active/forwarding when a delivery port is reachable from all the post-service ports of the service.
Type: configured or dynamic. Refer to the Configuring Overlapping Policies section for details about dynamic policies created automatically to support overlapping policies.
Priority: determines which policy is applied first.
Overlap Priority: the priority assigned to the dynamic policy applied when policies overlap.
Push VLAN: a feature that rewrites the outer VLAN tag for a matching packet.
Filter BW: bandwidth used.
Delivery BW: bandwidth used.
The following is the full command syntax for the show policy command:
Use the event history to determine the last time when policy flows were installed or removed. A value of dynamic for Type indicates the policy was dynamically created for overlapping policies.
Rename a Policy
Policy Renaming Procedure
Note: A DANZ Monitoring Fabric (DMF) policy must exist to use the renaming feature.
Use the following procedure to rename an existing policy.
Use the CLI command policyexisting-policy-name to enter the submode of an existing policy and then enter the show this command.
dmf-controller-1(config)# policyexisting-policy-name
dmf-controller-1(config-policy)# show this
! policy
policy existing-policy-name
Enter the rename command with the new policy name, as shown in the following example.
Note: Possible traffic loss may occur when renaming a policy.
Verify the policy name change using the show this command.
dmf-controller-1(config-policy)# show this
! policy
policy new-policy-name
dmf-controller-1(config-policy)#
Note: A user must have permission to update the policy. The new policy name must follow the requirements for a policy name.
Define Out-of-band Match Rules
A policy can contain multiple match rules, each assigned a rule number. However, the rule number does not specify a priority or the sequence in applying the match rule to traffic entering the filter ports included in a policy. Instead, if the traffic matches any match rules, all actions specified in the policy are applied to all matching traffic.
The following example adds two match rules to dmf-policy-1.
controller-1(config)# policy dmf-policy-1
controller-1(config-policy)# 10 match full ether-type ip dst-ip 10.0.0.50 255.255.255.255
controller-1(config-policy)# 20 match udp src-ip 10.0.1.1 255.255.255.0
controller-1(config-policy)# filter-interface filname2
controller-1(config-policy)# delivery-interface delname3
controller-1(config-policy)# action forward
Note: When changing an existing installed policy by adding or removing match rules, DANZ Monitoring Fabric (DMF) calculates the change in policy flows and only sends the difference to the switches in the path for that policy. The unmodified flows for that policy are not affected.
When more than one action applies to the same packet, DMF makes copies of the matched packet. For details, refer to the chapter Advanced Policy Configuration.
Define a Policy with a Packet Capture Action
Use the packet-capture retention-days command to change the number of days to retain PCAP files. To view the current setting, use the show packet-capture retention-daysretention-days command.
To remove PCAP files immediately, use the delete packet-capture files command. Delete the files affiliated with a specific policy, as shown in the following example:
The following command assigns the capture action to the current policy and schedules the packet capture to start immediately and run for 60 seconds.
controller-1(config-policy)# action capture
controller-1(config-policy)# start now duration 60 seconds
For a policy with the forward action, the start now command causes the policy to run indefinitely. However, policies with the capture action run capture for 1 minute unless otherwise specified, after which the policy becomes inactive. This action prevents a capture from running indefinitely and utilizes the appliance storage capacity.
Once the packet capture is complete, the PCAP file can be downloaded via HTTP using the URL displayed when entering the show packet-capture files command, as shown in the following example.
controller-1(config-policy)# show packet-capture files
~~~~~~~~~~~~~~~~~~~~~~~~~~~~~~~~~~~~~~~~~~~~~~~~ All Packet Capture Files ~~~~~~~~~~~~~~~~~~~~~~~~~~~~~~~~~~~~~~~~~~~~~~~~~~~~~~~~~
# Policy Name File Name File Size Last Modified URL
-|-----------|----------------------------------|---------|------------------------------|----------------------------------------------------------------|
1 capture 2022-11-01-03-03-19-c106e6c.pcapng 258MB 2022-11-01 03:04:17.227000 PDT https://10.9.33.2/pcap/capture/2022-11-01-03-03-19-c106e6c.pcapng
controller-1(config-policy)#
To view the storage used and remaining for PCAP files, enter the show pcap-storage command, as in the following example:
controller-1 > show packet-capture disk-capacity
Disk capacity : 196GB
controller-1> show packet-capture disk-usage
Disk usage : 258MB
controller-1>
To view the number of days PCAP files are retained before deletion, use the show packet-capture retention-days command as in the following example:
controller-1> show packet-capture retention-days
To view the history of packet captures, enter the following command:
controller-1(config-policy)# show policy capture history
# Time Event Detail PCAP File
-|------------------------------|-------------------------------|-----------------|-------------------------------------------------|
1 2022-11-01 03:03:19.382000 PDT installation complete capturing packets /pcap/capture/2022-11-01-03-03-19-c106e6c.pcapng
2 2022-11-01 03:04:16.895000 PDT Configuration updated by admin. capturing packets inactive - outside configured runtime/duration,
scheduled to be started in 7sec if set active
3 2022-11-01 03:04:17.266000 PDT policy removed inactive - outside configured runtime/duration,
scheduled to be started in 6sec if set active
controller-1(config-policy)#
Rename Object
This feature provides a method to rename a DANX Monitoring Fabric (DMF) object. A DMF object must exist to use the rename feature. DMF 8.7 Controllers support the Policy rename feature.
Perform the following rename workflow steps:
Use the CLI to enter the submode of an existing object using the following commands:
dmf-controller(config-policy)# show this
! policy
policy existing-policy-name
Use the rename command with the name of the new object.
The following example illustrates changing a policy name:
dmf-controller(config-policy)# rename new-policy-name
dmf-controller(config-policy)# show this
! policy
policy new-policy-name
dmf-controller(config-policy)#
DMF updates references to the object (policy in earlier example).
If only the object name is to be updated, leaving any references to the object unmodified, use the rename-this command instead of rename, as shown in the following example:
dmf-controller(config)# policy existing-policy-name
dmf-controller(config-policy)# show this
! policy
policy existing-policy-name
dmf-controller(config-policy)# rename-this new-policy-name
dmf-controller(config-policy)# show this
! policy
policy new-policy-name
dmf-controller(config-policy)#
Limitations
Users must have permission to update the object.
The object must be associated with a submode (the rename command is only available within submodes).
The new name must follow the requirements for the object's name.
The REST API does not have a rename verb, and no REST API function can be issued to rename a policy.
Policy rename is implemented as follows:
Create a new transaction.
Delete the existing object within the transaction.
Create a new object with the requested name within the transaction.
Commit the transaction.
Since there is no direct support for object renaming, the Controller identifies this as a new object creation and an existing object deletion. This can result in a service interruption for semantics associated with the modified object.
Persist UDF Input Format
Use the CLI show commands to view the three offset match types.
The Multi-vCenter VM Support in Single Policy feature enhances scalability and configuration management by allowing the inclusion of Virtual Machines (VMs) from multiple vCenters within a single policy. DMF supports configuring match rules to include multiple VMs across disparate vCenters, unifying policy application and reducing configuration overhead. Whereas, in prior releases, integrating a large number of vCenters with a single DMF fabric required a separate policy for each instance.
Configuration
Monitor traffic from multiple VMs from multiple vCenters by creating one or more match rules specifying VM and vCenter details.
There is no need to configure vCenters using filter-vcenter to use this feature.
dmf-controller-1> en
dmf-controller-1# configure
dmf-controller-1(config)# policy multi-vcenter-policy
dmf-controller-1(config-policy)# 1 match ip src-vcenter vc72 src-vm-name ext-router dst-vcenter vc72 dst-vm-name vlan3
dmf-controller-1(config-policy)# 2 match ip src-vcenter vc-10.240.145.55 src-vm-name nutanix-foundation
Note: Completion of the src-vm-name and dst-vm-name lists VMs from the selected vCenter.
Show Commands
Use the show running-config command to view policy configurations that utilize VMs from multiple vCenters.
dmf-controller-1(config-policy)# show running-config policy multi-vcenter-policy
! policy
policy multi-vcenter-policy
1 match ip src-vcenter vc72 src-vm-name ext-router dst-vcenter vc72 dst-vm-name vlan3
2 match ip src-vcenter vc-10.240.145.55 src-vm-name nutanix-foundation
Troubleshooting
If the expected vCenters are not visible for src|dst-vcenter or the VMs from the chosen vCenter do not appear for src|dst-vm-name, use the vcenter commands to verify the current configuration and inventory details:
show vcenter [all detail] – Displays vCenter information. Verify the State field to determine if the corresponding vCenter is connected or disconnected.
show running-config vcenter – Displays the current vCenter configuration.