DMF Service Node Appliance
This chapter describes configuring the managed services provided by the DANZ Monitoring Fabric (DMF) Service Node Appliance.
Overview
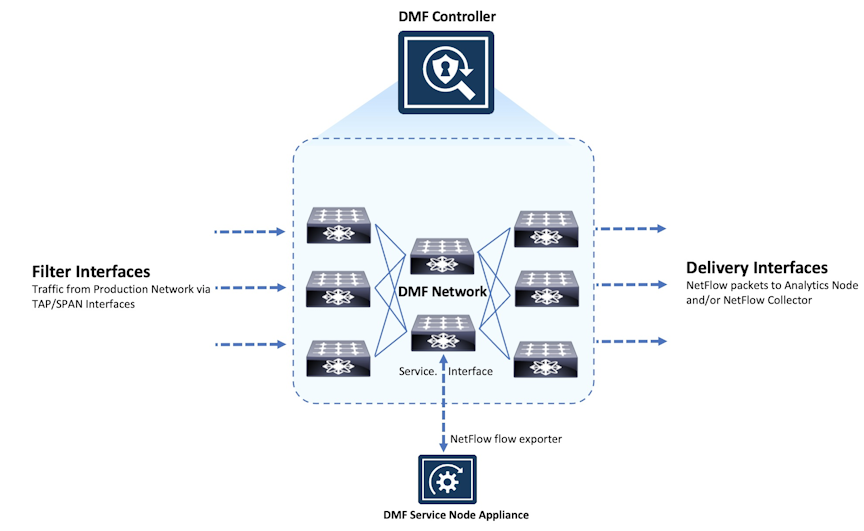
The DANZ Monitoring Fabric (DMF) Service Node has multiple interfaces connected to traffic for processing and analysis. Each interface can be programmed independently to provide any supported managed-service actions.
To create a managed service, identify a switch interface connected to the service node, specify the service action, and configure the service action options.
Configure a DMF policy to use the managed service by name. This action causes the Controller to forward traffic the policy selects to the service node. The processed traffic is returned to the monitoring fabric using the same interface and sent to the tools (delivery interfaces) defined in the DMF policy.
If the traffic volume the policy selects is too much for a single service node interface, define an LAG on the switch connected to the service node, then use the LAG interface when defining the managed service. All service node interfaces connected to the LAG are configured to perform the same action. The traffic the policy selects is automatically load-balanced among the LAG member interfaces and distributes the return traffic similarly.
Administer Managed Services using the GUI
This release introduces a redesigned Managed Services dashboard, replacing the former interface.
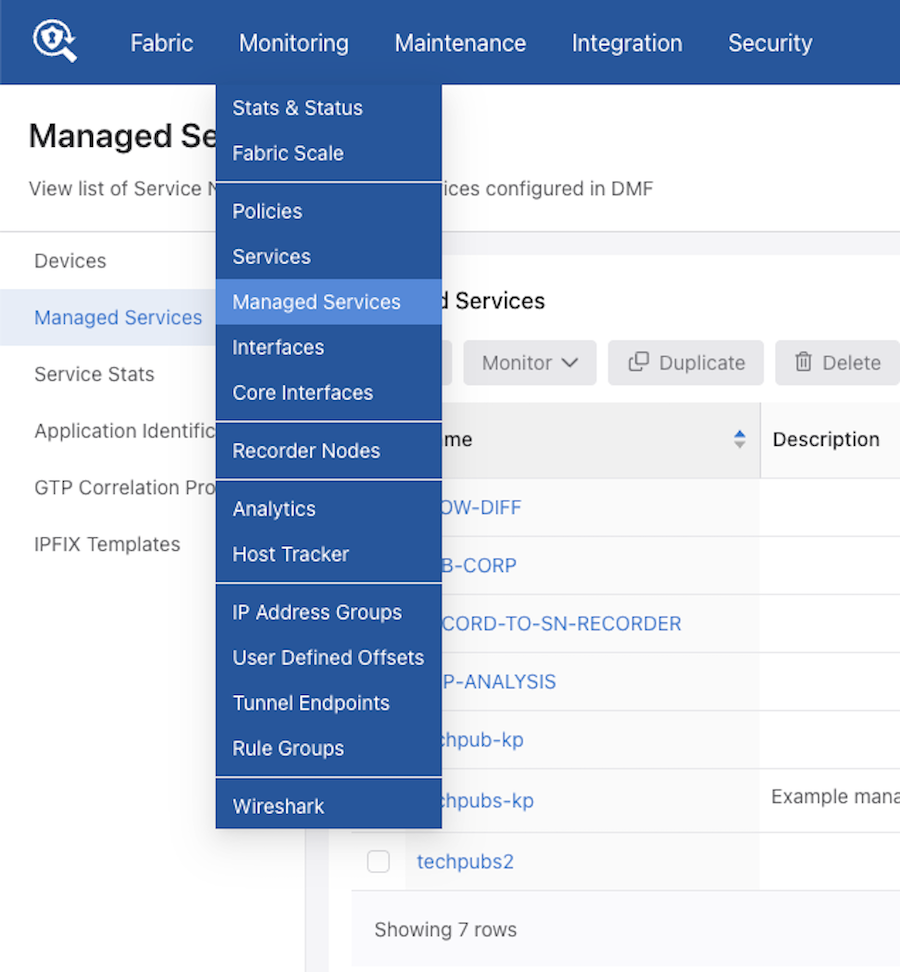
This dashboard displays the Service Node appliance devices connected to the DMF Controller and the services configured on the Controller.
Overview and Summary
The Managed Services dashboard comprises the following tabs:
- Devices (Default view)
- Managed Services
- Service Stats
- Application Identification - EFT
- GTP Correlation Profiles
- IPFIX Templates
The following summary provides a high-level consolidation of the core modules used to manage and monitor network traffic. It outlines the logical progression from initial service configuration and action assignment to real-time performance analysis and data standardization. Understanding these integrated workflows enables more effective traffic processing, optimization, and troubleshooting, and supports consistent data reporting across the network infrastructure.
Managed Services and Actions
The Managed Services module serves as the core configuration hub for traffic processing, defining specific behaviors through the Actions menu, which includes specialized tools for:
- Traffic Optimization: Slicing packets based on length or session data.
- Performance Analysis: Configuring TCP Analysis and monitoring delivery metrics.
- Packet Manipulation: Applying timestamps, replicating UDP traffic, and managing header stripping.
- Rule-Based Processing: Implementing Post Service Match Rules, which become available after establishing a Header Strip action.
Performance Monitoring
The Service Stats tab transitions from configuration to active monitoring. It provides two primary methods for evaluating service health:
- Quantitative Data: A detailed table displaying packet counts, byte counts, and bit rates (RX/TX/Applied).
- Visual Trends: A real-time chart that updates every 10 seconds, allowing for the comparison of Applied, TX, and RX series across specific metrics.
Template Management
The IPFIX Templates section enables standardized data export. Defining specific Keys and Fields maintains consistent data structures for external reporting. The interface supports full lifecycle management of these templates, including creation, modification, and bulk deletion.
Operational Efficiency
Throughout these modules, consistent Table Actions streamline the administrative workflow:
- The Duplicate and Edit functions reduce manual entry by allowing existing configurations to serve as templates.
- Filtering and Multi-select capabilities enable the management of complex environments with multiple service nodes and interfaces.
- The Export and Refresh tools ensure that data is always accessible and up to date for troubleshooting and documentation.
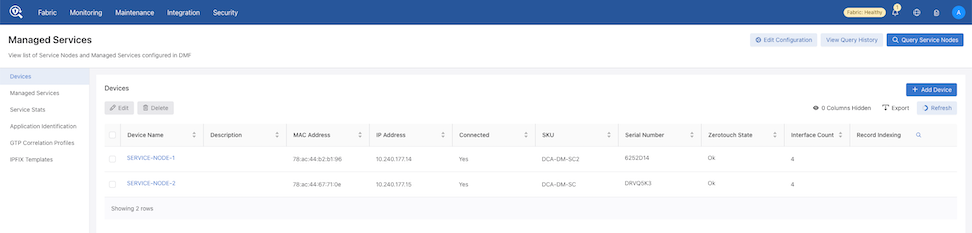
Devices
Navigate to .
The Devices dashboard displays a table of devices including the Name, Description, MAC Address, IP Address, Connected, SKU, Serial Number, Zerotouch State, and Interface Count.
Use this dashboard to view and configure devices.
Configure Devices
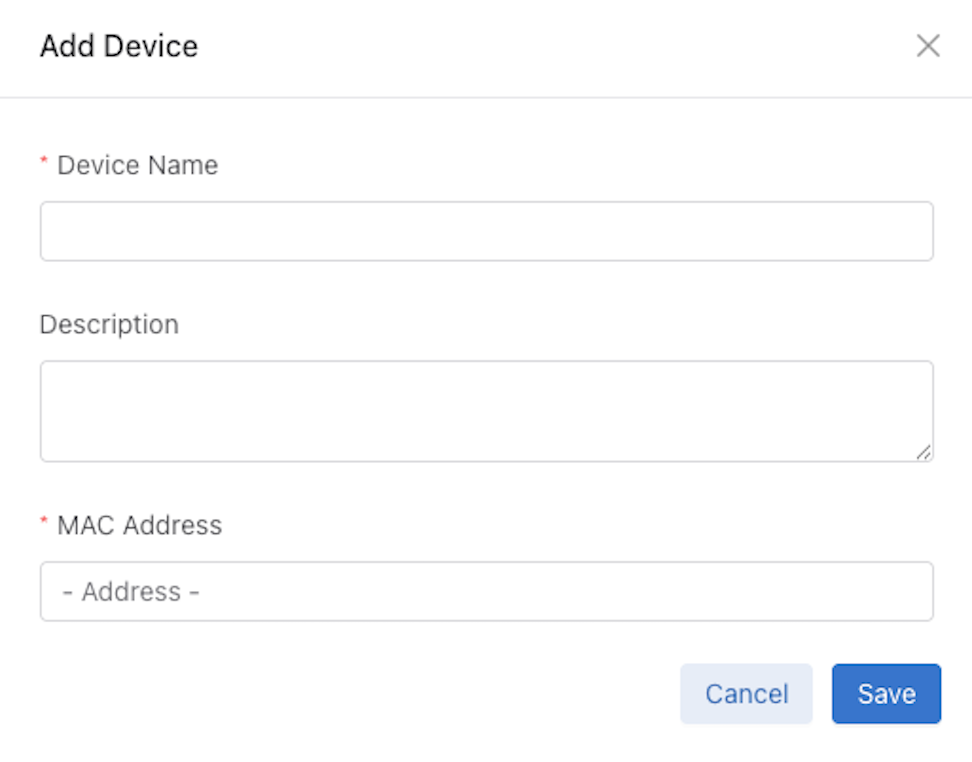
- Add: Select + Add Device to open the creation menu. Enter the Device Name, Description, and MAC Address.
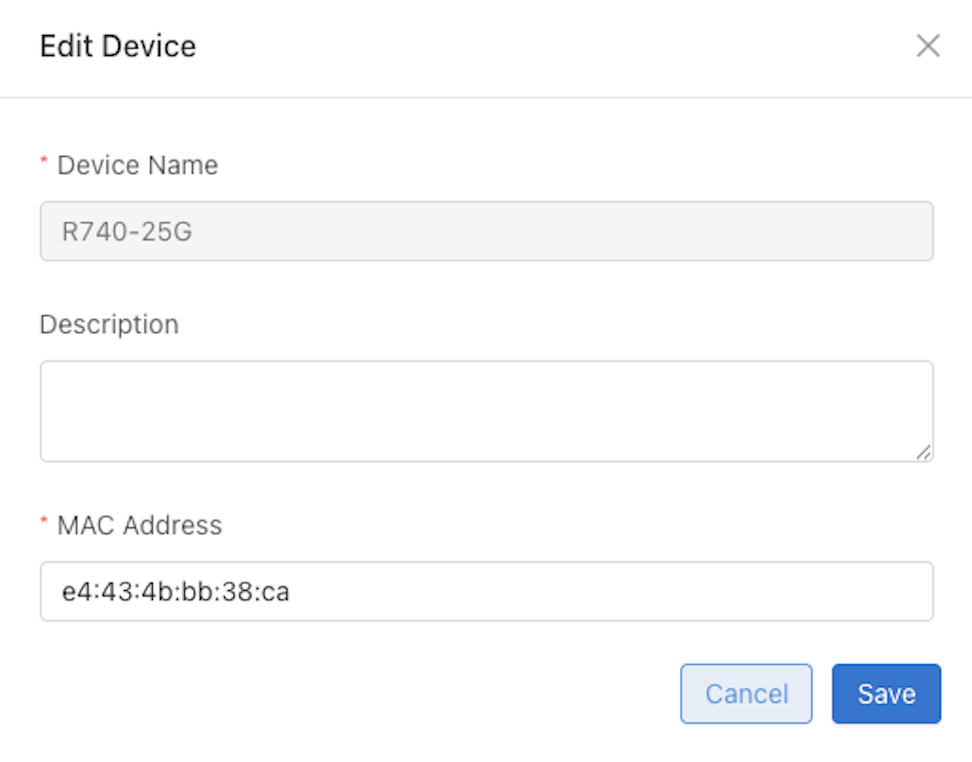
- Edit: Select the box for a device and select Edit to modify its configuration. The menu displays the current device data. Update the necessary fields and select Save to apply changes.
- Delete: Check one or more devices in the table and select Delete to remove them.
- Export: Select Export to download the device data in CSV or JSON format to the local downloads folder.
- Refresh: The system automatically refreshes data every 60 seconds. Hover over Refresh to view the time remaining until the next update. Select Refresh to update the data immediately.
Add Device
Select + Add Device to open the creation menu. Enter the Device Name, Description, and MAC Address.

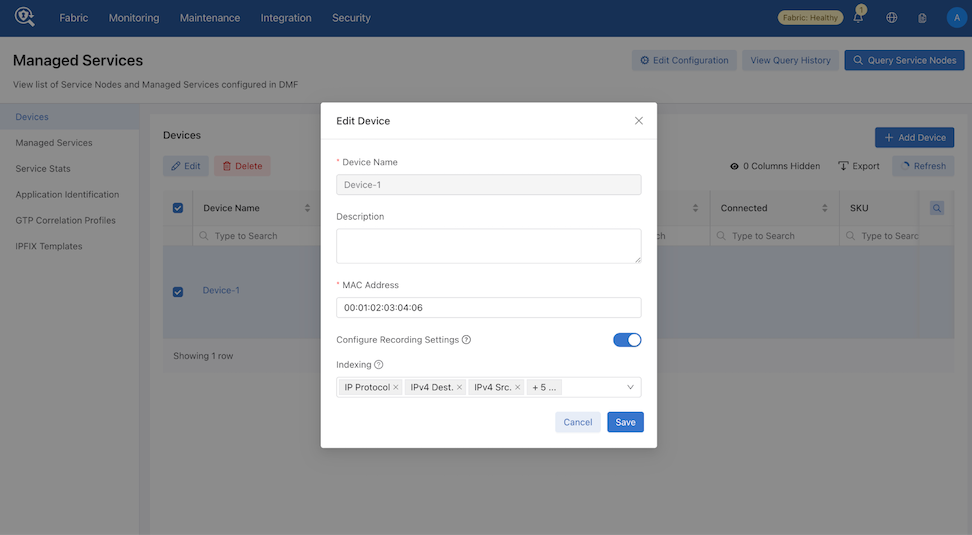
Edit Device
Select the box for a device and select Edit to modify its configuration. The menu displays the current device data. Update the necessary fields and select Save to apply changes.
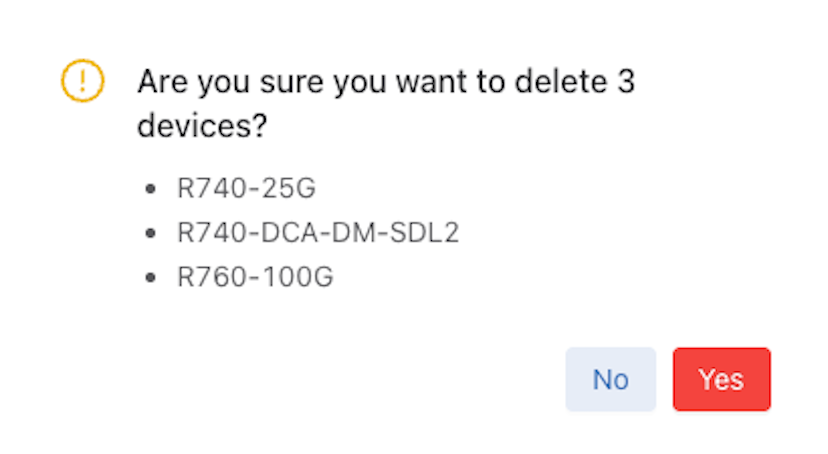
Delete Device(s)
Check one or more devices in the table and select Delete to remove them. Confirm the deletion.
Refresh: By default, the system refreshes data every 60 seconds. Hovering over Refresh displays the time remaining until the next update. When required, click Refresh to update the data immediately.

Devices Details
View Device Details
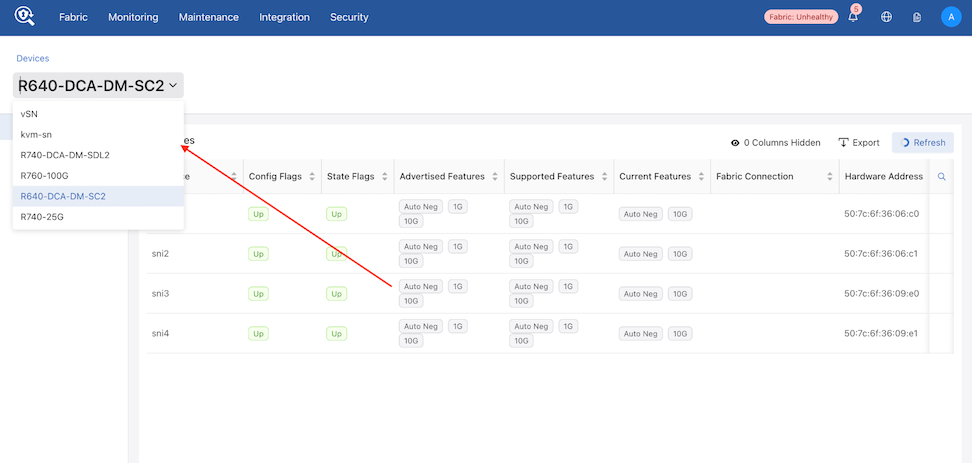
Select a device name in the table to access the device details view.
- Default View: The system opens the Interfaces dashboard by default.
- Device Switching: Use the device drop-down menu to switch between devices.
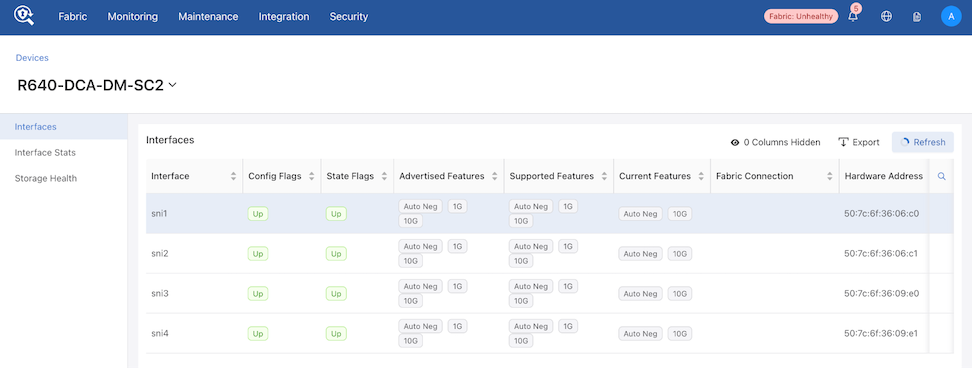
Interfaces
The Interfaces dashboard lists all interfaces associated with the selected device. The table includes the following columns:
- Interface
- Config Flags
- State Flags
- Advertised Features
- Supported Features
- Current Features
- Fabric Connection
- Interface Number
- Hardware Address
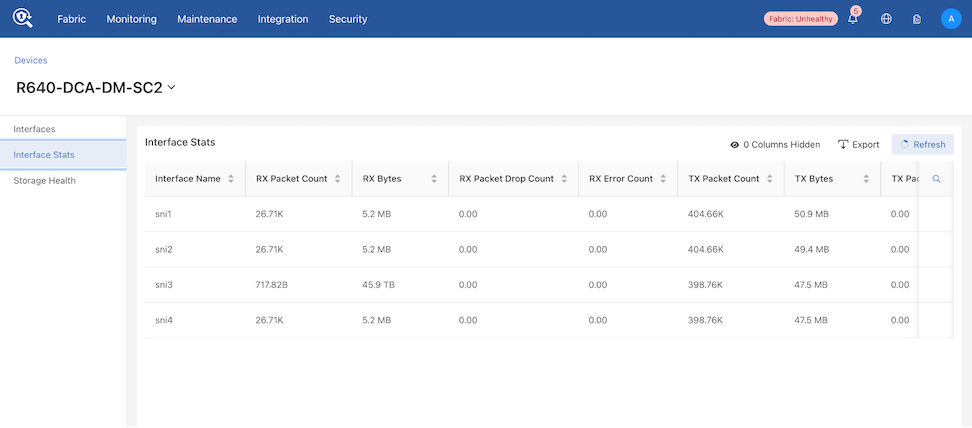
Interface Stats
Select Interface Stats to view interface statistics. The table displays the following columns:
- Interface Name
- RX Packet Count
- RX Bytes
- RX Packet Drop Count
- RX Error Count
- TX Packet Count
- TX Bytes
- TX Packet Drop Count
- TX Error Count
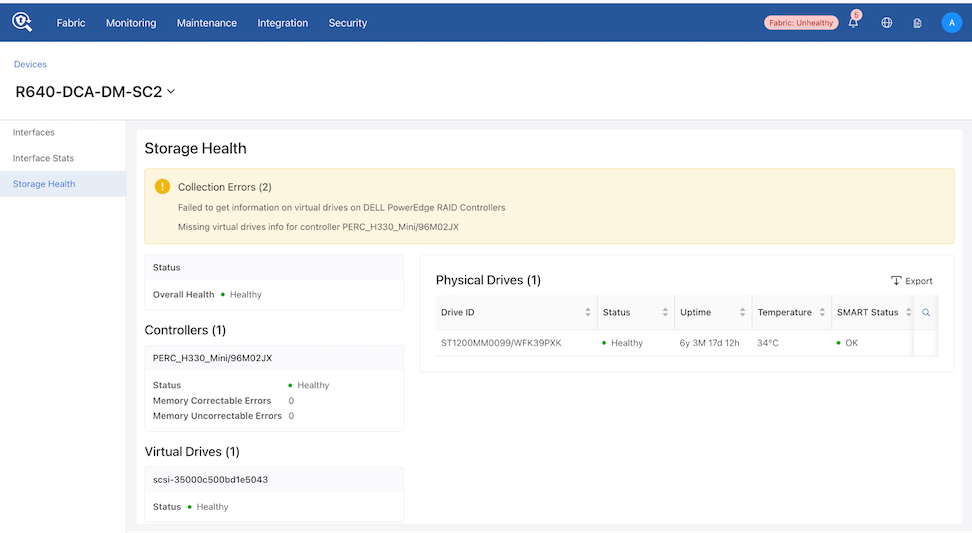
Storage Health
Select Storage Health to view the device's storage status. This view displays health indicators for:
- Status
- Controllers
- Virtual Drives
It also includes a detailed table of Physical Drives.
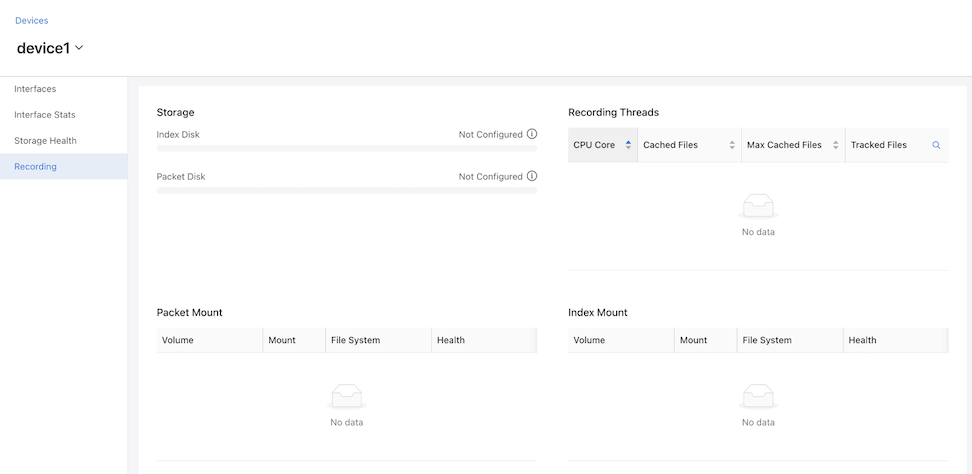
Recording Tab
Select Recording to view storage recording details. This view includes tables for:
- Packet Mount
- Recording Threads
- Index Mount
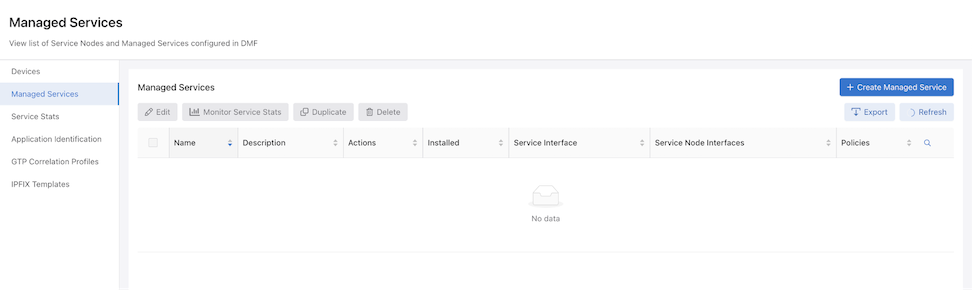
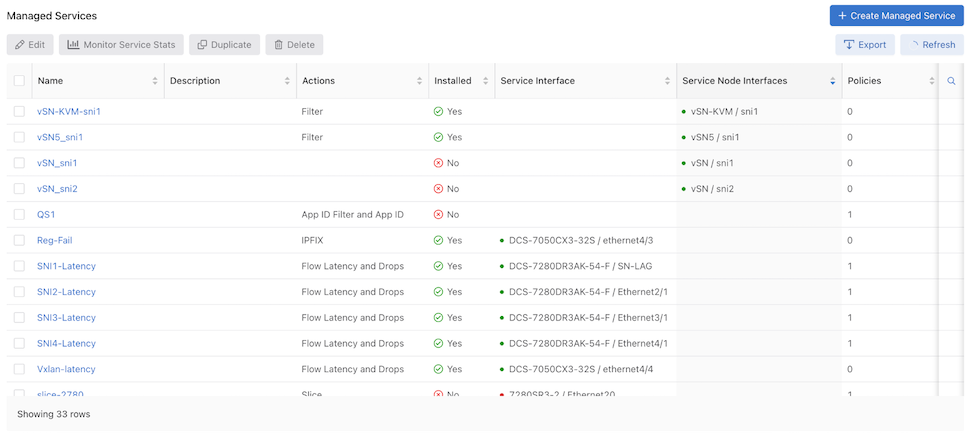
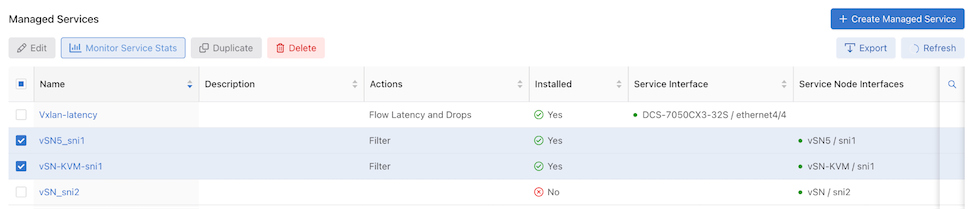
Managed Services
The Managed Services dashboard displays a table of configured services and includes the following columns:
- Name
- Description
- Actions
- Installed
- Service Interface
- Service Node Interfaces
- Policies
Use this dashboard to view and configure Managed Services.
Configure a Managed Service
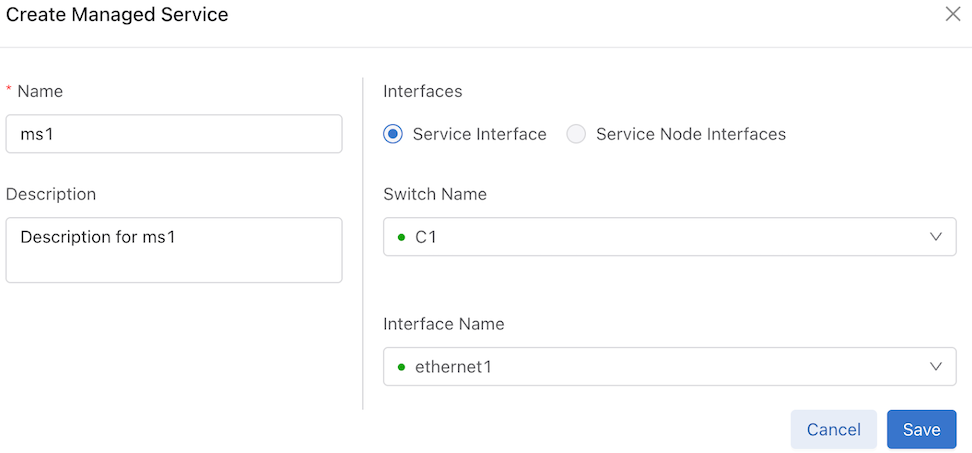
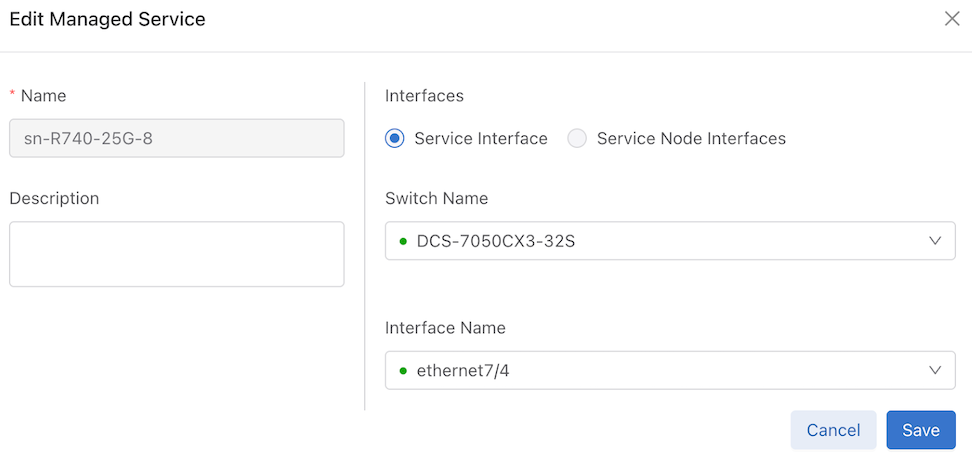
Create - Select + Create Managed Service to open the creation menu. Enter the Managed Service Name, Description, and configure the interfaces. Configure either a Service Interface or Service Node Interfaces.

Configure Service Interface
Configure the Service Interface by selecting the Switch and its Interface.
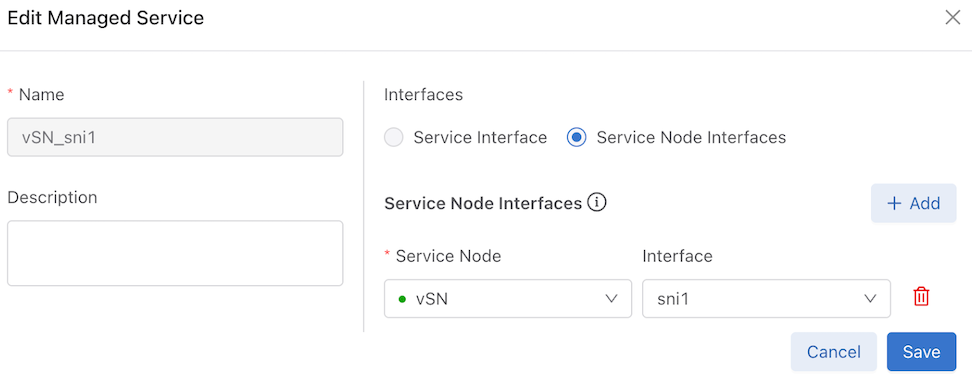
Configure Service Node Interface
Install a managed service directly on a switch-less Service Node (SN) by configuring the Service Node Interface. Select the Service Node and the specific Interface.
Configure multiple Service Node Interfaces for a single Managed Service to install the same service across multiple interfaces.
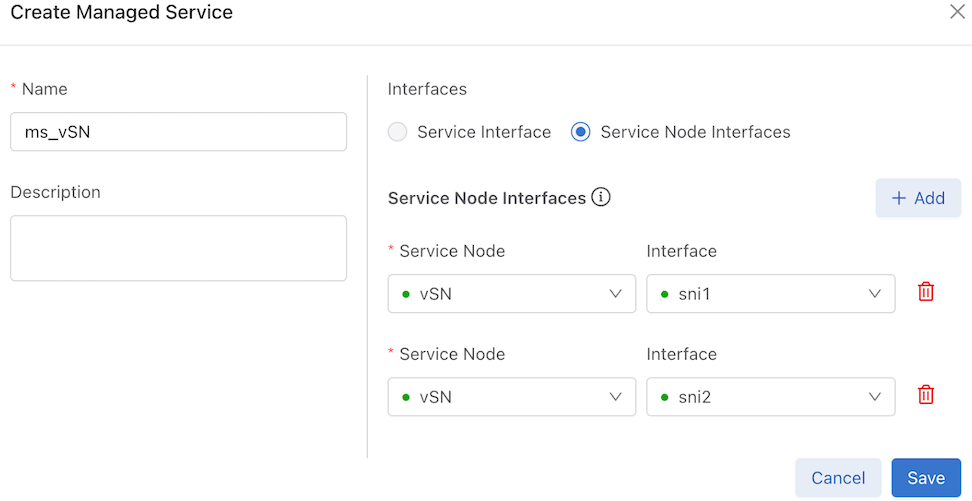
Select Save to apply the configuration.
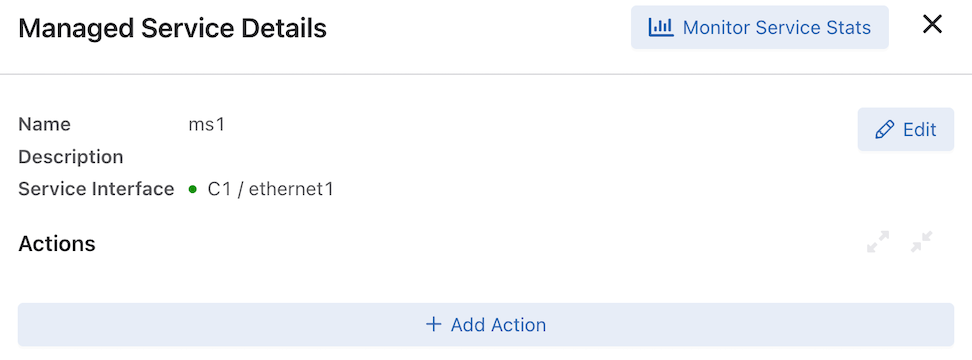
Configure Managed Service Actions
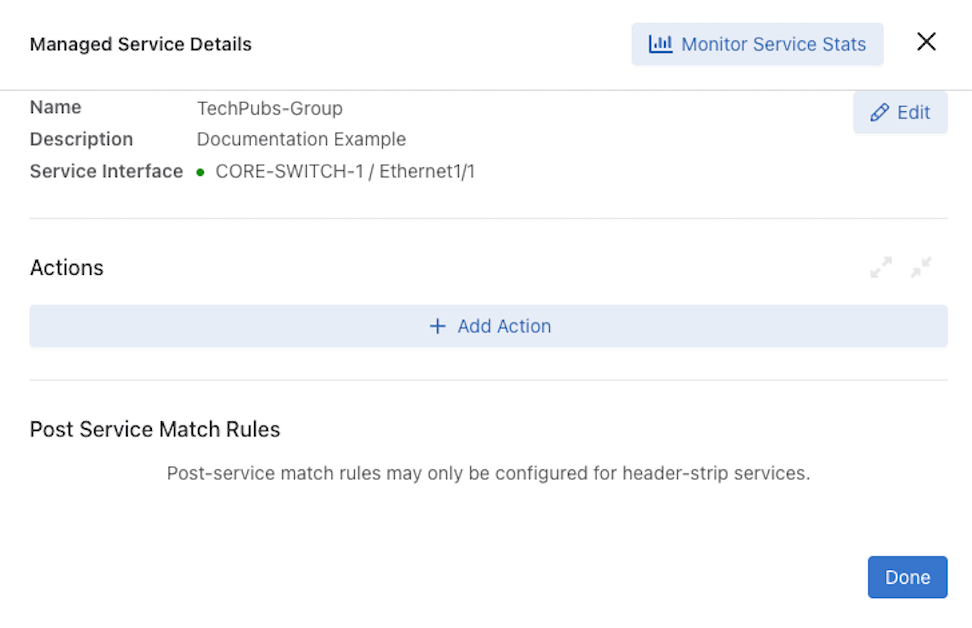
Configure actions using the Managed Services Details window. This drawer opens automatically after creating a Managed Service, or by selecting a Managed Service name from the table.
The UI supports the following actions:
- Deduplication
- App ID Filter
- Filter
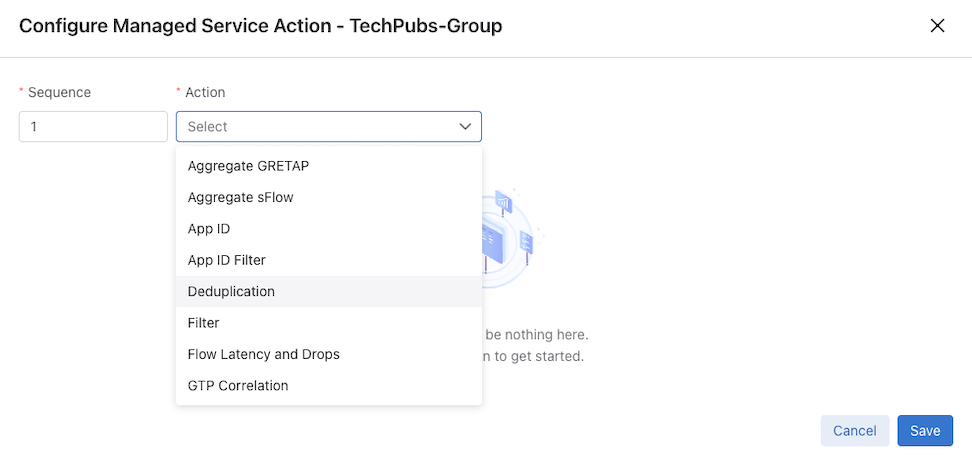
To configure an action, select + Add Action in Managed Services Details to open the setup menu.
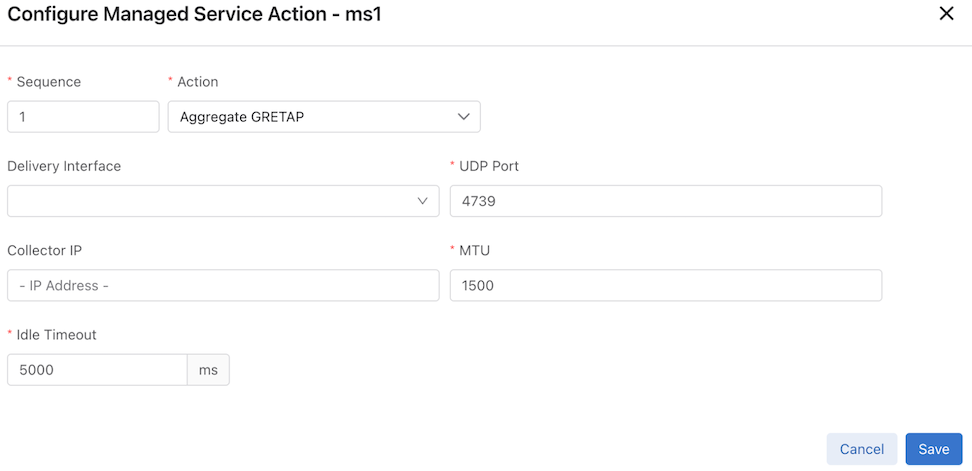
Aggregate GRETAP
Select Aggregate GRETAP from the Action drop-down to open the configuration menu. Configure the following fields:
- Delivery Interface
- UDP Port (Default: 4739)
- Collector IP
- MTU (Default: 1500)
- Idle Timeout (Default: 5000 ms)
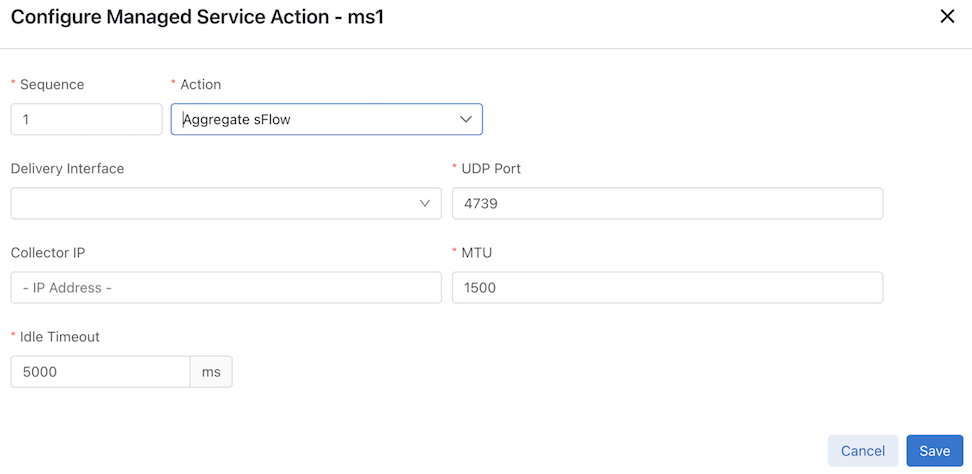
Aggregated sFlow
Select Aggregate sFlow from the Action drop-down to open the configuration menu. Configure the following fields:
- Delivery Interface
- UDP Port (Default: 4739)
- Collector IP
- MTU (Default: 1500)
- Idle Timeout (Default: 5000 ms)
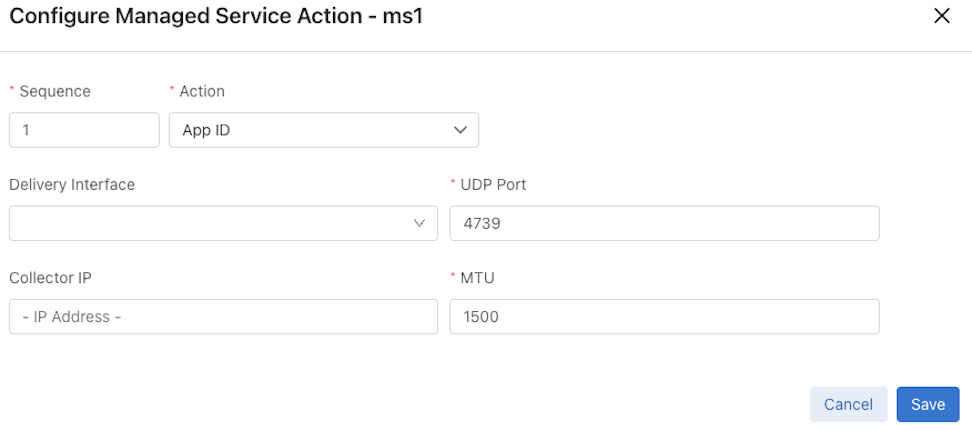
App ID
Application Identification - Early Field Trial (EFT)
Select AppID from the Action drop-down to open the configuration menu. Configure the following fields:
- Delivery Interface
- UDP Port (Default: 4739)
- Collector IP
- MTU (Default: 1500)
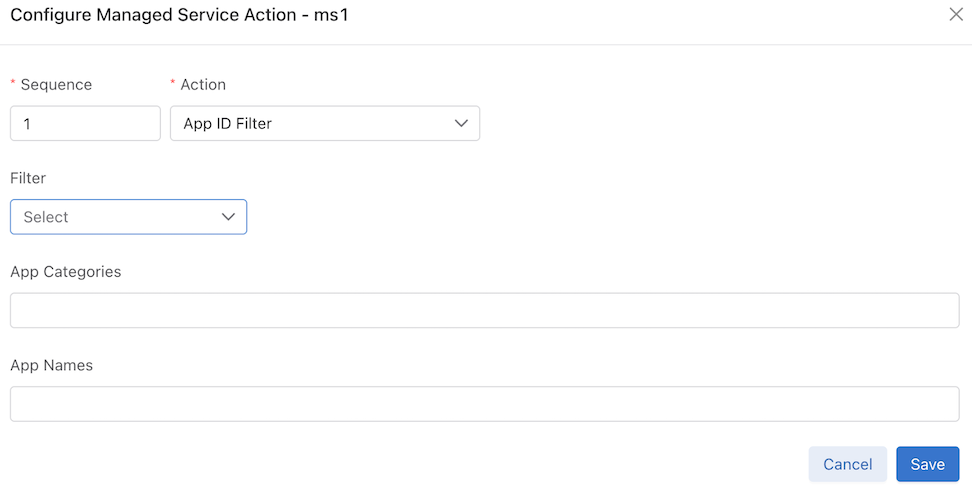
App ID Filter Action
Application Identification Filter - Early Field Trial (EFT)
Select App ID Filter from the Action drop-down to open the configuration menu. Configure the following fields:
- Filter
- App Categories
- App Names
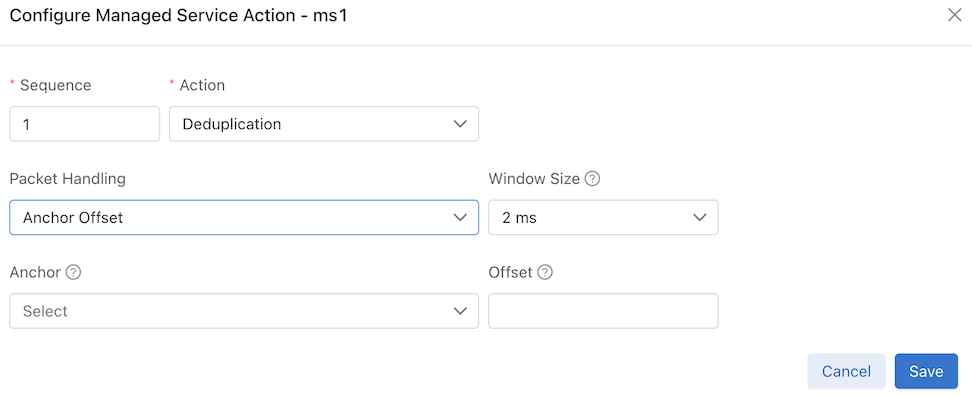
Deduplication Action
Select Deduplication from the Action drop-down to open the configuration menu. Configure the following fields:
- Packet Handling
- Window Size
- Anchor
- Offset
The DANZ Monitoring Fabric (DMF) Service Node enhances the efficiency of network monitoring tools by eliminating duplicate packets. Duplicate packets can be introduced into the out-of-band monitoring data stream by receiving the same flow from multiple TAP or SPAN ports spread across the production network. Deduplication eliminates these duplicate packets and enables more efficient use of passive monitoring tools.
- Full packet deduplication: deduplicates incoming packets that are identical at the L3/L4 layers.
-
Payload routed packet deduplication: Routed Deduplication with L4 Payload and Salt. This skips TCP/UDP headers in hashing, allowing duplicate detection based on identical payloads even if header fields like timestamps differ.
- Routed packet deduplication: as packets traverse an IP network, the MAC address changes from hop to hop. Routed packet deduplication enables users to match packet contents starting from the L3 header.
- L4 Payload Start: NATed packet deduplication: to perform NATed deduplication, the service node compares packets in the configured window that are identical starting from the L4 payload. To use NATed packet deduplication, perform the following fields as required:
- Anchor: Packet Start, L3 Header Start, L4 Header Start, or L4 Payload Start fields.
- Offset: the number of bytes from the anchor where the deduplication check begins.
- Window Size: The time window in which the service looks for duplicate packets is configurable. Select a value among these choices: 2ms (the default), 4ms, 6ms, and 8ms.
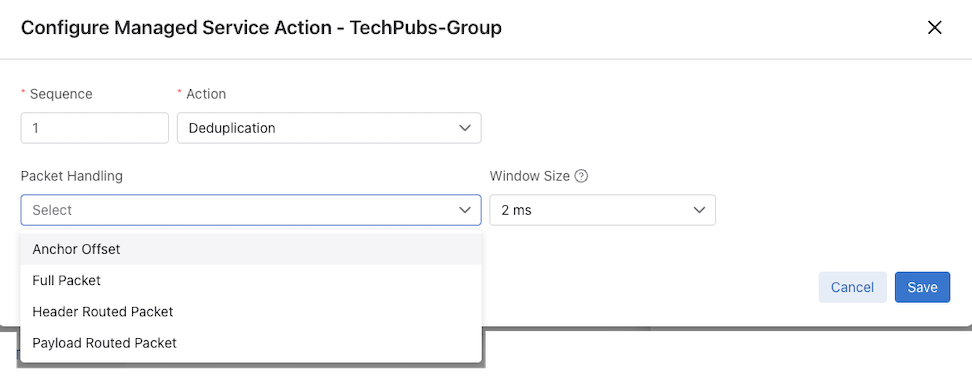
GUI Configuration
Choose the desired managed service from the Managed Service Dashboard and select + Add Action.
- Anchor Offset - Packet Start, L3 Header Start, L4 Header Start, or L4 Payload Start fields.
- Offset - Applies to Anchor Offset function and uses the number of bytes from the anchor where the deduplication check begins.
- Full Packet - All bytes in packet.
- Header Routed Packet - Header routed frame.
- Payload Routed Packet - Payload routed frame.
- Window Size - Applies to all Packet Handling functions. Configure the time window where the service looks for duplicate packets. Select a value from these choices: 2ms (the default), 4ms, 6ms, and 8ms.
After completing the necessary configuration, select Save followed by Done in the Managed Service Details window.
Routed Deduplication with L4 Payload and Salt
The DMF Controller supports a payload-routed-packet deduplication option. This feature allows service nodes to combine the L4 payload start anchor point with routed salt (L3 IP addresses, L4 source/destination ports, and other L3 header fields).
Anchoring the deduplication range at the L4 payload start ensures that frames with identical payload content are identified as duplicates, even when TCP headers—such as frequently updated timestamps—differ. This method effectively skips TCP/UDP headers and options during hash computation.
Functional Benefits
- Optimized Bandwidth: The Service Node identifies and drops retransmitted packets containing identical data, preventing unnecessary traffic from reaching monitoring tools.
- Precise Flow Identification: Using routed salt ensures the system maintains visibility into L3 and L4 flow identifiers while focusing the deduplication logic on the payload.
- Reduced Processing Overhead: Monitoring tools receive only unique payload content, lowering the computational load on analytics engines.
Configuration and Functional Impact
Adding the payload-routed-packet option provides granular control over how the system processes retransmitted frames.
- Deduplication Logic: The Service Node uses the same routed salt to maintain flow identification, but shifts the hash computation range to start after the transport-layer headers.
- Data Integrity: DMF identifies frames as duplicates only when their payloads match within the same flow, ensuring that distinct data remains intact while redundant retransmissions are filtered.
- Backward Compatibility: DMF maintains existing deduplication behavior under the name
header-routed-packet. Automatic configuration migration ensures that current deployments maintain their existing behavior upon upgrade without manual intervention.
All dedup supporting Service Nodes support Routed Deduplication with L4 Payload and Salt.
Configuration
In the deduplication managed service configuration, the implementation replaces the single routed-packet option with two distinct settings for the region command. To access these options, first define a deduplication action using the [index] action dedup command within the config-managed-srv mode.
The region command defines the scope of the hash computation using the following four values:
-
full-packet: Performs complete packet deduplication starting from the beginning of the frame. -
header-routed-packet: Enables L4 header-based routed deduplication using routed salt (L3 IP addresses and L4 ports). -
payload-routed-packet: Enables L4 payload-based routed deduplication using routed salt, effectively skipping transport-layer headers to focus on payload content. -
anchor-offset: Supports advanced custom configurations for specific byte ranges. This option facilitates L4 header and payload-based deduplication without incorporating salted fields.
show command structure supports this enhancement.Filter Action
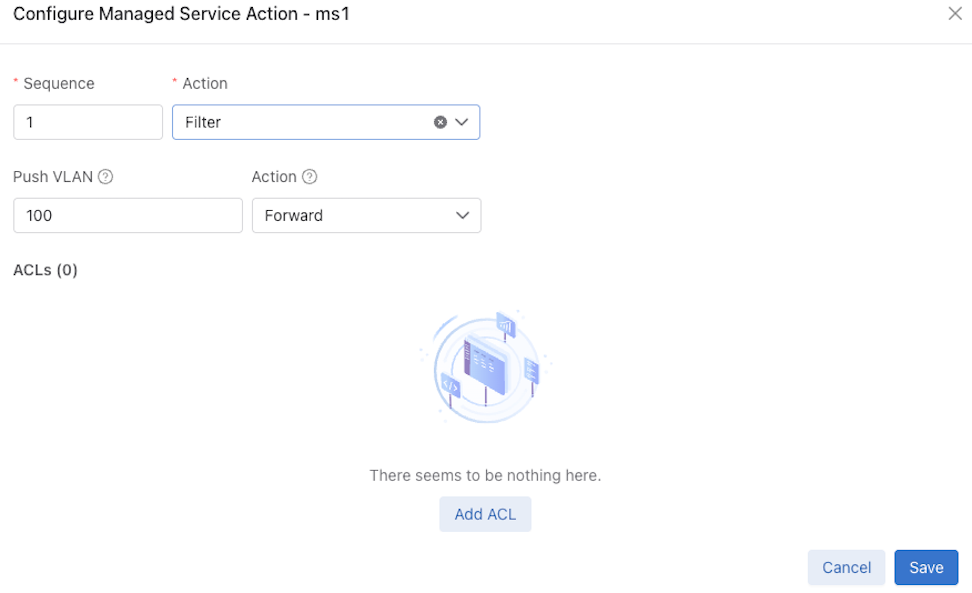
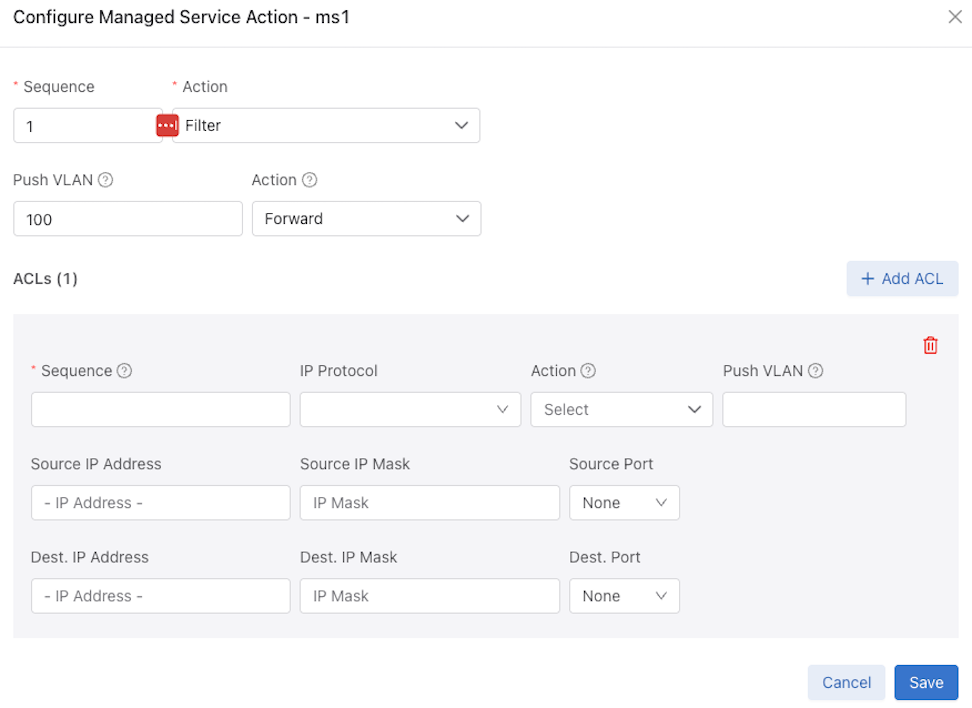
Select Filter from the Action drop-down to open the configuration menu. Configure a Default Action and optionally a Forwarding VLAN for forward actions.
- The default action applies to all ACL rules upon installation but can be overridden for individual rules.
- Select Add ACL to configure multiple ACL rules.
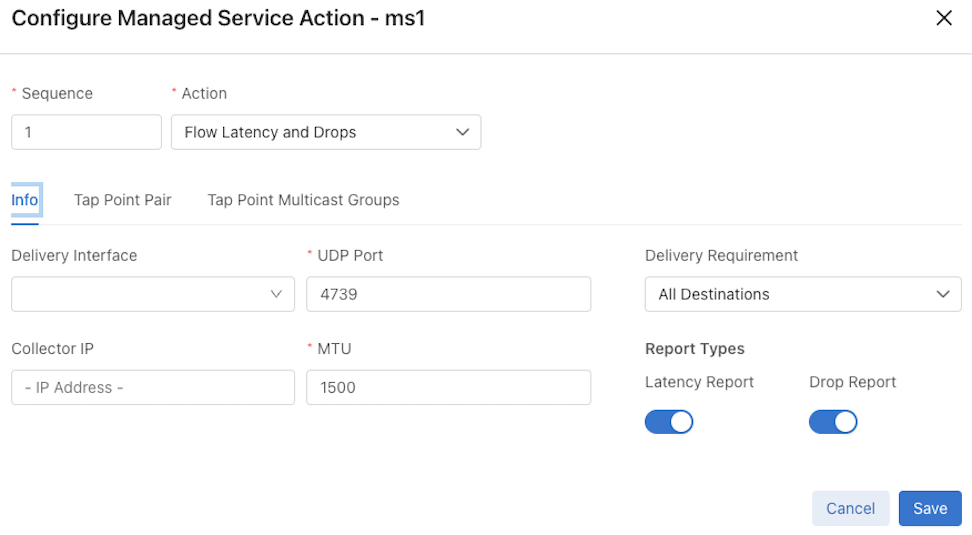
Flow Latency and Drops
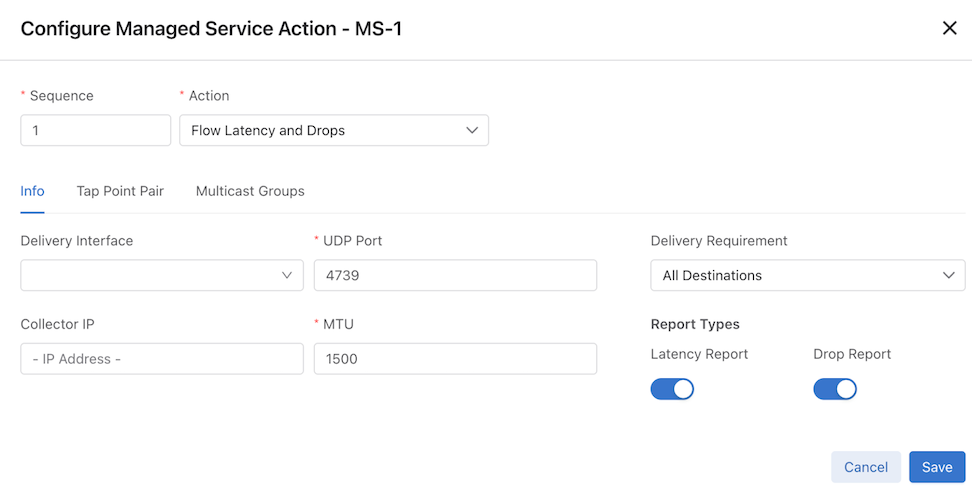
Select Flow Latency and Drops from the Action drop-down. The configuration menu has the following tabs:
- Info
- Tap Point Pair
- Tap Point Multicast Groups
Info Tab
Select the Info tab to open the configuration menu. Configure the following fields:
- Delivery Interface
- Collector IP
- UDP Port
- MTU
- Delivery Requirement
- Report Types
Tap Point Pair Tab
Select the Tap Point Pair tab to view the configuration table. The table displays the following columns:
- Source Type
- Source Name
- Destination Type
- Destination Name
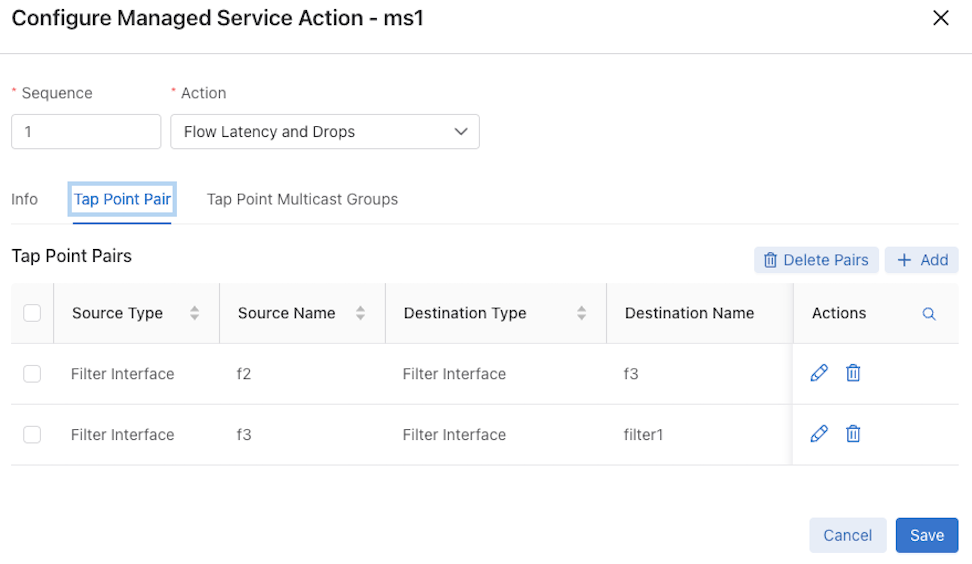
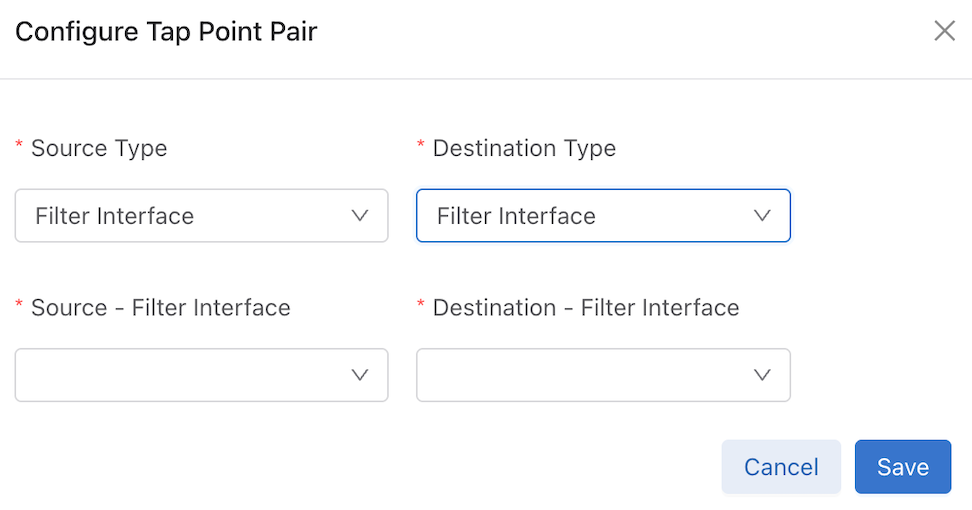
Add Entry: Select Add to open the configuration menu.
Source Type: The Source Type drop-down includes the following options:
- Filter Interface
- Policy Name
- Filter Interface Group
Name Selection: The Name drop-down options update dynamically based on the selected Source Type.
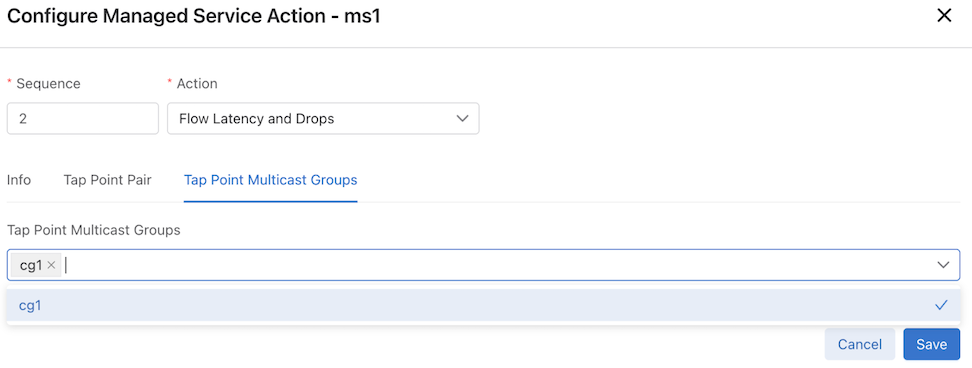
Tap Point Multicast Groups Tab
Select the Tap Point Multicast Groups tab to access the configuration.
- Use the multi-select drop-down to integrate Multicast groups with Flow Latency and Drops actions.
GTP Correlation
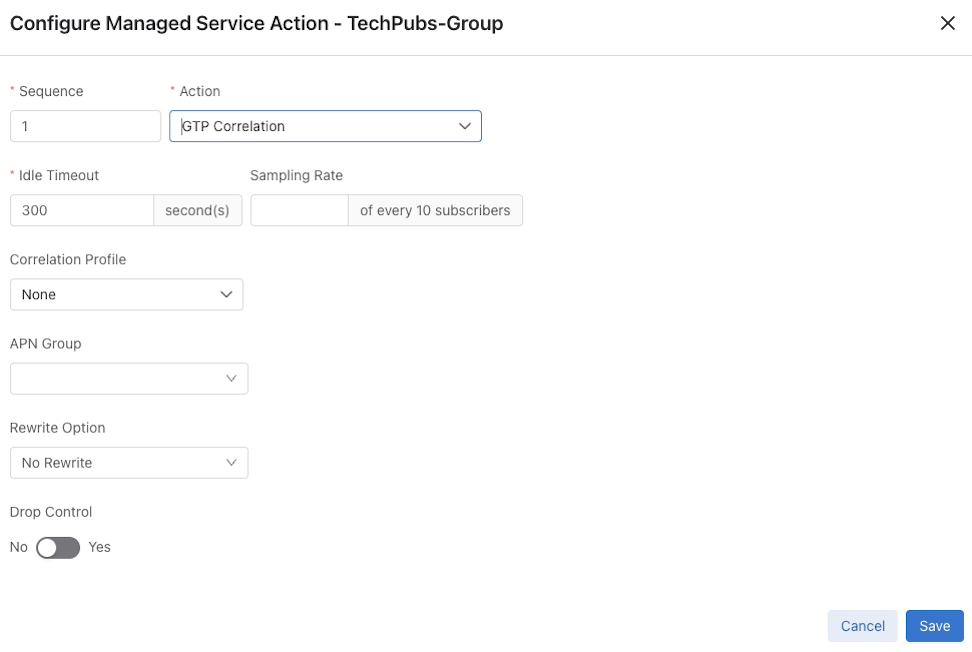
Select GTP Correlation from the Action drop-down to open the configuration menu. Configure the following fields:
- Idle Timeout
- Sampling Rate
- Correlation Profile
- APN Group
- Rewrite Option
- Drop Control
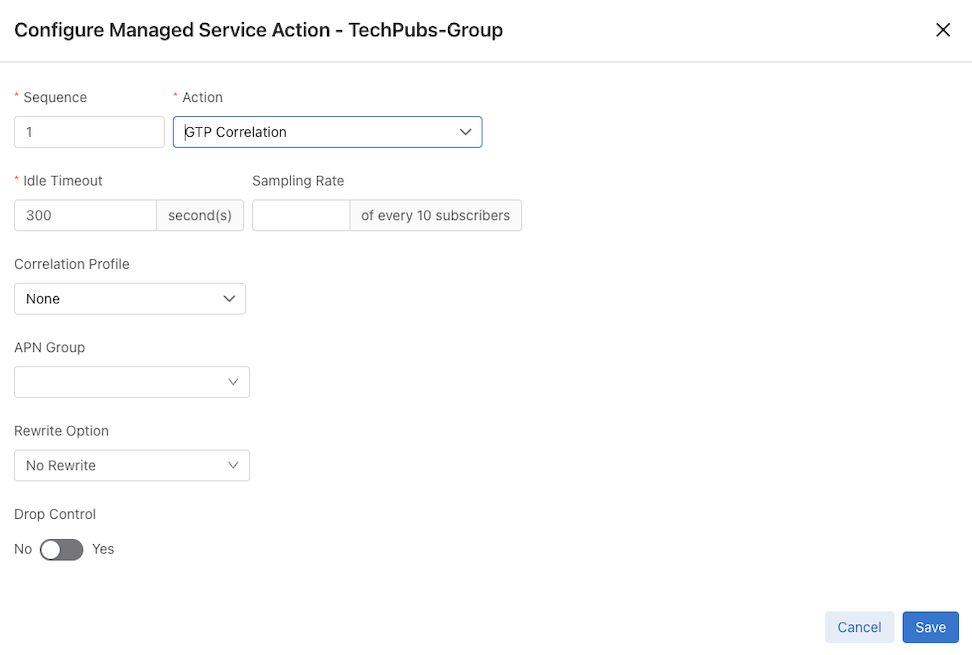
Correlation Profile Selection
Select one of the following options for the Correlation Profile. The menu will update dynamically to display the corresponding drop-down field:
- IMSI Group
- IMEI Group
- MSISDN Group
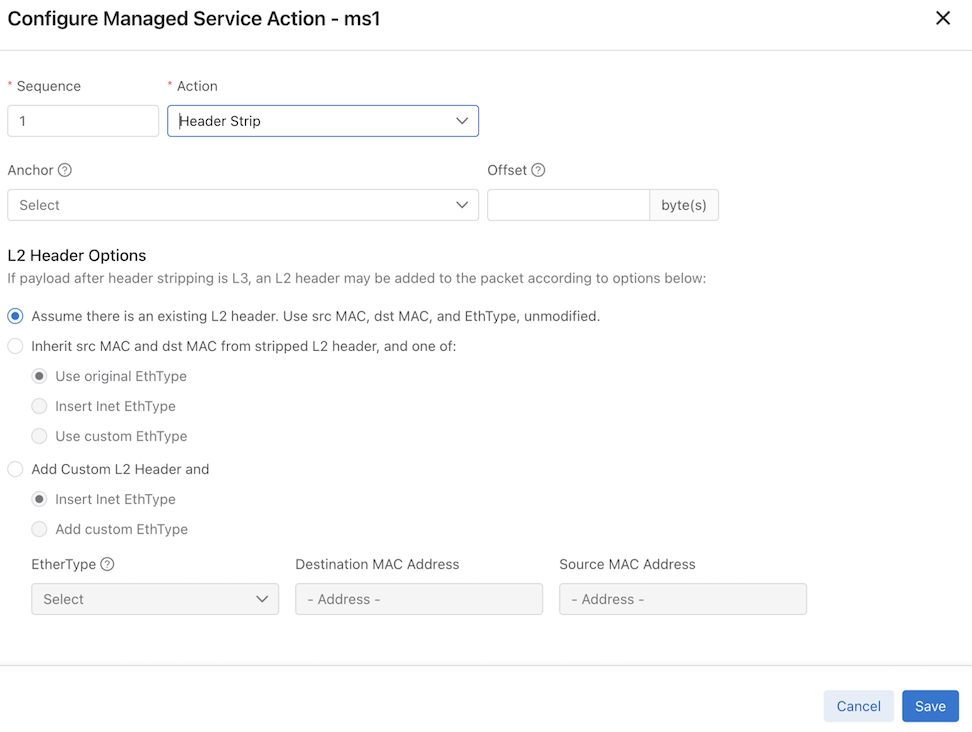
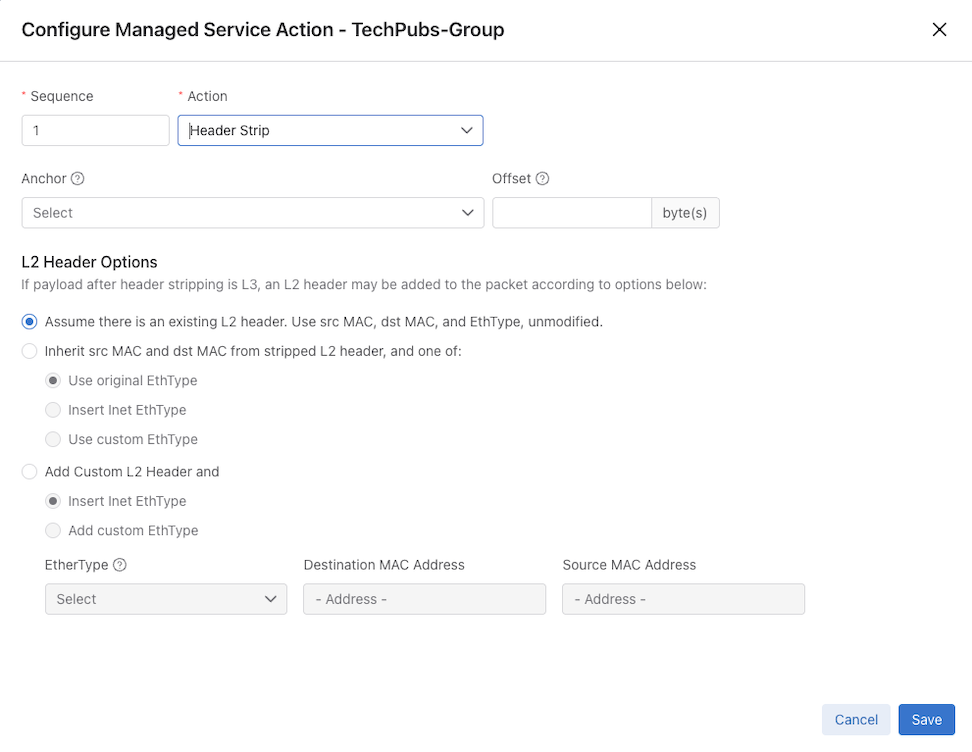
Header Strip
Select Header Strip from the Action drop-down to open the configuration menu. Configure the Anchor, Offset, and L2 Header options.
L2 Header Options
Choose one of the following configurations for the L2 Header:
- Option 1: Use Existing L2 Header
- Assumes an existing L2 header is present.
- Retains the existing Source MAC, Destination MAC, and EtherType without modification.
- Option 2: Inherit from Stripped L2 Header
- Inherits Source MAC and Destination MAC from the stripped L2 header.
- Select one of the following EtherType options:
- Use original EtherType
- Insert Inet EtherType
- Use custom EtherType
- Option 3: Add Custom L2 Header
- Adds a completely custom L2 header.
- Select one of the following EtherType options:
- Insert Inet EtherType
- Add custom EtherType
Header Strip Actions
Decapsulation Actions
The Action drop-down includes the following specific header decapsulation types:
- 16-Byte Header Decap
- ERSPAN Header Decap
- Geneve Header Decap
- L3 MPLS Header Decap
- LISP Header Decap
- VNTag Header Decap
- VXLAN Header Decap
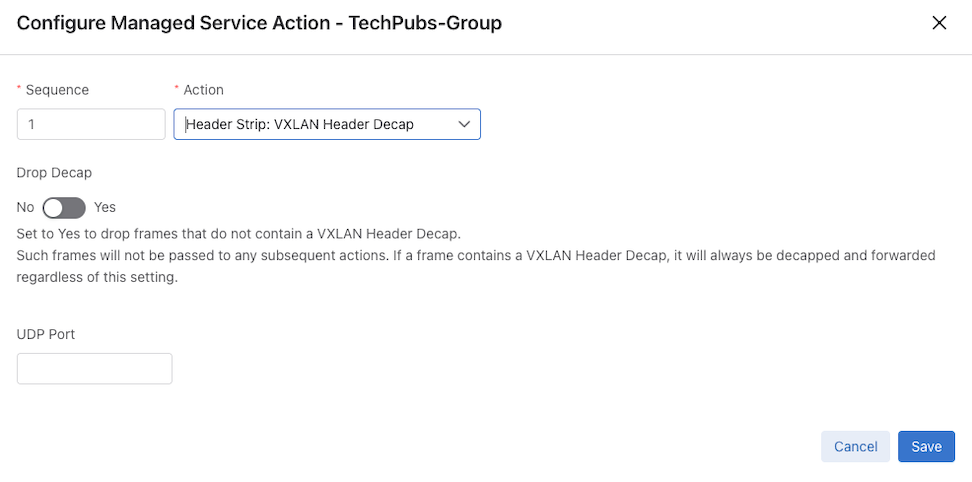
Select any of these options to open the corresponding configuration menu. Use the menu to configure the Drop Decap setting.
This action removes specific headers from the traffic selected by the associated DANZ Monitoring Fabric (DMF) policy. Alternatively, define custom header stripping based on the starting position of the Layer-3 header, the Layer-4 header, the Layer-4 payload, or the first byte in the packet.
- decap-erspan: remove the Encapsulated Remote Switch Port Analyzer (ERSPAN) header.
- decap-cisco-fabric-path: remove the Cisco FabricPath protocol header.
- decap-l3-mpls: remove the Layer-3 Multi-protocol Label Switching (MPLS) header.
- decap-lisp: remove the LISP header.
- decap-vxlan [udp-port vxlan port]: remove the Virtual Extensible LAN (VXLAN) header.
- decap-geneve: remove the Geneve header.
- l3-header-start
- l4-header-start
- l4-payload-start
- packet-start
Input a positive integer representing the offset from which the strip action begins. When omitting an offset, the header stripping starts from the first byte in the packet.
GUI Configuration
Under the Action drop-down, select the desired Header Strip action.
After assigning the required actions to the header stripping service, select Next or Post-Service Match.
The system displays the Post Service Match page, used in conjunction with the header strip service action.
IPFIX
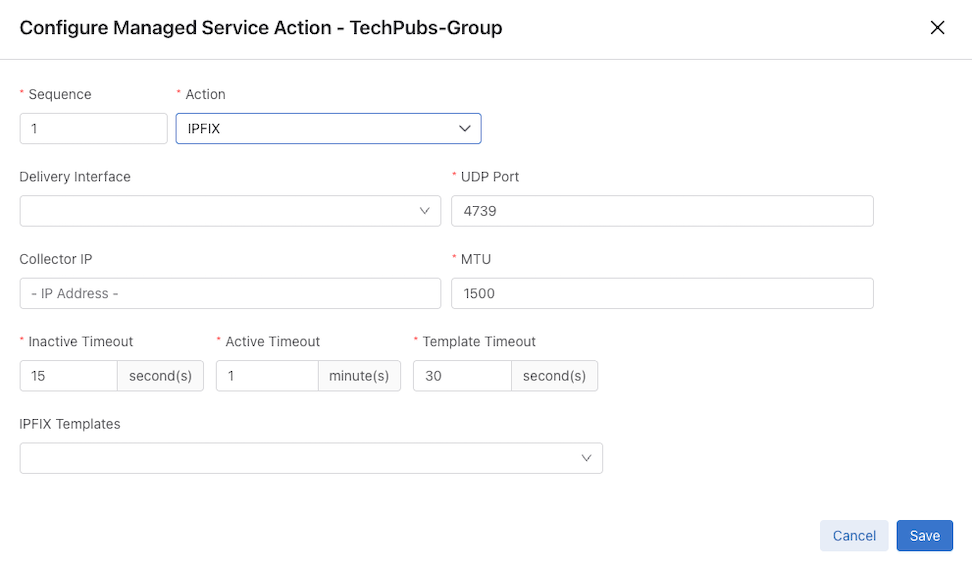
Select IPFIX from the Action drop-down to open the configuration menu. Configure the following fields:
- Delivery Interface
- UDP Port
- Collector IP
- MTU
- Inactive Timeout
- Active Timeout
- Template Timeout
- IPFIX Template
Mask
Mask
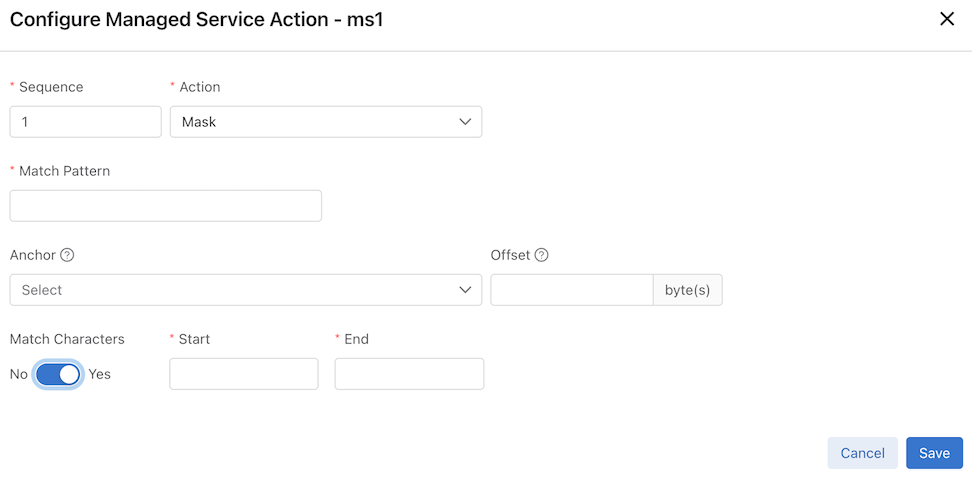
Select Mask from the Action drop-down to open the configuration menu. Configure the following fields:
- Match Pattern
- Anchor
- Offset
- Match Characters
Match Characters Configuration
Enable Match Characters to display and configure the following additional fields:
- Mask Start
- Mask End
NetFlow
Select NetFlow from the Action drop-down to open the configuration menu. Configure the following fields:
- Delivery Interface
- UDP Port
- Collector IP
- MTU
- Inactive Timeout
- Active Timeout
- Flows
- Per-Interface Records
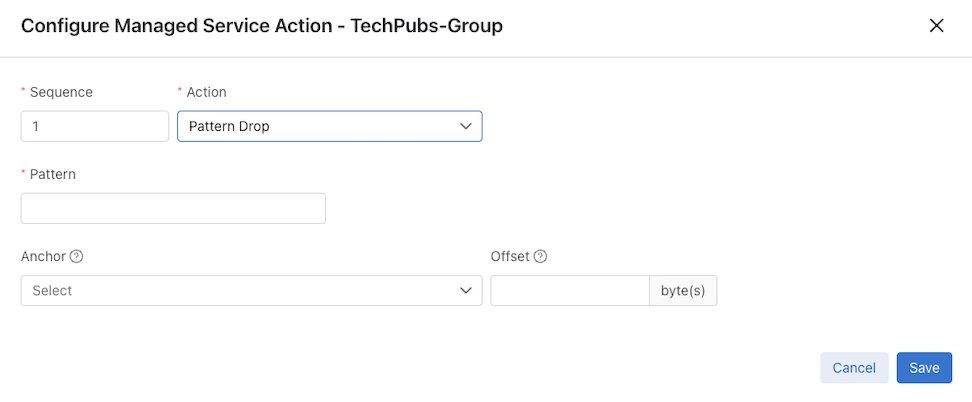
Pattern Drop
Select Pattern Drop from the Action drop-down to open the configuration menu. Configure the following fields:
- Pattern
- Anchor
- Offset
Pattern Match
Select Pattern Match from the Action drop-down to open the configuration menu. Configure the following fields:
- Pattern
- Anchor
- Offset

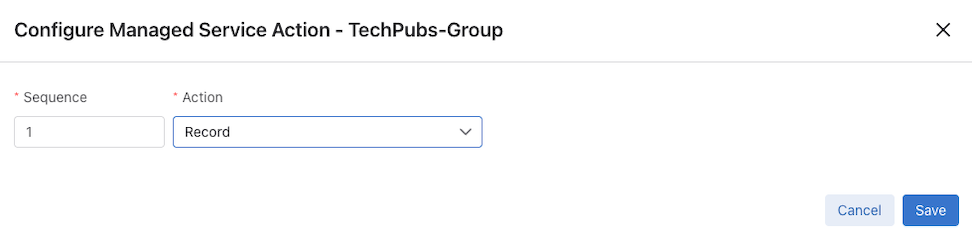
Record
Select Record from the Action drop-down to open the configuration menu.
Regex Session
Select Regex Session from the Action drop-down to open the configuration menu. Configure the following fields:
- Anchor
- Offset
- Pattern
- IP Protocol
- Regex Session Table Size
- TCP Idle Timeout
- UDP Timeout
SIP Mask
Select SIP Mask from the Action drop-down to open the configuration menu. Configure the following fields:
- UDP Port
- TCP Port
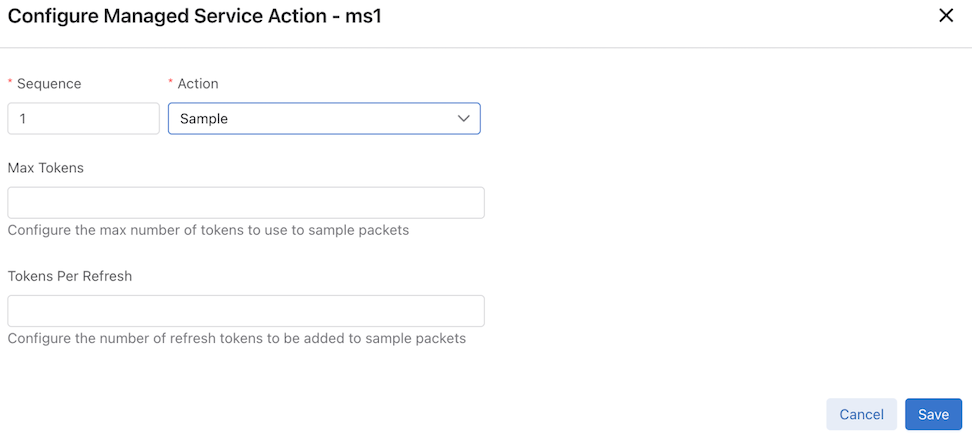
Sample
Select Sample from the Action drop-down to open the configuration menu. Configure the following fields:
- Max Tokens
- Tokens Per Refresh
Session Slice
Select Session Slice from the Action drop-down to open the configuration menu. Configure the following fields:
- Slice After (based on number of Packets)
- Idle Timeout
Slice
Select Slice from the Action drop-down to open the configuration menu. Configure the following fields:
- Insert Original Packet length
- Anchor
- Offset
Timestamp
Select Timestamp from the Action drop-down to open the configuration menu.
TCP Analysis
Select TCP Analysis from the Action drop-down to open the configuration menu. Configure the following fields:
- Delivery Interface
- UDP Port
- Collector IP
- MTU
- Include Dapper Elements
- Max Samples
UDP Replication
Select UDP Replication from the Action drop-down to open the configuration menu. Configure the following fields:
- Delivery Interface
- Input Packet Destination IP
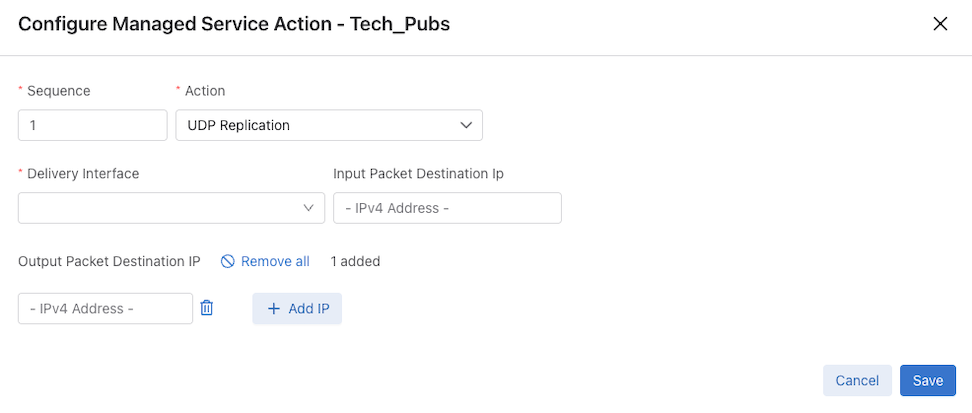
- Output Packet Destination IP
Adding Multiple Output IPs
To configure multiple Output Packet Destination IPs, select + Add IP.
After completing the necessary configuration, select Save.
The saved configuration can be found under Actions within the Managed Services Details.
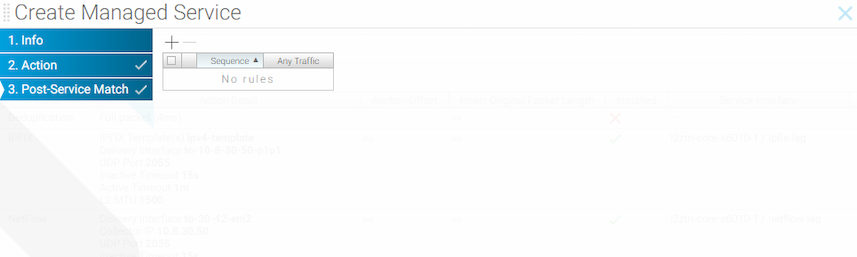
Post Service Match
Post Service Match Rules
Prerequisite: Add a Header Strip action or one of the Header Strip Decap actions before configuring Post Service Match Rules.
Add Rule Availability
After adding a Header Strip or Header Strip Decap action, the Add Rule option appears in two locations:
- The left navigation panel.
- The center of the empty state dashboard.
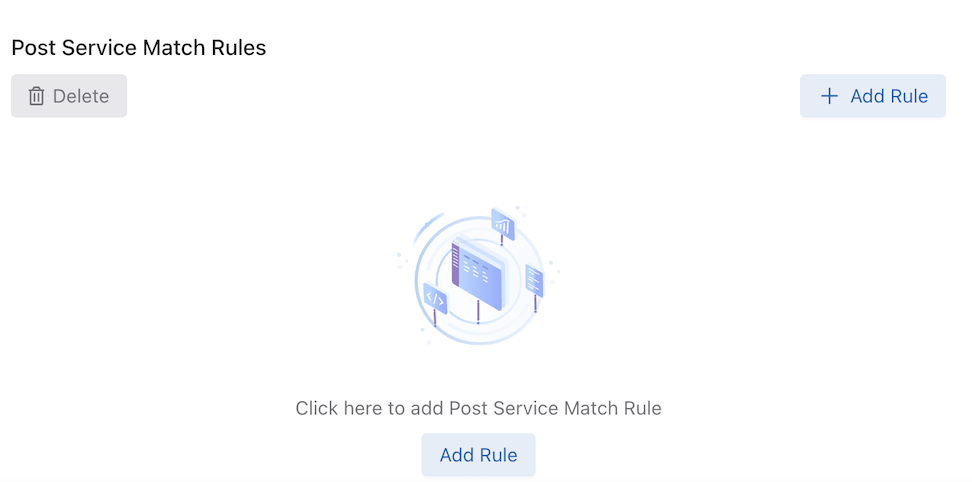
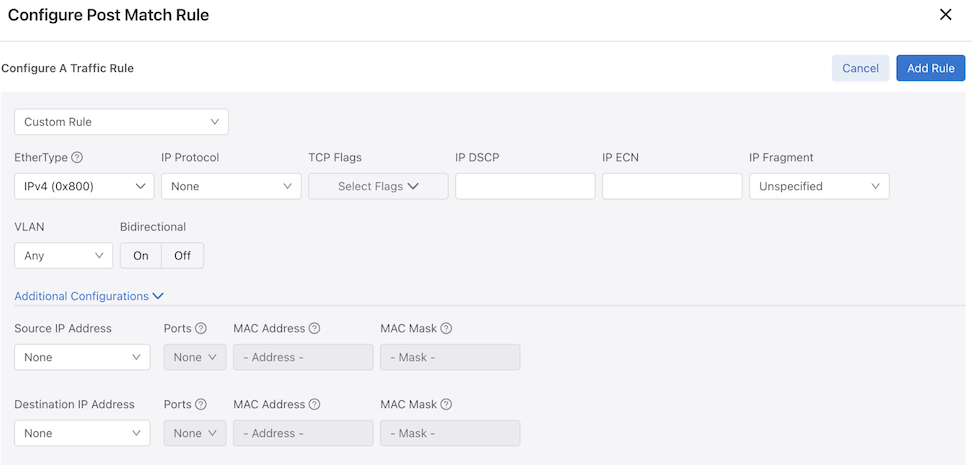
Configuring a Post Service Match Rule
Select Add Rule to open the Post Service Match Rule configuration dialog.
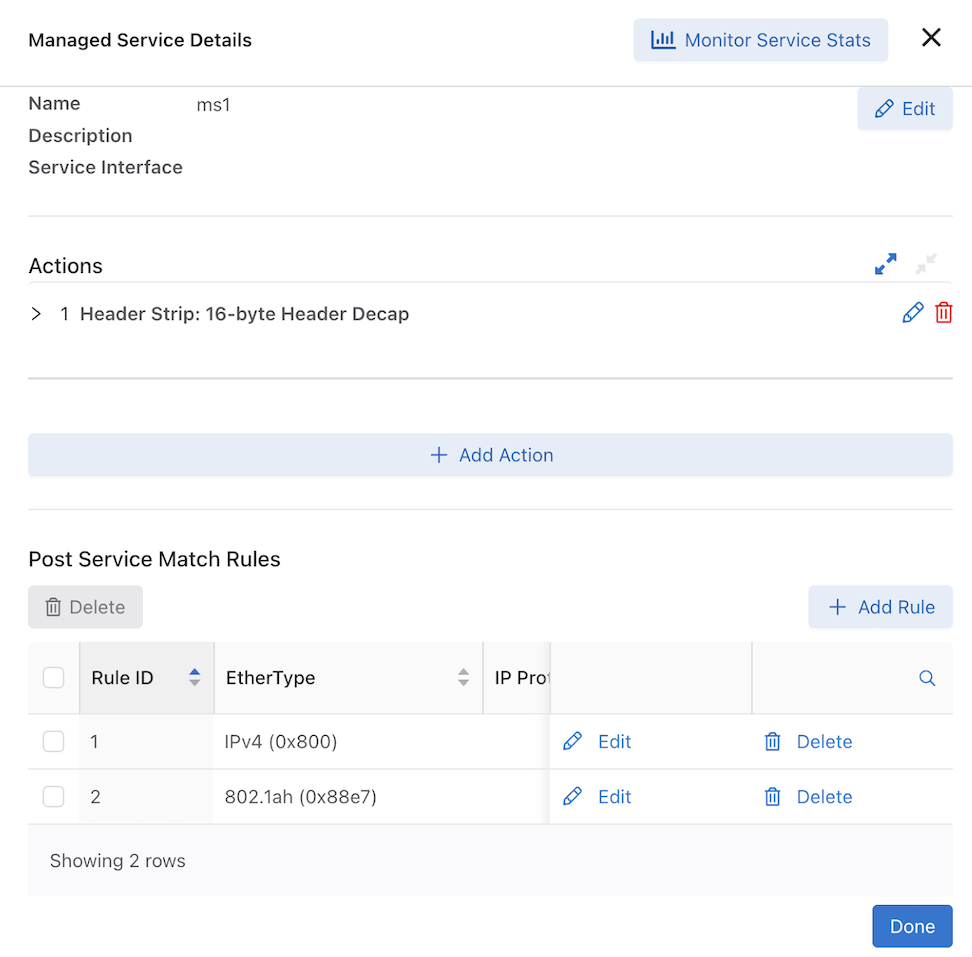
Rule Listing
After successfully configuring the Post Service Match Rule, the rule appears in the table within the Managed Services Details.

Edit
Select a Managed Service row and then Edit to modify its configuration. The window automatically populates with the selected Managed Service's data. After making the necessary changes, select Save.
Monitor Service Stats
Select one or more Managed Service rows and select Monitor Service Stats to view service statistics and performance metrics in the Service Stats tab. This is crucial for troubleshooting and performance monitoring.
Duplicate
Select a Managed Service row and select Duplicate to create a new Managed Service with the same configuration as the selected one. The new service can then be modified. This is useful for quickly creating similar Managed Service configurations.

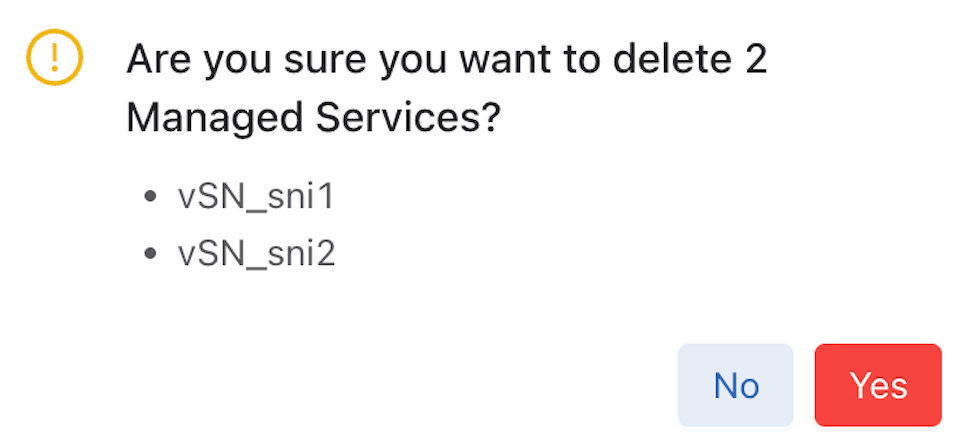
Delete
Select one or more Managed Service rows and select Delete to remove the selected Managed Service(s).
Export
Select Export to download the Managed Services data content in CSV or JSON format to the browser's download folder.
Refresh
By default, the system refreshes data every 60 seconds. Hover over Refresh to view the time remaining until the next update. When required, select Refresh to update the data immediately.
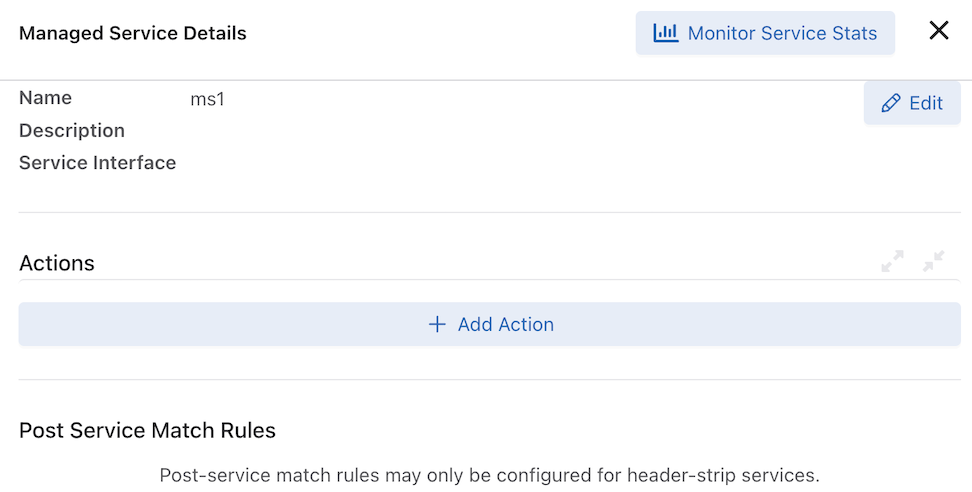
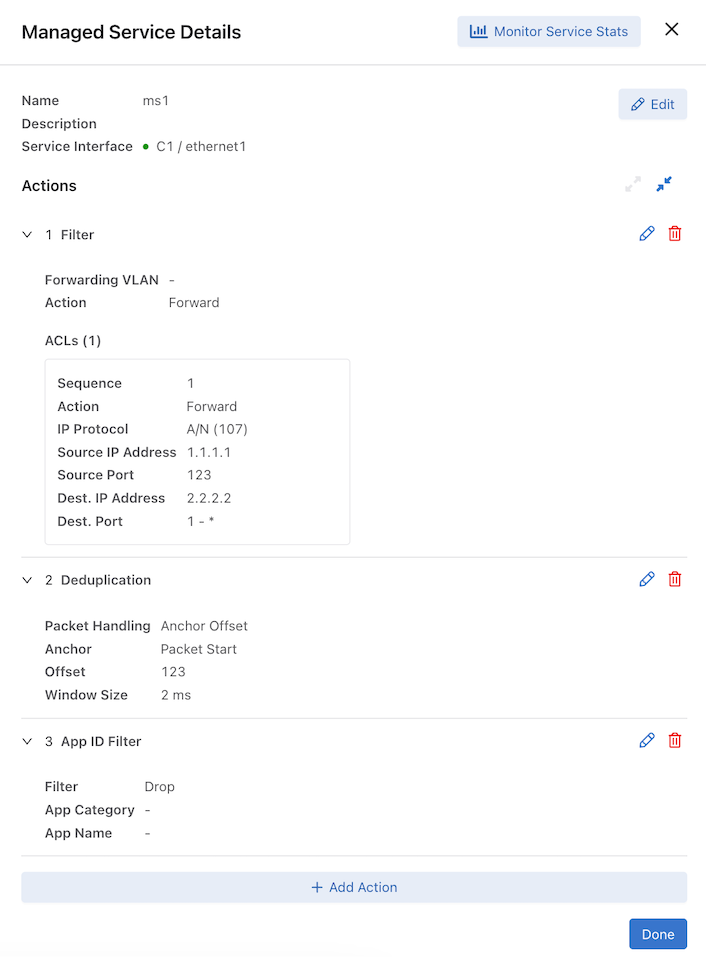
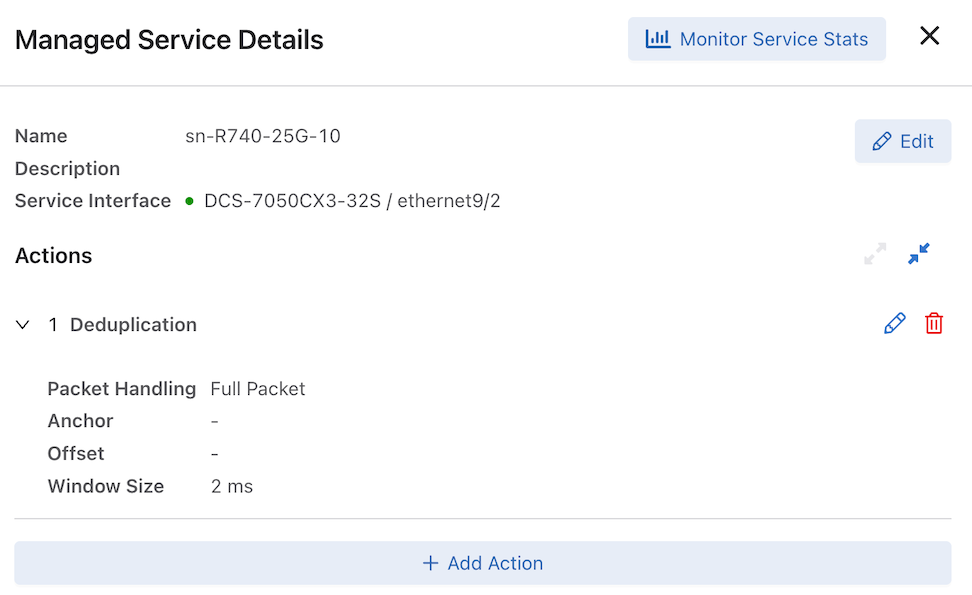
Managed Service Details
To view the details of a Managed Service, select the name of the desired service from the table. This opens the details drawer, which prominently displays the following key information:
- Managed Service Name
- Description
- Service Interface / Service Node Interface
Modifying Configuration
Select Edit to open the configuration window and modify the selected Managed Service settings.Monitoring Statistics
Select Monitor Service Stats to navigate directly to the statistics monitoring view for this specific Managed Service.Actions Section
This section allows users to manage the actions associated with the Managed Service. Capabilities include:
- Viewing action details
- Expanding or collapsing details
- Adding new actions
- Editing existing actions
- Deleting existing actions
Aggregate GRETAP
Select Aggregate GRETAP from the Action drop-down to open the configuration menu. Configure the following fields:
- Delivery Interface - select from a list of available interfaces.
- UDP Port - Default value of4739
- Collector IP - Configure an IP address as the Collector IP.
- MTU - Default value of 1500
- Idle Timeout - Default value of5000 ms
Aggregated sFlow
Select Aggregate sFlow from the Action drop-down to open the configuration menu. Configure the following fields:
- Delivery Interface
- UDP Port (Default: 4739)
- Collector IP
- MTU (Default: 1500)
- Idle Timeout (Default: 5000 ms)
App ID
Application Identification - Early Field Trial (EFT)
Select App ID from the Action drop-down to open the configuration menu. Configure the following fields:
- Delivery Interface
- UDP Port (Default: 4739)
- Collector IP
- MTU (Default: 1500)
App ID Filter
Application Identification Filter - Early Field Trial (EFT)
Select App ID Filter from the Action drop-down to open the configuration menu. Configure the following fields:
- Filter
- App Categories
- App Names
Configuring App ID and AP ID Filter
- Navigate to the page. Select the table action + icon to add a new managed service.
Figure 67. Managed Services - App ID 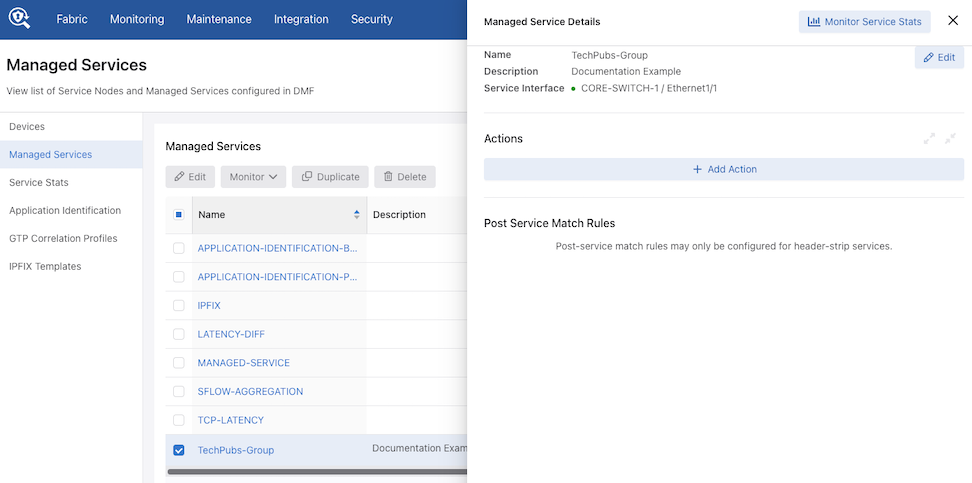
- Configure the Name, Switch, and Interface inputs in the Info step.
Figure 68. Info Step 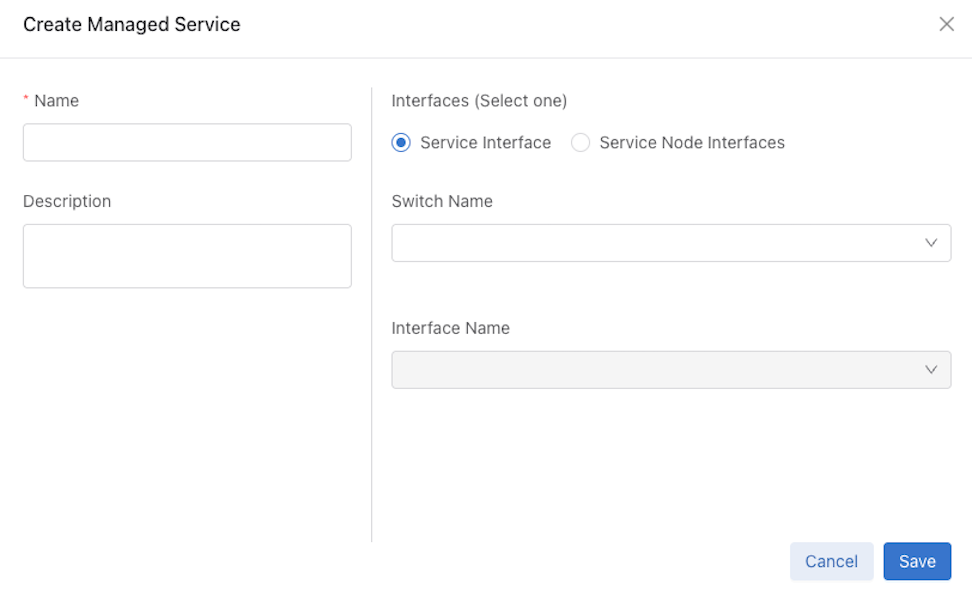
- In the Actions step, select the + icon to add a new managed service action.
Figure 69. Add App ID Action 
- To Add the App ID Action, select App ID from the action selection input:
Figure 70. Select App ID 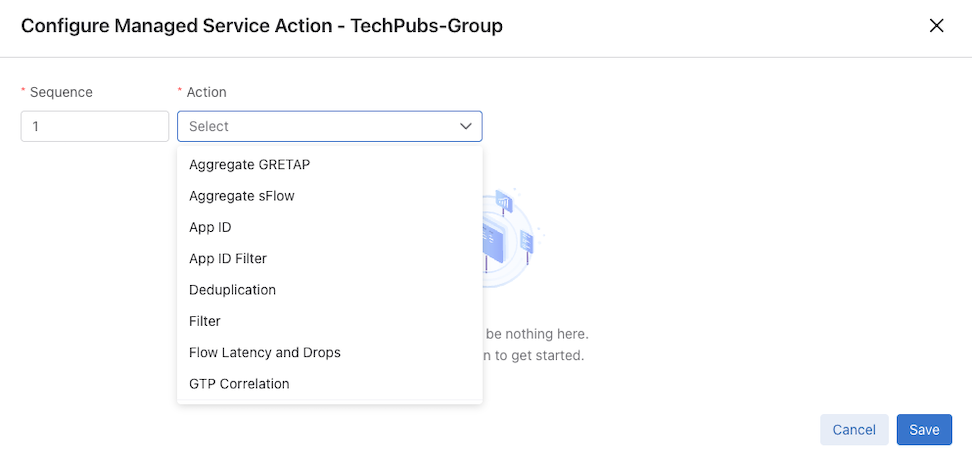
- Fill in the Delivery Interface, Collector IP, UDP Port, and MTU inputs and select Append to include the action in the managed service:
Figure 71. Delivery Interface 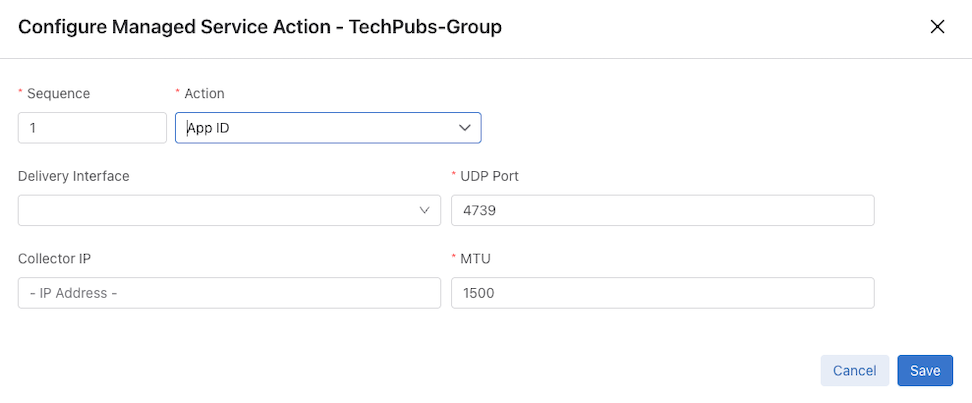
- To add the App ID Filter Action, select App ID Filter from the action selection input:
Figure 72. Select App ID Filter - Select the Filter input as Forward or Drop action:
Figure 73. Select Filter Input 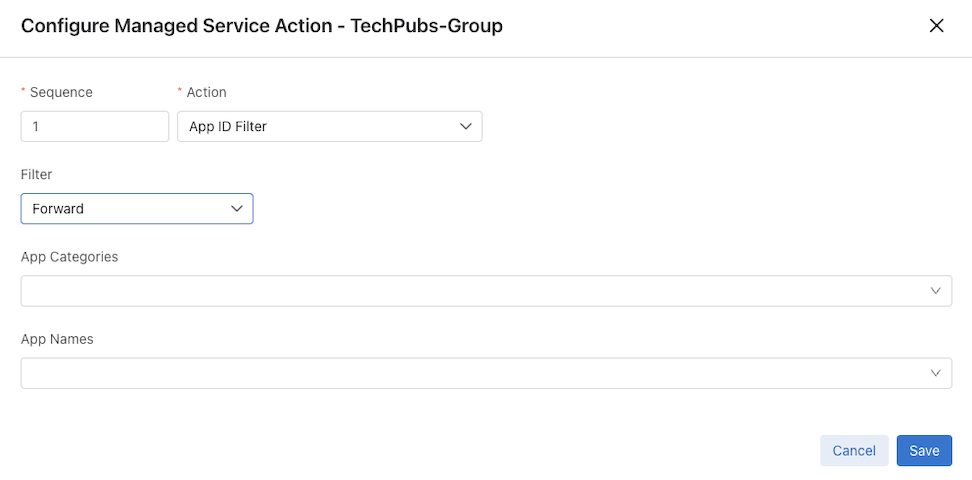
- Use the App Names section to add app names.
- Select a category from the App Categories list and select App Names from the list to include in the App ID Filter.
- Repeat the above step to add more app names as necessary.
Figure 74. Associate App Names 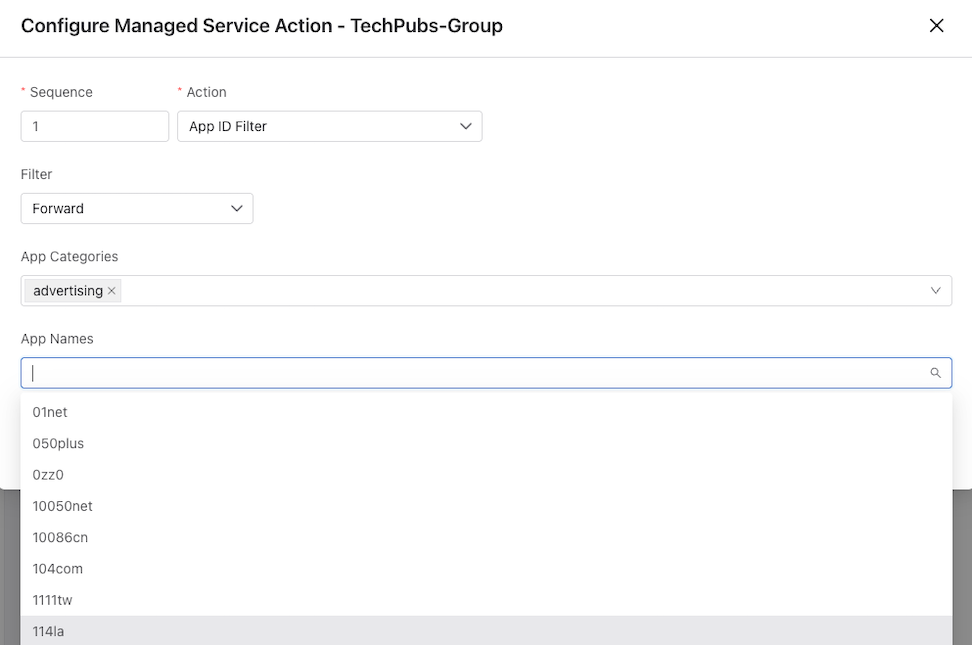
- The selected App Names and App Categories are now listed. Use the x icon to remove any app names, if necessary:
Figure 75. Application Names 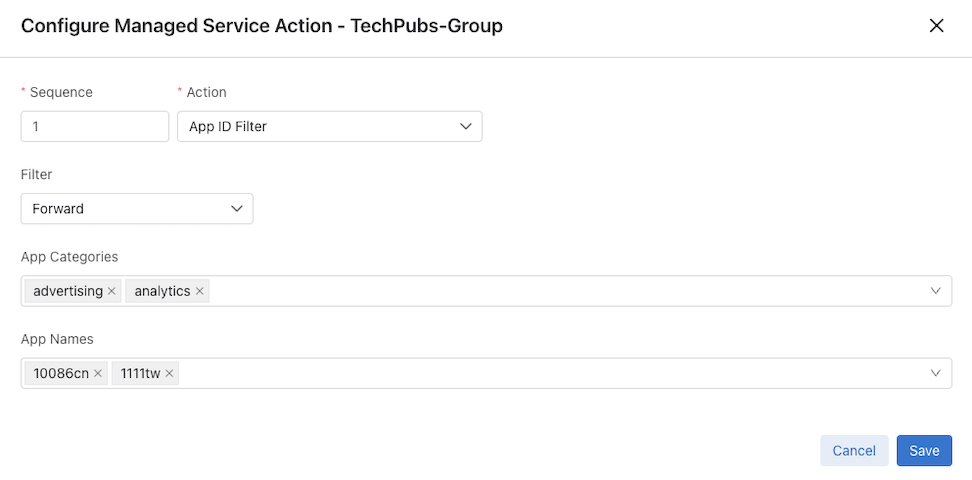
Deduplication
The DANZ Monitoring Fabric (DMF) Service Node enhances the efficiency of network monitoring tools by eliminating duplicate packets. Duplicate packets can be introduced into the out-of-band monitoring data stream by receiving the same flow from multiple TAP or SPAN ports spread across the production network. Deduplication eliminates these duplicate packets and enables more efficient use of passive monitoring tools.
- Full packet deduplication: deduplicates incoming packets that are identical at the L3/L4 layers.
-
Payload routed packet deduplication: Routed Deduplication with L4 Payload and Salt. This skips TCP/UDP headers in hashing, allowing duplicate detection based on identical payloads even if header fields like timestamps differ.
- Routed packet deduplication: as packets traverse an IP network, the MAC address changes from hop to hop. Routed packet deduplication enables users to match packet contents starting from the L3 header.
- L4 Payload Start: NATed packet deduplication: to perform NATed deduplication, the service node compares packets in the configured window that are identical starting from the L4 payload. To use NATed packet deduplication, perform the following fields as required:
- Anchor: Packet Start, L3 Header Start, L4 Header Start, or L4 Payload Start fields.
- Offset: the number of bytes from the anchor where the deduplication check begins.
- Window Size: The time window in which the service looks for duplicate packets is configurable. Select a value among these choices: 2ms (the default), 4ms, 6ms, and 8ms.
GUI Configuration
Choose the desired managed service from the Managed Service Dashboard and select + Add Action.
- Anchor Offset: Packet Start, L3 Header Start, L4 Header Start, or L4 Payload Start fields.
- Offset: Applies to Anchor Offset function and is the number of bytes from the anchor where the deduplication check begins.
- Full Packet: All bytes in packet.
- Header Routed Packet: Header routed frame.
- Payload Routed Packet: Payload routed frame.
- Window Size: Applies to all Packet Handling functions. The time window in which the service looks for duplicate packets is configurable. Select a value among these choices: 2ms (the default), 4ms, 6ms, and 8ms.
After completing the necessary configuration, select Save followed by Done in the Managed Service Details window.
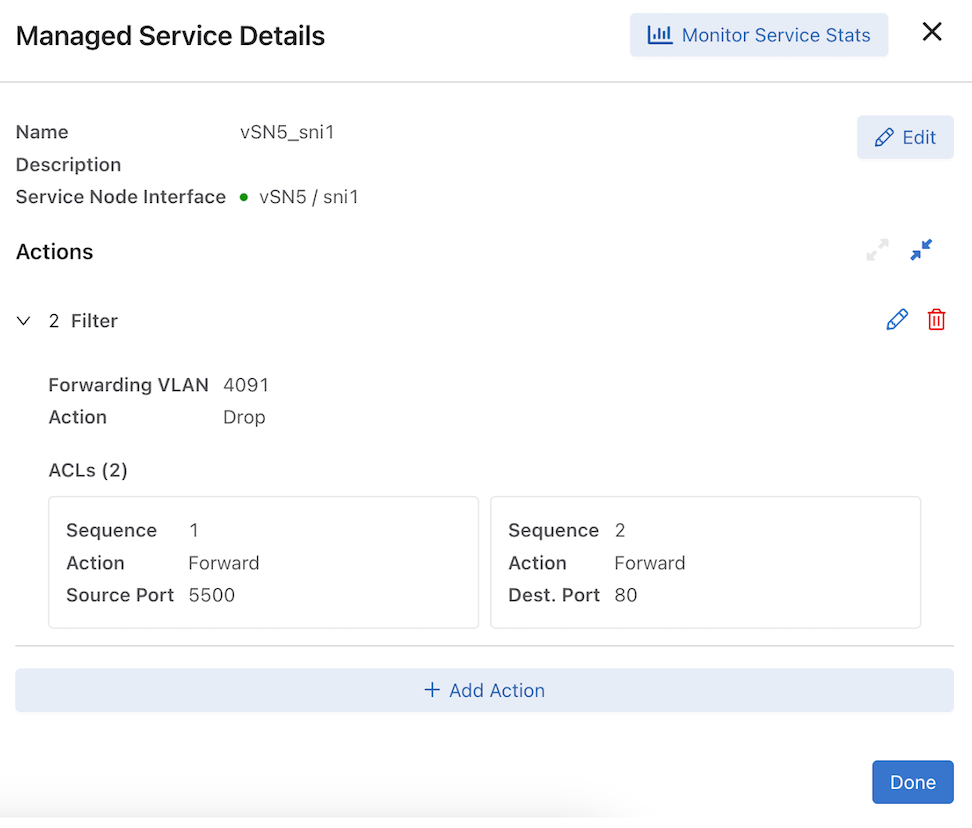
Filter Action
Select Filter from the Action drop-down to open the configuration menu. Configure a Default Action and optionally a Forwarding VLAN for forward actions.
- The default action applies to all ACL rules upon installation but can be overridden for individual rules.
- Select Add ACL to configure multiple ACL rules.
- Enter a Sequence number.
- Select an IP protocol from the IP Protocol list.
- Select an action, Drop or Forward, from the Action list.
- Enter a forwarding VLAN number in the Push VLAN field.
- Enter a source IP address in the Source IP Address field.
- Enter a source IP mask in the Source IP Mask field.
- Add a source port number ora range of source ports using the Source Port menu.
- Enter a destination IP address in the Dest. IP Address field.
- Enter a destination IP mask in the Dest. IP Mask field.
- Add a source port number ora range of source ports using the Dest. Port menu.
- Click Save to save the configuration on the switch.
Flow Latency and Drops
Latency and drop information help determine if there is a loss in a particular flow and where the loss occurred. A Service Node action configured as a DANZ Monitoring Fabric (DMF) managed service has multiple separate taps or spans in the production network and can measure the latency of a flow traversing through any pair of these points. It can also detect packet drops between any two points in the network if the packet only appears on one point within a specified time frame, currently set to 200ms.
Latency and drop analysis require Precision Time Protocol (PTP) time-stamped packets. The DMF PTP timestamping feature applies these timestamps as packets enter the monitoring fabric.
The Service Node accumulates latency values by flow and sends IPFIX data records with each flow's 5-tuple and ingress and egress identifiers. It sends IPFIX data records to the Analytics Node after collecting a specified number of values for a flow or when a timeout occurs for the flow entry. The threshold count is 10,000 packets, and the flow timeout is 4 seconds.
push-per-filter mode. Only basic statistics, such as min, max, and mean, are available. These statistics are the computed difference in timestamps, or latency, between two tap point pairs of packets within a flow.Use the DMF Analytics Node to build custom dashboards to view and check the data.
Select Flow Latency and Drops from the Action drop-down. The configuration menu is divided into the following tabs:
- Info
- Tap Point Pair
- Tap Point Multicast Groups
Info Tab
Select the Info tab to open the configuration menu. Configure the following fields:
- Delivery Interface
- Collector IP
- UDP Port
- MTU
- Delivery Requirement
- Report Types
Tap Point Pair Tab
Select the Tap Point Pair tab to view the configuration table. The table displays the following columns:
- Source Type
- Source Name
- Destination Type
- Destination Name
Add Entry: Select Add to open the configuration menu.
Source Type: The Source Type drop-down includes the following options:
- Filter Interface
- Policy Name
- Filter Interface Group
Name Selection: The Name drop-down options update dynamically based on the selected Source Type.
Tap Point Multicast Groups Tab
Select the Tap Point Multicast Groups tab to access the configuration.
- Use the multi-select drop-down to integrate Multicast groups with Flow Latency and Drops actions.
Configuring Flow Latency and Drops
Configure Flow Diff Latency and Drop Analysis using the DANZ Monitoring Fabric (DMF) GUI.
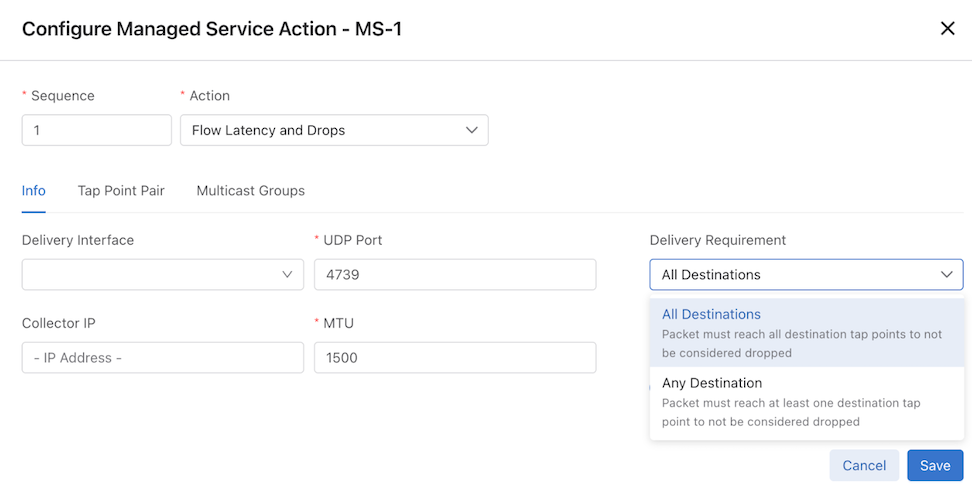
Delivery Requirement & Report TypesThe Flow Latency and Drops action within Managed Services includes two new configuration options:
Delivery Requirement
- All Destinations (default): The system drops packets unless every destination tap point receives the packet.
- Any Destination: The system drops packets only if no destination tap point receives the packet.
Report Types
- Latency Report: This toggle enables or disables latency reports (default: enabled).
- Drop Report: This toggle enables or disables drop reports (default: enabled).
Both the action configuration form and the action summary view display these fields.
Procedure Summary
To access the Flow Latency and Drops action, navigate to:
Configure Action
- Initiate Action: Select Add Action within the specific service configuration.
- Select Action Type: Choose Flow Latency and Drops from the Action drop-down menu.
Configure Delivery Requirements
- Select All Destinations (default) to ensure the system drops packets unless every destination tap point receives the packet.
- Select Any Destination to ensure the system drops packets only if no destination tap point receives the packet.
Enable Reporting
- Select Latency Report to enable or disable latency data collection.
- Select Drop Report to enable or disable drop data collection.
- Review the configured fields in both the action configuration form and the action summary view to ensure accuracy.
- Select Save to save the Flow Latency and Drops managed service.
The following sections detail the procedures for creating, managing, and applying multicast groups within the monitoring environment.
Navigation PathTo access the Multicast Groups management page, navigate to:
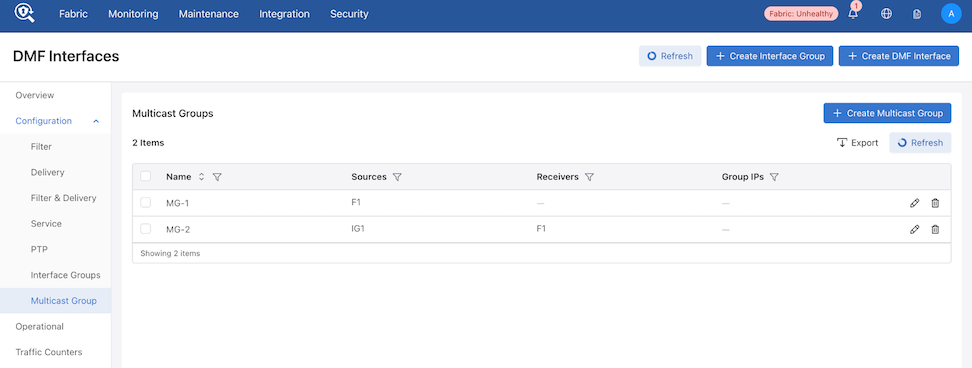
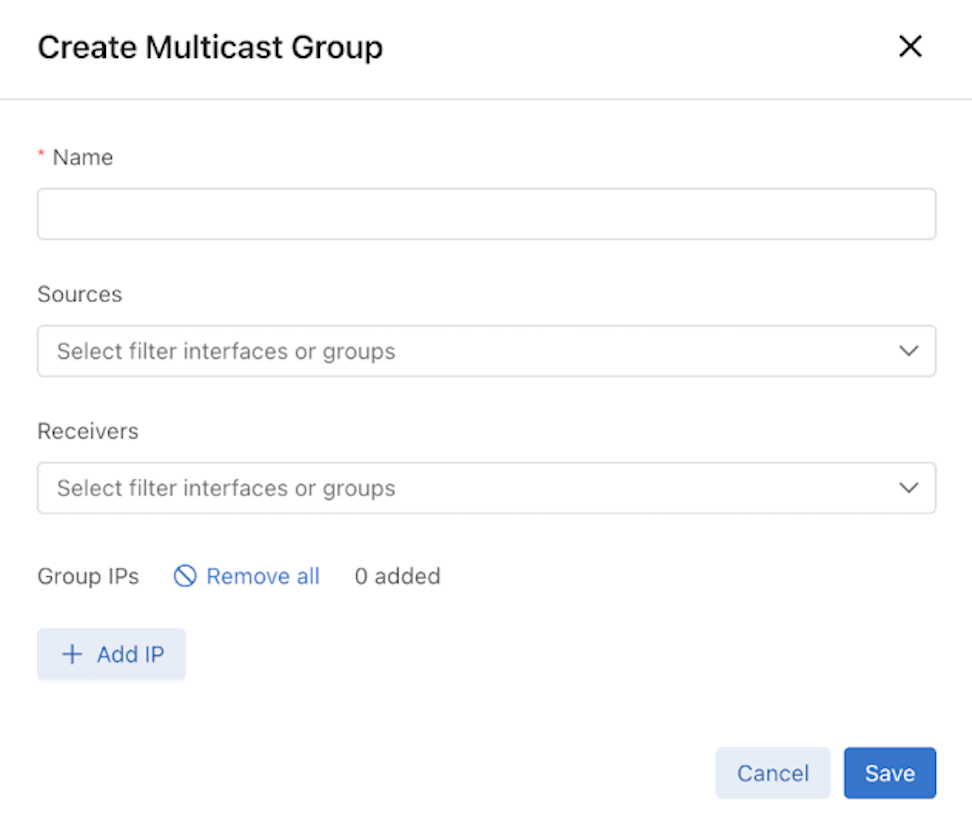
Creating a Multicast Group
Procedure
- Initiate Creation: Select Create Multicast Group.
- Configure Group Identifiers: Provide a unique name in the Name field.
- Assign Source Interfaces: Select one or more filter interfaces or filter interface groups in the Sources field.
- Assign Receiver Interfaces: Select one or more filter interfaces or filter interface groups in the Receivers field.
- Define Addresses: Add multicast IP addresses in the Group IPs field (optional).
- Save Configuration: Select Save to finalize the group.
Create Multicast Group
| Action | Description |
|---|---|
| Edit | Select the pencil icon to modify group settings. The name remains fixed and cannot be changed. |
| Delete | Select the trash icon to remove a single group. To remove multiple groups simultaneously, select the corresponding rows and select the Delete button. |
| Export | Utilize the Export drop-down menu to extract table data. |
Integrate multicast groups into Flow Latency and Drops actions for specific service monitoring.
Procedure
Navigate to:
Configuration
- Select Save to finalize the Tap Point Multicast Group.
Figure 88. Tap Point Multicast Group 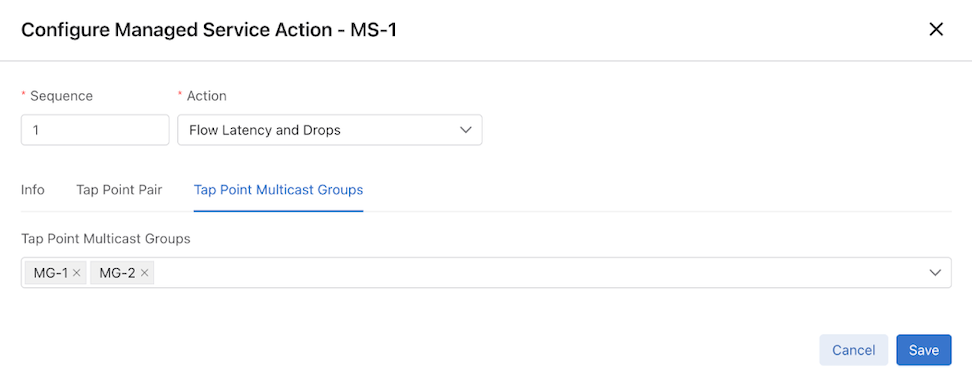
GTP Correlation
Select GTP Correlation from the Action drop-down to open the configuration menu. Configure the following fields:
- Idle Timeout
- Sampling Rate
- Correlation Profile
- APN Group
- Rewrite Option
- Drop Control
Correlation Profile Selection
Select one of the following options for the Correlation Profile. The menu updates dynamically to display the corresponding drop-down field:
- IMSI Group
- IMEI Group
- MSISDN Group
See GTP Correlation Profiles for more information about configuring profiles.
Header Strip
Select Header Strip from the Action drop-down to open the configuration menu. Configure the Anchor, Offset, and L2 Header options.
L2 Header Options
Choose one of the following configurations for the L2 Header:
- Option 1: Use Existing L2 Header
- Assumes an existing L2 header is present.
- Retains the existing Source MAC, Destination MAC, and EtherType without modification.
- Option 2: Inherit from Stripped L2 Header
- Inherits Source MAC and Destination MAC from the stripped L2 header.
- Select one of the following EtherType options:
- Use original EtherType
- Insert Inet EtherType
- Use custom EtherType
- Option 3: Add Custom L2 Header
- Adds a completely custom L2 header.
- Select one of the following EtherType options:
- Insert Inet EtherType
- Add custom EtherType
Header Strip Actions
Decapsulation Actions
The Action drop-down includes the following specific header decapsulation types:
- 16-Byte Header Decap
- ERSPAN Header Decap
- Geneve Header Decap
- L3 MPLS Header Decap
- LISP Header Decap
- VNTag Header Decap
- VXLAN Header Decap
Select any of these options to open the corresponding configuration menu. Use the menu to configure the Drop Decap setting.
This action removes specific headers from the traffic selected by the associated DANZ Monitoring Fabric (DMF) policy. Alternatively, define custom header stripping based on the starting position of the Layer-3 header, the Layer-4 header, the Layer-4 payload, or the first byte in the packet.
- decap-erspan: remove the Encapsulated Remote Switch Port Analyzer (ERSPAN) header.
- decap-cisco-fabric-path: remove the Cisco FabricPath protocol header.
- decap-l3-mpls: remove the Layer-3 Multi-protocol Label Switching (MPLS) header.
- decap-lisp: remove the LISP header.
- decap-vxlan [udp-port vxlan port]: remove the Virtual Extensible LAN (VXLAN) header.
- decap-geneve: remove the Geneve header.
- l3-header-start
- l4-header-start
- l4-payload-start
- packet-start
Input a positive integer representing the offset from which the strip action begins. When omitting an offset, the header stripping starts from the first byte in the packet.
GUI Configuration
Under the Action drop-down, select the desired Header Strip action.
After assigning the required actions to the header stripping service, select Next or Post-Service Match.
The system displays the Post Service Match page, used in conjunction with the header strip service action.
IPFIX
Select IPFIX from the Action drop-down to open the configuration menu. Configure the following fields:
- Delivery Interface
- UDP Port
- Collector IP
- MTU
- Inactive Timeout
- Active Timeout
- Template Timeout
- IPFIX Template
IPFIX and Netflow Actions
IP Flow Information Export (IP FIX), also known as NetFlow v10, is an IETF standard defined in RFC 7011. The IPFIX generator (agent) gathers and transmits information about flows, sets of packets that contain all the keys specified by the IPFIX template. The generator observes the packets received in each flow and forwards the information to the IPFIX collector (server) in the form as a flowset.
Starting with the DANZ Monitoring Fabric (DMF)-7.1.0 release, NetFlow v9 (Cisco proprietary) and IPFIX/NetFlow v10 are both supported. Configuration of the IPFIX managed service is similar to configuration for earlier versions of NetFlow except for the UDP port definition. NetFlow v5 collectors typically listen over UDP port 2055, while IFPIX collectors listen over UDP port 4739.
NetFlow records are typically exported using User Datagram Protocol (UDP) and collected using a flow collector. For a NetFlow service, the service node takes incoming traffic and generates NetFlow records. The service node drops the original packets, and the generated flow records, containing metadata about each flow, are forwarded out of the service node interface.
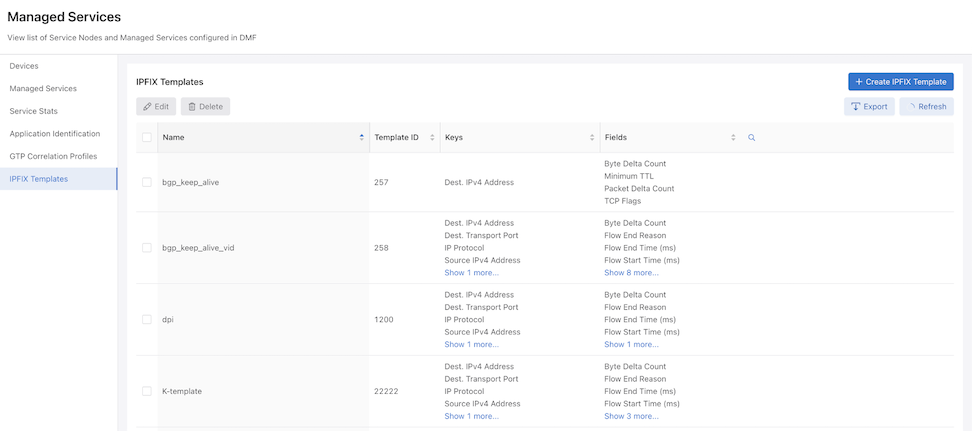
IPFIX Templates
The IPFIX Templates dashboard provides a table view of all configured templates. The table includes the following columns:
- Name
- Template ID
- Keys
- Fields
The IPFIX template consists of the key element IDs representing IP flow, field element IDs representing actions the exporter has to perform over IP flows matching key element IDs, the template ID number for uniqueness, collector information, and eviction timers.
To define a template, configure keys of interest representing the IP flow and fields that identify the values measured by the exporter, the exporter information, and the eviction timers. To define the template, select the option from the DANZ Monitoring Fabric (DMF) GUI or enter the ipfix-template template-name command in config mode, replacing template-name with a unique identifier for the template instance.
IPFIX Keys
Use an IPFIX key to specify the characteristics of the traffic to monitor, such as source and destination MAC or IP address, VLAN ID, Layer-4 port number, and QoS marking. The generator includes flows in a flow set having all the attributes specified by the keys in the template applied. The flowset is updated only for packets that have all the specified attributes. If a single key is missing, the packet is ignored.
To see a listing of the keys supported in the current release of the DANZ Monitoring Fabric (DMF) Service Node, select the option from the DMF GUI or type help key in config-ipxif-template submode.
| destination-ipv4-address | ip-version |
|---|---|
| destination-ipv6-address | policy-vlan-id |
| destination-mac-address | records-per-dmf-interface |
| destination-transport-port | source-ipv4-address |
| dot1q-priority | source-ipv6-address |
| dot1q-vlan-id | source-mac-address |
| ethernet-type | source-transport-port |
| icmp-type-code-ipv4 | tcp-source-port (introduced in DMF 8.8) |
| icmp-type-code-ipv6 | tcp-destination-port (introduced in DMF 8.8) |
| ip-class-of-service | udp-source-port (introduced in DMF 8.8) |
| ip-diff-serv-code-point | udp-destination-port (introduced DMF 8.8) |
| ip-protocol-identifier | vlan id |
| ip-ttl |
- The Controller will not allow the key combination of source-mac-address and records-per-dmf-interface in push-per-policy mode.
- The Controller will not allow the key combinations of policy-vlan-id and records-per-dmf-interface in push-per-filter mode.
IPFIX Fields
A field defines each value updated for the packets the generator receives that match the specified keys. For example, include fields in the template to record the number of packets, the largest and smallest packet sizes, or the start and end times of the flows.
To see a listing of the fields supported in the current release of the DANZ Monitoring Fabric (DMF) Service Node, select the option from the DMF GUI, or type help in config-ipxif-template submode. The following are the fields supported:
- flow-end-milliseconds
- flow-end-reason
- flow-end-seconds
- flow-start-milliseconds
- flow-start-seconds
- maximum-ip-total-length
- maximum-layer2-total-length
- maximum-ttl
- minimum-ip-total-length
- minimum-layer2-total-length
- minimum-ttl
- octet-delta-count
- packet-delta-count
- tcp-control-bits
Active and Inactive Timers
After the number of minutes specified by the active timer, the flow set is closed and forwarded to the IPFIX collector. The default active timer is one minute. During the number of seconds set by the inactive timer, if no packets that match the flow definition are received, the flow set is closed and forwarded without waiting for the active timer to expire. The default value for the inactive time is 15 seconds.
Example Flowset
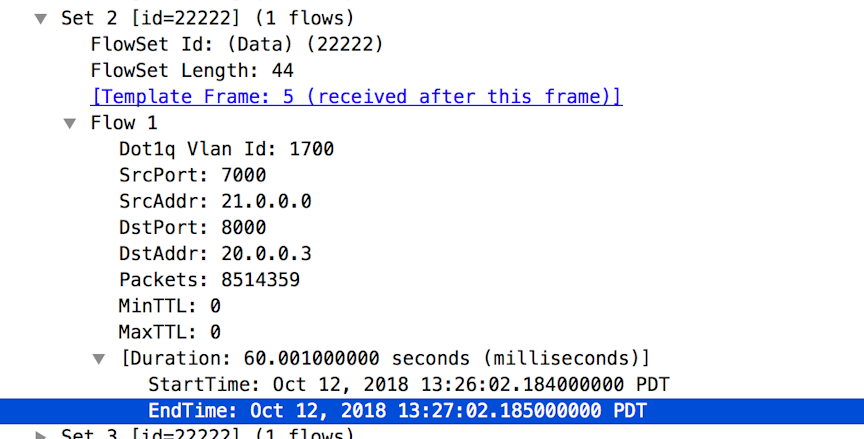
The following is a running-config that shows the IPFIX template used to generate this flowset.
Example IPFIX Template
! ipfix-template
ipfix-template Perf-temp
template-id 22222
key destination-ipv4-address
key destination-transport-port
key dot1q-vlan-id
key source-ipv4-address
key source-transport-port
field flow-end-milliseconds
field flow-end-reason
field flow-start-milliseconds
field maximum-ttl
field minimum-ttl
field packet-delta-count
Define an IPFIX Template
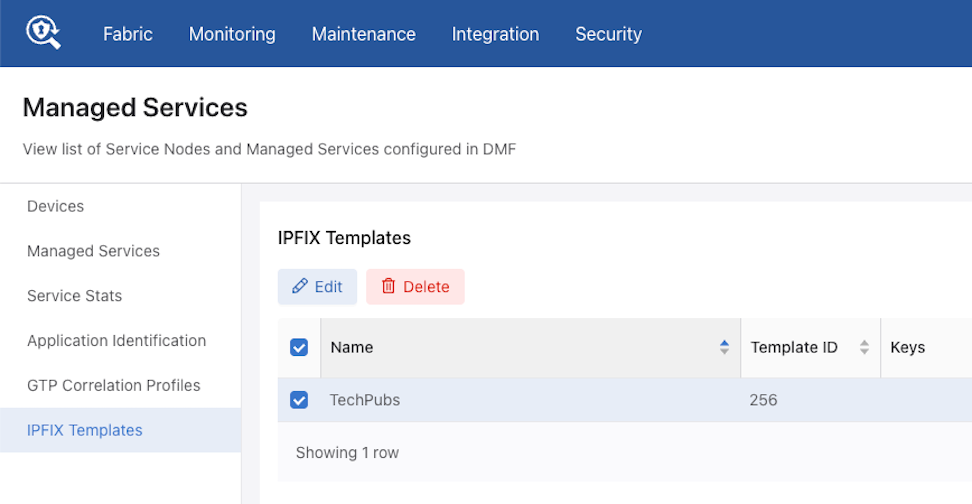
- On the DMF Managed Services page, select IPFIX Templates.
The system displays the IPFIX Templates section.
Figure 96. IPFIX Templates 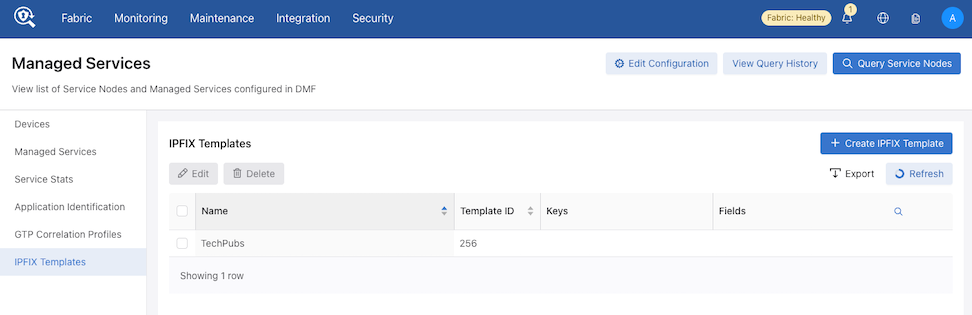
- To create a new template, select the provision (+) icon in the IPFIX Templates section.
Figure 97. Create IPFIX Template 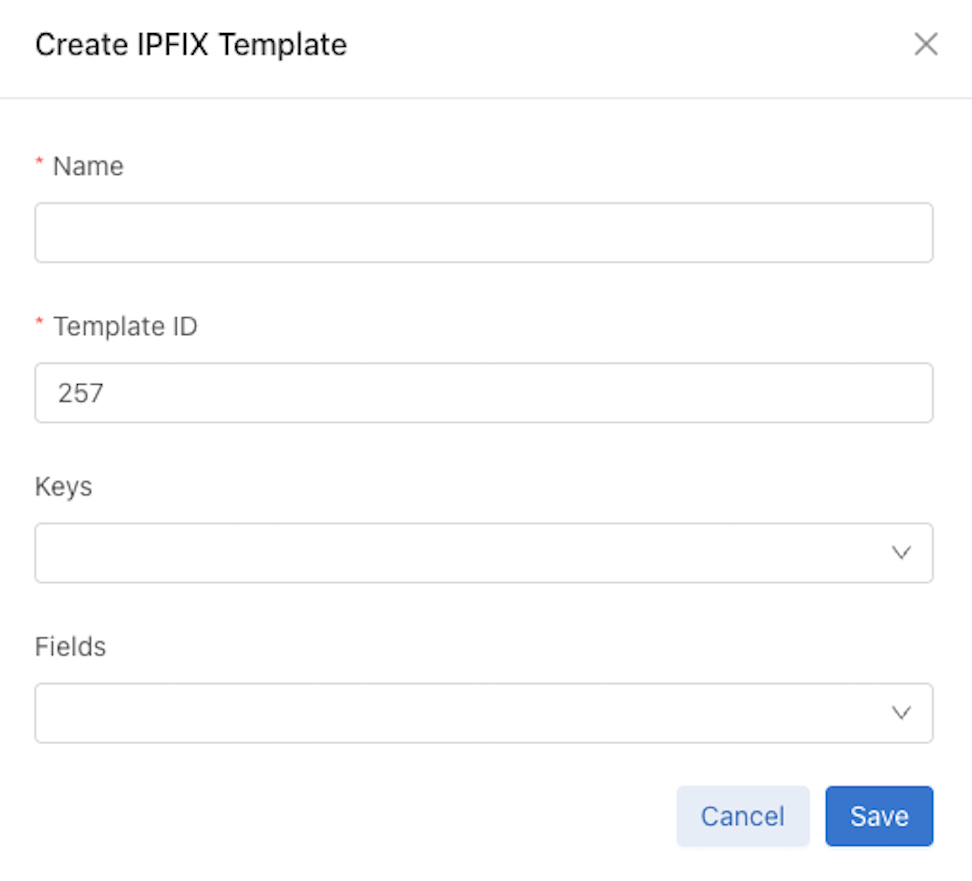
- To add an IPFIX key to the template, select Keys. The system displays the following dialog.
Figure 98. Select IPFIX Keys 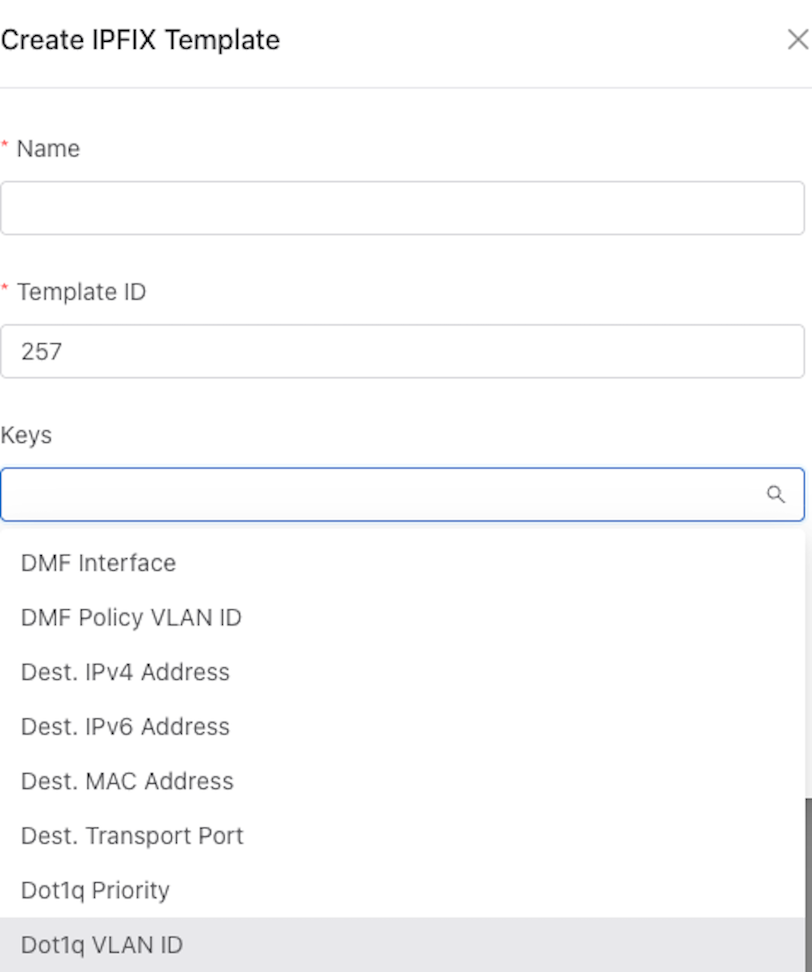
- To add an IPFIX field to the template, select the Settings control in the Fields section. The system displays the following dialog:
Figure 99. Select IPFIX Fields 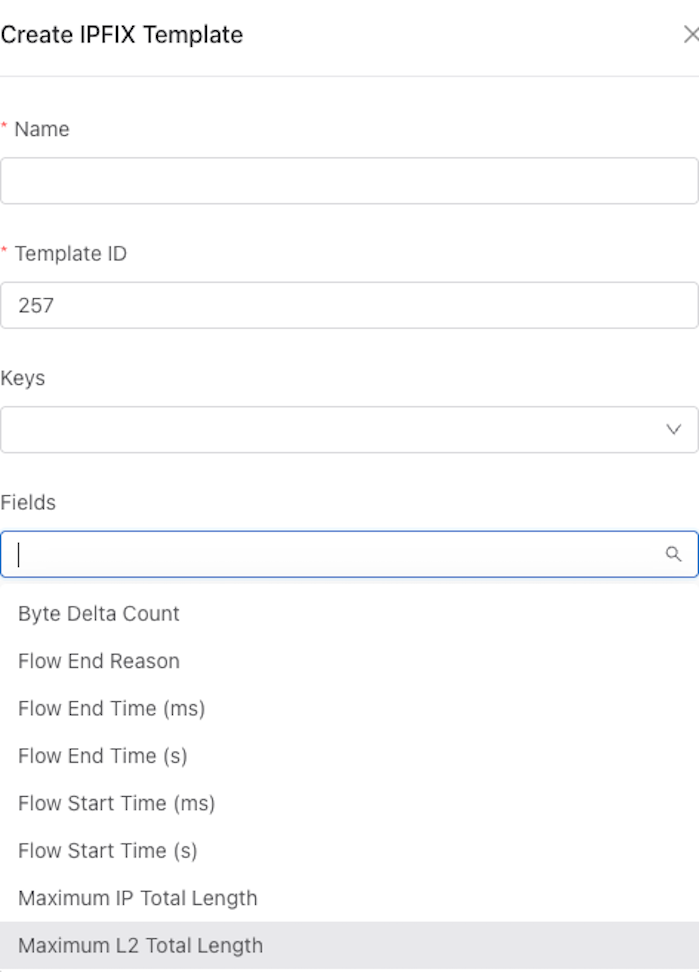
Define an IPFIX Service Action
Select IPFIX from the Action selection list on the page.
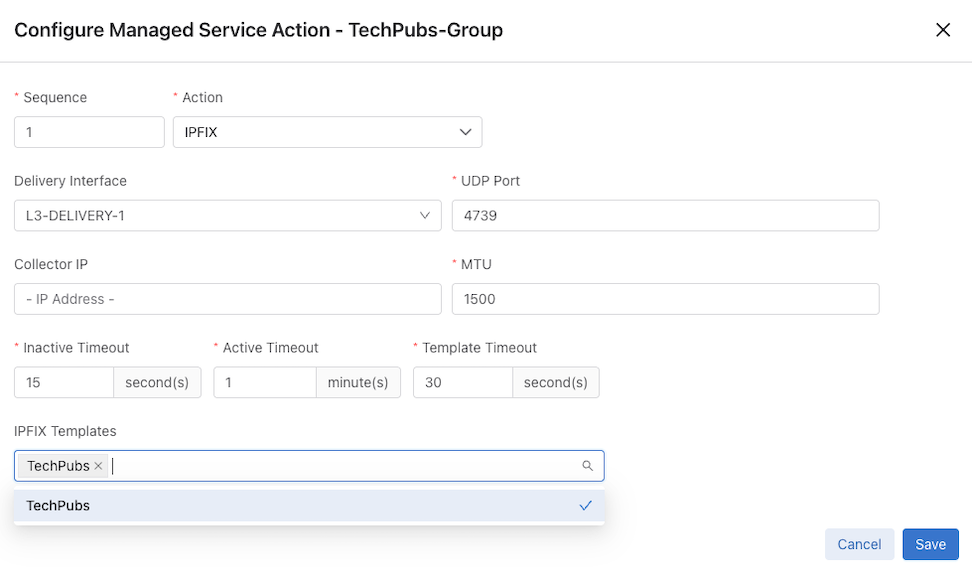
- Assign a delivery interface.
- Configure the collector IP address.
- Identify the IPFIX template.
- Inactive timeout - the interval of inactivity that marks a flow inactive.
- Active timeout - length of time between each IPFIX flows for a specific flow.
- Source IP - source address to use for the IPFIX flowsets.
- UDP port - UDP port to use for sending IPFIX flowsets.
- MTU - MTU to use for sending IPFIX flowsets.
After completing the configuration, select Next, and then select Save.
Mask
The Masking action can hide specific characters in a packet, such as a password or credit card number, based on offsets from different anchors and by matching characters using regular (regex) expressions. The Mask Service Action applies the specified mask to the matched packet region.
Select Mask from the Action drop-down to open the configuration menu. Configure the following fields:
- Match Pattern
- Anchor
- Offset
- Match Characters
Match Characters Configuration
Enable Match Characters to display and configure the following additional fields:
- Mask Start
- Mask End
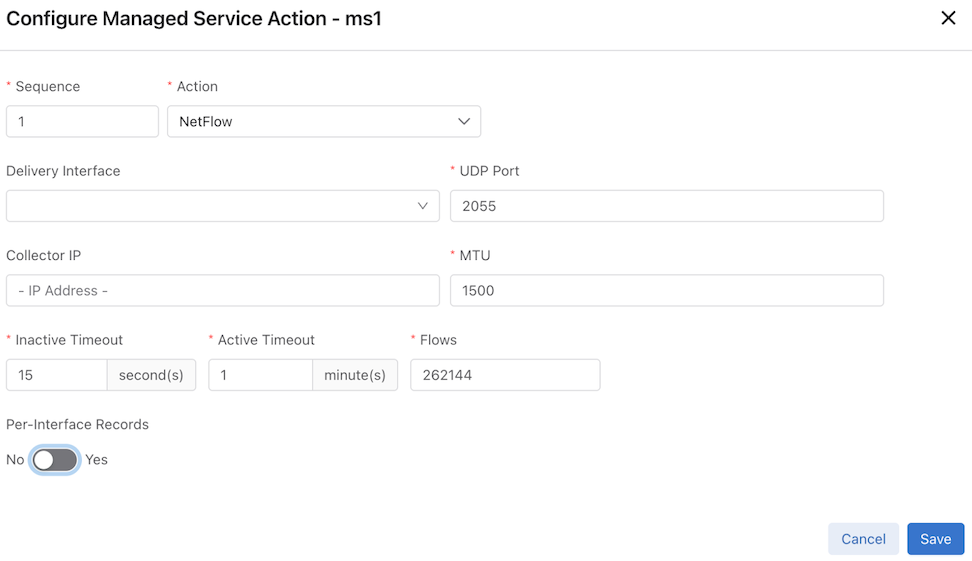
NetFlow
Select NetFlow from the Action drop-down to open the configuration menu. Configure the following fields:
- Delivery Interface
- UDP Port
- Collector IP
- MTU
- Inactive Timeout
- Active Timeout
- Flows
- Per-Interface Records
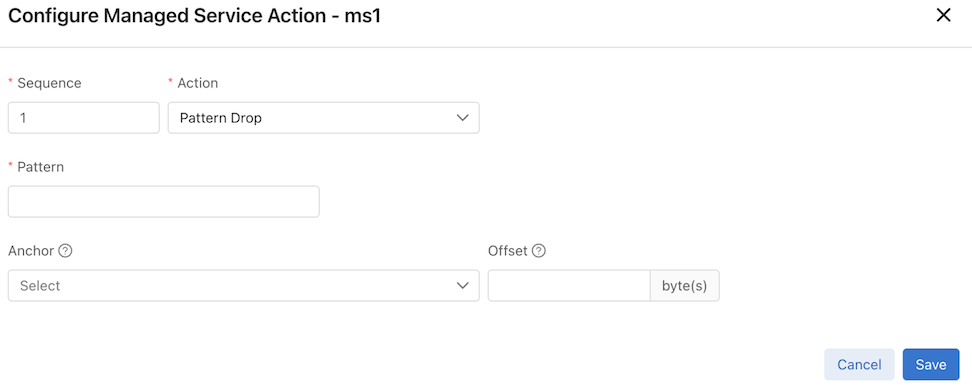
Pattern Drop
Select Pattern Drop from the Action drop-down to open the configuration menu. Configure the following fields:
- Pattern
- Anchor
- Offset
The Pattern Drop Service Action drops matching traffic.
- URLs and user agents in the HTTP header
- Patterns in BitTorrent packets
- Encapsulation headers for specific parameters, including GTP, VXLAN, and VN-Tag
- Subscriber device IP (user-endpoint IP)
Pattern matching allows Session-aware Adaptive Packet Filtering (SAPF) to identify HTTPS transactions on non-standard SSL ports. It can filter custom applications and separate control traffic from user data traffic.
Pattern matching is also helpful in enforcing IT policies, such as identifying hosts using unsupported operating systems or dropping unsupported traffic. For example, the Windows OS version can be identified and filtered based on the user-agent field in the HTTP header. The user-agent field may appear at variable offsets, so a regular expression search is used to identify the specified value wherever it occurs in the packet.
GUI Configuration
Pattern Match
Select Pattern Match from the Action drop-down to open the configuration menu. Configure the following fields:
- Pattern
- Anchor
- Offset
The pattern-match service action matches and forwards matching traffic and is similar to the pattern-drop service action.
- URLs and user agents in the HTTP header
- patterns in BitTorrent packets
- encapsulation headers for specific parameters including, GTP, VXLAN, and VN-Tag
- subscriber device IP (user-endpoint IP)
- Pattern matching allows Session Aware Adaptive Packet Filtering and can identify HTTPS transactions on non-standard SSL ports. It can filter custom applications and can separate control traffic from user data traffic.
Pattern matching allows Session-aware Adaptive Packet Filtering (SAPF) to identify HTTPS transactions on non-standard SSL ports. It can filter custom applications and separate control traffic from user data traffic.
Pattern matching is also helpful in enforcing IT policies, such as identifying hosts using unsupported operating systems or dropping unsupported traffic. For example, the Windows OS version can be identified and filtered based on the user-agent field in the HTTP header. The user-agent field may appear at variable offsets, so a regular expression search is used to identify the specified value wherever it occurs in the packet.
GUI Configuration
Packet Recording
This release adds a new managed service action, called Record, to the Service Node (SN). This action enables packet recording using an SN similar to a Recorder Node (RN) and supports basic packet recording and querying capabilities.
The SN accumulates packets, writes packet data to local storage disks, and indexes information based on configured fields. Various query types retrieve recorded packets, analyze traffic patterns, and investigate network issues.
The Controller includes the managed service action record to enable packet recording on an SN.
- Capture and store packets to local disks.
- Index configurable packet fields.
- Query recorded packets.
- Perform traffic analysis queries (HTTP, TCP flow health, conversations).
- Monitor storage and query health.
Platform Compatibility
The DCA-DM-SNR660 SKU exclusively supports the record action, as this hardware includes the dedicated storage disks required for packet capture. Consequently, this feature is available on switchless physical units but remains unsupported on virtual SNs.
| Deployment Type | Support Status - Record Feature |
|---|---|
| Physical SN (Switchless) | Supported |
| Virtual SN | Not Supported |
Select Record from the Action drop-down to open the configuration menu.
Configuring Packet Recording
Configure Recording Settings
The DMF GUI provides an interface to configure recording settings on SNs. Customize indexing fields when adding or editing an SN through the Managed Services dashboard.
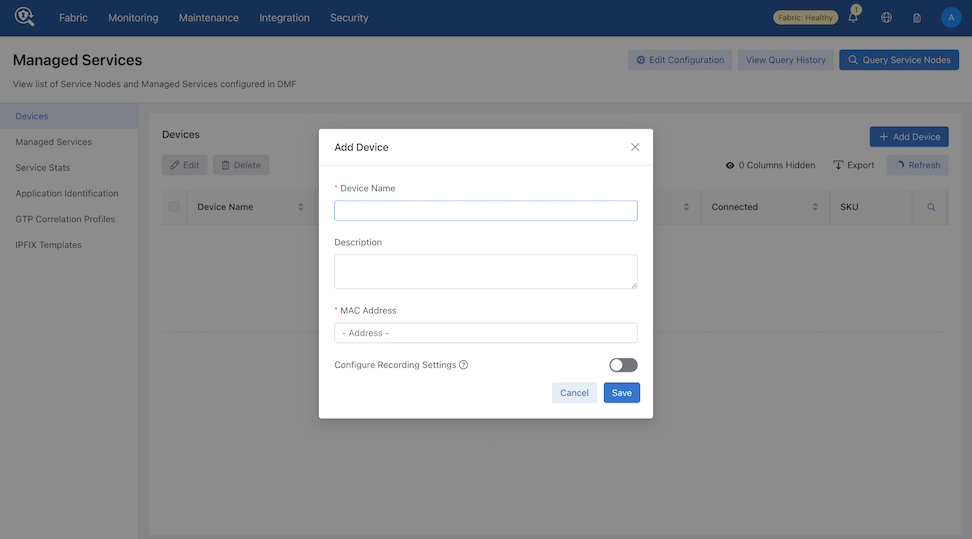
Add Device with Recording Settings
- Navigate to .
- Select Add Device to open the configuration panel.
- Fill in the required fields:
- Device Name
-
Description (optional)
- MAC Address
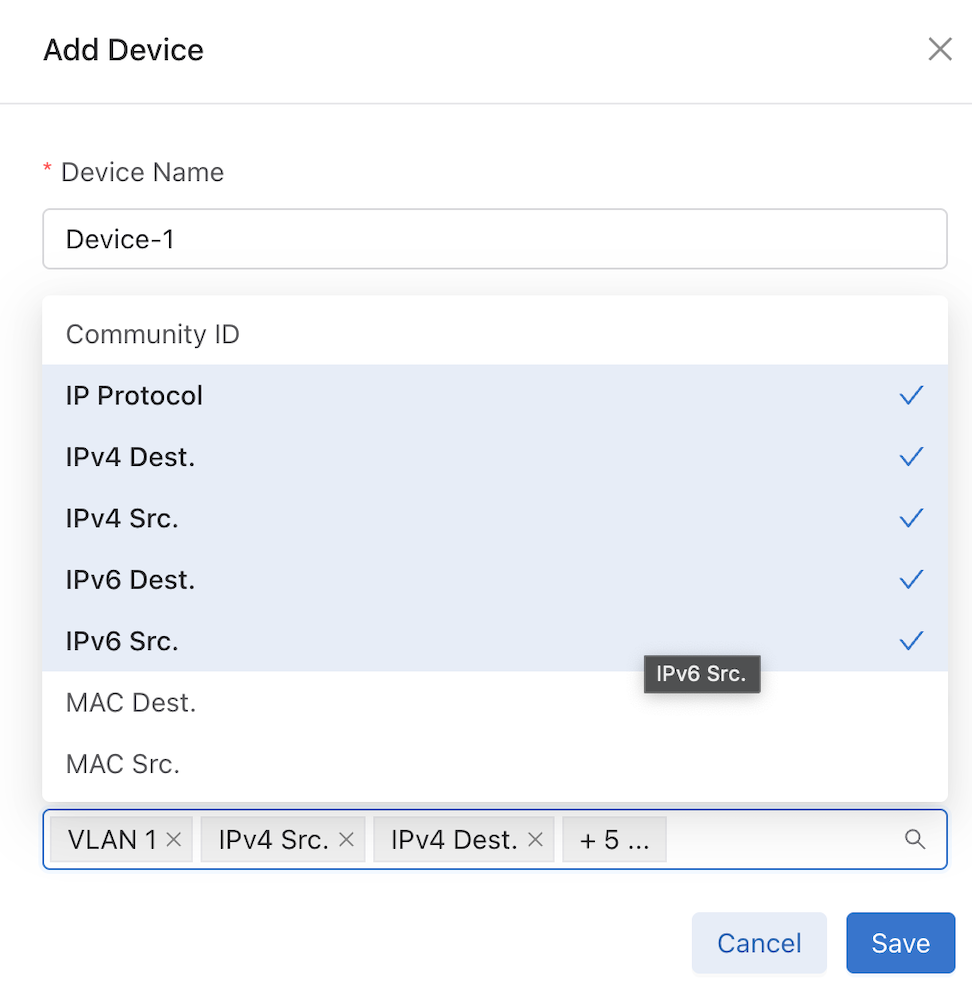
- Set Configure Recording Settings to On to define indexing for recorded packets (default: off).
- Select the desired Indexing fields from the drop-down menu.
- Commit the changes using Save.
- By default, the system pre-selects the following indexing fields: VLAN 1, IPv4 Src., IPv4 Dest., IPv6 Src., IPv6 Dest., IP Protocol, Port Src., and Port Dest.
- The Configure Recording Settings selection controls only the indexing configuration for packet recording; it does not enable or disable the recording action itself.
Edit Recording Settings
To modify recording settings on an existing SN:
- Navigate to .
- Highlight the device from the table and choose the Edit action.
- Enable Configure Recording Settings to enter the configuration mode.
- Modify the indexing fields as needed.
- Commit the changes using Save.
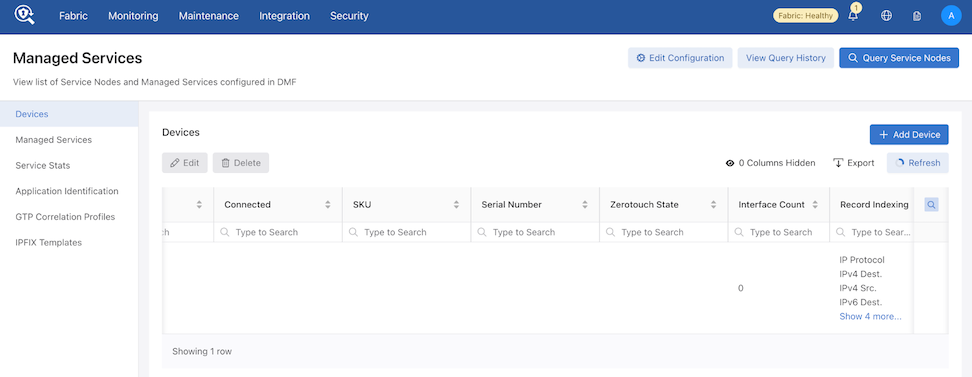
View Record Indexing
The Record Indexing column in the Devices table displays the enabled indexing fields for each device. Search and filter devices based on their specific indexing configuration.
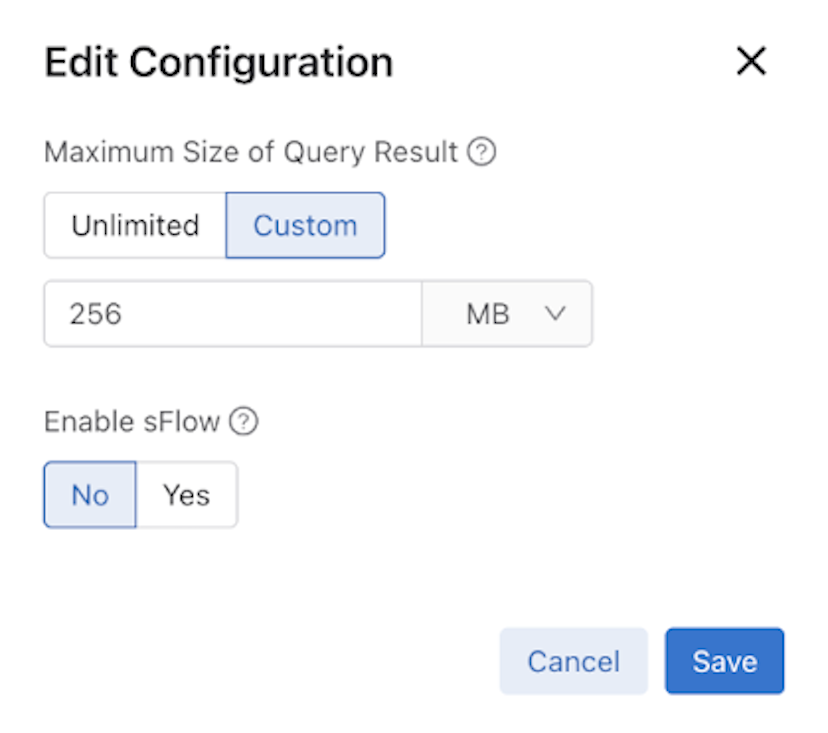
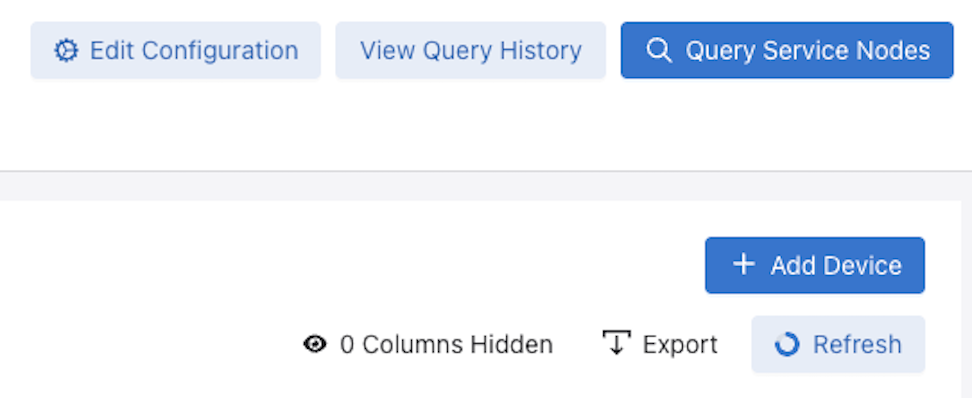
Edit Configuration (Recording)
Access global recording configuration settings from the Managed Services dashboard () via Edit Configuration. These settings apply to both Recorder Nodes and SNs.

View Query History
Select View Query History on the Managed Services dashboard () to navigate to the Query History dashboard. This area displays query records for both Recorder Nodes and SNs.

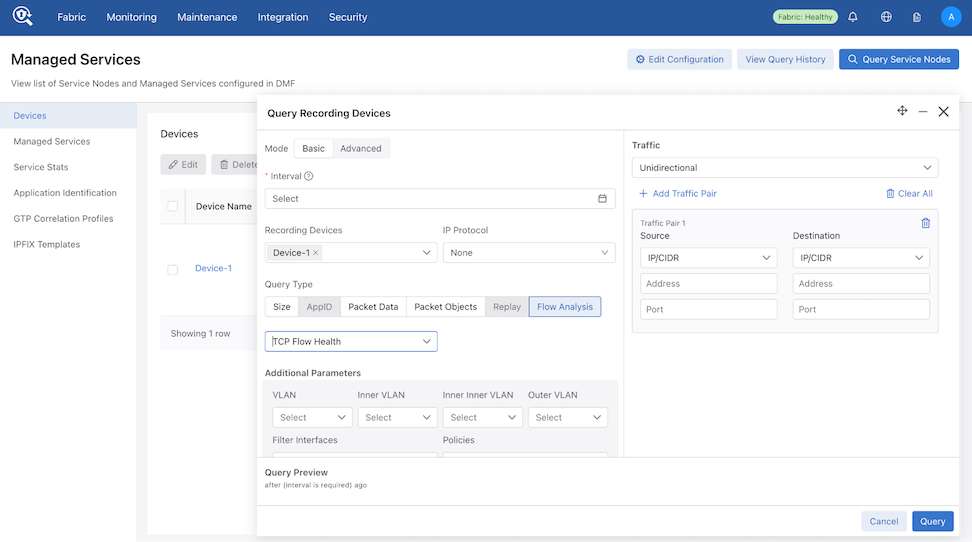
Query Service Node
Select Query Service Nodes on the Managed Services dashboard () to open the Query Recording Devices window. Both Recorder Nodes and SNs are available in the Recording Devices drop-down. When selecting both types, the UI enables only the options supported by both device types.
Selecting an SN disables the following options:
- Query Types: AppID, Replay
- Flow Analysis: DNS, HTTP Request, Hosts, RTP Streams, SIP Correlate, SIP Health, TCP, UDP
- Additional Parameters: Fail Fast, Dedup Time Window
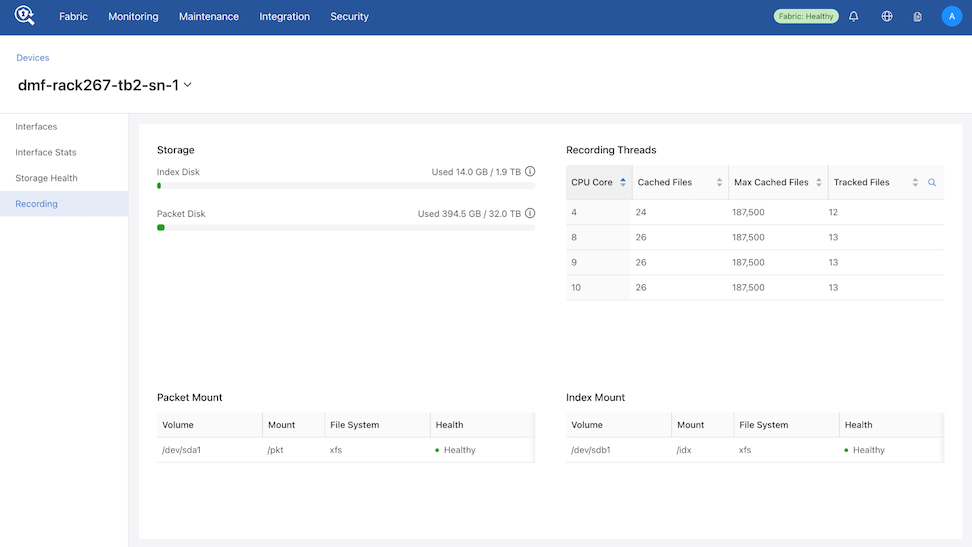
Device Details Recording Tab
A Recording tab is available in the device details dashboard (). This section displays the following recording-related information for the selected device:
- Storage: Index Disk and Packet Disk utilization.
- Recording Threads: CPU Core, Cached Files, Max Cached Files, and Tracked Files.
- Packet Mount / Index Mount: Volume, mount point, file system, and health status.
Service Action Invalid Alert: If issues occur with a record action on a Managed Service, a Service Action Invalid warning alert appears in the notification area (bell icon in the header).
Select the bell icon to view alert details.
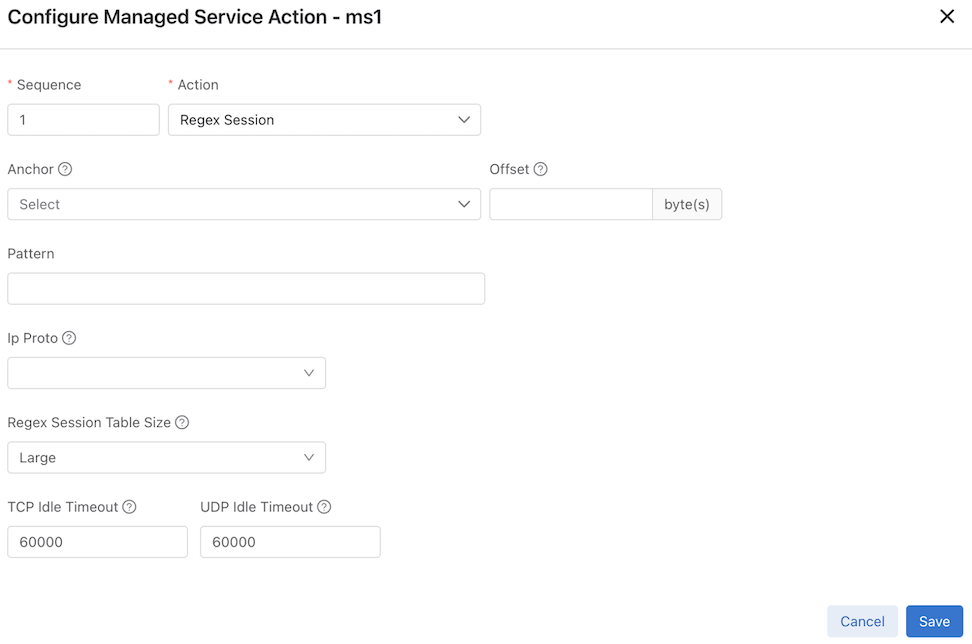
Regex Session
Select Regex Session from the Action drop-down to open the configuration menu. Configure the following fields:
- Anchor
- Offset
- Pattern
- IP Protocol
- Regex Session Table Size
- TCP Idle Timeout
- UDP Timeout
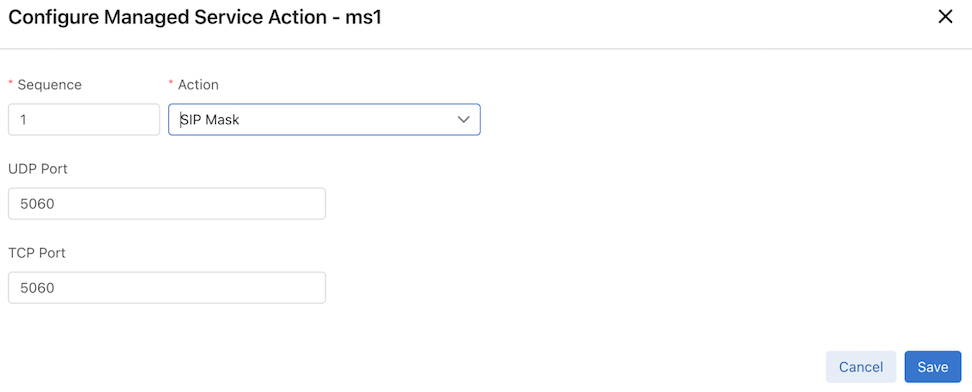
SIP Mask
Select SIP Mask from the Action drop-down to open the configuration menu. Configure the following fields:
- UDP Port
- TCP Port
Sample
Select Sample from the Action drop-down to open the configuration menu. Configure the following fields:
- Max Tokens
- Tokens Per Refresh
Session Slice
Session-slice keeps track of TCP and UDP sessions (distinguished by source and destination IP address and port) and counts the number of packets sent in each direction (client-to-server and vice versa). After recognizing the session, the action transmits a user-configured number of packets to the tool node.
For TCP packets, session-slice tracks the number of packets sent in each direction after establishing the TCP handshake. Slicing begins after the packet count in a direction has reached the configured threshold in both directions.
For UDP packets, slicing begins after reaching the configured threshold in either direction.
By default, session-slice will operate on both TCP and UDP sessions but is configurable to operate on only one or the other.
Refer to the DANZ Monitoring Fabric (DMF) Verified Scale Guide for session-slicing performance numbers.
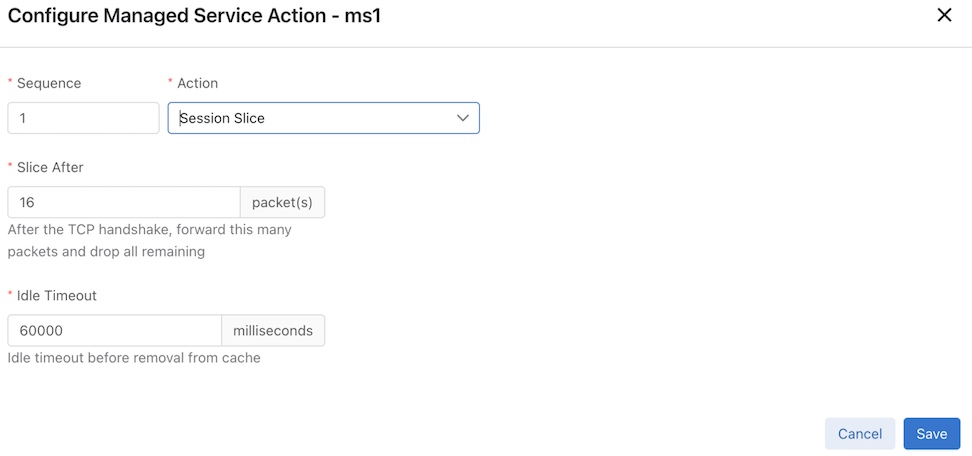
Select Session Slice from the Action drop-down to open the configuration menu. Configure the following fields:
- Slice After (based on number of Packets)
- Idle Timeout
Configure Session Slicing
- Navigate to .
Figure 120. Managed Services 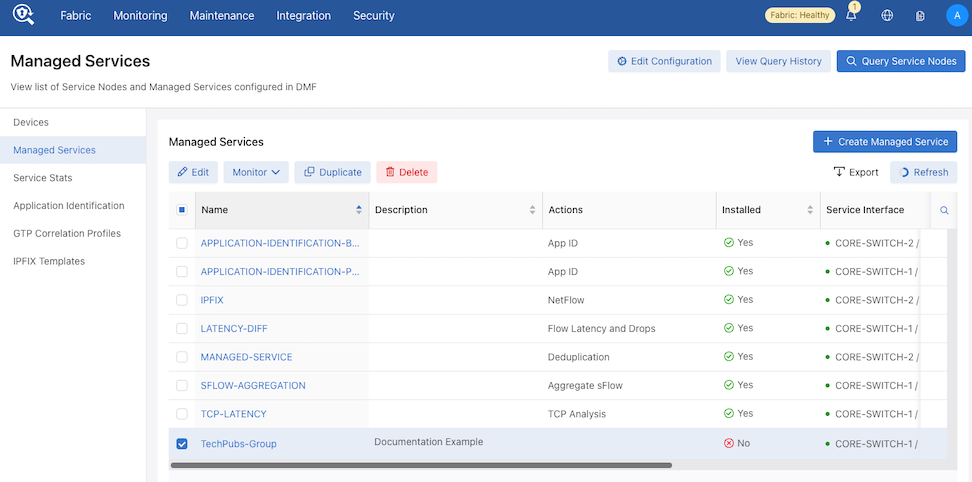
- Select the + icon to create a new managed service.
Figure 121. Create Managed Service 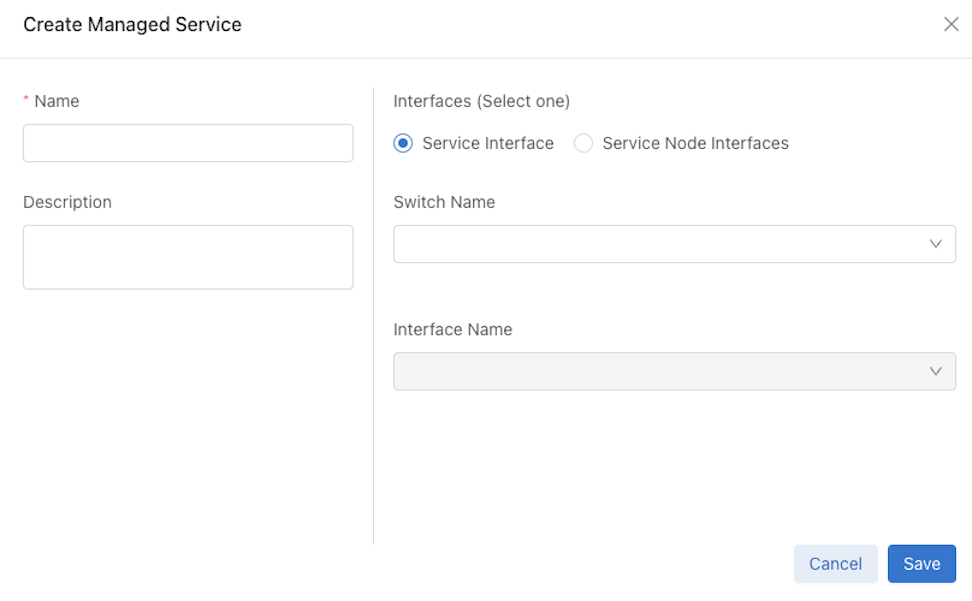
- Enter a Name for the managed service.
Figure 122. Managed Service Name 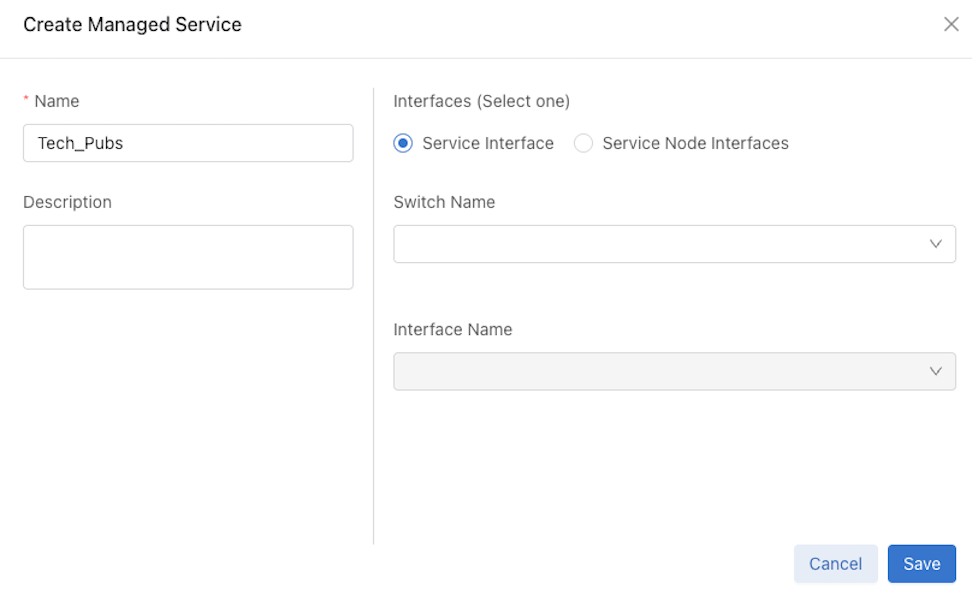
- Select a Switch from the drop-down list.
Figure 123. Manage Service Switch 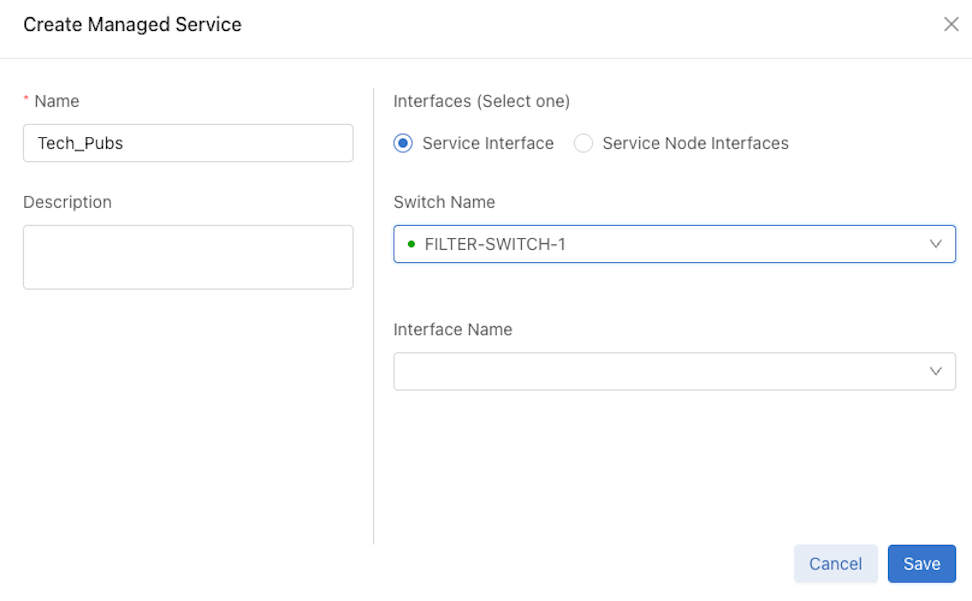
- Select an Interface from the drop-down list.
Figure 124. Managed Service Interface Added 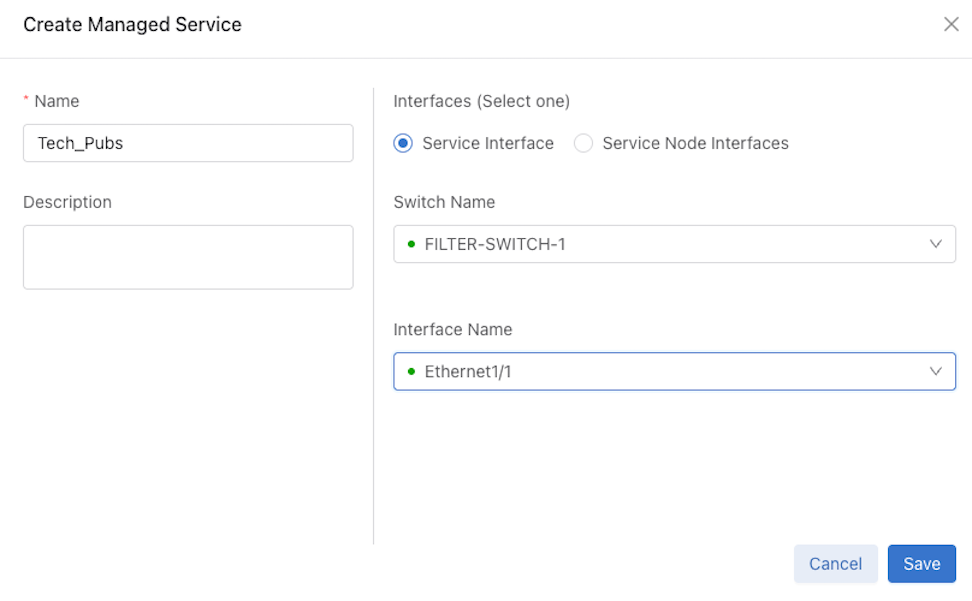
Click Save.
- Select the + icon to select a managed service action.
Figure 125. Configure Managed Service Action List 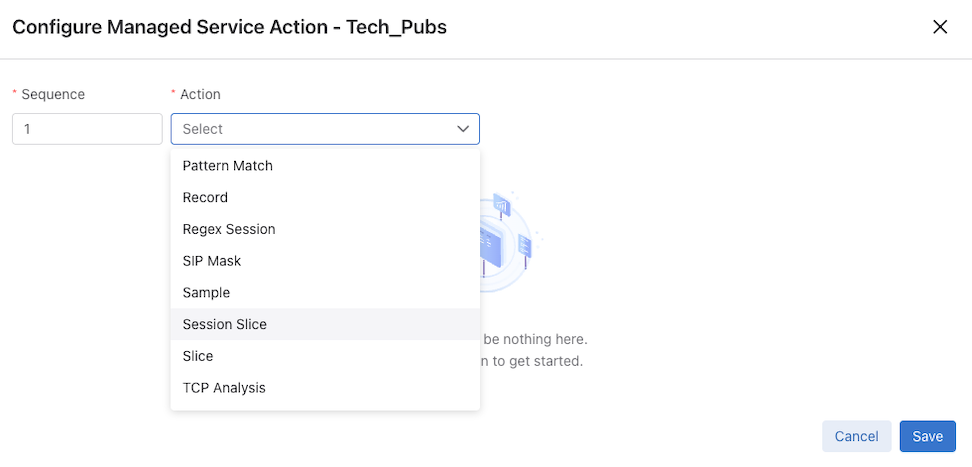
- Choose Session Slice from the drop-down list. Adjust the Slice After and Idle Timeout parameters, as required.
Figure 126. Configure Managed Service Action Session Slice 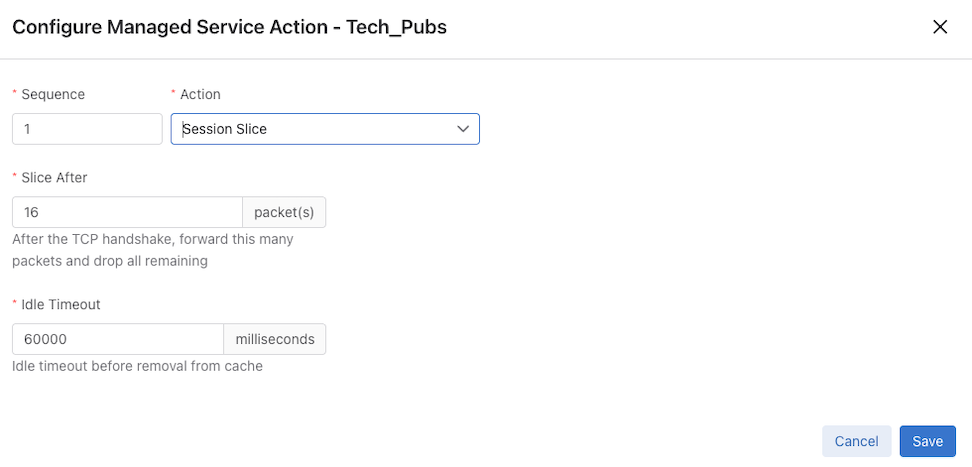
Slice
- Packet start
- L3 header start
- L4 header start
- L4 payload start
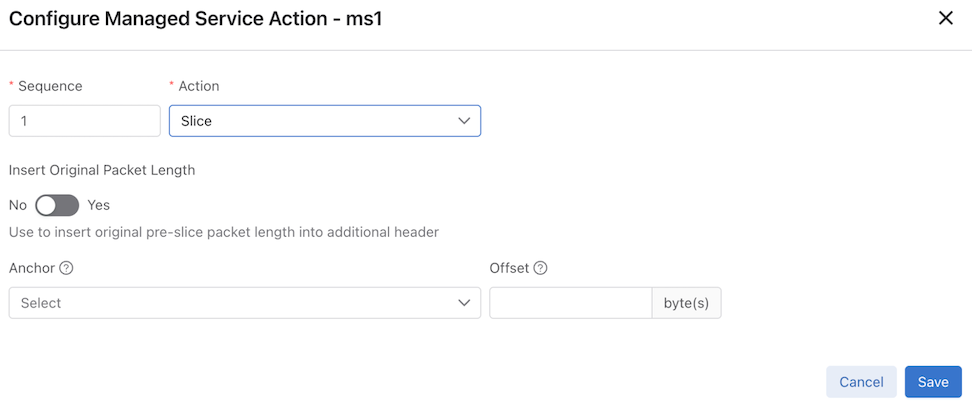
Select Slice from the Action drop-down to open the configuration menu. Configure the following fields:
- Insert Original Packet length
- Anchor
- Offset
This page allows inserting an additional header containing the original header length.
TCP Analysis (Dapper)
The Dapper action (derived from Brown University research) identifies TCP session issues by measuring specific connection attributes. This analysis determines whether performance degradation stems from the client, server, or network devices. All current Service Node platforms support the Dapper action.
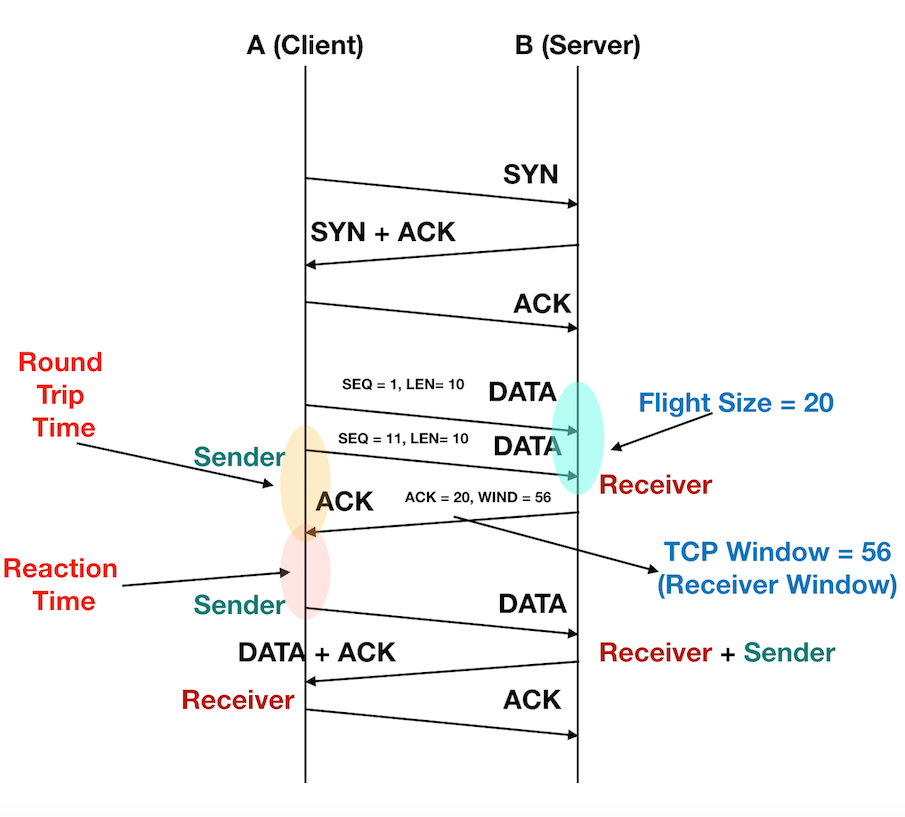
The action monitors TCP session packets, tracks extensive statistics, and periodically exports them via IPFIX records to a collector. For every session direction, the system generates:
- One Start-Session record.
- One or more Data records.
- One End-Session record.
The collector evaluates these statistics, utilizing six distinct IPFIX templates to diagnose the root cause of network problems.
Start-Session Record
The system transmits the Start-Session record for each direction immediately after session establishment (upon Client ACK). This record captures the initial attributes negotiated during the handshake.
| Offset | ID | Dapper Field | Type | Description |
|---|---|---|---|---|
| 0 | 8 | ipv4_src | ipv4Address | IPv4 source address |
| 1 | 12 | ipv4_dst | ipv4Address | IPv4 destination address |
| 2 | 7 | tcp_src | unsigned16 | TCP source address |
| 3 | 11 | tcp_dst | unsigned16 | TCP destination address |
| 4 | 239 | biflow_direction | unsigned8 | Direction of session (0=unknown, 1=initiator, 2=reverseInitiator) |
| 5 | 152 | start_milliseconds | dateTimeMilliseconds | Session start time in milliseconds since epoch |
| 6 | 218 | tcp_syn_total_count | unsigned64 | Number of TCP packets with SYN flag sent (0 if we did not see initiation) |
| 7 | 32774 | window_size | unsigned32 | Initial window size in octets |
| 8 | 32771 | expected_flight_size | unsigned32 | Expected flight size in octets |
| 9 | 32822 | switch_mac | macAddress | Ethernet address of filter switch |
| 10 | 32823 | switch_port | unsigned16 | Port on filter switch |
| 11 | 6 | tcp_control_bits | unsigned16 | TCP flags set during initiation (SYN, SYN | ACK, unset if we did not see initiation) |
| Offset | ID | Dapper Field | Type | Description |
|---|---|---|---|---|
| 0 | 27 | ipv6_src | ipv6Address | IPv6 source address |
| 1 | 28 | ipv6_dst | ipv6Address | IPv6 destination address |
| 2 | 7 | tcp_src | unsigned16 | TCP source address |
| 3 | 11 | tcp_dst | unsigned16 | TCP destination address |
| 4 | 239 | biflow_direction | unsigned8 | Direction of session (0=unknown, 1=initiator, 2=reverseInitiator) |
| 5 | 152 | start_milliseconds | dateTimeMilliseconds | Session start time in milliseconds since epoch |
| 6 | 218 | tcp_syn_total_count | unsigned64 | Number of TCP packets with SYN flag sent (0 if we did not see initiation) |
| 7 | 32774 | window_size | unsigned32 | Initial window size in octets |
| 8 | 32771 | expected_flight_size | unsigned32 | Expected flight size in octets |
| 9 | 32822 | switch_mac | macAddress | Ethernet address of filter switch |
| 10 | 32823 | switch_port | unsigned16 | Port on filter switch |
| 11 | 6 | tcp_control_bits | unsigned16 | TCP flags set during initiation (SYN, SYN | ACK, unset if we did not see initiation) |
Data Record
The system transmits Data records for each session direction at periodic intervals. It analyzes packet streams up to a configured limit to match data/acknowledgment pairs, recording delay and size metrics. Most statistics reflect averages derived from the sample period.
dapper compatibility setting is false.| Offset | ID | Dapper Field | Type | Description |
|---|---|---|---|---|
| 0 | 8 | ipv4_src | ipv4Address | IPv4 source address |
| 1 | 12 | ipv4_dst | ipv4Address | IPv4 destination address |
| 2 | 7 | tcp_src | unsigned16 | TCP source address |
| 3 | 11 | tcp_dst | unsigned16 | TCP destination address |
| 4 | 239 | biflow_direction | unsigned8 | Direction of session (0=unknown, 1=initiator, 2=reverseInitiator) |
| 5 | 32768 | report_timer | unsigned32 | The number of samples in round-trip-time calculations (matching sync/ack pairs) |
| 6 | 32828 | reaction_time | unsigned32 | Average time between receiving an ACK and the next data packet |
| 7 | 32770 | flight_size | unsigned32 | Average flight size over samples in octets |
| 8 | 32771 | expected_flight_size | unsigned32 | Average expected flight size in octets |
| 9 | 32829 | round_trip_time | unsigned32 | Average round-trip-time between sync and matching ack in microseconds |
| 10 | 32773 | retransmissions | unsigned32 | Counter of retransmitted packets received during sample period |
| 11 | 32774 | window_size | unsigned32 | Average window size reported during sample period in octets |
| 12 | 32775 | ecn | unsigned32 | Counter of how many packets had ECN flag set during sample period |
| 13* | 2 | packet_delta | unsigned32 | Number of packets received during sample period |
| 14* | 1 | octet_delta | unsigned64 | Number of bytes received during sample period |
| 15* | 32830 | first_rtt | unsigned32 | First round trip time in period in microseconds |
| 16* | 32831 | min_rtt | unsigned32 | Minimum round trip time during period in microseconds |
| 17* | 32832 | max_rtt | unsigned32 | Maximum round time trip during period in microseconds |
| 17* | 32833 | rtt_standard_deviation | unsigned32 | The standard deviation of round trip time measurements during period |
| 18* | 32834 | recovery_time | unsigned32 | Average time between an initial data packet and a retransmission |
| Offset | ID | Dapper Field | Type | Description |
|---|---|---|---|---|
| 0 | 27 | ipv6_src | ipv4Address | IPv4 source address |
| 1 | 28 | ipv6_dst | ipv4Address | IPv4 destination address |
| 2 | 7 | tcp_src | unsigned16 | TCP source address |
| 3 | 11 | tcp_dst | unsigned16 | TCP destination address |
| 4 | 239 | biflow_direction | unsigned8 | Direction of session (0=unknown, 1=initiator, 2=reverseInitiator) |
| 5 | 32768 | report_timer | unsigned32 | The number of samples in round-trip-time calculations (matching sync/ack pairs) |
| 6 | 32828 | reaction_time | unsigned32 | Average time between receiving an ACK and the next data packet |
| 7 | 32770 | flight_size | unsigned32 | Average flight size over samples in octets |
| 8 | 32771 | expected_flight_size | unsigned32 | Average expected flight size in octets |
| 9 | 32829 | round_trip_time | unsigned32 | Average round-trip-time between sync and matching ack in microseconds |
| 10 | 32773 | retransmissions | unsigned32 | Counter of retransmitted packets received during sample period |
| 11 | 32774 | window_size | unsigned32 | Average window size reported during sample period in octets |
| 12 | 32775 | ecn | unsigned32 | Counter of how many packets had ECN flag set during sample period |
| 13* | 2 | packet_delta | unsigned32 | Number of packets received during sample period |
| 14* | 1 | octet_delta | unsigned64 | Number of bytes received during sample period |
| 15* | 32830 | first_rtt | unsigned32 | First round trip time in period in microseconds |
| 16* | 32831 | min_rtt | unsigned32 | Minimum round trip time during period in microseconds |
| 17* | 32832 | max_rtt | unsigned32 | Maximum round time trip during period in microseconds |
| 17* | 32833 | rtt_standard_deviation | unsigned32 | The standard deviation of round trip time measurements during period |
| 18* | 32834 | recovery_time | unsigned32 | Average time between an initial data packet and a retransmission |
End-Session Record
Upon session completion (via FIN, RST, or inactivity timeout), the system transmits an End-Session record for each direction containing the termination reason. If statistics remain pending at the end of the session, the system generates a final Data record before the End-Session record
| Offset | ID | Dapper Field | Type | Description |
|---|---|---|---|---|
| 0 | 8 | ipv4_src | ipv4Address | IPv4 source address |
| 1 | 12 | ipv4_dst | ipv4Address | IPv4 destination address |
| 2 | 7 | tcp_src | unsigned16 | TCP source address |
| 3 | 11 | tcp_dst | unsigned16 | TCP destination address |
| 4 | 239 | biflow_direction | unsigned8 | Direction of session (0=unknown, 1=initiator, 2=reverseInitiator) |
| 5 | 152 | end_milliseconds | dateTimeMilliseconds | Session end time in milliseconds since epoch |
| 6 | 32822 | switch_mac | macAddress | Ethernet address of filter switch |
| 7 | 32823 | switch_port | unsigned16 | Port on filter switch |
| 8 | 6 | tcp_control_bits | unsigned16 | TCP flags set during termination (FIN, RST, unset if session was timed out) |
| Offset | ID | Dapper Field | Type | Description |
|---|---|---|---|---|
| 0 | 27 | ipv6_src | ipv6Address | IPv4 source address |
| 1 | 28 | ipv6_dst | ipv6Address | IPv4 destination address |
| 2 | 7 | tcp_src | unsigned16 | TCP source address |
| 3 | 11 | tcp_dst | unsigned16 | TCP destination address |
| 4 | 239 | biflow_direction | unsigned8 | Direction of session (0=unknown, 1=initiator, 2=reverseInitiator) |
| 5 | 152 | end_milliseconds | dateTimeMilliseconds | Session end time in milliseconds since epoch |
| 6 | 32822 | switch_mac | macAddress | Ethernet address of filter switch |
| 7 | 32823 | switch_port | unsigned16 | Port on filter switch |
| 8 | 6 | tcp_control_bits | unsigned16 | TCP flags set during termination (FIN, RST, unset if session was timed out) |
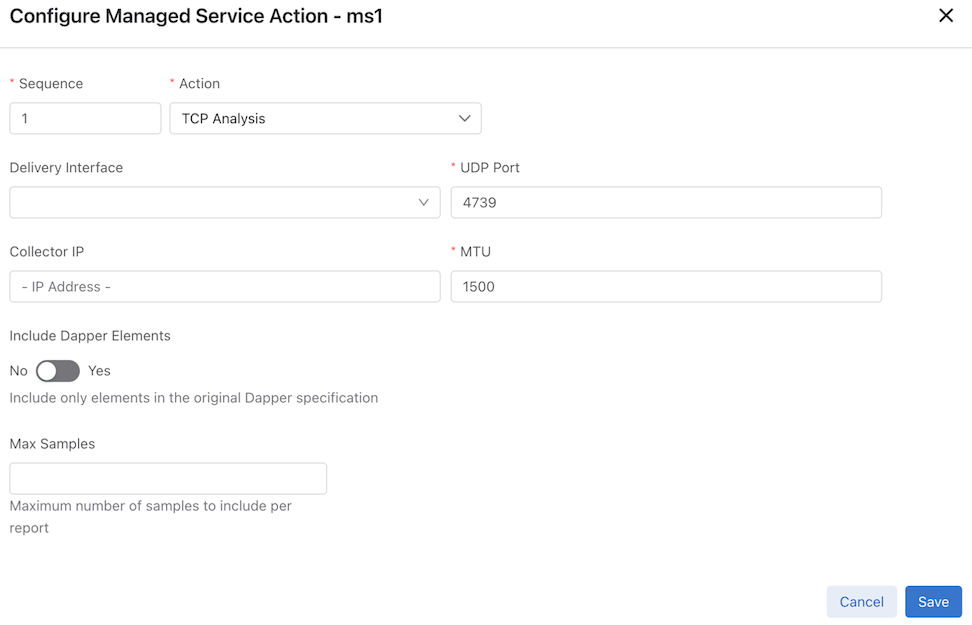
Select TCP Analysis from the Action drop-down to open the configuration menu. Configure the following fields:
- Delivery Interface
- UDP Port
- Collector IP
- MTU
- Include Dapper Elements
- Max Samples
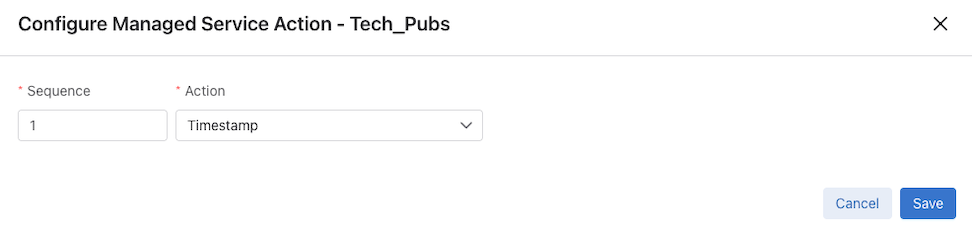
Timestamp
Select Timestamp from the Action drop-down to open the configuration menu.
GUI Configuration
UDP Replication
The UDP-replication service action copies UDP messages, such as Syslog or NetFlow messages, and sends the copied packets to a new destination IP address.
Configure a rate limit when enabling UDP replication. When upgrading from a version of DANZ Monitoring Fabric (DMF) before release 6.3.1, the UDP-replication configuration is not applied until a rate limit is applied to the delivery interface.
CONTROLLER-1(config)# switch DMF-DELIVERY-SWITCH-1
                CONTROLLER-1(config-switch)# interface ethernet1
                CONTROLLER-1(config-switch-if)# role delivery interface-name udp-delivery-1
                CONTROLLER-1(config-switch-if)# rate-limit 256000
GUI Configuration
Select UDP Replication from the Action drop-down to open the configuration menu. Configure the following fields:
- Delivery Interface
- Input Packet Destination IP
- Output Packet Destination IP
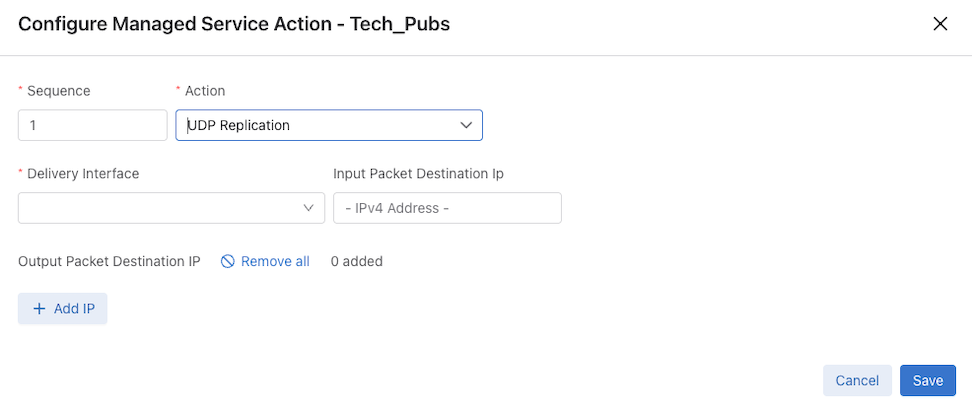
Use the UDP-replication service to copy UDP traffic, such as Syslog messages or NetFlow packets, and send the copied packets to a new destination IP address. This function sends traffic to more destination syslog servers or NetFlow collectors than would otherwise be allowed.
Add the IP address in the dialog that appears.
Adding Multiple Output IPs
For the header-strip service action only, configure the policy rules for matching traffic after applying the header-strip service action. After completing pages 1-4, select Append and enable the checkbox to apply the policy.
Select Save to save the managed service.
Monitoring Managed Services
controller-1# show managed-service-device SN-Name interfaces
controller-1# show managed-service-device SN-Name stats
For example, the following command shows the managed services handled by the Service Node Interface (SNI):
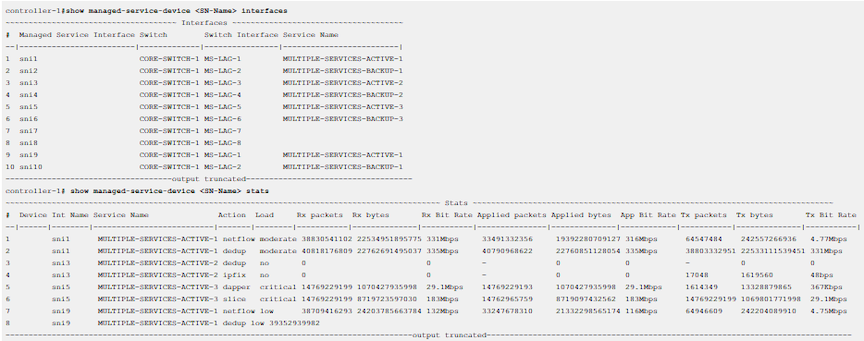
Multiple Services Per Service Node Interface
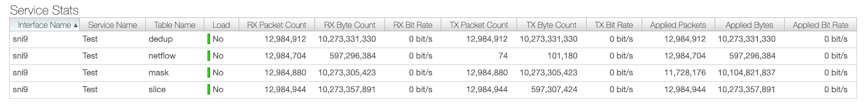
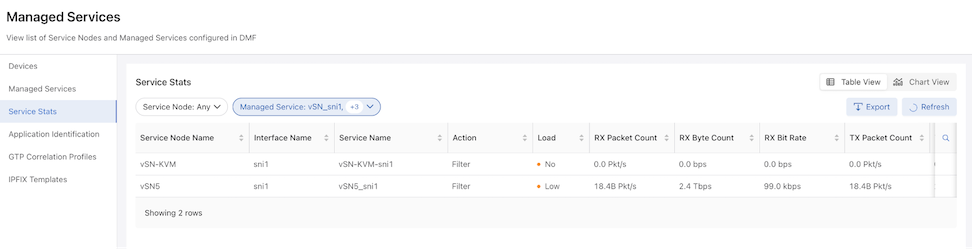
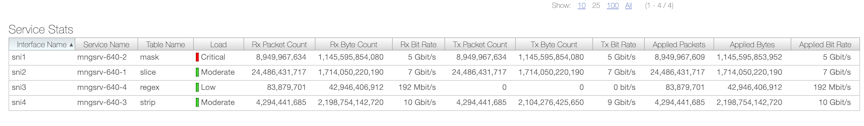
Service Stats
The Service Stats dashboard provides performance visibility through two distinct views: Table View and Chart View.
Table View
The table displays detailed service statistics, automatically refreshing every minute. It supports exporting data in JSON or CSV format.
Columns displayed:
- Service Node Name
- Interface Name
- Service Name
- Action
- Load
- RX Packet Count / RX Byte Count / RX Bit Rate
- TX Packet Count / TX Byte Count / TX Bit Rate
- Applied Packets / Applied Bytes / Applied Bit Rate
Chart View
The chart view displays a time series chart for a single managed service. Data points on the chart are updated every 10 seconds to provide near real-time visualization of performance trends.
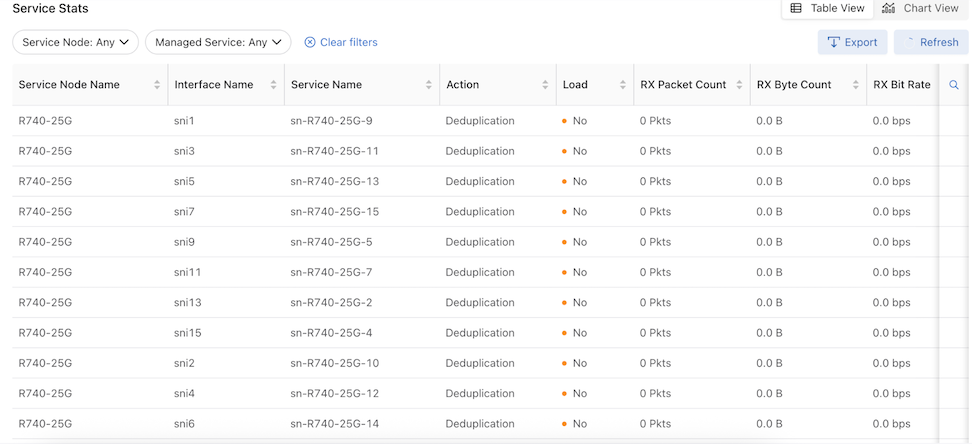
Filter
The Service Stats view includes filtering options to narrow down the displayed data. Filters are available for:
- Managed Services
- Service Nodes
Both filters support multi-select, allowing multiple options to be selected simultaneously. Filters can be cleared as needed to reset the view.
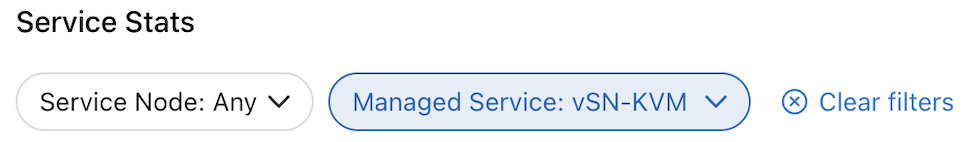
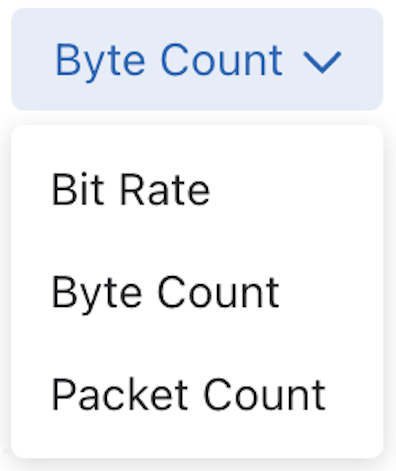
Chart View
The chart visualizes data for a single managed service, updating every 10 seconds. It displays a time series line graph based on a selected metric, such as:
- Packet Count
- Byte Count
- Bit Rate
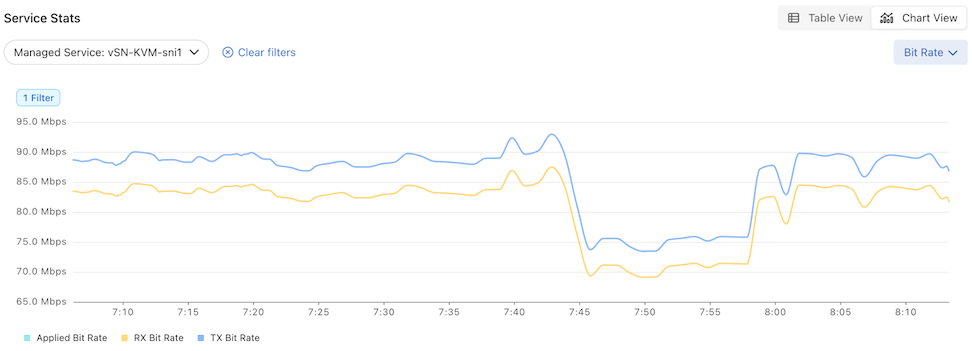
Chart Filter
The chart includes a single filter for selecting a managed service. A service can be selected, or the filter cleared as needed.
Upon selecting a metric, the chart displays three distinct line series:
- Applied
- TX
- RX
GTP Correlation Profiles
In mobile core environments (LTE/5G), traffic is encapsulated using the GPRS Tunneling Protocol (GTP), which separates signaling (GTP-C) from user data (GTP-U). GTP Correlation Profiles within the DANZ Monitoring Fabric (DMF) enable the Service Node to associate these two planes statefully.
By correlating the Tunnel Endpoint Identifier (TEID) from the user plane with the International Mobile Subscriber Identity (IMSI) from the control plane, the fabric provides subscriber-aware visibility.
A GTP Correlation Profile defines how the Service Node processes and tracks mobile sessions:
- Stateful Session Mapping - The Service Node monitors GTP-C "Create Session" requests to build a real-time mapping table of IMSI, MSISDN, and TEID.
- Flow Pinning (Sticky Load Balancing) - Ensures that all GTP-C and GTP-U packets belonging to a specific subscriber session are forwarded to the same tool port or monitoring probe, maintaining session integrity for analytics.
- Filtering and Whitelisting - Enables granular traffic steering based on subscriber identity, such as monitoring only "VIP" IMSIs or specific APNs.
- Multi-Interface Support - Supports correlation across various 3GPP interfaces, including S11, S5/S8, and S1-U.
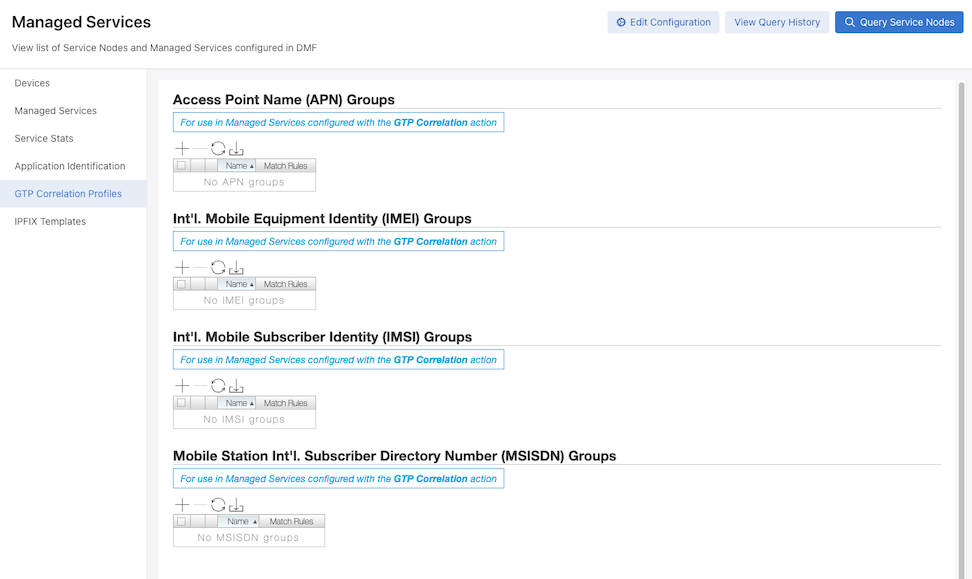
Adding Access Point Name (APN) Groups
Use the following steps to add APN Groups to the configuration:
- Click the + in the APN Groups section.
Figure 141. Creating APN Group 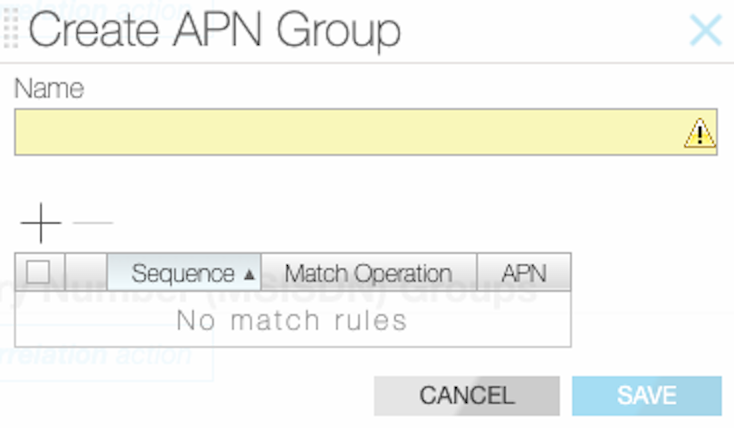
- Enter a name for the APN Group. (Required)
- Click the + to configure an APN Group Rule.
Figure 142. Configuring an APN Group Rule 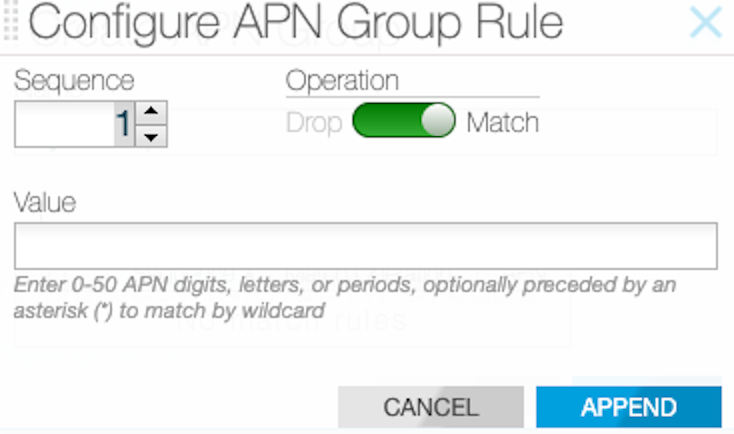
- Select a Sequence number and an Operation as either Drop or Match.
- Enter a Value using 0 to 50 APN digits, letters, or periods. Optionally, preface the value with an asterisk (*) to match by wildcard.
- Click Append to add the APN Group Rule.
- Click Save to save the configuration.
Adding International Mobile Equipment Identity (IMEI) Groups
Use the following steps to add IMEI Groups to the configuration:
- Click the + in the IMEI Groups section.
Figure 143. Create IMEI Group 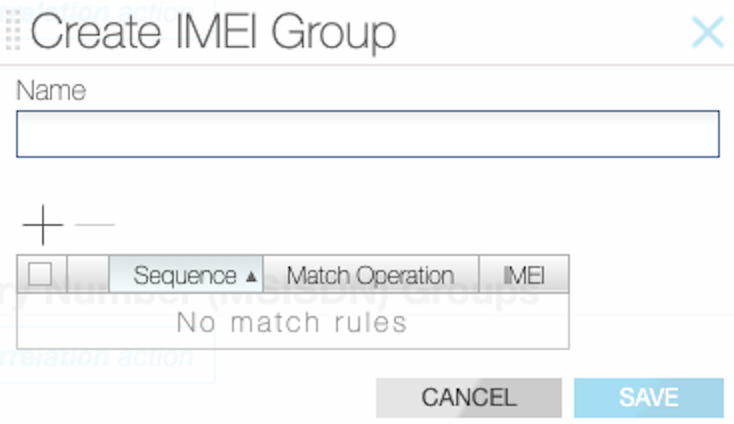
- Enter a name for the IMEI Group. (Required)
- Click the + to configure an IMEI Group Rule.
Figure 144. Adding an IMEI Group Rule 
- Select a Sequence number and an Operation as either Drop or Match.
- Enter a Value using 14 digit IMEI or 0 to 13 digits followed by an asterisk (*) to match by wildcard.
- Click Append to add the IMEI Group Rule.
- Click Save to save the configuration.
Adding International Mobile Subscriber Identity (IMSI) Groups
Use the following steps to add IMSI Groups to the configuration:
- Click the + in the IMSI Groups section.
Figure 145. Create an IMSI Group 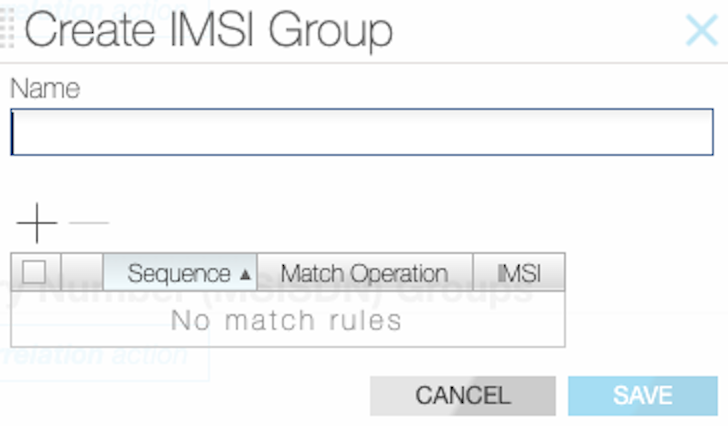
- Enter a name for the IMSI Group. (Required)
- Click the + to configure an IMEI Group Rule.
Figure 146. Creating an IMSI Group Rule 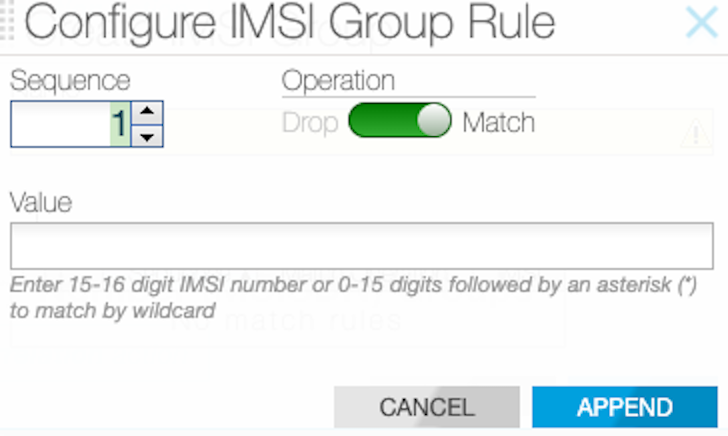
- Select a Sequence number and an Operation as either Drop or Match.
- Enter a Value using 15-16 digit IMSI number or 0 to 15 digits followed by an asterisk (*) to match by wildcard.
- Click Append to add the IMSI Group Rule.
- Click Save to save the configuration.
Adding Mobile Station International Subscriber Directory Number (MSISDN) Groups
Use the following steps to add MSISDN Groups to the configuration:
- Click the + in the MSISDN Groups section.
Figure 147. Creating an MSISDN Group 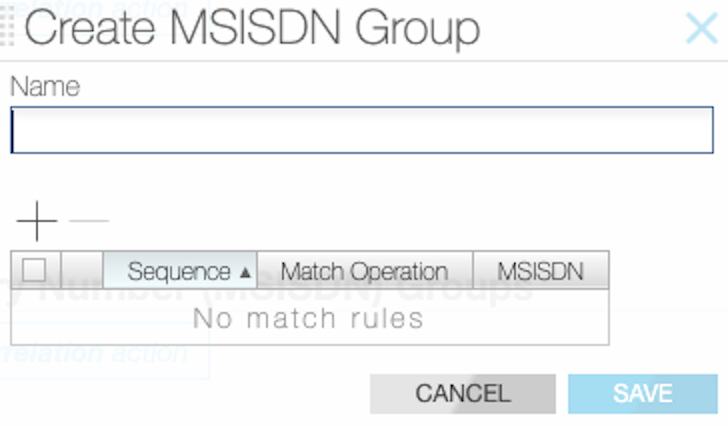
- Enter a name for the MSISDN Group. (Required)
- Click the + to configure an MSISDN Group Rule.
Figure 148. Adding an MSISDN Group Rule 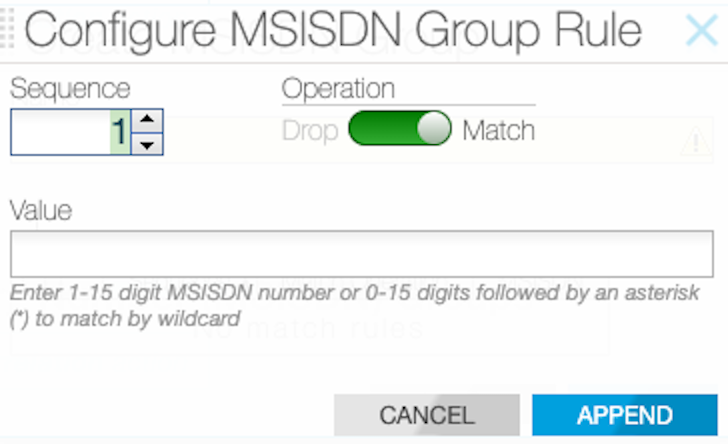
- Select a Sequence number and an Operation as either Drop or Match.
- Enter a Value using 1-15 digit MSISDN number or 0 to 15 digits followed by an asterisk (*) to match by wildcard.
- Click Append to add the MSISDN Group Rule.
- Click Save to save the configuration.
IPFIX Templates
The IPFIX Templates dashboard provides a table view of all configured templates. The table includes the following columns:
- Name
- Template ID
- Keys
- Fields
Configure an IPFIX Template
To add an IPFIX Template, select Create IPFIX Template. This opens a menu containing fields for the template Name, Template ID, Keys, and Fields.
After completing the configuration, select Save to apply the changes.
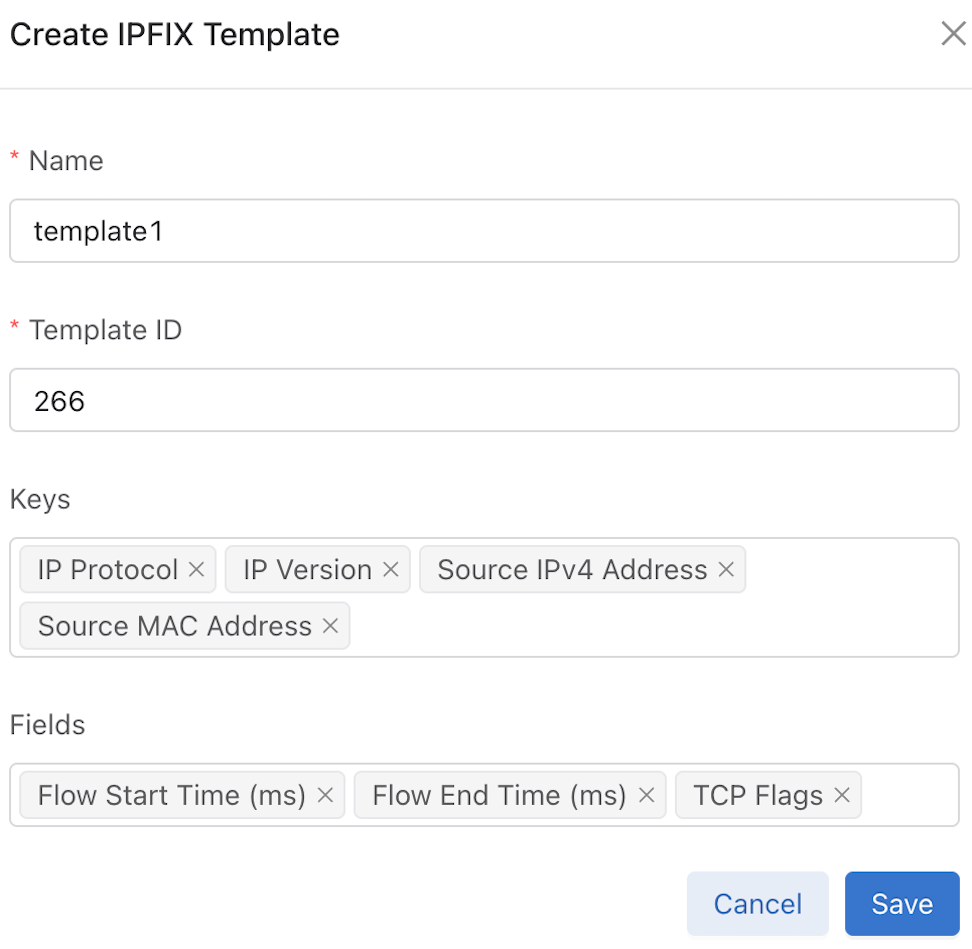
Table Actions
The following operations are available for managing IPFIX Templates:
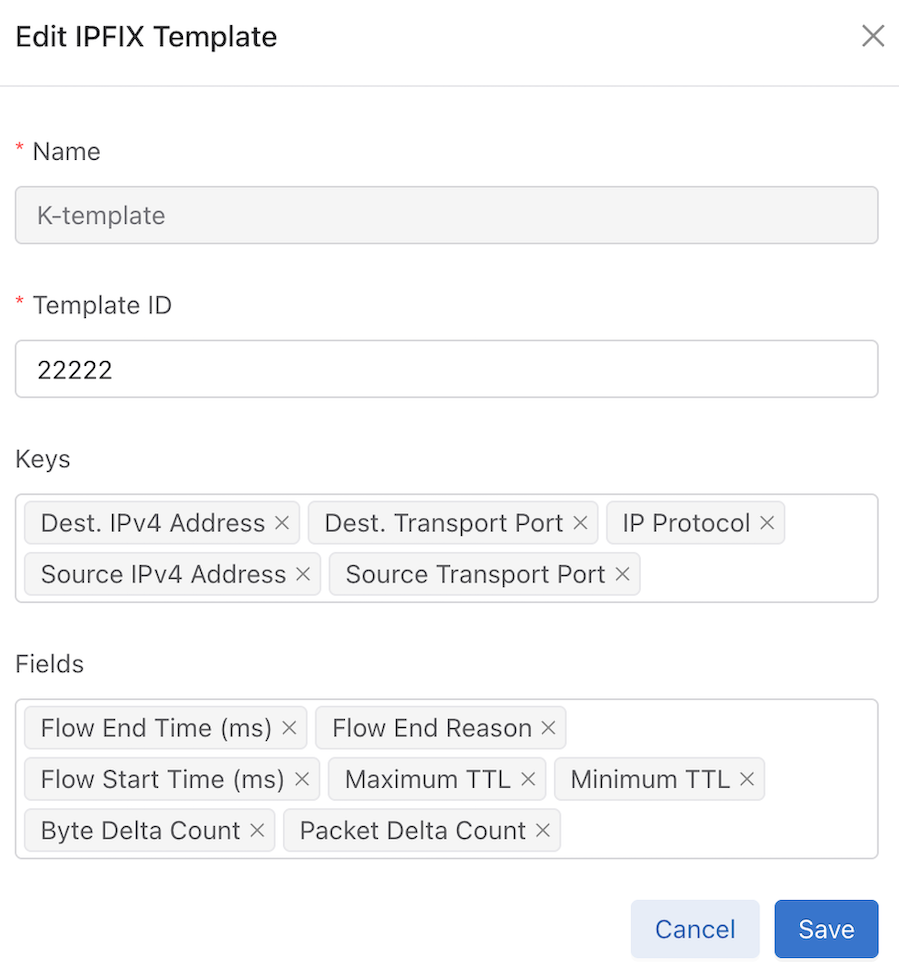
- Edit: Selecting a row enables the Edit control, which opens the Edit IPFIX Template window. The window automatically populates with the selected template's data. After modifying the configuration, select Save.
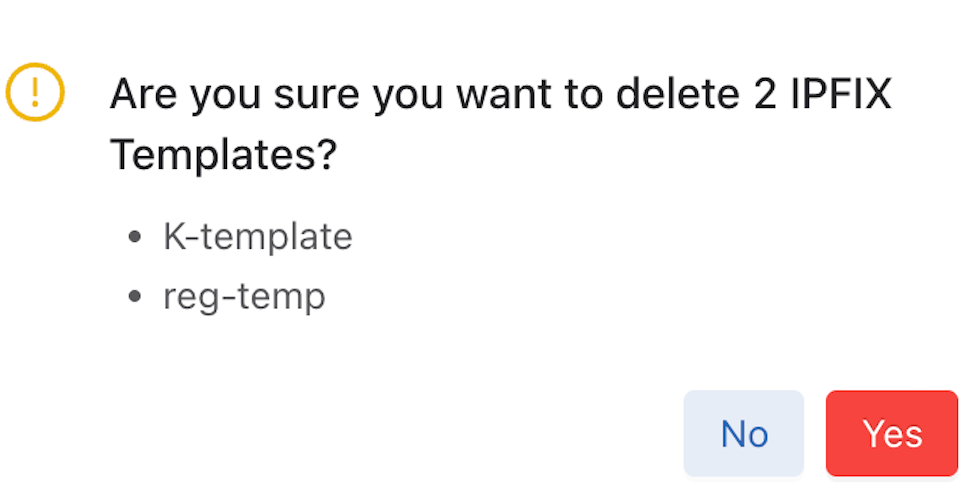
- Delete: Selecting one or more rows enables the Delete control. Selecting this button opens a confirmation window; select Yes to remove the chosen templates.
- Export: Select Export to download the IPFIX Template data in CSV or JSON format.
- Refresh: The system refreshes data every 60 seconds by default. Hover over Refresh to view the time remaining until the next update. To update the data immediately, select Refresh.
Selecting a row enables the Edit control, which opens the Edit IPFIX Template window. After modifying the configuration, select Save.
Delete
Select a template from the dashboard list. Select Delete and confirm the deletion.
Refresh
Hover over Refresh to view the time remaining until the next update. To update the data immediately, select Refresh.
Configuring the Arista Analytics Node
Arista Analytics Node capabilities are enhanced to handle NetFlow V5/V9 and IPFIX Packets. All these flow data are represented with the Netflow index.
NetFlow records are exported using User Datagram Protocol (UDP) to one or more specified NetFlow collectors. Use the DMF Service Node to configure the NetFlow collector IP address and the destination UDP port. The default UDP port is 2055.
From the Arista Analytics Node dashboard, apply filter rules to display specific flow information.
- Delivery interface: interface to use for delivering NetFlow records to collectors.
Note: The next-hop address must be resolved for the service to be active.
- Collector IP: identify the NetFlow collector IP address.
- Inactive timeout: use the inactive-timeout command to configure the interval of inactivity before NetFlow times out. The default is 15 seconds.
- Source IP: specify a source IP address to use as the source of the NetFlow packets.
- Active timeout: use active timeout to configure a period that a NetFlow can be generated continuously before it is automatically terminated. The default is one minute.
- UDP port: change the UDP port number used for the NetFlow packets. The default is 2055.
- Flows: specify the maximum number of NetFlow packets allowed. The allowed range is 32768 to 1048576. The default is 262144.
- Per-interface records: identify the filter interface where the NetFlow packets were originally received. This information can be used to identify the hop-by-hop path from the filter interface to the NetFlow collector.
- MTU: change the Maximum Transmission Unit (MTU) used for NetFlow packets.
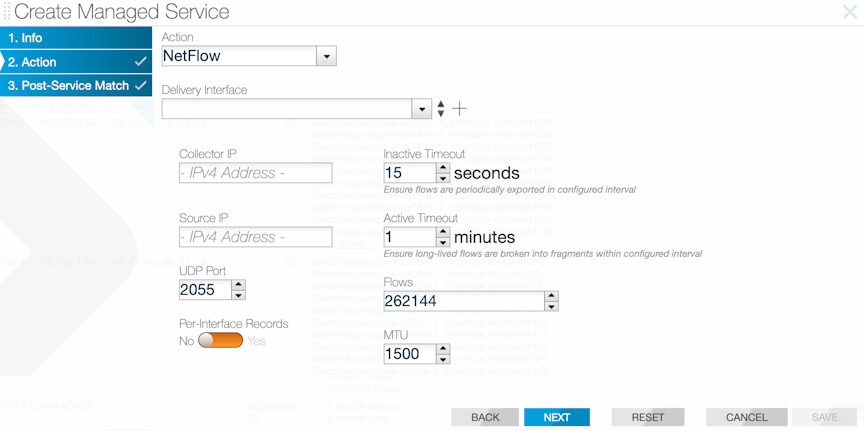
Sample Service Configuration
- Navigate to the page.
Figure 158. DMF Managed Services 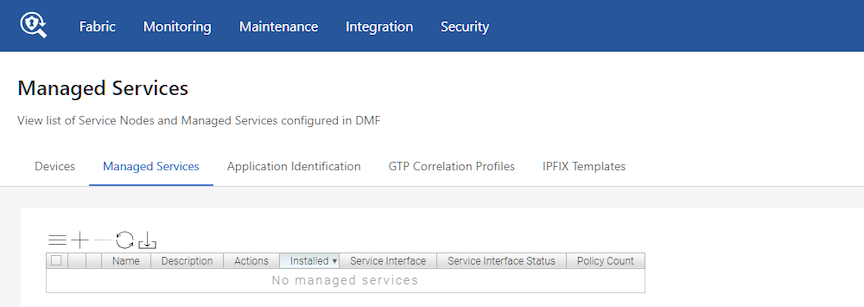
- Under the Managed Services section, select the + icon to create a new managed service. Go to the Actions, and select the Sample option in the Action drop-down. Enter values for Max tokens and Tokens per refresh.
Figure 159. Configure Managed Service Action 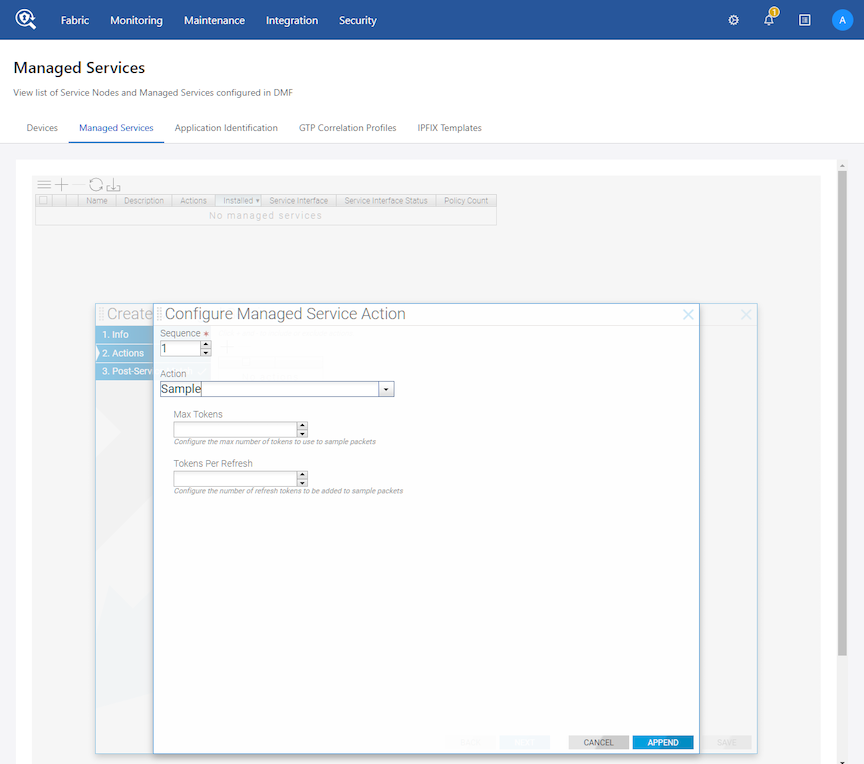
Post Service Match Rule
Post Service Match
Post Service Match Rules
Prerequisite: Add a Header Strip action or one of the Header Strip Decap actions before configuring Post Service Match Rules.
Add Rule Availability
After adding a Header Strip or Header Strip Decap action, the Add Rule option appears in two locations:
- The left navigation panel.
- The center of the empty state dashboard.
Configuring a Post Service Match Rule
Select Add Rule to open the Post Service Match Rule configuration dialog.
Rule Listing
After successfully configuring the Post Service Match Rule, the rule appears in the table within the Managed Services Details.
Edit
Select a Managed Service row and then Edit to modify its configuration. The window will automatically populate with the selected Managed Service's data. After making the necessary changes, select Save.
Configure Filter Managed Service Action
The Filter Managed Service Action filters packets on the Service Node (SN) interface and supports optional VLAN tagging. Utilizing ACL rules, the system forwards or drops matched traffic. Traffic tagged with a VLAN exits the interface (Tx) after processing through the action chain. VLAN tagging specifically facilitates traffic steering in Switch-less SN deployments, where the forwarding plane relies on VLANs. This configuration produces no functional impact when the SN connects directly to a DMF switch within the fabric.
The feature is compatible with all platforms.
Configuration
Managed service configuration supports Service Nodes connected to a DMF switch or operating in switch-less mode. The configured interface type (installation point) determines how the service is programmed. Configure the Filter Managed Service Action feature using the CLI.A Summary section provides a consolidated reference of the Filter Managed Service Action specifications, configuration limits, and operational behaviors.
Navigate to .
Select Managed Services, and then + Create Managed Service.
Configure a Service Interface
Configuring the Service Interface triggers a validation sequence. The system verifies that the SN connects to a DMF switch and that a policy utilizes the service. The Controller proceeds with installation on the SN only after passing these checks.
Navigate to Interfaces, and choose Service Interface to begin the setup.
- Initialize: Provide a Name and an optional Description for the interface.
- Map: Designate a Switch Name and Interface Name from the available drop-down menus.
- Finalize: Select Save to commit the configuration.
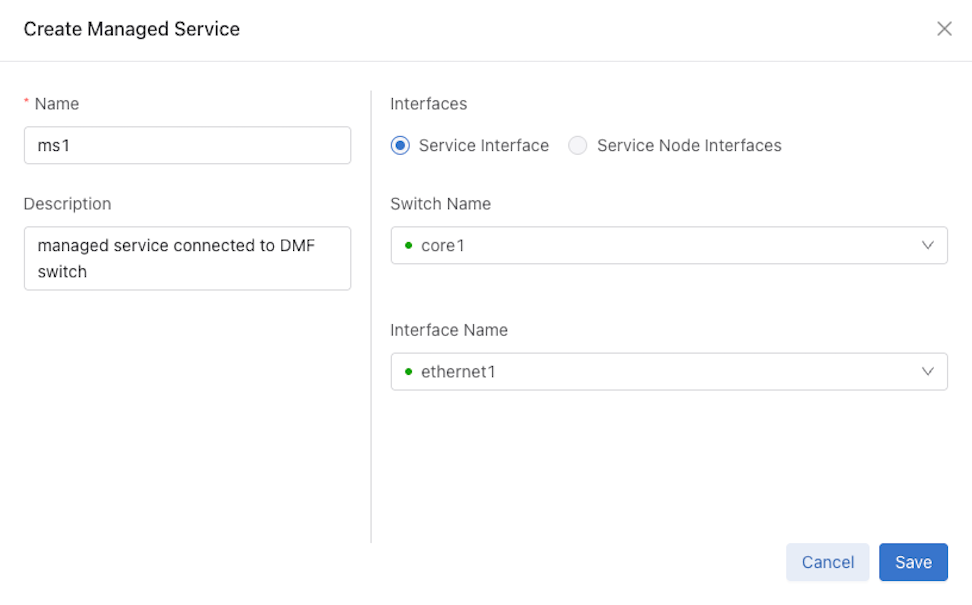
Creating the Managed Service opens the Managed Service Details window, which displays the Service Interface.
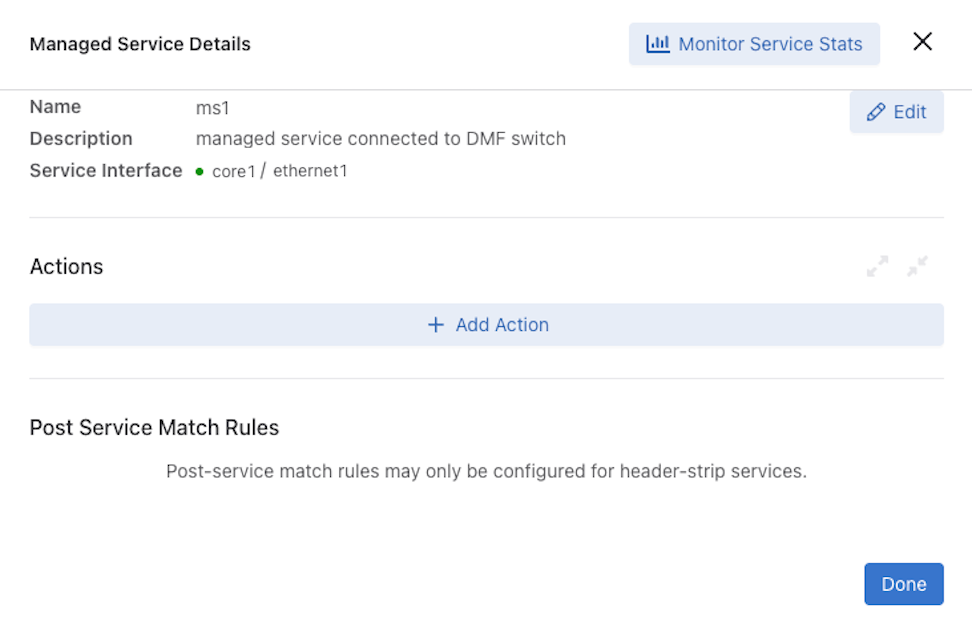
Configure a Service Node Interface
Configuring the Service Node Interface designates the managed service for switch-less operation. This mode applies when the SN lacks a physical connection to a DMF switch or when the Controller is unable to discover the link. The Controller installs the managed service immediately upon valid configuration, without requiring policy association. However, any DMF policy configured with this service will fail due to the absence of a reachability path from the fabric.
Access Edit within the Managed Service Details window to modify existing interface settings.
- Navigate: Go to Interfaces and choose Service Node Interfaces.
- Populate: Link the Service Node and Interface fields from the available drop-down menus.
- Manage Entries: Use + Add to include additional entries or the trash icon to remove them.
- Finalize: Select Save to commit the configuration.
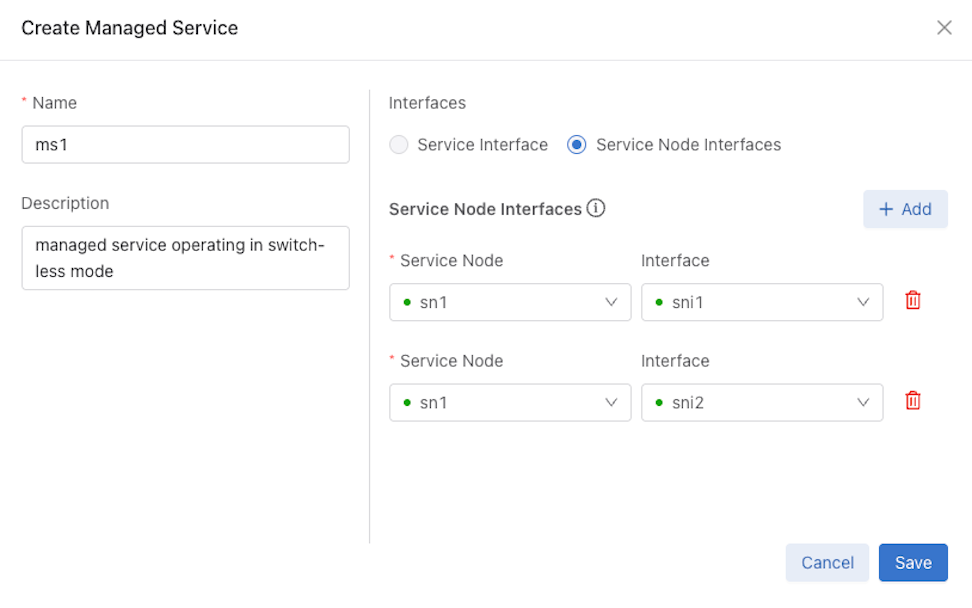
Creating the Service Node Interface(s) updates the Managed Service Details window to display the new entries.
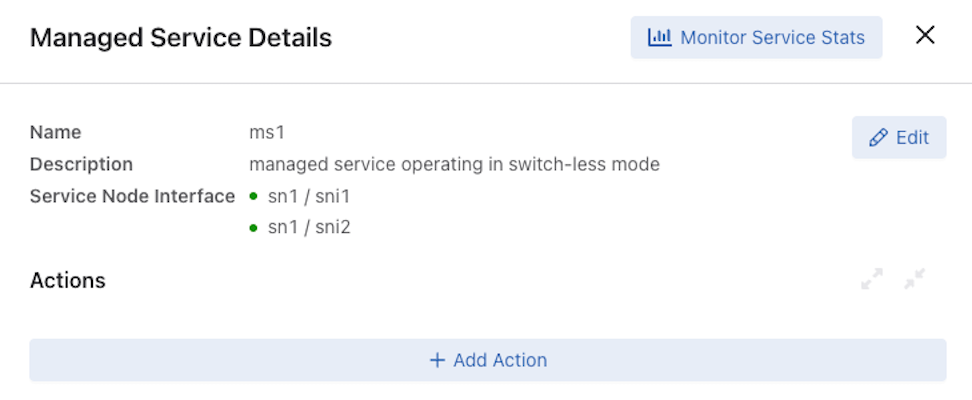
Configure Filter Action: The Filter action functions at any position within the managed service action sequence. Configuring it as the initial action filters and tags traffic on the service node interface, passing only the filtered traffic to subsequent actions in the chain.
Access + Add Action within the Managed Service Details window to begin the configuration.
Configuration Steps- Initialize: Define the Managed Service Action by assigning a Sequence number.
- Define Action: Designate Filter as the primary Action type.
- Specify Parameters: Provide a Push VLAN if required, and set the forwarding behavior to Forward or Drop.
- Establish Logic: Configuring Filter as the initial action in the sequence filters and tags traffic on the Service Node Interface, passing only the filtered traffic to subsequent actions.
- Finalize: Select Save to commit the configuration.
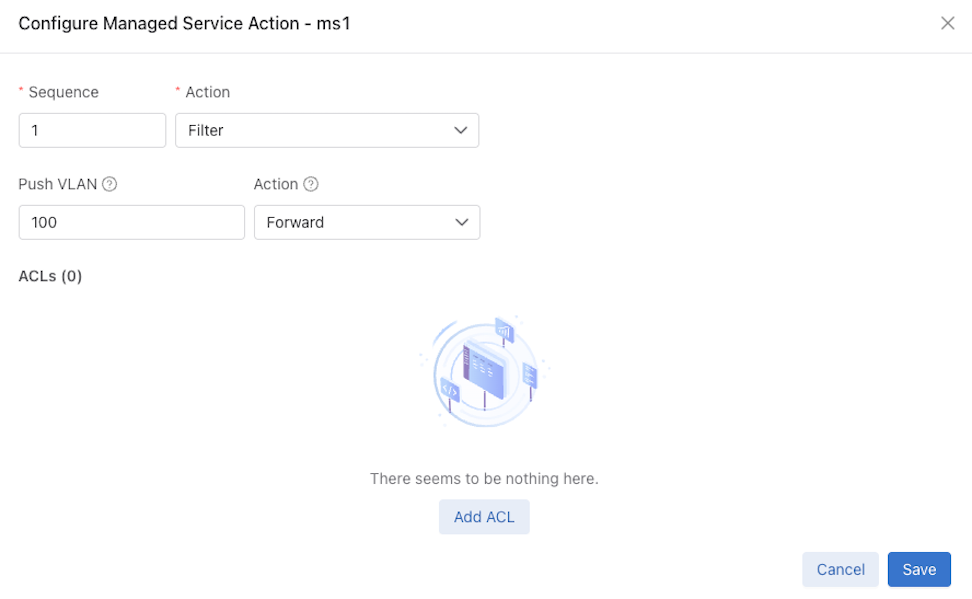
ACL Rule Management
The system supports precise traffic filtering via ACL rules. Construct high-priority Drop rules to block specific patterns, such as UDP traffic from a designated subnet.
- Initialize: Within the Configure Managed Service Action window, access + Add ACL.
- Define Parameters: Enter the following networking details for the filter:
- Source IP Address and Mask
- Source Port
- Destination IP Address and Mask
- Destination Port
- Manage Entries: Use + Add ACL to include additional rules or the trash icon to remove them.
- Finalize: Select Save to commit the configuration.
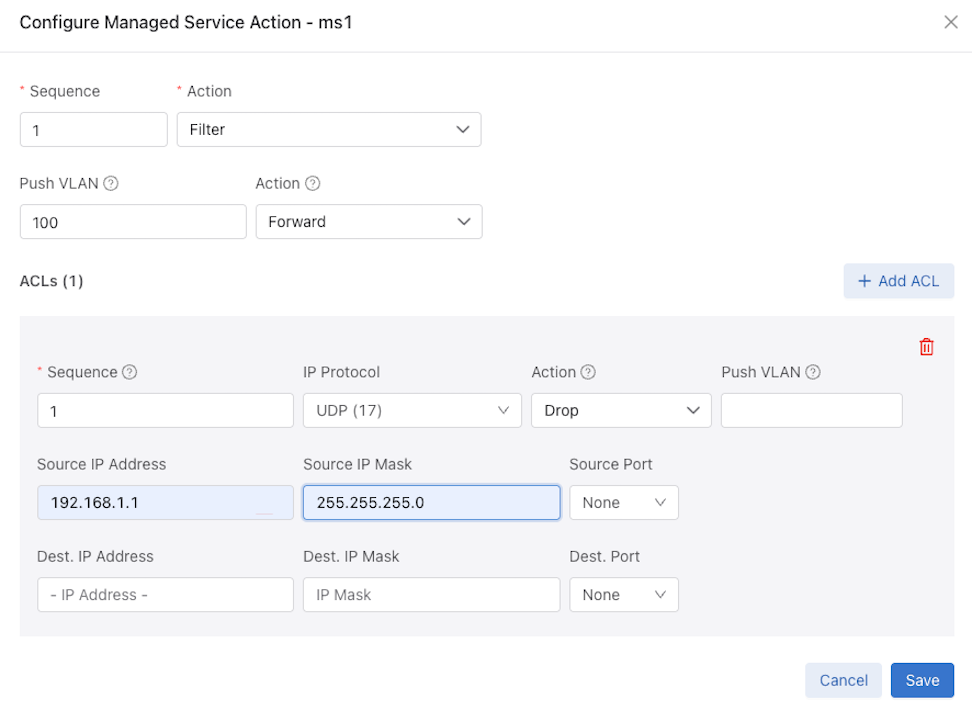
Wildcard Rules and Rule Expansion
Wildcard rules facilitate matching on any IP address or port number. The configuration uses 0.0.0.0 to match any IPv4 address and ::0 to match any IPv6 address. Additionally, the any keyword matches any IPv4 or IPv6 packet.
Omitting specific parameters triggers the following default behaviors:
- Port Match: Omitting a port match defaults to the entire port range.
- IP Field: Leaving the IP address field blank in the GUI implies a wildcard match.
Max Rule Limits
Each Filter managed service action supports a maximum of 2048 rules. The Controller calculates this total based on the expanded runtime rules rather than the initial configuration lines.
The system tracks IPv4 and IPv6 rules in separate tables, with each table supporting 1024 entries post-expansion.
- Capacity Handling: Upon reaching table capacity, the system halts the installation of further expanded rules.
- Overflow Behavior: The Controller skips any configured rule if the corresponding table (IPv4 or IPv6) is full.
Viewing Statistics
To view the Managed Services Service Stats select the desired link in the Managed Services dashboard.
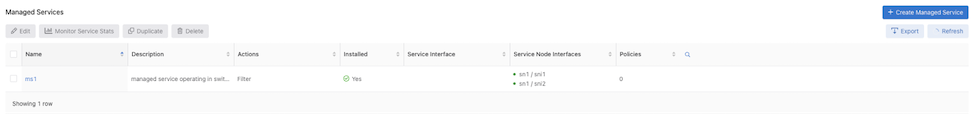
Select Monitor Service Stats within the Managed Service Details window to view Service Stats.
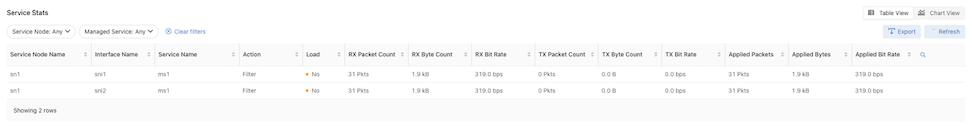
Applied statistics vary based on the specific action type. For the Filter action, these metrics quantify the traffic matching the configured ACL rules:
- Applied Packets: Total count of matched packets.
- Applied Bytes: Total count of matched bytes.
- Applied Bit Rate: Current data rate of matched traffic.
Summary
The following table provides a consolidated reference of the Filter Managed Service Action specifications, configuration limits, and operational behaviors.
| Feature | Specification |
|---|---|
| Primary Function | Packet filtering via ACL rules with optional VLAN tagging. |
| GUI Capabilities | Supports ACL rule creation and modification. Blank IP fields in the interface denote wildcard matches. Allows insertion of high-priority drop rules. |
| Deployment Modes | Supported on both Switch-Connected and Switch-less Service Nodes. |
| Rule Capacity | 2048 Total Rules (1024 IPv4 / 1024 IPv6) post-runtime expansion. |
| Matching Logic | 5-tuple matching (Src/Dst IP, Src/Dst Port, Protocol). Supports Wildcards. |
| Runtime Expansion | The Controller expands wildcard rules into specific IPv4/IPv6 and TCP/UDP entries. |
| VLAN Behavior | VLAN tags persist on egress (Tx), facilitating traffic steering in switch-less deployments. |
Configure a Backup Managed Service
Redundancy of Managed Services in the same DMF Policy
This method enables a second managed service to function as a backup within the same DANZ Monitoring Fabric (DMF) policy. The backup service activates only if the primary service becomes unavailable. It can reside on the same service node or core switch, or across different nodes and switches.
To assign a managed service as a backup service in a DANZ Monitoring Fabric (DMF) policy, perform the following steps:
- Select and select + Create Policy.
Figure 178. Create Policy 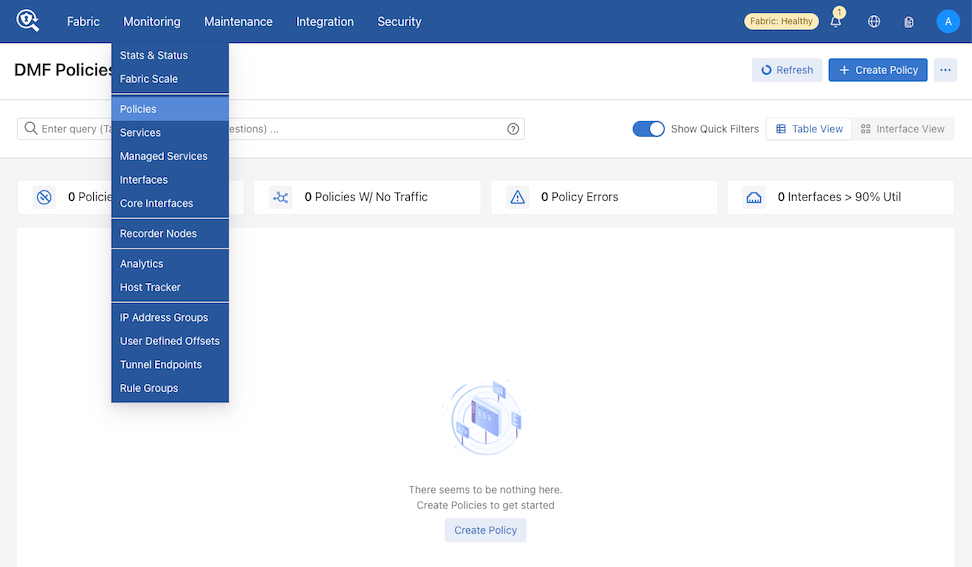
- Configure the policy as required. From the Services section, select + Add Service(s).
Figure 179. Add Services 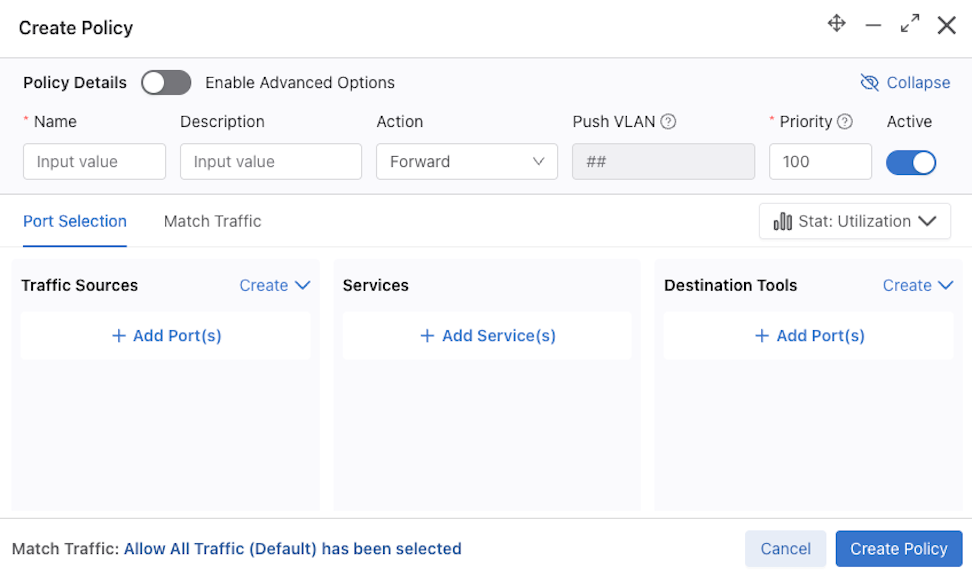
Figure 180. Add Services - No Existing Services 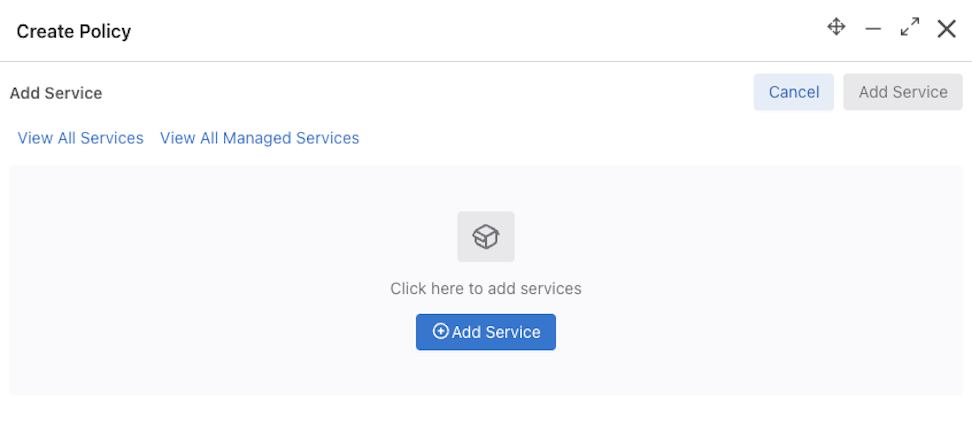
- Select the primary managed service from the Managed Service selection list followed by the backup service from the Backup Service.
Figure 181. Managed Service with Backup Service 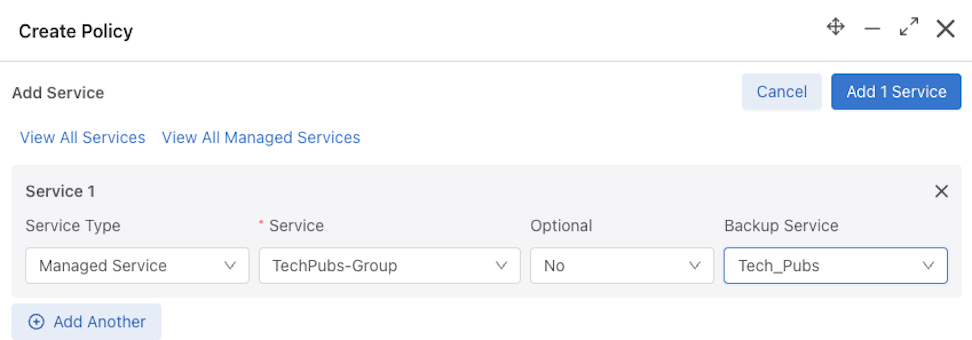
- Commit the backup service using Add [n] Service. The newly added service appears under Services.
Figure 182. Backup Service 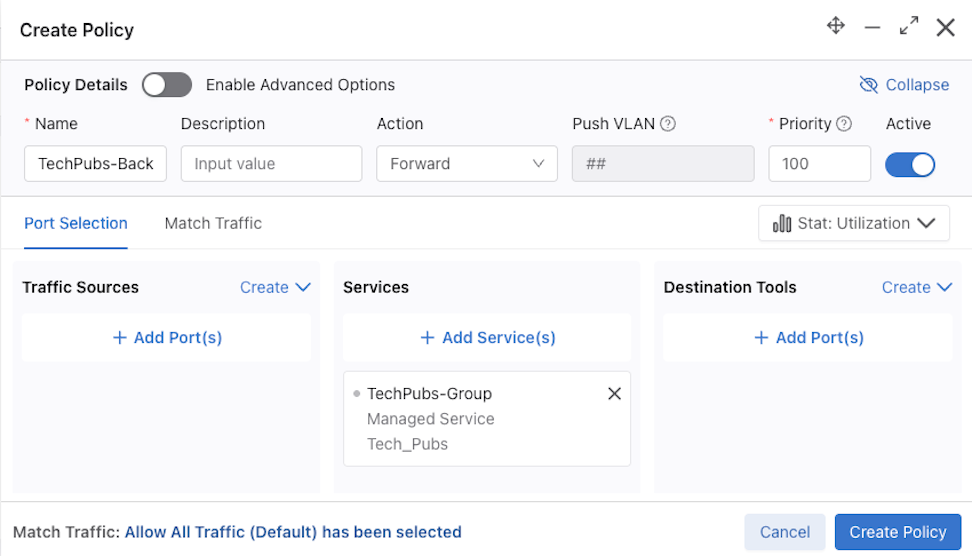
Administer Managed Services using the CLI
Changing the Service Node Default Configuration
config-service-node, enter the following command from config mode on the Active DMF controller:
controller-1(config)# service-node service_node_alias
controller-1(config-service-node)#
Replace service_node_alias with the alias to use for the service node. This alias is affiliated with the hardware MAC address of the service node using the mac command. The hardware MAC address configuration is mandatory for the service node to interact with the DMF Controller.
config-service-node submode to override the default configuration for the associated service node:
- admin password: set the password to log in to the service node as an admin user.
- banner: set the service node pre-login banner message.
- description: set a brief description.
- logging: enable service node logging to the Controller.
- mac: configure a MAC address for the service node.
- ntp: configure the service node to override default parameters.
- snmp-server: configure an SNMP trap host to receive SNMP traps from the service node.
Define a Managed Service
action Keyword RequirementBeginning with DMF version 8.9, the action keyword is required to add or modify actions within a managed service. This keyword is a mandatory token across all managed service submodes, providing a consistent way to define service behaviors. The availability of the action token within submodes allows for the direct addition or editing of actions without returning to the primary managed service configuration level. This streamlined command structure allows multiple actions—such as deduplication and IPFIX—to be defined or adjusted within a single configuration workflow. This applies to all Service Node platforms.
Managed Service Configuration
Service configuration via the CLI requires the [index] action [type] command syntax.
Example
The following demonstrates defining a deduplication action using index 1 and then moving directly into an IPFIX action configuration using index 2 without exiting the submode.
dmf-controller-1> en
dmf-controller-1# config
dmf-controller-1(config)# managed-service ms1
dmf-controller-1(config-managed-srv)# 1 action dedup
dmf-controller-1(config-managed-srv-dedup)# 2 action ipfix
dmf-controller-1(config-managed-srv-ipfix)#
Omitting the action keyword results in the following error:
Error: Command Not Found: Unexpected argument "dedup"; expected "action"
Configure a Service
To configure a service to direct traffic to a DMF service node, complete the following steps:
Sharing Managed Services Across Policies
A DANZ Monitoring Fabric (DMF) Controller allows sharing of managed services utilizing L3 delivery interfaces (e.g., NetFlow, IPFIX, app ID, etc.) across multiple policies. Prior to the DMF 8.7.0 release, DMF did not support managed service sharing because the L3 delivery interface was an optional setting in a policy configuration. However, sharing is now supported because the managed service configuration must now specify the L3 delivery interface.
When multiple policies (overlapping or non-overlapping) share the same Managed Service, the system will ensure that post-service traffic from all these policies is forwarded to appropriate delivery interfaces using a dynamically created post-service policy.
This change applies to the following managed service actions using L3 deliveries on all platforms that support managed services:
Configuration
There are no new configurations in the Sharing Managed Services Across Policies feature, but several configuration validations surrounding the managed service configuration within a policy have changed:
- Removed the validation that prevented adding an L3 header modifying managed service to multiple policies.
- A validation was added to enforce the order of shared managed services.
When sharing multiple managed services with at least one action that requires an L3 delivery interface, the only valid case is where non-UDP
replicate L3 services are followed by UDP
replicate:
- Invalid: any
non UDP replicate→ anynon UDP replicate. - Invalid:
UDP replicate→ anynon UDP replicate. - Invalid:
UDP replicate→UDP replicate. - Valid: any
non UDP replicate→UDP replicate.
There are two fundamental exceptions to the earlier examples:
- The
push-per-filtermode doesn’t allow multiple header modifying services in a policy. Flow diffis only supported inpush-per-filtermode and cannot be chained withUDP replicate.
The following is a sample configuration sharing a Netflow managed service across two policies.
action keyword is required to add or modify actions within a managed service.Configure an L3 delivery interface:
dmf-controller> enable
dmf-controller# configure
dmf-controller(config)# switch sw1
dmf-controller(config-switch)# interface ethernet31
dmf-controller(config-switch-if)# role delivery interface-name l3-d1 ip-address 0.0.0.1 nexthop-ip 0.0.0.1 255.255.255.0 nexthop-arp-interval 5
dmf-controller(config-switch-if)# rate-limit 1000
Create two managed services, one that is non-shareable and one with netflow, which can be shared:
Non-shared Managed Service
dmf-controller> enable
dmf-controller# configure
dmf-controller(config)# managed-service ms-non-shareable
dmf-controller(config-managed-srv)# service-interface switch sw1 ethernet2
dmf-controller(config-managed-srv)# 1 action sample
dmf-controller(config-managed-srv-sample)# max-tokens 100
dmf-controller(config-managed-srv-sample)# tokens-per-refresh 10
Shared Managed Service
dmf-controller> enable
dmf-controller# configure
dmf-controller(config)# managed-service ms-netflow
dmf-controller(config-managed-srv)# service-interface switch sw1 ethernet1
dmf-controller(config-managed-srv)# 1 action netflow
dmf-controller(config-managed-srv-netflow)# collector 0.0.0.2 udp-port 2055 mtu 1500
dmf-controller(config-managed-srv-netflow)# l3-delivery-interface l3-d1
Configure two policies, where the first policy, p1, has both ms-non-shareable and ms-netflow in order, and the second policy, p2, only has ms-netflow:
Policy 1
dmf-controller> enable
dmf-controller# configure
dmf-controller(config)# managed-service policy p1
dmf-controller(config-policy)# action forward
dmf-controller(config-policy)# 1 match any
dmf-controller(config-policy)# filter-interface f1
dmf-controller(config-policy)# use-managed-service ms-non-shareable sequence 1
dmf-controller(config-policy)# use-managed-service ms-netflow sequence 2
Policy 2
dmf-controller> enable
dmf-controller# configure
dmf-controller(config)# managed-service policy p2
dmf-controller(config-policy)# action forward
dmf-controller(config-policy)# 1 match any
dmf-controller(config-policy)# filter-interface f2
dmf-controller(config-policy)# use-managed-service ms-netflow sequence 1
In push-per-policy mode, both p1 and p2 are expected to be installed to send traffic to the ms-netflow pre-service interface, and a dynamic post-service policy p1_p2__post_to_delivery__ is created to carry the traffic from the post-service interface of ms-netflow to l3-d1.
In push-per-filter mode, a post service policy is created regardless of whether a managed service is shared or not. The result is two post service policies, p1__post_to_delivery__ and p2__post_to_delivery__, which will carry traffic from their respective configured policies to the delivery interface via the configured services.
The following section shows the runtime state of these policies.
Show Commands
While no new show commands accompany the Sharing Managed Services Across Policies feature, use the following existing commands to verify the configuration.
action keyword is required to add or modify actions within a managed service.Use the show running-config switch sw1 interface l3
interface command to view the configured L3 interface:
dmf-controller> show running-config switch sw1 interface ethernet31

! switch
switch sw1
  !
  interface ethernet31
    force-link-up
    rate-limit 1000
    role delivery interface-name l3-d1 ip-address 0.0.0.1 nexthop-ip 0.0.0.2 255.255.255.0 nexthop-arp-interval 5
Use the show running-config managed-service command to view the managed service running config:
dmf-controller> show running-config managed-service

! managed-service
managed-service ms-netflow
  service-interface switch sw1 ethernet1
  !
  1 action netflow
    collector 10.0.0.2 udp-port 2055 mtu 1500
    l3-delivery-interface l3-d1

managed-service ms-non-shareable
  service-interface switch sw1 ethernet2
  !
  1 action sample
    max-tokens 100
    tokens-per-refresh 10
Use the show running-config policy to view the policy running config:
dmf-controller> show running-config policy

! policy
policy p1
  action forward
  filter-interface f1
  use-managed-service ms-netflow sequence 2
  use-managed-service ms-non-shareable sequence 1
  1 match any

policy p2
  action forward
  filter-interface f2
  use-managed-service ms-netflow sequence 1
  1 match any
Use the show switch sw1 interface l3 interface command to view the runtime status of the interface:
dmf-controller> show switch sw1 interface ethernet31
# IF Name    MAC Address                Config State Adv. Features Curr Features Supported Features
-|----------|--------------------------|------|-----|-------------|-------------|------------------|
1 ethernet31 5c:16:c7:14:46:bb (Arista) up     up    10g           10g           10g
Use the show managed-service command to view the runtime status of the managed services:
dmf-controller># show managed-service
~~~~~~~~~~~~~~~~~~~~~~~~~~~~~~~~~~~~~~~~~~~~~~~~~~~~ Managed-service ~~~~~~~~~~~~~~~~~~~~~~~~~~~~~~~~~~~~~~~~~~~~~~~~~
# Service Name     Switch Switch Interface Installed Max Post-Service BW Max Pre-Service BW Total Post-Service BW Total Pre-Service BW
-|----------------|------|----------------|---------|-------------------|------------------|---------------------|--------------------|
1 ms-netflow       sw1    ethernet1        True      10Gbps              10Gbps             974bps                66bps
2 ms-non-shareable sw1    ethernet2        True      10Gbps              10Gbps             960bps                66bps
Push-per-policy Mode
The show policy command displays a brief version of runtime state of all policies, including those created dynamically:
dmf-controller> show policy
# Policy Name               Action  Runtime Status Type       Priority Overlap Priority Push VLAN Filter BW Delivery BW Post Match Filter Traffic Delivery Traffic Services         Installed Time          Installed Duration  Ptp Timestamping
-|-------------------------|-------|--------------|----------|--------|----------------|---------|---------|-----------|-------------------------|----------------|----------------|-----------------------|-------------------|----------------|
1 p1                        forward installed      Configured 100      0                1         10Gbps    10Gbps      -                         -                ms-non-shareable 2025-02-20 18:18:33 UTC 20 minutes, 46 secs False
2 p2                        forward installed      Configured 100      0                2         10Gbps    10Gbps      -                         -                                 2025-02-20 18:18:33 UTC 20 minutes, 46 secs False
3 p1_p2__post_to_delivery__ forward installed      Dynamic    100      0                3         10Gbps    10Gbps      -                         -                                 2025-02-20 18:18:33 UTC 20 minutes, 46 secs False
The show policy policy name command provides a more detailed view of a policy at runtime.
Since a new post-service policy is required for shared services in push-per-policy mode (in the push-per-filter mode, a post-service policy, shared or not, is always created), the configured policies are adjusted accordingly. So, p1 and p2 will neither have a ms-netflow service nor will l3-d1 be the delivery interface.
p1 carries traffic from f1 to ms-non-shareable and then delivers it to ms-netflow.
dmf-controller> show policy p1
Policy Name                            : p1
Config Status                          : active - forward
Runtime Status                         : installed
Detailed Status                        : installed - installed to forward
Priority                               : 100
Overlap Priority                       : 0
# of switches with filter interfaces   : 1
# of switches with delivery interfaces : 1
# of switches with service interfaces  : 1
# of filter interfaces                 : 1
# of delivery interfaces               : 1
# of core interfaces                   : 0
# of services                          : 1
# of pre service interfaces            : 1
# of post service interfaces           : 1
Push VLAN                              : 1
Post Match Filter Traffic              : -
Total Delivery Rate                    : -
Total Pre Service Rate                 : -
Total Post Service Rate                : -
Overlapping Policies                   : p1_p2__post_to_delivery__,
Component Policies                     : none
Runtime Service Names                  : ms-non-shareable
Installed Time                         : 2025-02-20 18:18:33 UTC
Installed Duration                     : 23 minutes, 18 secs
Timestamping enabled                   : False
~ Match Rules ~
# Rule
-|-----------|
1 1 match any

~~~~~~~~~~~~~~~~~~~~~~~~~~~~~~~~~ Filter Interface(s)  ~~~~~~~~~~~~~~~~~~~~~~~~~~~~~~~~~
# DMF IF Switch IF Name    State Dir Packets Bytes Pkt Rate Bit Rate Counter Reset Time
-|------|------|----------|-----|---|-------|-----|--------|--------|------------------|
1 f1     sw1    ethernet11 up    rx  0       0     0        -

~~~~~~~~~~~~~~~~~~~~~~~~~~~~~~~~~~~~~~~~~~~~~~ Delivery Interface(s) ~~~~~~~~~~~~~~~~~~~~~~~~~~~~~~~~~~~~~~~~~~~~~~
# DMF IF                             Switch IF Name   State Dir Packets Bytes Pkt Rate Bit Rate Counter Reset Time
-|----------------------------------|------|---------|-----|---|-------|-----|--------|--------|------------------|
1 sw1  -ethernet1-to-managed-service sw1    ethernet1 up    tx  2       140   0        -

~~~~~~~~~~~~~~~~~~~~~~~~~~~~~~~~~~~~~~~~~~~~ Service Interface(s) ~~~~~~~~~~~~~~~~~~~~~~~~~~~~~~~~~~~~~~~~~~~~
# Service name     Role         Switch IF Name   State Dir Packets Bytes Pkt Rate Bit Rate Counter Reset Time
-|----------------|------------|------|---------|-----|---|-------|-----|--------|--------|------------------|
1 ms-non-shareable pre-service  sw1    ethernet2 up    tx  0       0     0        -
2 ms-non-shareable post-service sw1    ethernet2 up    rx  2       140   0        -

~ Core Interface(s) ~
None.

~ Failed Path(s) ~
None.
p2 carries traffic from f2 to ms-netflow.
dmf-controller> show policy p2
Policy Name                            : p2
Config Status                          : active - forward
Runtime Status                         : installed
Detailed Status                        : installed - installed to forward
Priority                               : 100
Overlap Priority                       : 0
# of switches with filter interfaces   : 1
# of switches with delivery interfaces : 1
# of switches with service interfaces  : 0
# of filter interfaces                 : 1
# of delivery interfaces               : 1
# of core interfaces                   : 0
# of services                          : 0
# of pre service interfaces            : 0
# of post service interfaces           : 0
Push VLAN                              : 2
Post Match Filter Traffic              : -
Total Delivery Rate                    : -
Total Pre Service Rate                 : -
Total Post Service Rate                : -
Overlapping Policies                   : p1_p2__post_to_delivery__,
Component Policies                     : none
Installed Time                         : 2025-02-20 18:18:33 UTC
Installed Duration                     : 23 minutes, 21 secs
Timestamping enabled                   : False
~ Match Rules ~
# Rule
-|-----------|
1 1 match any

~~~~~~~~~~~~~~~~~~~~~~~~~~~~~~~~~ Filter Interface(s)  ~~~~~~~~~~~~~~~~~~~~~~~~~~~~~~~~~
# DMF IF Switch IF Name    State Dir Packets Bytes Pkt Rate Bit Rate Counter Reset Time
-|------|------|----------|-----|---|-------|-----|--------|--------|------------------|
1 f2     sw1    ethernet12 up    rx  0       0     0        -

~~~~~~~~~~~~~~~~~~~~~~~~~~~~~~~~~~~~~~~~~~~~~~ Delivery Interface(s) ~~~~~~~~~~~~~~~~~~~~~~~~~~~~~~~~~~~~~~~~~~~~~~
# DMF IF                             Switch IF Name   State Dir Packets Bytes Pkt Rate Bit Rate Counter Reset Time
-|----------------------------------|------|---------|-----|---|-------|-----|--------|--------|------------------|
1 sw1-ethernet1-to-managed-service   sw1    ethernet1 up    tx  0       0     0        -

~ Service Interface(s) ~
None.

~ Core Interface(s) ~
None.

~ Failed Path(s) ~
None.
p1_p2__post_to_delivery__ receives traffic from ms-netflow, and then delivers it to l3-d1.
dmf-controller> show policy p1_p2__post_to_delivery__
Policy Name                            : p1_p2__post_to_delivery__
Config Status                          : active - forward
Runtime Status                         : installed
Detailed Status                        : installed - installed to forward
Priority                               : 100
Overlap Priority                       : 0
# of switches with filter interfaces   : 1
# of switches with delivery interfaces : 1
# of switches with service interfaces  : 0
# of filter interfaces                 : 1
# of delivery interfaces               : 1
# of core interfaces                   : 0
# of services                          : 0
# of pre service interfaces            : 0
# of post service interfaces           : 0
Push VLAN                              : 3
Post Match Filter Traffic              : -
Total Delivery Rate                    : -
Total Pre Service Rate                 : -
Total Post Service Rate                : -
Overlapping Policies                   : none
Component Policies                     : p1, p2,
Installed Time                         : 2025-02-20 18:18:33 UTC
Installed Duration                     : 23 minutes, 28 secs
Timestamping enabled                   : False
~ Match Rules ~
None.
~~~~~~~~~~~~~~~~~~~~~~~~~~~~~~~~~~~~~~~~~~~~~~~ Filter Interface(s) ~~~~~~~~~~~~~~~~~~~~~~~~~~~~~~~~~~~~~~~~~~~~~~~
# DMF IF                             Switch IF Name   State Dir Packets Bytes Pkt Rate Bit Rate Counter Reset Time
-|----------------------------------|------|---------|-----|---|-------|-----|--------|--------|------------------|
1 sw1-ethernet1-to-managed-service   sw1    ethernet1 up    rx  1       70    0        -

~~~~~~~~~~~~~~~~~~~~~~~~~~~~~~~~ Delivery Interface(s)  ~~~~~~~~~~~~~~~~~~~~~~~~~~~~~~~~
# DMF IF Switch IF Name    State Dir Packets Bytes Pkt Rate Bit Rate Counter Reset Time
-|------|------|----------|-----|---|-------|-----|--------|--------|------------------|
1 l3-d1  sw1    ethernet31 up    tx  1       70    0        -

~ Service Interface(s) ~
None.

~ Core Interface(s) ~
None.

~ Failed Path(s) ~
None.
Another way of visualizing this runtime state is illustrated in the following diagram:
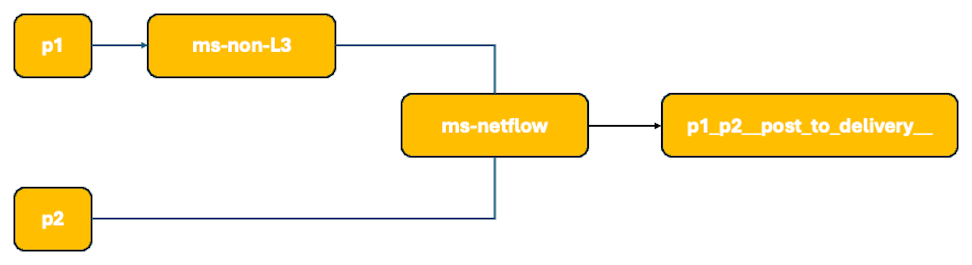
Push-per-filter Mode
The show
policy command displays a brief version of the runtime state of all policies, including any created dynamically:
dmf-controller> show policy # Policy Name Action Runtime Status Type Priority Overlap Priority Push VLAN Filter BW Delivery BW Post Match Filter Traffic Delivery Traffic Services Installed Time Installed Duration Ptp Timestamping -|----------------------|-------|---------------------------------|----------|--------|----------------|---------|---------|-----------|-------------------------|----------------|----------|-----------------------|-------------------|----------------| 1 p1 forward installed Configured 100 0 0 10Gbps 10Gbps - - 2025-02-20 19:13:39 UTC 15 minutes, 29 secs False 2 p2 forward installed Configured 100 0 0 10Gbps 10Gbps - - 2025-02-20 19:13:39 UTC 15 minutes, 29 secs False 3 p1__post_to_delivery__ forward installed Dynamic 100 0 0 10Gbps 10Gbps - - ms-netflow 2025-02-20 19:13:39 UTC 15 minutes, 29 secs False 4 p2__post_to_delivery__ forward installed Dynamic 100 0 0 10Gbps 10Gbps - - 2025-02-20 19:13:39 UTC 15 minutes, 29 secs False
The show policy policy name command provides a more detailed view of a policy at runtime:
p1 carries traffic from f1 to ms-non-shareable service.
dmf-controller> show policy p1 Policy Name : p1 Config Status : active - forward Runtime Status : installed Detailed Status : installed - installed to forward Priority : 100 Overlap Priority : 0 # of switches with filter interfaces : 1 # of switches with delivery interfaces : 1 # of switches with service interfaces : 0 # of filter interfaces : 1 # of delivery interfaces : 1 # of core interfaces : 0 # of services : 0 # of pre service interfaces : 0 # of post service interfaces : 0 Push VLAN : 0 Post Match Filter Traffic : - Total Delivery Rate : - Total Pre Service Rate : - Total Post Service Rate : - Overlapping Policies : p1__post_to_delivery__, Component Policies : none Installed Time : 2025-02-20 19:13:39 UTC Installed Duration : 17 minutes, 55 secs Timestamping enabled : False ~ Match Rules ~ # Rule -|-----------| 1 1 match any ~~~~~~~~~~~~~~~~~~~~~~~~~~~~~~~~~ Filter Interface(s) ~~~~~~~~~~~~~~~~~~~~~~~~~~~~~~~~~ # DMF IF Switch IF Name State Dir Packets Bytes Pkt Rate Bit Rate Counter Reset Time -|------|------|----------|-----|---|-------|-----|--------|--------|------------------| 1 f1 sw1 ethernet11 up rx 0 0 0 - ~~~~~~~~~~~~~~~~~~~~~~~~~~~~~~~~~~~~~~~~~~~~~~ Delivery Interface(s) ~~~~~~~~~~~~~~~~~~~~~~~~~~~~~~~~~~~~~~~~~~~~~~ # DMF IF Switch IF Name State Dir Packets Bytes Pkt Rate Bit Rate Counter Reset Time -|----------------------------------|------|---------|-----|---|-------|-----|--------|--------|------------------| 1 sw1-ethernet2-to-managed-service sw1 ethernet2 up tx 0 0 0 - ~ Service Interface(s) ~ None. ~ Core Interface(s) ~ None. ~ Failed Path(s) ~ None.
p2 carries traffic from f1 to ms-netflow service.
dmf-controller> show policy p2 Policy Name : p2 Config Status : active - forward Runtime Status : installed Detailed Status : installed - installed to forward Priority : 100 Overlap Priority : 0 # of switches with filter interfaces : 1 # of switches with delivery interfaces : 1 # of switches with service interfaces : 0 # of filter interfaces : 1 # of delivery interfaces : 1 # of core interfaces : 0 # of services : 0 # of pre service interfaces : 0 # of post service interfaces : 0 Push VLAN : 0 Post Match Filter Traffic : - Total Delivery Rate : - Total Pre Service Rate : - Total Post Service Rate : - Overlapping Policies : p2__post_to_delivery__, Component Policies : none Installed Time : 2025-02-20 19:13:39 UTC Installed Duration : 18 minutes, 44 secs Timestamping enabled : False ~ Match Rules ~ # Rule -|-----------| 1 1 match any ~~~~~~~~~~~~~~~~~~~~~~~~~~~~~~~~~ Filter Interface(s) ~~~~~~~~~~~~~~~~~~~~~~~~~~~~~~~~~ # DMF IF Switch IF Name State Dir Packets Bytes Pkt Rate Bit Rate Counter Reset Time -|------|------|----------|-----|---|-------|-----|--------|--------|------------------| 1 f2 sw1 ethernet12 up rx 0 0 0 - ~~~~~~~~~~~~~~~~~~~~~~~~~~~~~~~~~~~~~~~~~~~~~~ Delivery Interface(s) ~~~~~~~~~~~~~~~~~~~~~~~~~~~~~~~~~~~~~~~~~~~~~~ # DMF IF Switch IF Name State Dir Packets Bytes Pkt Rate Bit Rate Counter Reset Time -|----------------------------------|------|---------|-----|---|-------|-----|--------|--------|------------------| 1 sw1-ethernet1-to-managed-service sw1 ethernet1 up tx 0 0 0 - ~ Service Interface(s) ~ None. ~ Core Interface(s) ~ None. ~ Failed Path(s) ~ None.
p1__post_to_delivery__ carries traffic from ms-non-shareable to ms-netflow and then to l3-d1.
dmf-controller> show policy p1__post_to_delivery__ Policy Name : p1__post_to_delivery__ Config Status : active - forward Runtime Status : installed Detailed Status : installed - installed to forward Priority : 100 Overlap Priority : 0 # of switches with filter interfaces : 1 # of switches with delivery interfaces : 1 # of switches with service interfaces : 1 # of filter interfaces : 1 # of delivery interfaces : 1 # of core interfaces : 0 # of services : 1 # of pre service interfaces : 1 # of post service interfaces : 1 Push VLAN : 0 Post Match Filter Traffic : - Total Delivery Rate : - Total Pre Service Rate : - Total Post Service Rate : - Overlapping Policies : none Component Policies : p1, Runtime Service Names : none Timestamping enabled : False ~ Match Rules ~ None. ~~~~~~~~~~~~~~~~~~~~~~~~~~~~~~~~~~~~~~~~~~~~~~~ Filter Interface(s) ~~~~~~~~~~~~~~~~~~~~~~~~~~~~~~~~~~~~~~~~~~~~~~~ # DMF IF Switch IF Name State Dir Packets Bytes Pkt Rate Bit Rate Counter Reset Time -|----------------------------------|------|---------|-----|---|-------|-----|--------|--------|------------------| 1 sw1-ethernet2-to-managed-service sw1 ethernet2 up rx 0 0 0 - ~~~~~~~~~~~~~~~~~~~~~~~~~~~~~~~~ Delivery Interface(s) ~~~~~~~~~~~~~~~~~~~~~~~~~~~~~~~~ # DMF IF Switch IF Name State Dir Packets Bytes Pkt Rate Bit Rate Counter Reset Time -|------|------|----------|-----|---|-------|-----|--------|--------|------------------| 1 l3-d1 sw1 ethernet31 up tx 0 0 0 - ~~~~~~~~~~~~~~~~~~~~~~~~~~~~~~~~~~~~~~~~~~ Service Interface(s) ~~~~~~~~~~~~~~~~~~~~~~~~~~~~~~~~~~~~~~~~~~ # Service name Role Switch IF Name State Dir Packets Bytes Pkt Rate Bit Rate Counter Reset Time -|------------|------------|------|---------|-----|---|-------|-----|--------|--------|------------------| 1 ms-netflow pre-service sw1 ethernet1 up tx 0 0 0 - 2 ms-netflow post-service sw1 ethernet1 up rx 0 0 0 - ~ Core Interface(s) ~ None. ~ Failed Path(s) ~ None.
p2__post_to_delivery__ carries traffic from ms-netflow to l3-d1.
dmf-controller> show policy p2__post_to_delivery__ Policy Name : p2__post_to_delivery__ Config Status : active - forward Runtime Status : installed Detailed Status : installed - installed to forward Priority : 100 Overlap Priority : 0 # of switches with filter interfaces : 1 # of switches with delivery interfaces : 1 # of switches with service interfaces : 0 # of filter interfaces : 1 # of delivery interfaces : 1 # of core interfaces : 0 # of services : 0 # of pre service interfaces : 0 # of post service interfaces : 0 Push VLAN : 0 Post Match Filter Traffic : - Total Delivery Rate : - Total Pre Service Rate : - Total Post Service Rate : - Overlapping Policies : none Component Policies : p2, Installed Time : 2025-02-20 19:13:39 UTC Installed Duration : 22 minutes, 19 secs Timestamping enabled : False ~ Match Rules ~ None. ~~~~~~~~~~~~~~~~~~~~~~~~~~~~~~~~~~~~~~~~~~~~~~~ Filter Interface(s) ~~~~~~~~~~~~~~~~~~~~~~~~~~~~~~~~~~~~~~~~~~~~~~~ # DMF IF Switch IF Name State Dir Packets Bytes Pkt Rate Bit Rate Counter Reset Time -|----------------------------------|------|---------|-----|---|-------|-----|--------|--------|------------------| 1 sw1-ethernet1-to-managed-service sw1 ethernet1 up rx 0 0 0 - ~~~~~~~~~~~~~~~~~~~~~~~~~~~~~~~~ Delivery Interface(s) ~~~~~~~~~~~~~~~~~~~~~~~~~~~~~~~~ # DMF IF Switch IF Name State Dir Packets Bytes Pkt Rate Bit Rate Counter Reset Time -|------|------|----------|-----|---|-------|-----|--------|--------|------------------| 1 l3-d1 sw1 ethernet31 up tx 0 0 0 - ~ Service Interface(s) ~ None. ~ Core Interface(s) ~ None. ~ Failed Path(s) ~ None.
Another way of visualizing this runtime state is illustrated in the following diagram:
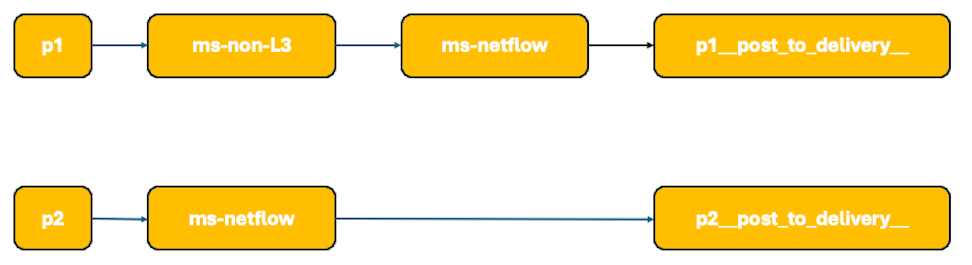
Troubleshooting
If any failures occur by the sharing of L3 managed services between policies, ensure the order of services shared by all policies is the same, i.e., the order of services matters and partially sharing the sequence is not allowed:
- Policy
p1cannot havems1→ms2, while policyp2already hasms2→ms1. - Policy
p1cannot havems1→ms2, while policyp2only hasms1.
Limitations
- When creating a post-service policy, configured policies are modified at runtime. So, the runtime state of a configured policy will show the modified delivery interfaces and services. You must use configured and dynamic policies to visualize the complete path.
- Not all managed service actions can be shared.
- Shared managed services must be the last in the sequence, and in the same order for all policies using it. Partial sharing of a sub-sequence of services is not allowed. Policy
p1cannot havems1→ms2, while policyp2only hasms1.
Application Identification
Using the CLI to Configure Application Identification
Configure the feature through the Controller in managed services.
Using the CLI to Configure app-id
Perform the following steps to configure app-id:
action keyword is required to add or modify actions within a managed service.The following shows an example of an app-id configuration that sends IPFIX application records to the Collector (analytics node) at IP address 192.168.1.1 over the configured delivery interface named app-to-analytics:
managed-service ms service-interface switch core1 ethernet2 ! 1 action app-id collector 192.168.1.1 l3-delivery-interface app-to-analytics
After configuring the app-id, refer to the analytics node for application reports and visualizations. For instance, a flow is classified internally with the following tuple: ip, tcp, http, google, and google_maps. Consequently, the analytics node displays the most specific app ID for this flow as google_maps under appName.
On the Analytics Node, there are AppIDs 0-4 representing applications according to their numerical IDs. 0 is the most specific application identified in that flow, while 4 is the least. In the example above, ID 0 would be the numerical ID for google_maps, ID 1 google, ID 2 http, ID 3 tcp, and ID 4 IP address. Use the appName in place of these since these require an ID to name mapping to interpret.
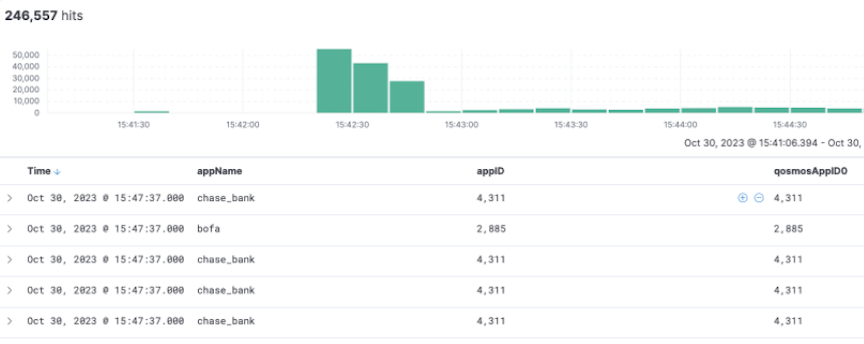
Using the CLI to Configure app-id-filter
Perform the following steps to configure app-id-filter:
Using the CLI to Configure app-id and app-id-filter Combined
Follow the configuration steps described in the services earlier to configure app-id-filter and app-id together. However, in this case, app-id should use a higher seq num than app-id-filter. Thus, the traffic is processed through the app-id-filter policy first, then through app-id.
This behavior can be helpful to monitor certain types of traffic. The following example illustrates a combined app-id-filter and app-id configuration.
action keyword is required to add or modify actions within a managed service.! managed-service managed-service MS1 service-interface switch CORE-SWITCH-1 ethernet2 ! ! 1 action app-id-filter app facebook filter-mode forward ! 2 action app-id collector 1.1.1.1 l3-delivery-interface L3-INTF-1
app-id dropping all traffic except facebook, and this type of service chaining can cause a performance hit and high memory utilization.Dynamic Signature Updates (Beta Version)
This beta feature allows the app-id and app-id-filter services to classify newly supported applications at runtime rather than waiting for an update in the next DANZ Monitoring Fabric (DMF) release. Perform such runtime service updates during a maintenance cycle. There can be issues with backward compatibility if attempting to revert to an older bundle. Adopt only supported versions. In the Controller’s CLI, perform the following recommended steps:
- fetch: after a successful fetch on the active Controller, it invokes the fetch RPC on the standby Controller by providing a signed HTTP URL as the source. This URL points to an internal REST API that provides the recently fetched signature file.
- delete: the active Controller invokes the delete RPC call on the standby controllers.
The Controller stores the signature files in this location: /var/lib/capture/appidsignatureupdate.
- Verify the bundle version on the service node by entering the
show service-node app-id-bundle-versioncommand in the service node CLI, as shown below.Figure 186. Before Update 
Figure 187. After Update 
Show Commands
Service Node
show command:
show service-node app-id-bundle-versionThis command shows the version of the bundle in use. An
app-id or app-id-filter instance must be configured, or an error message is displayed.
dmf-servicenode-1# show app-id bundle-version Name : bundle_version Data : 1.680.0-22 (build date Sep 26 2023) dmf-servicenode-1#
Controller
To obtain more information about the running version on a Service Node, or when the last push attempt was made and the outcome, use the following Controller CLI commands:
show app-id push-results optional SN nameshow service-node SN name app-id
dmf-controller-1# show app-id push-results # Name IP Address Current Version Current Push Time Previous Version Previous Push Time Last Attempt Version Last Attempt Time Last Attempt Result Last Attempt Failure Reason -|-----------------|--------------|---------------|------------------------------|----------------|------------------------------|--------------------|------------------------------|-------------------|---------------------------| 1 dmf-servicenode-1 10.240.180.124 1.660.2-33 2023-12-06 11:13:36.662000 PST 1.680.0-22 2023-09-29 16:21:11.034000 PDT 1.660.2-33 2023-12-06 11:13:34.085000 PST success
dmf-controller-1# show service-node dmf-servicenode-1 app-id # Name IP Address Current Version Current Push Time Previous Version Previous Push Time Last Attempt Version Last Attempt Time Last Attempt Result Last Attempt Failure Reason -|-----------------|--------------|---------------|------------------------------|----------------|------------------|--------------------|-----------------|-------------------|---------------------------| 1 dmf-servicenode-1 10.240.180.124 1.680.0-22 2023-09-29 16:21:11.034000 PDT
show app-id signature-files command displays the validated files that are available to push to Service Nodes.
dmf-controller-1# show app-id signature-files # Signature-file Checksum Fetch time -|-----------------|-----------------|------------------------------| 1 file1.tar.gz abcdefgh12345 2023-08-02 22:20:49.422000 UTC 2 file2.tar.gz ijklmnop67890 2023-08-03 07:10:22.123000 UTC
show analytics app-info
filter-interface-name command displays aggregated information over the last 5 minutes about the applications seen on a given filter interface, sorted by unique flow count. This command also has an optional size option to limit the number of results, default is all.
push-per-filter mode.dmf-controller-1# show analytics app-info filter-interface f1 size 3 # App name Flow count -|--------|----------| 1 app1 1000 2 app2 900 3 app3 800
Syslog Messages
Syslog messages for configuring the app-id and app-id-filter services appear in a service node’s syslog through journalctl.
A Service Node syslog registers events for the app-id add, modify, and delete actions.
These events contain the keywords dpi and dpi-filter, which correspond to app-id and app-id-filter.
For example:
Adding dpi for port, Modifying dpi for port, Deleting dpi for port, Adding dpi filter for port, Modifying dpi filter for port, Deleting dpi filter for port, App appname does not exist - An invalid app name was entered.
The addition, modification, or deletion of app names in an app-id-filter managed-service in the Controller node’s CLI influences the policy refresh activity, and these events register in floodlight.log.
Scale
- Max concurrent sessions are currently set to permit less than 200,000 active flows per core. Performance may drop the more concurrent flows there are. This value is a maximum value to prevent the service from overloading. Surpassing this threshold may cause some flows not to be processed, and the new flows will not be identified or filtered. Entries for inactive flows will time out after a few minutes for ongoing sessions and a few seconds after the session ends.
- If there are many inactive sessions, DMF holds the flow contexts, reducing the number of available flows used for DPI. The timeouts are approximately 7 minutes for TCP sessions and 1 minute for UDP.
- Heavy application traffic load degrades performance.
Troubleshooting
- If IPFIX reports do not appear on an Analytics Node (AN) or Collector, ensure the UDP port is configured correctly and verify the AN receives traffic.
- If the
app-id-filterapp list does not appear, ensure a Service Node (SN) is connected using the show service-node command on the Controller. - For
app-id-filter, enter at least one valid application from the list that appears using <Tab>. If not, the policy will fail to install with an error message app-id-filter specified without at least one name TLV identifying application. - A flow may contain other IDs and protocols when using
app-id-filter.For example, the specific application for a flow may begoogle_maps, but there may be protocols or broader applications under it, such asssh,http, orgoogle. Addinggoogle_mapswill filter this flow. However, addingsshwill also filter this flow. Therefore, adding any of these to the filter list will cause packets of this flow to be forwarded or dropped. - An IPFIX element, BSN type 14, that existed in DMF version 8.4 was removed in 8.6.
- During a dynamic signature update, if a SN reboot occurs, it will likely boot up with the correct version. To avoid issues of traffic loss, perform the update during a maintenance window. Also, during an update, the SN will temporarily not send LLDP packets to the Controller and disconnect for a short while.
- After a dynamic signature update, do not change configurations or push another signature file for several minutes. The update will take some time to process. If there are any VFT changes, it may lead to warning messages in floodlight, such as:
Sync job 2853: still waiting after 50002 ms Stuck switch update: R740-25G[00:00:e4:43:4b:bb:38:ca], duration=50002ms, stage=COMMIT
These messages may also appear when configuring DPI on a large number of ports.
Limitations
- When using a drop filter, a few packets may slip through the filter before determining an application ID for a flow, and when using a forward filter, a few packets may not be forwarded. Such a small amount is estimated to be between 1 and 6 packets at the beginning of a flow.
- When using a drop filter, add the
unknownapp ID to the filter list to drop any unidentified traffic if these packets are unwanted. - The Controller must be connected to a Service Node for the
app-id-filterapp list to appear. If the list does not appear and the application names are unknown, use theapp-idto send reports to the analytics node. Use the application names seen there to configure anapp-id-filter. The name must match exactly. - Since
app-categorydoes not currently show the applications included in that category, do not use it when targeting specific apps. Categories like basic, which include all basic networking protocols like TCP and UDP, may affect all flows. - For
app-id, a report is only generated for a fully classified flow after that flow has been fully classified. Therefore, the number of reported applications may not match the total number of flows. These reports are sent after enough applications are identified on the Service Node. If many applications are identified, DMF sends the reports quickly. However, DMF sends these reports every 10 seconds when identifying only a few applications. - DMF treats a bidirectional flow as part of the same n-tuple. As such, generated reports contain the client's source IP address and the server's destination IP address.
- While configuring many ports with the
app-id, there may occasionally be a few Rx drops on the 16 port machines at a high traffic rate in the first couple of seconds. - The feature uses a cache that maps dest ip and port to the application. Caching may vary the performance depending on the traffic profile.
- The
app-idandapp-id-filterservices are more resource-intensive than other services. Combining them in a service chain or configuring many instances of them may lead to degradation in performance. - At scale, such as configuring 16 ports on the R740 DCA-DM-SEL,
app-idmay take a few minutes to set up on all these ports, and this is also true when doing a dynamic signature update. - The
show analytics app-infocommand only works inpush-per-filterVLAN mode. -
Mapping an interface-name with identified application IDs from source traffic received via the filter interface at Analytics Dashboard is allowed in Push-Per-Filter Mode only.
Deduplication Action
The DANZ Monitoring Fabric (DMF) Service Node enhances the efficiency of network monitoring tools by eliminating duplicate packets. Duplicate packets can be introduced into the out-of-band monitoring data stream by receiving the same flow from multiple TAP or SPAN ports spread across the production network. Deduplication eliminates these duplicate packets and enables more efficient use of passive monitoring tools.
- Full packet deduplication: deduplicates incoming packets that are identical at the L3/L4 layers.
-
Payload routed packet deduplication: Routed Deduplication with L4 Payload and Salt. This skips TCP/UDP headers in hashing, allowing duplicate detection based on identical payloads even if header fields like timestamps differ.
- Routed packet deduplication: as packets traverse an IP network, the MAC address changes from hop to hop. Routed packet deduplication enables users to match packet contents starting from the L3 header.
- L4 Payload Start: NATed packet deduplication: to perform NATed deduplication, the service node compares packets in the configured window that are identical starting from the L4 payload. To use NATed packet deduplication, perform the following fields as required:
- Anchor: Packet Start, L3 Header Start, L4 Header Start, or L4 Payload Start fields.
- Offset: the number of bytes from the anchor where the deduplication check begins.
- Window Size: The time window in which the service looks for duplicate packets is configurable. Select a value among these choices: 2ms (the default), 4ms, 6ms, and 8ms.
CLI Configuration
action keyword is required to add or modify actions within a managed service.Controller-1(config)# show running-config managed-service MS-DEDUP-FULL-PACKET ! managed-service managed-service MS-DEDUP-FULL-PACKET description 'This is a service that does Full Packet Deduplication' 1 action dedup full-packet window 8 service-interface switch CORE-SWITCH-1 ethernet13/1 Controller-1(config)#
Controller-1(config)# show running-config managed-service MS-DEDUP-ROUTED-PACKET ! managed-service managed-service MS-DEDUP-ROUTED-PACKET description 'This is a service that does Routed Packet Deduplication' 1 action dedup routed-packet window 8 service-interface switch CORE-SWITCH-1 ethernet13/2 Controller-1(config)#
Controller-1(config)# show running-config managed-service MS-DEDUP-NATTED-PACKET ! managed-service managed-service MS-DEDUP-NATTED-PACKET description 'This is a service that does Natted Packet Deduplication' 1 action dedup anchor-offset l4-payload-start 0 window 8 service-interface switch CORE-SWITCH-1 ethernet13/3 Controller-1(config)#
show managed-service-device
Service-Node-Name stats dedup-service-name
dedup.
Controller-1(config)# show managed-service-device DMF-SN-R740-1 stats MS-DEDUP dedup ~~~~~~~~~~~~~~~~ Stats ~~~~~~~~~~~~~~~~ Interface Name : sni16 Function : dedup Service Name : MS-DEDUP Rx packets : 9924950 Rx bytes : 4216466684 Rx Bit Rate : 1.40Gbps Applied packets : 9923032 Applied bytes : 4216337540 Applied Bit Rate : 1.40Gbps Tx packets : 9796381 Tx bytes : 4207106113 Tx Bit Rate : 1.39Gbps Deduped frame count : 126651 Deduped percent : 1.2763336851075358 Load : low Controller-1(config)#
Routed Deduplication
The DMF Controller supports a payload-routed-packet deduplication option. This feature allows service nodes to combine the L4 payload start anchor point with routed salt (L3 IP addresses, L4 source/destination ports, and other L3 header fields).
Anchoring the deduplication range at the L4 payload start ensures that frames with identical payload content are identified as duplicates, even when TCP headers—such as frequently updated timestamps—differ. This method effectively skips TCP/UDP headers and options during hash computation.
Functional Benefits
- Optimized Bandwidth: The Service Node identifies and drops retransmitted packets containing identical data, preventing unnecessary traffic from reaching monitoring tools.
- Precise Flow Identification: Using routed salt ensures the system maintains visibility into L3 and L4 flow identifiers while focusing the deduplication logic on the payload.
- Reduced Processing Overhead: Monitoring tools receive only unique payload content, lowering the computational load on analytics engines.
Configuration and Functional Impact
Adding the payload-routed-packet option provides granular control over how the system processes retransmitted frames.
- Deduplication Logic: The Service Node uses the same routed salt to maintain flow identification, but shifts the hash computation range to start after the transport-layer headers.
- Data Integrity: DMF identifies frames as duplicates only when their payloads match within the same flow, ensuring that distinct data remains intact while redundant retransmissions are filtered.
- Backward Compatibility: DMF maintains existing deduplication behavior under the name
header-routed-packet. Automatic configuration migration ensures that current deployments maintain their existing behavior upon upgrade without manual intervention.
All dedup supporting Service Nodes support Routed Deduplication with L4 Payload and Salt.
Configuration
In the deduplication managed service configuration, the implementation replaces the single routed-packet option with two distinct settings for the region command. To access these options, first define a deduplication action using the [index] action dedup command within the config-managed-srv mode.
The region command defines the scope of the hash computation using the following four values:
-
full-packet: Performs complete packet deduplication starting from the beginning of the frame. -
header-routed-packet: Enables L4 header-based routed deduplication using routed salt (L3 IP addresses and L4 ports). -
payload-routed-packet: Enables L4 payload-based routed deduplication using routed salt, effectively skipping transport-layer headers to focus on payload content. -
anchor-offset: Supports advanced custom configurations for specific byte ranges. This option facilitates L4 header and payload-based deduplication without incorporating salted fields.
Routed Deduplication with L4 Payload and Salt
The DMF Controller supports a payload-routed-packet deduplication option. This feature allows service nodes to combine the L4 payload start anchor point with routed salt (L3 IP addresses, L4 source/destination ports, and other L3 header fields).
Anchoring the deduplication range at the L4 payload start ensures that frames with identical payload content are identified as duplicates, even when TCP headers—such as frequently updated timestamps—differ. This method effectively skips TCP/UDP headers and options during hash computation.
Functional Benefits
- Optimized Bandwidth: The Service Node identifies and drops retransmitted packets containing identical data, preventing unnecessary traffic from reaching monitoring tools.
- Precise Flow Identification: Using routed salt ensures the system maintains visibility into L3 and L4 flow identifiers while focusing the deduplication logic on the payload.
- Reduced Processing Overhead: Monitoring tools receive only unique payload content, lowering the computational load on analytics engines.
Configuration and Functional Impact
Adding the payload-routed-packet option provides granular control over how the system processes retransmitted frames.
- Deduplication Logic: The Service Node uses the same routed salt to maintain flow identification, but shifts the hash computation range to start after the transport-layer headers.
- Data Integrity: DMF identifies frames as duplicates only when their payloads match within the same flow, ensuring that distinct data remains intact while redundant retransmissions are filtered.
- Backward Compatibility: DMF maintains existing deduplication behavior under the name
header-routed-packet. Automatic configuration migration ensures that current deployments maintain their existing behavior upon upgrade without manual intervention.
All dedup supporting Service Nodes support Routed Deduplication with L4 Payload and Salt.
Configuration
In the deduplication managed service configuration, the implementation replaces the single routed-packet option with two distinct settings for the region command. To access these options, first define a deduplication action using the [index] action dedup command within the config-managed-srv mode.
The region command defines the scope of the hash computation using the following four values:
-
full-packet: Performs complete packet deduplication starting from the beginning of the frame. -
header-routed-packet: Enables L4 header-based routed deduplication using routed salt (L3 IP addresses and L4 ports). -
payload-routed-packet: Enables L4 payload-based routed deduplication using routed salt, effectively skipping transport-layer headers to focus on payload content. -
anchor-offset: Supports advanced custom configurations for specific byte ranges. This option facilitates L4 header and payload-based deduplication without incorporating salted fields.
Command Line Interface
The following example demonstrates entering the managed service mode and the deduplication action sub-mode to apply the desired region.
action keyword is required to add or modify actions within a managed service.dmf-controller-1(config)# managed-service managed_service_1 dmf-controller-1(config-managed-srv)# service-interface switch delivery1 ethernet1 dmf-controller-1(config-managed-srv)# 1 action dedup dmf-controller-1(config-managed-srv-dedup)# region [header-routed-packet | payload-routed-packet]
show command structure supports this enhancement.Flow Diff Latency and Drop Analysis
Latency and drop information help determine if there is a loss in a particular flow and where the loss occurred. A Service Node action configured as a DANZ Monitoring Fabric (DMF) managed service has multiple separate taps or spans in the production network and can measure the latency of a flow traversing through any pair of these points. It can also detect packet drops between any two points in the network if the packet only appears on one point within a specified time frame, currently set to 200ms.
Latency and drop analysis require Precision Time Protocol (PTP) time-stamped packets. The DMF PTP timestamping feature applies these timestamps as packets enter the monitoring fabric.
The Service Node accumulates latency values by flow and sends IPFIX data records with each flow's 5-tuple and ingress and egress identifiers. It sends IPFIX data records to the Analytics Node after collecting a specified number of values for a flow or when a timeout occurs for the flow entry. The threshold count is 10,000 packets, and the flow timeout is 4 seconds.
push-per-filter mode. Only basic statistics, such as min, max, and mean, are available. These statistics are the computed difference in timestamps, or latency, between two tap point pairs of packets within a flow.Use the DMF Analytics Node to build custom dashboards to view and check the data.
Configure Flow Diff Latency and Drop Analysis
flow-diff. Arista recommends using a dedicated flow-diff service policy for this feature to work effectively.
Flow-diff configuration configures multiple tap point pairs, or a multicast group with sources, receivers, and group IPs. DMF analyzes traffic flowing between these tap points for latency or drops. A tap point pair comprises a source and a destination tap point, identified by the filter interface or filter interface group. Whereas the multicast groups can be seen as a tap point triplet consisting of sources, receivers, and group IP.
Filter interfaces carrying both unicast and multicast traffic will need to be configured as part of tap-point-pair and tap-point-multicast-group in separate managed services.
Based on the configuration, configuring the Service Node with traffic metadata tells the Service Node where to look for tap point information, timestamps, and the IPFIX collector.
Configure appropriate DMF Policies to deliver traffic tapped from tap point pairs in the network to the configured Service Node interface for analysis.
Configuration Steps for flow-diff.
action keyword is required to add or modify actions within a managed service.The following example illustrates configuring flow-diff using the steps mentioned earlier:
dmf-controller-1(config)# managed-service managed_service_1 dmf-controller-1(config-managed-srv)# service-interface switch delivery1 ethernet1 dmf-controller-1(config-managed-srv)# 1 action flow-diff dmf-controller-1(config-managed-srv-flow-diff)# collector 192.168.1.1 dmf-controller-1(config-managed-srv-flow-diff)# l3-delivery-interface l3-iface-1 dmf-controller-1(config-managed-srv-flow-diff)# tap-point-pair source filter-interface f1 destination filter-interface f2 dmf-controller-1(config-managed-srv-flow-diff)# tap-point-multicast-group mg1 dmf-controller-1(config-managed-srv-flow-diff)# latency-table-size [small|medium|large] dmf-controller-1(config-managed-srv-flow-diff)# packet-timeout 200 dmf-controller-1(config-managed-srv-flow-diff)# flow-timeout 4000 dmf-controller-1(config-managed-srv-flow-diff)# sample-count-threshold 10000 dmf-controller-1(config-managed-srv-flow-diff)# delivery-requirement [all-destinations | any-destination] dmf-controller-1(config-managed-srv-flow-diff)# report-types dmf-controller-1(config-managed-srv-flow-diff-report)# drop | no drop dmf-controller-1(config-managed-srv-flow-diff-report)# latency | no latency
Configuring Tap Points
Unicast Tap Points
tap-point-pairflow-diff submode specifying two identifiers: filter interface name, and filter-interface-groupdmf-controller-1(config-managed-srv-flow-diff)# tap-point-pair source <Tab> filter-interface filter-interface-group
The filter-interface-group option takes in any configured filter interface group used to represent a collection of tap points in push-per-filter mode. This is an optional command to use when a group of tap points exists, all expecting traffic from the same source or group of source tap points for ease of configuration. For example:
- Instead of having two separate
tap-point-pairsto represent A → B, A → C, use afilter-interface-groupG= [B, C], and only one tap-point-pair A → G.dmf-controller-1(config-managed-srv-flow-diff)# tap-point-pair source type A destination filter-interface-group G
- With a topology like A → C and B → C, configure a
filter-interface-groupG= [A, B], andtap-point-pairG → C.dmf-controller-1(config-managed-srv-flow-diff)# tap-point-pair source filter-interface-group G destination type C
Multicast Tap Points
Configure multicast tap points using tap-point-multicast-group parameters in the flow-diff submode specifying the multicast group names.
dmf-controller-1(config-managed-srv-flow-diff)# tap-point-multicast-group multicast group name
Multicast group is flattened by the group IPs and converted into tap point triplets of the form of sources, receivers, and group-ip. When a multicast group is used as a tap point, then the receiver group in the multicast group config only applies to packets destined for the group IP address. This allows the action to be configured for multiple multicast groups that have the same source, but different destinations.
Restrictions
There are some restrictions to keep in mind while configuring tap-point-pairs and tap-point-multicast-groups:
- A
sourceanddestinationmust exist and cannot refer to the same tap point. - A multicast group must have
sources,receivers, andgroup IPsconfigured, and the sources and receivers must not overlap. - The configured
filter-interface-groupmust not partially overlap with other groups, including the multicast groupsourcesandreceiversused by the sameflow-diffmanaged service and cannot have more than 128 members. The same applies to any multicast group being used byflow-diff. - When configuring multiple
tap-point-pairsusingfilter-interfaceandfilter-interface-group, ortap-point-mulitcast-group, if a filter interface is used individually, it can only be referenced in afilter-interface-groupormulticast-groupsources or receiver groups if these groups only consist of that one filter interface. - The configuration supports a maximum of
4094unique tap point groups. This limit applies globally to the fabric and encompasses allflow-diffservices. Tap point group uniqueness depends on the constituent filter interfaces. For example, an individual filter interfaceF1and a filter interface groupFG1containing only that same interfaceF1represent the same unique group. Similarly, a multicast group utilizing either the individual interfaceF1or the single-interface groupFG1as a source or receiver refers to the same underlying interface group.
If an interface group has more than one LAG grouping where each LAG contains multiple ids, only one member id of each LAG is required. Subsequent ids of the LAG will not have latency computed if they are found.
The existence of the delivery-requirement flag changes the drop reporting for interface group pairs. When set to any-destination, the packet only needs to be seen on any one of the configured destination interfaces, when set to all-destinations, the packet must arrive on all matching destinations, otherwise the system generates a drop report for each interface where the packet was unseen.
Configuring Multicast Group
flow-diff service will fail if the sources and receivers have more than 128 filter interfaces.
dmf-controller-1(config)# multicast-group mg1 dmf-controller-1(config-multicast-group)# source filter-interface f1 dmf-controller-1(config-multicast-group)# source filter-interface-group fg1 dmf-controller-1(config-multicast-group)# receiver filter-interface f2 dmf-controller-1(config-multicast-group)# receiver filter-interface-group fg2 dmf-controller-1(config-multicast-group)# group-ip 224.0.0.1 dmf-controller-1(config-multicast-group)# group-ip 224.0.0.2
Configuring Policy
Configure the policies so that the same packet can be tapped from two independent points in the network and then sent to the Service Node.
After creating a policy, add the managed service with flow-diff action as shown in the following example:
dmf-controller-1 (config-policy)# use-managed-service service name sequence 1
There are several things to consider while configuring policies in push-per-filter mode:
- Only one policy can contain the
flow-diffservice action. - A policy should have all
filter-interfacesandfilter-interface-groupsconfigured as tap points in theflow-diffconfiguration. Any missing filter interfaces and groups in a policy may result in reporting drops as these packets do not forward from one end of thetap-point-pairto the Service Node. Similarly, for thetap-point-multicast-group, the configuration must include the filter interfaces and groups used as sources and receivers in the policy. - It’s also advisable not to add any filter interfaces (groups) that are not in the
tap-point-pairsortap-point-multicast-groupsas their latency and drop analysis will not be done, causing unnecessary packets to be forwarded to the Service Node, which are then reported as unexpected. - Ensure accurate timestamping and avoid unexpected report types by correctly ordering the source and destination for tap point pairs. Tap point pairs are not bidirectional so to compute latencies for both directions add the reverse ordering of the tap point pair.
dmf-controller-1 (config-policy)# use-timestamping
Configuring PTP Timestamping
This feature depends on configuring PTP timestamping for the packet stream going through the tap points. Refer to the Resources section for more information on setting up PTP timestamping functionality. Arista strongly recommends using replace-src-mac for this feature until revised, as performance and Service Node compatibility may vary for add-header-after-l2.
Analytics Node
IPFIX reports received on the analytics node can be of one of the following types, indicated by the reportType field:
- 0 is a valid latency report with the latency computed between the two tap point pairs.
- 1 means it is a drop report, which means the packet didn’t arrive at its destination. If the egress identifier field is also 0, the packet was only received at one tap point. If the egress identifier contains a nonzero value, that means one or a few of the LAG groupings associated with a destination interface group did not receive any packets associated with an id in that LAG. The egress identifier field is filled with the id of one of the members in that LAG group.
- 2 means unexpected, which can be caused by packets with identifiers not included in any tap point pairs or a misordering of timestamps where the destination comes before the source tap.
- 3 means overflow, where this same packet appears at too many tap points. The system ignores packets that surpass the maximum tap points. Currently, this should not exceed 40, including the source tap point.
VXLAN
When using VXLAN, the headers of these packets must be decapsulated before they can be processed by flow-diff on the Service Node. The filter switch must perform the decapsulation. If encapsulated packets appear at one tap point and non-encapsulated packets at the other endpoint, the service requires both of these packets to be decapsulated. Arista recommends using the following process to ensure flow-diff works correctly.
- Configure the filter interface receiving the VXLAN encapsulated traffic to perform decapsulation.
- If the receiving VXLAN traffic appears with non-default port number
4789, configure the filter switch with a non-default port number as shown in the following example:filter-switch-1# configure filter-switch-1(config)# interface Vxlan 1 filter-switch-1(config-if-Vx1)# vxlan udp-port customer port interface Vxlan1 vxlan udp-port customer port
Show Commands
The following show commands provide helpful information.
action keyword is required to add or modify actions within a managed service.show running-config managed-service managed
service command helps verify whether the flow-diff configuration is complete.
dmf-controller-1(config)# show running-config managed-service ms1
! managed-service
managed-service ms1
service-interface switch DCS-7050CX3-32S ethernet2/4
!
1 action flow-diff
collector 192.168.1.1
l3-delivery-interface AN-Data
tap-point-pair source filter-interface ingress destination filter-interface egress
tap-point-multicast-group mg1
delivery-requirement any-destination
!
report-types
drop
latency
show managed-services managed service command provides status information about the service.
dmf-controller-1(config)# show managed-services flow-diff # Service Name Switch Switch Interface Installed Max Post-Service BW Max Pre-Service BW Total Post-Service BW Total Pre-Service BW -|------------|---------------|----------------|---------|-------------------|------------------|---------------------|--------------------| 1 flow-diff DCS-7050CX3-32S ethernet2/4 True 25Gbps 25Gbps 624Kbps 432Mbps
show running-config policy policy command checks whether the policy flow-diff service exists, whether use-timestamping is enabled, and the use of the correct filter interfaces.
dmf-controller-1(config)# show running-config policy p1 ! policy policy p1 action forward filter-interface egress filter-interface ingress use-managed-service ms1 sequence 1 use-timestamping 1 match any
The show policy policy command provides detailed information about a policy and whether any errors are related to the flow-diff service. The Service Interfaces tab section shows the packets transmitted to the Service Node and IPFIX packets received from the Service Node.
dmf-controller-1 (config)# show policy flow-diff-1 Policy Name : flow-diff-1 Config Status : active - forward Runtime Status : installed Detailed Status : installed - installed to forward Priority : 100 Overlap Priority : 0 # of switches with filter interfaces : 1 # of switches with delivery interfaces : 1 # of switches with service interfaces : 1 # of filter interfaces : 1 # of delivery interfaces : 1 # of core interfaces : 4 # of services : 1 # of pre service interfaces : 1 # of post service interfaces : 1 Push VLAN : 2 Post Match Filter Traffic : 215Mbps Total Delivery Rate : - Total Pre Service Rate : 217Mbps Total Post Service Rate : - Overlapping Policies : none Component Policies : none Runtime Service Names : flow-diff Installed Time : 2023-11-16 18:15:27 PST Installed Duration : 19 minutes, 45 secs ~ Match Rules ~ # Rule -|-----------| 1 1 match any ~~~~~~~~~~~~~~~~~~~~~~~~~~~~~~~~~~~~~~~~~~~~ Filter Interface(s) ~~~~~~~~~~~~~~~~~~~~~~~~~~~~~~~~~~~~~~~~~~~~ # DMF IF Switch IF Name State Dir Packets Bytes Pkt Rate Bit Rate Counter Reset Time -|------|--------|----------|-----|---|--------|-----------|--------|--------|------------------------------| 1 BP1 7280SR3E Ethernet25 up rx 24319476 27484991953 23313 215Mbps 2023-11-16 18:18:18.837000 PST ~~~~~~~~~~~~~~~~~~~~~~~~~~~~~~~~~~~~~~~~~ Delivery Interface(s) ~~~~~~~~~~~~~~~~~~~~~~~~~~~~~~~~~~~~~~~~~ # DMF IF Switch IF Name State Dir Packets Bytes Pkt Rate Bit Rate Counter Reset Time -|-------|---------|----------|-----|---|-------|------|--------|--------|------------------------------| 1 AN-Data 7050SX3-1 ethernet41 up tx 81 117222 0 - 2023-11-16 18:18:18.837000 PST ~~~~~~~~~~~~~~~~~~~~~~~~~~~~~~~~~~~~~~~~~~~~~~~~~~~~~~~~~ Service Interface(s) ~~~~~~~~~~~~~~~~~~~~~~~~~~~~~~~~~~~~~~~~~~~~~~~~~~~~~~~~~ # Service name Role Switch IF Name State Dir Packets Bytes Pkt Rate Bit Rate Counter Reset Time -|------------|------------|---------------|-----------|-----|---|--------|-----------|--------|--------|------------------------------| 1 flow-diff pre-service DCS-7050CX3-32S ethernet2/4 up tx 23950846 27175761734 23418 217Mbps 2023-11-16 18:18:18.837000 PST 2 flow-diff post-service DCS-7050CX3-32S ethernet2/4 up rx 81 117546 0 - 2023-11-16 18:18:18.837000 PST ~~~~~~~~~~~~~~~~~~~~~~~~~~~~~~~~~~~~~~~~~~~~~ Core Interface(s) ~~~~~~~~~~~~~~~~~~~~~~~~~~~~~~~~~~~~~~~~~~~~~ # Switch IF Name State Dir Packets Bytes Pkt Rate Bit Rate Counter Reset Time -|---------------|----------|-----|---|--------|-----------|--------|--------|------------------------------| 1 7050SX3-1 ethernet7 up rx 23950773 27175675524 23415 217Mbps 2023-11-16 18:18:18.837000 PST 2 7050SX3-1 ethernet56 up rx 81 117222 0 - 2023-11-16 18:18:18.837000 PST 3 7050SX3-1 ethernet56 up tx 23950773 27175675524 23415 217Mbps 2023-11-16 18:18:18.837000 PST 4 7280SR3E Ethernet7 up tx 24319476 27484991953 23313 215Mbps 2023-11-16 18:18:18.837000 PST 5 DCS-7050CX3-32S ethernet28 up tx 81 117546 0 - 2023-11-16 18:18:18.837000 PST 6 DCS-7050CX3-32S ethernet28 up rx 23950846 27175761734 23418 217Mbps 2023-11-16 18:18:18.837000 PST ~ Failed Path(s) ~ None.
The show running-config multicast-group name displays the user-configured multicast groups.
dmf-controller-1(config)# show running-config multicast-group ! multicast-group multicast-group mg1 group-ip 224.0.0.1 group-ip 224.0.0.2 receiver filter-interface f3 receiver filter-interface f6 source filter-interface f1 source filter-interface f2
Syslog Messages
The Flow Diff Latency and Drop Analysis feature does not create Syslog messages.
Troubleshooting
DMF Controller
Policies dictate how and what packets are directed to the Service Node. Policies must be able to stream packets from two distinct tap points so that the same packet gets delivered to the Service Node for flow-diff and drop analysis.
Possible reasons for flow-diff and drop analysis not working are:
- In
push-per-filtermode, the policy bound to managed service with flow-diff action is missing filter interfaces or groups that constitute atap-point-pair.
A policy programmed to use managed service with flow-diff action can fail for several reasons:
- The L3 delivery interface or Collector configuration is missing.
- The
tap-point-pairconfiguration is incomplete:- The
sourceordestinationtappointsare missing. - Using a
policy-nameidentifier inpush-per-filtermode.
- The
- The
tap-point-multicast-groupconfiguration is incomplete:- multicast group doesn’t exist.
sources,receivers, orgroup-ipsare empty.sourcesandreceiversoverlap.sourceorreceivershave more than 128 filter interfaces, including the interfaces comprising a filter interface group.
- There are more than
4094distinct tap point groups configured. These limits are global across all flow-diff managed services. For example,filter-interface f1andfilter-interface-group fg1with onlyf1in it is considered the same tap point group. filter-interface-groupsoverlap with each other within the same managed service or have more than 128 group members.filter-interfaceis being used individually as a tap point and as a part of somefilter-interface-groupor amulticast-group, where the group also includes other interfaces, thus resulting in partial overlap.- Partial overlap of interfaces in
filter-interface-groupsandmulticast-groupswithin aflow-diffservice.
Reasons for failure are available in the runtime state of the policy and viewed using the show policy policy
name command.
A lack of computed latency reports can mean two things:
- Not reaching the
sample-count-thresholdvalue. Either lower thesample-count-thresholdvalue until reports are generated or increase the amount of unique packets per flow. - Flows not evicting. The time specified in
flow-timeoutmay be too large and may need to be adjusted to a lower value. Flows will expire when reaching the flow-timeout value. After a flow expires, the system generates a report for that flow. report-typeconfig has neitherlatencynordropoption configured.- The
delivery-requirementconfig can also impact the reports since it determines what’s considered a drop or not.
packet-timeout, this value must be larger than the time expected to receive the same packet on every tap-point. For A->B, if it takes 20ms for the packet to appear at B, the packet-timeout must be larger than this time frame to collect timestamps for both these tap points and compute a latency in one sample.
packet-timeout value may need to be increased.If all the reports are type 2 unexpected, ensure the taps are in the correct order as configured on the Controller. Also, check the topology is correct and that there are no unexpected taps. If there are only a few unexpected reports, it is most likely an issue with the switch ordering the timestamps. You can ignore these or add the reverse direction onto the topology to turn these into type 0 reports. If there are many drop reports, confirm that the same packet is received at all relevant taps within the packet-timeout window, which defaults to 200ms.
Limitations
- This feature is only supported in
push-per-filtermode. Any config inpush-per-policymode will not work as intended. - A maximum of
4094distinct tap points are allowed. - Only 40 timestamped instances of a packet are allowed.
- The
filter-interface-groupused as a tap point must not overlap with any other group within the same managed service and must not have more than 128 members. - The
multicast-groupused as a tap point must not have itssourcesandreceiversoverlap with any other group within that managed service and must not have more than 128 members each. - A filter interface cannot be used as a tap point and simultaneously as a part of a
filter-interface-groupormulticast-groupsourceorreceiver, unless the groups have this filter interface as the only member and no other interface. - There is no chaining if a packet flows through three or more tap points in an A->B->C->...->Z topology. The only computed latency reports is for
tap-point-pairsA->B, A->C, …, and A->Z if these links are specified, but B->C, C->D, etc., will not be computed. - Service Node interfaces can have multiple lcores depending on the SKU. An lcore is a logical core which processes traffic on an interface. Hardware RSS firmware in some Service Node SKU currently cannot parse L2 header timestamps, so all packets are sent to the same lcore; however, RSS does distribute packets correctly to multiple lcores when using src-mac timestamping.
- Each packet from the L3 header and onward gets hashed to a 64-bit value; if two packets hash to the same value, assume the underlying packets are the same.
- Currently, on the
flow-diffaction in the Service Node, if packets are duplicated so that N copies of the same packet are received:- N-1 latencies are computed.
- The ingress identifier is the earliest timestamp.
- The system reports timestamps as unsigned 32-bit values, with the maximum timestamp being 2^32-1, corresponding to approximately 4.29 seconds.
- Only
minmeanmaxlatencies are currently reported. - If there are switch timestamping issues, then these statistics may have high outliers.
- Synchronize the time between switches for this feature to work properly, or latency calculation may be inaccurate.
- Packets are hashed from the L3 header onward, meaning if there is any corrupted data past the L3 header, it will lead to drop reports. The same packet must appear at two tap points to generate a computed latency report.
- In A->B, if B packets appear before A, an unexpected type report is generated.
- At whichever tap point the packet first appears with the earliest timestamp, it is considered the source.
- While switching the latency configuration, the system may generate a couple of unexpected or drop reports at the beginning.
- A LAG may affect RSS on the service node which may affect performance.
- Users must have good knowledge of network topology when setting up tap points and configuring timeout or sample threshold values. Improper configuration may lead to drop or unexpected reports.
- Occasionally switch timestamping causes the system to generate a few type 2 unexpected reports.
- The system may generate drop reports from certain protocols, such as OSPF.
- The amount of packets per second and packet size influences performance since packets are individually hashed. The amount of tap point pairs and interface groups also affects performance.
Resources
Header Strip Action
This action removes specific headers from the traffic selected by the associated DANZ Monitoring Fabric (DMF) policy. Alternatively, define custom header stripping based on the starting position of the Layer-3 header, the Layer-4 header, the Layer-4 payload, or the first byte in the packet.
- decap-erspan: remove the Encapsulated Remote Switch Port Analyzer (ERSPAN) header.
- decap-cisco-fabric-path: remove the Cisco FabricPath protocol header.
- decap-l3-mpls: remove the Layer-3 Multi-protocol Label Switching (MPLS) header.
- decap-lisp: remove the LISP header.
- decap-vxlan [udp-port vxlan port]: remove the Virtual Extensible LAN (VXLAN) header.
- decap-geneve: remove the Geneve header.
- l3-header-start
- l4-header-start
- l4-payload-start
- packet-start
Input a positive integer representing the offset from which the strip action begins. When omitting an offset, the header stripping starts from the first byte in the packet.
CLI Configuration
The header-strip service action strips the header and replaces it in one of the following ways:
- Add the original L2 src-mac, and dst-mac.
- Add the original L2 src-mac, dst-mac, and ether-type.
- Specify and add a custom src-mac, dst-mac, and ether-type.
The following are examples of custom header stripping:
action keyword is required to add or modify actions within a managed service.! managed-service managed-service MS-HEADER-STRIP-1 1 action header-strip packet-start 20 add-original-l2-dstmac-srcmac service-interface switch CORE-SWITCH-1 ethernet13/1
! managed-service managed-service MS-HEADER-STRIP-2 1 action header-strip packet-start 20 add-original-l2-dstmac-srcmac-ethertype service-interface switch CORE-SWITCH-1 ethernet13/2
! managed-service managed-service MS-HEADER-STRIP-3 1 action header-strip packet-start 20 add-custom-l2-header 00:11:01:02:03:04 00:12:01:02:03:04 0x800 service-interface switch CORE-SWITCH-1 ethernet13/3
Configuring the Post-service Match
- The fabric can remain in L3/L4 mode. It is not necessary to change to offset match mode.
- Easier configuration.
- All match conditions are available for the inner packet.
- The policy requires only one managed service to perform the strip service action.
With this feature enabled, DMF knows exactly where to apply the post-service match. The following example illustrates this configuration.
action keyword is required to add or modify actions within a managed service.! managed-service managed-service MS-HEADER-STRIP-4 service-interface switch CORE-SWITCH-1 interface ethernet1 1 action decap-l3-mpls ! post-service-match 1 action match ip src-ip 1.1.1.1 2 action match tcp dst-ip 2.2.2.0 255.255.255.0 ! policy policy POLICY-1 filter-interface TAP-1 delivery-interface TOOL-1 use-managed-service MS-HEADER-STRIP-4 sequence 1
IPFIX and Netflow Actions
IP Flow Information Export (IP FIX), also known as NetFlow v10, is an IETF standard defined in RFC 7011. The IPFIX generator (agent) gathers and transmits information about flows, which are sets of packets that contain all the keys specified by the IPFIX template. The generator observes the packets received in each flow and forwards the information to the IPFIX collector (server) in the form as a flowset.
Starting with the DANZ Monitoring Fabric (DMF)-7.1.0 release, NetFlow v9 (Cisco proprietary) and IPFIX/NetFlow v10 are both supported. Configuration of the IPFIX managed service is similar to configuration for earlier versions of NetFlow except for the UDP port definition. NetFlow v5 collectors typically listen over UDP port 2055, while IFPIX collectors listen over UDP port 4739.
NetFlow records are typically exported using User Datagram Protocol (UDP) and collected using a flow collector. For a NetFlow service, the service node takes incoming traffic and generates NetFlow records. The service node drops the original packets, and the generated flow records, containing metadata about each flow, are forwarded out of the service node interface.
Using the CLI to Define an IPFIX Template
Show Commands
The show commands specific to the new keys introduced in DMF 8.8.0 have not changed. If the new keys are used in any IPFIX template, they are displayed along with other keys.
controller-1(config-ipfix-template)# show ipfix-template port-based-traffic ~~~~~~~~~~~~~~~~~~~~~~~~~~~~~~~~ Ipfix-templates ~~~~~~~~~~~~~~~~~~~~~~~~~~~~~~~~ # Template Name Keys Fields -|------------------|----------------------------------------------------|------| 1 port-based-traffic ethernet-type, tcp-destination-port, tcp-source-port
controller-1(config-ipfix-template)# show running-config ipfix-template port-based-traffic ! ipfix-template ipfix-template port-based-traffic key ethernet-type key tcp-destination-port key tcp-source-port
Using the CLI to Define an IPFIX Service Action
Define a managed service and define the IPFIX action.
action keyword is required to add or modify actions within a managed service.controller(config)# managed-service MS-IPFIX-SERVICE controller(config-managed-srv)# 1 action ipfix TO-DELIVERY-INTERFACE controller(config-managed-srv-ipfix)# collector 10.106.1.60 controller(config-managed-srv-ipfix)# template IPFIX-TEMPLATE
The active-timeout and inactive-timeout commands are optional
controller1# show running-config managed-service MS-IPFIX-ACTIVE ! managed-service managed-service MS-IPFIX-ACTIVE service-interface switch CORE-SWITCH-1 ethernet13/1 ! 1 action ipfix TO-DELIVERY-INTERFACE collector 10.106.1.60 template IPFIX-TEMPLATE
config# show running-config ipfix-template ! ipfix-template ipfix-template IPFIX-IP template-id 1974 key destination-ipv4-address key destination-ipv6-address key ethernet-type key source-ipv4-address key source-ipv6-address field flow-end-milliseconds field flow-end-reason field flow-start-milliseconds field minimum-ttl field tcp-control-bits ------------------------output truncated------------------------
Records Per Interface Netflow using DST-MAC Rewrite
Destination MAC rewrite for the records-per-interface NetFlow and IPFIX feature is the default setting and applies to switches running Extensible Operating System (EOS) and SWL and is supported on all platforms.
A configuration option exists for using src-mac when overwriting the dst-mac isn't preferred.
Configurations using the CLI
action keyword is required to add or modify actions within a managed service.Global Configuration
records-per-interface. The following example illustrates using rewrite-src-mac or rewrite-dst-mac in conjunction with the filter-mac-rewrite command.
c1(config)# filter-mac-rewrite rewrite-src-mac c1(config)# filter-mac-rewrite rewrite-dst-mac
Netflow Configuration
c1(config)# managed-service ms1 c1(config-managed-srv)# 1 action netflow c1(config-managed-srv-netflow)# collector 213.1.1.20 udp-port 2055 mtu 1024 records-per-interface
IPFIX Configuration
c1(config)# ipfix-template i1 c1(config-ipfix-template)# field maximum-ttl c1(config-ipfix-template)# key records-per-dmf-interface c1(config-ipfix-template)# template-id 300 c1(config)# managed-service ms1 c1(config-managed-srv)# 1 action ipfix c1(config-managed-srv-ipfix)# template i1
Show Commands
NetFlow Show Commands
show running-config managed-service command to view the NetFlow settings.
c1(config)# show running-config managed-service
! managed-service
managed-service ms1
!
1 action netflow
collector 213.1.1.20 udp-port 2055 mtu 1024 records-per-interface
IPFIX Show Commands
show ipfix-template i1 command to view the IPFIX settings.
c1(config)# show ipfix-template i1
~~~~~~~~~~~~~~~~~~ Ipfix-templates ~~~~~~~~~~~~~~~~~~
# Template Name Keys Fields
-|-------------|-------------------------|-----------|
1 i1 records-per-dmf-interface maximum-ttl
c1(config)# show running-config managed-service
! managed-service
managed-service ms1
!
1 action ipfix
template i1
Limitations
-
The
filter-mac-rewrite rewrite-src-maccommand cannot be used on thefilter interfacethat is part of the policy usingtimestamping replace-src-mac. However, the command works when using atimestamping add-header-after-l2configuration.
Packet-masking Action
The packet-masking action can hide specific characters in a packet, such as a password or credit card number, based on offsets from different anchors and by matching characters using regular (regex) expressions.
The mask service action applies the specified mask to the matched packet region.
CLI Configuration
action keyword is required to add or modify actions within a managed service.Controller-1(config)# show running-config managed-service MS-PACKET-MASK ! managed-service managed-service MS-PACKET-MASK description "This service masks pattern matching an email address in payload with X" 1 action mask ([a-zA-Z0-9._-]+@[a-zA-Z0-9._-]+.[a-zA-Z0-9_-]+) service-interface switch CORE-SWITCH-1 ethernet13/1
Pattern-match Action
The pattern-match service action matches and forwards matching traffic and is similar to the pattern-drop service action.
- URLs and user agents in the HTTP header
- patterns in BitTorrent packets
- encapsulation headers for specific parameters including, GTP, VXLAN, and VN-Tag
- subscriber device IP (user-endpoint IP)
- Pattern matching allows Session Aware Adaptive Packet Filtering and can identify HTTPS transactions on non-standard SSL ports. It can filter custom applications and can separate control traffic from user data traffic.
Pattern matching allows Session-aware Adaptive Packet Filtering (SAPF) to identify HTTPS transactions on non-standard SSL ports. It can filter custom applications and separate control traffic from user data traffic.
Pattern matching is also helpful in enforcing IT policies, such as identifying hosts using unsupported operating systems or dropping unsupported traffic. For example, the Windows OS version can be identified and filtered based on the user-agent field in the HTTP header. The user-agent field may appear at variable offsets, so a regular expression search is used to identify the specified value wherever it occurs in the packet.
CLI Configuration
Use the pattern-match pattern keyword to enable the pattern-matching service action. Specify the pattern to match for packets to submit to the packet slicing operation.
The following example matches traffic with the string Windows NT
5.(0-1) anywhere in the packet and delivers the packets to the delivery interface TOOL-PORT-TO-WIRESHARK-1. This service is optional and is applied to TCP traffic to destination port 80.
action keyword is required to add or modify actions within a managed service.! managed-service managed-service MS-PATTERN-MATCH description 'regular expression filtering' 1 action pattern-match 'Windows\\sNT\\s5\\.[0-1]' service-interface switch CORE-SWITCH-1 ethernet13/1 ! policy policy PATTERN-MATCH action forward delivery-interface TOOL-PORT-TO-WIRESHARK-1 description 'match regular expression pattern' filter-interface TAP-INTF-FROM-PRODUCTION priority 100 use-managed-service MS-PATTERN-MATCH sequence 1 optional 1 action match tcp dst-port 80
Pattern-drop Action
The pattern-drop service action drops matching traffic.
- URLs and user agents in the HTTP header
- patterns in BitTorrent packets
- encapsulation headers for specific parameters, including GTP, VXLAN, and VN-Tag
- subscriber device IP (user-endpoint IP)
Pattern matching allows Session-aware Adaptive Packet Filtering (SAPF) to identify HTTPS transactions on non-standard SSL ports. It can filter custom applications and separate control traffic from user data traffic.
Pattern matching is also helpful in enforcing IT policies, such as identifying hosts using unsupported operating systems or dropping unsupported traffic. For example, the Windows OS version can be identified and filtered based on the user-agent field in the HTTP header. The user-agent field may appear at variable offsets, so a regular expression search is used to identify the specified value wherever it occurs in the packet.
CLI Configuration
action keyword is required to add or modify actions within a managed service.Controller-1(config)# show running-config managed-service MS-PACKET-MASK ! managed-service managed-service MS-PACKET-MASK description "This service drops traffic that has an email address in its payload" 1 action pattern-drop ([a-zA-Z0-9._-]+@[a-zA-Z0-9._-]+.[a-zA-Z0-9_-]+) service-interface switch CORE-SWITCH-1 ethernet13/1
Slice Action
- Packet start
- L3 header start
- L4 header start
- L4 payload start
CLI Configuration
action keyword is required to add or modify actions within a managed service.! managed-service managed-service my-service-name 1 action slice l3-header-start 20 insert-original-packet-length service-interface switch DMF-CORE-SWITCH-1 ethernet20/1
! managed-service managed-service MS-SLICE-1 description 'slicing service' 1 action slice l4-payload-start 1 service-interface switch DMF-CORE-SWITCH-1 ethernet40/1 ! policy policy slicing-policy action forward delivery-interface TOOL-PORT-TO-WIRESHARK-1 description 'remove payload' filter-interface TAP-INTF-FROM-PRODUCTION priority 100 use-managed-service MS-SLICE-1 sequence 1 optional 1 action match tcp dst-ip 10.2.19.119 255.255.255.255 src-port 80
Timestamp Action
The Timestamp Service Action identifies and timestamps every packet it receives with the time the service node receives the packet for matching traffic.
CLI Configuration
action keyword is required to add or modify actions within a managed service.! managed-service managed-service MS-TIMESTAMP-1 1 action timestamp service-interface switch CORE-SWITCH-1 ethernet15/3
UDP-Replication Action
The UDP-replication service action copies UDP messages, such as Syslog or NetFlow messages, and sends the copied packets to a new destination IP address.
Configure a rate limit when enabling UDP replication. When upgrading from a version of DANZ Monitoring Fabric (DMF) before release 6.3.1, the UDP-replication configuration is not applied until a rate limit is applied to the delivery interface.
CONTROLLER-1(config)# switch DMF-DELIVERY-SWITCH-1 CONTROLLER-1(config-switch)# interface ethernet1 CONTROLLER-1(config-switch-if)# role delivery interface-name udp-delivery-1 CONTROLLER-1(config-switch-if)# rate-limit 256000
CLI Configuration
Enter the 1 udp-replicate command and identify the configuration name (the submode changes to the config-managed-srv-udp-replicate submode) to view and configure a specific UDP-replication configuration.
action keyword is required to add or modify actions within a managed service.controller-1(config)# managed-service MS-UDP-REPLICATE-1 controller-1(config-managed-srv)# 1 action udp-replicate DELIVERY-INTF-TO-COLLECTOR controller-1(config-managed-srv-udp-replicate)#
controller-1(config-managed-srv-udp-replicate)# in-dst-ip 10.1.1.1 controller-1(config-managed-srv-udp-replicate)# out-dst-ip 10.1.2.1
Sample Service
The Service Node forwards packets based on the max-tokens and tokens-per-refresh parameters using the DANZ Monitoring Fabric (DMF) Sample Service feature. The sample service uses one token to forward one packet.
After consuming all the initial tokens from the max-tokens bucket, the system drops subsequent packets until the max-tokens bucket refills using the tokens-per-refresh counter at a recurring predefined time interval of 10ms. Packet sizes do not affect this service.
Arista Networks recommends keeping the tokens-per-refresh value at or below max-tokens. For example, max-tokens =
1000 and tokens-per-refresh = 500.
Setting the max-tokens value to 1000 means that the initial number of tokens is 1000, and the maximum number of tokens stored at any time is 1000.
The max-tokens bucket will be zero when the Service Node has forwarded 1000 packets before the first 10 ms period ends, leading to a situation where the Service Node is no longer forwarding packets. After every 10ms time interval, if the tokens-per-refresh value is set to 500, the max-tokens bucket is refilled using the tokens-per-refresh configured value, 500 tokens in this case, to pass packets the service tries to use immediately.
Suppose the traffic rate is higher than the refresh amount added. In that case, available tokens will eventually drop back to 0, and every 10ms, only 500 packets will be forwarded, with subsequent packets being dropped.
If the traffic rate is lower than the refresh amount added, a surplus of tokens will result in all packets passing. Since the system only consumes some of the tokens before the next refresh interval, available tokens will accumulate until they reach the max-tokens value of 1000. After 1000, the system does not store any surplus tokens above the max-tokens value.
To estimate the maximum possible packets passed per second (pps), use the calculation (1000ms/10ms) * tokens-per-refresh and assume the max-tokens value is larger than tokens-per-refresh. For example, if the tokens-per-refresh value is 5000, then 500000 pps are passed.
The Sample Service feature can be used as a standalone Managed Service or chained with other Managed Services.
Use Cases and Compatibility
- Applies to Service Nodes
- Limit traffic to tools that cannot handle a large amount of traffic.
- Use the Sample Service before another managed service to decrease the load on that service.
- The Sample Service is applicable when needing only a portion of the total packets without specifically choosing which packets to forward.
Sample Service Configuration
Show Commands
Use the show running-config managed-service
sample_service_name command to view pertinent details. In this example, the sample_service_name is techpubs.
DMF-SCALE-R450> show running-config managed-service techpubs
! managed-service
managed-service techpubs
!
1 action sample
max-tokens 1000
tokens-per-refresh 500
DMF-SCALE-R450>
Troubleshooting Sample Service
Troubleshooting
- If the number of packets forwarded by the Service Node interfaces is few, the
max-tokensandtokens-per-refreshvalues likely need to be higher. - If fewer packets than the
tokens-per-refreshvalue forward, ensure themax-tokensvalue is larger than thetokens-per-refreshvalue. The system discards any surplus refresh tokens above themax-tokensvalue. - When all traffic forwards, the initial
max-tokensvalue is too large, or the tokens refreshed bytokens-per-refreshare higher than the packet rate. - When experiencing packet drops after the first 10ms post commencement of traffic, it may be due to a low
tokens-per-refreshvalue. For example, calculate the minimum value ofmax-tokensandtokens-per-refreshthat would lead to forwarding all packets.
Calculation Example
Traffic Rate : 400 Mbps Packet Size - 64 bytes 400 Mbps = 400000000 bps 400000000 bps = 50000000 Bps 50000000 Bps = 595238 pps (Includes 20 bytes of inter packet gap in addition to the 64 bytes) 1000 ms = 595238 pps 1 ms = 595.238 pps 10 ms = 5952 pps max-tokens : 5952 (the minimum value) tokens-per-refresh : 5952 ( the minimum value)
Limitations
- In the current implementation, the Service Sample action is bursty. The token consumption rate is not configured to withhold tokens over time, so a large burst of incoming packets can immediately consume all the tokens in the bucket. There is currently no way to select what traffic is forwarded or dropped; it only depends on when the packets arrive concerning the refresh interval.
- Setting the
max-tokensandtokens-per-refreshvalues too high will forward all packets. The maximum value is9,223,372,036,854,775,807, but Arista Networks recommends staying within the maximum values stated under the description section.
Sharing L3 Delivery Interfaces Across Services
Overview
A DMF Controller will allow multiple managed services to share a delivery interface with an IP address, commonly called an L3 delivery interface. These interfaces redirect the packets processed by managed services to the required tool nodes for further analysis. Sharing an L3 delivery interface is useful when applying different actions to a packet that otherwise cannot be chained together in one managed service when sending it to the same destination.
Currently, only a few managed service actions require L3 delivery interfaces. Since these actions must be the terminating action in a given service action chain, DMF allows different services to use the same L3 delivery interface.
This feature applies to all platforms that support managed services with L3 delivery interfaces and the following managed service actions using L3 deliveries:
show running-config command example in the Show Commands section.Configuration
Log into the DMF Controller, select a switch, and create an L3 delivery interface.
dmf-controller-1> enable dmf-controller-1# configure dmf-controller-1(config)# switch switch1 dmf-controller-1(config-switch)# interface ethernet31 dmf-controller-1(config-switch-if)# role delivery interface-name l3-d1 ip-address 0.0.0.1 nexthop-ip 0.0.0.1 255.255.255.0 nexthop-arp-interval 5 dmf-controller-1(config-switch-if)# rate-limit 1000
Create two or more managed services with the actions described previously as the last entry in the sequence. Use the l3-d1 interface created earlier as the l3-delivery-interface for these services. The configuration commands needed may be different for each action. For example, using a managed service with netflow action and another with the udp-replicate action as shown in the following command sequences:
dmf-controller-1> enable dmf-controller-1# configure dmf-controller-1(config)# managed-service ms1 dmf-controller-1(config-managed-srv)# service-interface switch switch1 ethernet1 dmf-controller-1(config-managed-srv)# 1 action netflow dmf-controller-1(config-managed-srv-netflow)# collector 0.0.0.2 udp-port 2055 mtu 1500 dmf-controller-1(config-managed-srv-netflow)# l3-delivery-interface l3-d1
Redundancy of Managed Services Using Two DMF Policies
In this method, users can employ a second policy with a second managed service to provide redundancy. The idea here is to duplicate the policies but assign a lower policy priority to the second DANZ Monitoring Fabric (DMF) policy. In this case, the backup policy (and, by extension, the backup service) will always be active but only receive relevant traffic once the primary policy goes down. This method provides true redundancy at the policy, service-node, and core switch levels but uses additional network and node resources.
action keyword is required to add or modify actions within a managed service.! managed-service managed-service MS-SLICE-1 1 action slice l3-header-start 20 service-interface switch CORE-SWITCH-1 lag1 ! managed-service MS-SLICE-2 1 action slice l3-header-start 20 service-interface switch CORE-SWITCH-1 lag2 ! policy policy ACTIVE-POLICY priority 101 action forward delivery-interface TOOL-PORT-1 filter-interface TAP-PORT-1 use-managed-service MS-SLICE-1 sequence 1 1 match ip ! policy BACKUP-POLICY priority 100 action forward delivery-interface TOOL-PORT-1 filter-interface TAP-PORT-1 use-managed-service MS-SLICE-2 sequence 1 1 match ip
Cloud Services Filtering
The DANZ Monitoring Fabric (DMF) supports traffic filtering to specific services hosted in the public cloud and redirecting filtered traffic to customer tools. DMF achieves this functionality by reading the source and destination IP addresses of specific flows, identifying the Autonomous System number they belong to, tagging the flows with their respective AS numbers, and redirecting them to customer tools for consumption.
The following is the list of services supported:
- amazon: traffic with src/dst IP belonging to Amazon
- ebay: traffic with src/dst IP belonging to eBay
- facebook: traffic with src/dst IP belonging to Facebook
- google: traffic with src/dst IP belonging to Google
- microsoft: traffic with src/dst IP belonging to Microsoft
- netflix: traffic with src/dst IP belonging to Netflix
- office365: traffic for Microsoft Office365
- sharepoint: traffic for Microsoft Sharepoint
- skype: traffic for Microsoft Skype
- twitter: traffic with src/dst IP belonging to Twitter
- default: traffic not matching other rules in this service. Supported types are match or drop.
The option drop instructs the DMF Service Node to drop packets matching the configured application.
The option match instructs the DMF Service Node to deliver packets to the delivery interfaces connected to the customer tool.
match default. It instructs the DMF Service Node to drop packets when either of the following conditions occurs:
- The stream's source IP address or destination IP address doesn't belong to any AS number.
- The stream's source IP address or destination IP address is affiliated with an AS number but has no specific action set.
Cloud Services Filtering Configuration
action keyword is required to add or modify actions within a managed service.Controller(config)# managed-service name Controller(config-managed-srv)#
Controller(config-managed-srv)# 1 action app-filter Controller(config-managed-srv-appfilter)#
Controller(config-managed-srv-appfilter)# 1 drop sharepoint Controller(config-managed-srv-appfilter)# 2 match google Controller(config-managed-srv-appfilter)# show this ! managed-service managed-service sf3 service-interface switch CORE-SWITCH-1 ethernet13/1 ! 1 service-app-filter 1 drop sharepoint 2 match google
Controller(config)# show running-config managed-service incomplete-managed-service ! managed-service managed-service incomplete-managed-service 1 action app-filter Controller(config)# show running-config policy R730-sf3 ! policy policy incomplete-policy action forward delivery-interface TOOL-PORT-1 filter-interface TAP-PORT-1 use-managed-service incomplete-managed-service sequence 1 1 match any
Controller(config-managed-srv-appfilter)# show policy incomplete-policy Policy Name : incomplete-policy Config Status : active - forward Runtime Status : one or more required service down Detailed Status : one or more required service down - installed to forward Priority : 100 Overlap Priority : 0
TCP Analysis (Dapper)
The Dapper action (derived from Brown University research) identifies TCP session issues by measuring specific connection attributes. This analysis determines whether performance degradation stems from the client, server, or network devices. All current Service Node platforms support the Dapper action.
The action monitors TCP session packets, tracks extensive statistics, and periodically exports them via IPFIX records to a collector. For every session direction, the system generates:
- One Start-Session record.
- One or more Data records.
- One End-Session record.
The collector evaluates these statistics, utilizing six distinct IPFIX templates to diagnose the root cause of network problems.
Start-Session Record
The system transmits the Start-Session record for each direction immediately after session establishment (upon Client ACK). This record captures the initial attributes negotiated during the handshake.
| Offset | ID | Dapper Field | Type | Description |
|---|---|---|---|---|
| 0 | 8 | ipv4_src | ipv4Address | IPv4 source address |
| 1 | 12 | ipv4_dst | ipv4Address | IPv4 destination address |
| 2 | 7 | tcp_src | unsigned16 | TCP source address |
| 3 | 11 | tcp_dst | unsigned16 | TCP destination address |
| 4 | 239 | biflow_direction | unsigned8 | Direction of session (0=unknown, 1=initiator, 2=reverseInitiator) |
| 5 | 152 | start_milliseconds | dateTimeMilliseconds | Session start time in milliseconds since epoch |
| 6 | 218 | tcp_syn_total_count | unsigned64 | Number of TCP packets with SYN flag sent (0 if we did not see initiation) |
| 7 | 32774 | window_size | unsigned32 | Initial window size in octets |
| 8 | 32771 | expected_flight_size | unsigned32 | Expected flight size in octets |
| 9 | 32822 | switch_mac | macAddress | Ethernet address of filter switch |
| 10 | 32823 | switch_port | unsigned16 | Port on filter switch |
| 11 | 6 | tcp_control_bits | unsigned16 | TCP flags set during initiation (SYN, SYN | ACK, unset if we did not see initiation) |
| Offset | ID | Dapper Field | Type | Description |
|---|---|---|---|---|
| 0 | 27 | ipv6_src | ipv6Address | IPv6 source address |
| 1 | 28 | ipv6_dst | ipv6Address | IPv6 destination address |
| 2 | 7 | tcp_src | unsigned16 | TCP source address |
| 3 | 11 | tcp_dst | unsigned16 | TCP destination address |
| 4 | 239 | biflow_direction | unsigned8 | Direction of session (0=unknown, 1=initiator, 2=reverseInitiator) |
| 5 | 152 | start_milliseconds | dateTimeMilliseconds | Session start time in milliseconds since epoch |
| 6 | 218 | tcp_syn_total_count | unsigned64 | Number of TCP packets with SYN flag sent (0 if we did not see initiation) |
| 7 | 32774 | window_size | unsigned32 | Initial window size in octets |
| 8 | 32771 | expected_flight_size | unsigned32 | Expected flight size in octets |
| 9 | 32822 | switch_mac | macAddress | Ethernet address of filter switch |
| 10 | 32823 | switch_port | unsigned16 | Port on filter switch |
| 11 | 6 | tcp_control_bits | unsigned16 | TCP flags set during initiation (SYN, SYN | ACK, unset if we did not see initiation) |
Data Record
The system transmits Data records for each session direction at periodic intervals. It analyzes packet streams up to a configured limit to match data/acknowledgment pairs, recording delay and size metrics. Most statistics reflect averages derived from the sample period.
dapper compatibility setting is false.| Offset | ID | Dapper Field | Type | Description |
|---|---|---|---|---|
| 0 | 8 | ipv4_src | ipv4Address | IPv4 source address |
| 1 | 12 | ipv4_dst | ipv4Address | IPv4 destination address |
| 2 | 7 | tcp_src | unsigned16 | TCP source address |
| 3 | 11 | tcp_dst | unsigned16 | TCP destination address |
| 4 | 239 | biflow_direction | unsigned8 | Direction of session (0=unknown, 1=initiator, 2=reverseInitiator) |
| 5 | 32768 | report_timer | unsigned32 | The number of samples in round-trip-time calculations (matching sync/ack pairs) |
| 6 | 32828 | reaction_time | unsigned32 | Average time between receiving an ACK and the next data packet |
| 7 | 32770 | flight_size | unsigned32 | Average flight size over samples in octets |
| 8 | 32771 | expected_flight_size | unsigned32 | Average expected flight size in octets |
| 9 | 32829 | round_trip_time | unsigned32 | Average round-trip-time between sync and matching ack in microseconds |
| 10 | 32773 | retransmissions | unsigned32 | Counter of retransmitted packets received during sample period |
| 11 | 32774 | window_size | unsigned32 | Average window size reported during sample period in octets |
| 12 | 32775 | ecn | unsigned32 | Counter of how many packets had ECN flag set during sample period |
| 13* | 2 | packet_delta | unsigned32 | Number of packets received during sample period |
| 14* | 1 | octet_delta | unsigned64 | Number of bytes received during sample period |
| 15* | 32830 | first_rtt | unsigned32 | First round trip time in period in microseconds |
| 16* | 32831 | min_rtt | unsigned32 | Minimum round trip time during period in microseconds |
| 17* | 32832 | max_rtt | unsigned32 | Maximum round time trip during period in microseconds |
| 17* | 32833 | rtt_standard_deviation | unsigned32 | The standard deviation of round trip time measurements during period |
| 18* | 32834 | recovery_time | unsigned32 | Average time between an initial data packet and a retransmission |
| Offset | ID | Dapper Field | Type | Description |
|---|---|---|---|---|
| 0 | 27 | ipv6_src | ipv4Address | IPv4 source address |
| 1 | 28 | ipv6_dst | ipv4Address | IPv4 destination address |
| 2 | 7 | tcp_src | unsigned16 | TCP source address |
| 3 | 11 | tcp_dst | unsigned16 | TCP destination address |
| 4 | 239 | biflow_direction | unsigned8 | Direction of session (0=unknown, 1=initiator, 2=reverseInitiator) |
| 5 | 32768 | report_timer | unsigned32 | The number of samples in round-trip-time calculations (matching sync/ack pairs) |
| 6 | 32828 | reaction_time | unsigned32 | Average time between receiving an ACK and the next data packet |
| 7 | 32770 | flight_size | unsigned32 | Average flight size over samples in octets |
| 8 | 32771 | expected_flight_size | unsigned32 | Average expected flight size in octets |
| 9 | 32829 | round_trip_time | unsigned32 | Average round-trip-time between sync and matching ack in microseconds |
| 10 | 32773 | retransmissions | unsigned32 | Counter of retransmitted packets received during sample period |
| 11 | 32774 | window_size | unsigned32 | Average window size reported during sample period in octets |
| 12 | 32775 | ecn | unsigned32 | Counter of how many packets had ECN flag set during sample period |
| 13* | 2 | packet_delta | unsigned32 | Number of packets received during sample period |
| 14* | 1 | octet_delta | unsigned64 | Number of bytes received during sample period |
| 15* | 32830 | first_rtt | unsigned32 | First round trip time in period in microseconds |
| 16* | 32831 | min_rtt | unsigned32 | Minimum round trip time during period in microseconds |
| 17* | 32832 | max_rtt | unsigned32 | Maximum round time trip during period in microseconds |
| 17* | 32833 | rtt_standard_deviation | unsigned32 | The standard deviation of round trip time measurements during period |
| 18* | 32834 | recovery_time | unsigned32 | Average time between an initial data packet and a retransmission |
End-Session Record
Upon session completion (via FIN, RST, or inactivity timeout), the system transmits an End-Session record for each direction containing the termination reason. If statistics remain pending at the end of the session, the system generates a final Data record before the End-Session record
| Offset | ID | Dapper Field | Type | Description |
|---|---|---|---|---|
| 0 | 8 | ipv4_src | ipv4Address | IPv4 source address |
| 1 | 12 | ipv4_dst | ipv4Address | IPv4 destination address |
| 2 | 7 | tcp_src | unsigned16 | TCP source address |
| 3 | 11 | tcp_dst | unsigned16 | TCP destination address |
| 4 | 239 | biflow_direction | unsigned8 | Direction of session (0=unknown, 1=initiator, 2=reverseInitiator) |
| 5 | 152 | end_milliseconds | dateTimeMilliseconds | Session end time in milliseconds since epoch |
| 6 | 32822 | switch_mac | macAddress | Ethernet address of filter switch |
| 7 | 32823 | switch_port | unsigned16 | Port on filter switch |
| 8 | 6 | tcp_control_bits | unsigned16 | TCP flags set during termination (FIN, RST, unset if session was timed out) |
| Offset | ID | Dapper Field | Type | Description |
|---|---|---|---|---|
| 0 | 27 | ipv6_src | ipv6Address | IPv4 source address |
| 1 | 28 | ipv6_dst | ipv6Address | IPv4 destination address |
| 2 | 7 | tcp_src | unsigned16 | TCP source address |
| 3 | 11 | tcp_dst | unsigned16 | TCP destination address |
| 4 | 239 | biflow_direction | unsigned8 | Direction of session (0=unknown, 1=initiator, 2=reverseInitiator) |
| 5 | 152 | end_milliseconds | dateTimeMilliseconds | Session end time in milliseconds since epoch |
| 6 | 32822 | switch_mac | macAddress | Ethernet address of filter switch |
| 7 | 32823 | switch_port | unsigned16 | Port on filter switch |
| 8 | 6 | tcp_control_bits | unsigned16 | TCP flags set during termination (FIN, RST, unset if session was timed out) |
TCP Analysis CLI Configuration
Configuration Steps for TCP Analysis
- Define Managed Service: Create a managed service and enter the service interface configuration mode.
- Select Action: Enable the TCP analysis function using the command
seq num tcp-analysis. This command enters thetcp-analysissubmode. - Configure Collector (Required): Define the IPFIX collector destination.
- Enter the command:
collector ip-address - The UDP port defaults to
4739and the MTU to1500, if not specified.
- Enter the command:
- Configure Delivery Interface (Required): Specify the logical interface for exporting records.
- Enter the command:
l3-delivery-interface delivery interface name
- Enter the command:
- Configure Sampling (Optional): Set the maximum packet processing limit between data reports.
- Enter the command:
max-samples-per-report value - Default:
128packets.
- Enter the command:
- Configure Reporting Scope (Optional): Restrict statistics to the original Dapper research set.
- Enter the command:
include-dapper-elements - Behavior: Enabling this command limits the output to standard Dapper statistics. Omitting it enables the Service Node to report additional extended statistics.
- Enter the command:
- Apply Policy: Associate the managed service with a policy.
- The policy itself does not require a physical delivery interface.
The following example configures a TCP Analysis action to export IPFIX records to a DMF Analytics Node (Collector IP 192.168.1.1) via the tcp-analysis-to-analytics interface.
managed-service MS service-interface switch CORE-SWITCH-1 ethernet2 ! 1 action tcp-analysis collector 192.168.1.1 l3-delivery-interface tcp-analysis-to-analytics
Switch Configuration
The tcp-analysis action requires the presence of tap points within the fabric.
TCP Analysis Show Commands
The following show commands provide helpful information.
Use the show running-config managed-service managed
service command to verify the completeness of the tcp-analysis configuration.
dmf-controller-1(config)# show running-config managed-service ms1
! managed-service
managed-service ms1
service-interface switch DCS-7050CX3-32S ethernet2/4
!
1 action tcp-analysis
collector 192.168.1.1
l3-delivery-interface AN-Data
Use the show managed-services managed service command to display operational status and information for the specified service.
dmf-controller-1(config)# show managed-services tcp-analysis # Service Name Switch Switch Interface Installed Max Post-Service BW Max Pre-Service BW Total Post-Service BW Total Pre-Service BW -|------------|---------------|----------------|---------|-------------------|------------------|---------------------|--------------------| 1 tcp-analysis DCS-7050CX3-32S ethernet2/4 True 25Gbps 25Gbps 624Kbps 432Mbps
Use the show running-config policy policy command to verify that the tcp-analysis service is correctly associated with the specified policy.
dmf-controller-1(config)# show running-config policy p1 ! policy policy p1 action forward filter-interface ingress use-managed-service ms1 sequence 1 1 match any
Use the show policy policy command to display detailed policy information and identify errors related to the tcp-analysis service.
The Service Interfaces column provides the following traffic statistics:
- Tx: Packets transmitted to the Service Node for analysis.
- Rx: IPFIX packets received from the Service Node.
dmf-controller-1 (config)# show policy tcp-analysis-1 Policy Name : tcp-analysis-1 Config Status : active - forward Runtime Status : installed Detailed Status : installed - installed to forward Priority : 100 Overlap Priority : 0 # of switches with filter interfaces : 1 # of switches with delivery interfaces : 1 # of switches with service interfaces : 1 # of filter interfaces : 1 # of delivery interfaces : 1 # of core interfaces : 4 # of services : 1 # of pre service interfaces : 1 # of post service interfaces : 1 Push VLAN : 2 Post Match Filter Traffic : 215Mbps Total Delivery Rate : - Total Pre Service Rate : 217Mbps Total Post Service Rate : - Overlapping Policies : none Component Policies : none Runtime Service Names : tcp-analysis Installed Time : 2023-11-16 18:15:27 PST Installed Duration : 19 minutes, 45 secs ~ Match Rules ~ # Rule -|-----------| 1 1 match any ~~~~~~~~~~~~~~~~~~~~~~~~~~~~~~~~~~~~~~~~~~~~ Filter Interface(s) ~~~~~~~~~~~~~~~~~~~~~~~~~~~~~~~~~~~~~~~~~~~~ # DMF IF Switch IF Name State Dir Packets Bytes Pkt Rate Bit Rate Counter Reset Time -|------|--------|----------|-----|---|--------|-----------|--------|--------|------------------------------| 1 BP1 7280SR3E Ethernet25 up rx 24319476 27484991953 23313 215Mbps 2023-11-16 18:18:18.837000 PST ~~~~~~~~~~~~~~~~~~~~~~~~~~~~~~~~~~~~~~~~~ Delivery Interface(s) ~~~~~~~~~~~~~~~~~~~~~~~~~~~~~~~~~~~~~~~~~ # DMF IF Switch IF Name State Dir Packets Bytes Pkt Rate Bit Rate Counter Reset Time -|-------|---------|----------|-----|---|-------|------|--------|--------|------------------------------| 1 AN-Data 7050SX3-1 ethernet41 up tx 81 117222 0 - 2023-11-16 18:18:18.837000 PST ~~~~~~~~~~~~~~~~~~~~~~~~~~~~~~~~~~~~~~~~~~~~~~~~~~~~~~~~~ Service Interface(s) ~~~~~~~~~~~~~~~~~~~~~~~~~~~~~~~~~~~~~~~~~~~~~~~~~~~~~~~~~ # Service name Role Switch IF Name State Dir Packets Bytes Pkt Rate Bit Rate Counter Reset Time -|------------|------------|---------------|-----------|-----|---|--------|-----------|--------|--------|------------------------------| 1 tcp-analysis pre-service DCS-7050CX3-32S ethernet2/4 up tx 23950846 27175761734 23418 217Mbps 2023-11-16 18:18:18.837000 PST 2 tcp-analysis post-service DCS-7050CX3-32S ethernet2/4 up rx 81 117546 0 - 2023-11-16 18:18:18.837000 PST ~~~~~~~~~~~~~~~~~~~~~~~~~~~~~~~~~~~~~~~~~~~~~ Core Interface(s) ~~~~~~~~~~~~~~~~~~~~~~~~~~~~~~~~~~~~~~~~~~~~~ # Switch IF Name State Dir Packets Bytes Pkt Rate Bit Rate Counter Reset Time -|---------------|----------|-----|---|--------|-----------|--------|--------|------------------------------| 1 7050SX3-1 ethernet7 up rx 23950773 27175675524 23415 217Mbps 2023-11-16 18:18:18.837000 PST 2 7050SX3-1 ethernet56 up rx 81 117222 0 - 2023-11-16 18:18:18.837000 PST 3 7050SX3-1 ethernet56 up tx 23950773 27175675524 23415 217Mbps 2023-11-16 18:18:18.837000 PST 4 7280SR3E Ethernet7 up tx 24319476 27484991953 23313 215Mbps 2023-11-16 18:18:18.837000 PST 5 DCS-7050CX3-32S ethernet28 up tx 81 117546 0 - 2023-11-16 18:18:18.837000 PST 6 DCS-7050CX3-32S ethernet28 up rx 23950846 27175761734 23418 217Mbps 2023-11-16 18:18:18.837000 PST ~ Failed Path(s) ~ None.
Packet Recording via the Service Node
This release adds a new managed service action, called Record, to the Service Node (SN). This action enables packet recording using an SN similar to a Recorder Node (RN) and supports basic packet recording and querying capabilities.
The SN accumulates packets, writes packet data to local storage disks, and indexes information based on configured fields. Various query types retrieve recorded packets, analyze traffic patterns, and investigate network issues.
The Controller includes the managed service action record to enable packet recording on an SN.
- Capture and store packets to local disks.
- Index configurable packet fields.
- Query recorded packets.
- Perform traffic analysis queries (HTTP, TCP flow health, conversations).
- Monitor storage and query health.
Platform Compatibility
The DCA-DM-SNR660 SKU exclusively supports the record action, as this hardware includes the dedicated storage disks required for packet capture. Consequently, this feature is available on switchless physical units but remains unsupported on virtual SNs.
| Deployment Type | Support Status - Record Feature |
|---|---|
| Physical SN (Switchless) | Supported |
| Virtual SN | Not Supported |
Using the CLI to Configure Packet Recording
Managed Service and Policy Configuration
Configure packet recording through the Controller as an SN action in managed services. The managed service action record applies only to SNs that support recording. The action requires no additional configuration values. Use the show service-node SN-NAME
property command to verify the recording capability of an SN.
The record action must occupy the last position in a managed service sequence. While multiple services can include a record action, configure only one record action per SN to prevent system performance impact.
action keyword is required to add or modify actions within a managed service.dmf-controller-1(config)# managed-service ms1 dmf-controller-1(config-managed-srv)# service-interface switch sw1 ethernet1 dmf-controller-1(config-managed-srv)# action 1 record
Policy configuration with a record managed service requires adherence to these constraints:
-
Traffic terminates at the SN; therefore, do not configure a delivery interface—policies with both a
delivery interfaceand arecordservice fail. -
Policies must exclude all other managed services. The system throws a validation exception if other services exist.
-
The
recordmanaged service must remain non-optional. -
Multiple policies can share the
recordmanaged service.
Indexing
The indexing config mode defines the packet header fields that an SN indexes for recorded traffic. Indexed fields allow specific criteria for filtering packets during queries. For example, indexing the IP protocol enables queries for all TCP packets recorded within a specific time range. Indexing facilitates faster queries based on packet attributes.
The available indexing fields are the following:
-
mac-src: Index the source MAC of recorded frames -
mac-dst: Index the destination MAC of recorded frames -
ipv4-src: Index IPv4 source address -
ipv4-dst: Index IPv4 destination address -
ipv6-src: Index IPv6 source address -
ipv6-dst: Index IPv6 destination address -
ip-proto: Index IP protocol -
port-src: Index source port -
port-dst: Index destination port -
vlan-1: Index outer VLAN ID -
vlan-2: Index inner/middle VLAN ID -
vlan-3: Index innermost VLAN ID -
mpls: Index MPLS label -
community-id: Index the community ID -
mw-device-id: Index MetaWatch device ID if MetaWatch trailer is present -
mw-port-id: Index MetaWatch port ID if MetaWatch trailer is present
By default, the system enables the following fields: vlan-1, ipv4-src, ipv4-dst, ipv6-src, ipv6-dst, ip-proto, port-src, port-dst.
Enter the following commands to configure indexing:
dmf-controller-1(config)# service-node sn1 dmf-controller-1(config-service-node)# recording dmf-controller-1(config-service-node-recording)# indexing dmf-controller-1(config-service-node-recording-indexing)# field-name
Disable indexing for a specific field using the no prefix.
dmf-controller-1(config-service-node-recording-indexing)# no field-name
Global Query Settings
Global query settings apply fabric-wide to all recording devices.
Max Result Size
Set the maximum size of query results using the max-result-size parameter. This parameter specifies the maximum query result size in bytes. A value of zero indicates "unlimited," allowing the result to occupy all available storage space for query results. The default value is 268435456 bytes (256 MB).
dmf-controller-1(config)# recorder-node query max-result-size 268435456
sFlow Configuration
The following command enables sFlow®* for the recorder across the fabric:
dmf-controller-1(config)# recorder-node sflow
RBAC Permissions (Optional)
Role-Based Access Control (RBAC) permissions enable group access for running export and analysis queries on a specific SN. The following commands grant these permissions to a group other than ADMIN or SYSTEM:
dmf-controller-1(config)# group group-name dmf-controller-1(config-group)# entity entity-name dmf-controller-1(config-group-entity)# associate recorder-node sn1 dmf-controller-1(config-group-entity)# permissions export dmf-controller-1(config-group-entity)# permissions use
Show Commands
Use the show service-node [all |
name] property command to determine which SNs support recording. Verify this support before configuring managed services. Configuring a managed service with a record action on an unsupported SN generates a fabric warning and causes the policy to fail for that service.
dmf-controller-1> show service-node sn1 property Service Node : sn1 Dzgre : unsupported Recording : supported
Use the show service-node name table contents
record command to verify that the SN successfully programs the record gentable. The SN will not record packets if the record gentable is missing.
dmf-controller-1> show service-node sn1 table contents record ~~~~~~~~~~~~~~~~~~~~ Records ~~~~~~~~~~~~~~~~~~~~ Device name Record Entry key Entry value --------------------|------|---------|-----------| sn1 0 Port(1)
Managed Service
The show service-node name interface stats command provides details about service interface health by displaying drops or errors. These drops and errors occur before packets reach the recording service.
dmf-controller-1# c1(config)# show service-node sn1 interface stats Service node Name Rx Pkts Rx Bytes Rx Drop Rx Errors Tx Pkts Tx Bytes Tx Drop Tx Errors ------------|----|-------|--------|-------|---------|-------|--------|-------|---------| sn1 sni1 78 16242 0 0 565 66285 0 0 sn1 sni2 79 16316 0 0 565 66051 0 0
For action-specific statistics, the show managed-service-device
sn-name stats command displays rx, tx, and applied packet/byte counters for the service using recording. For the record action, applied counters describe packets written to disk. A discrepancy between the rx and applied counters indicates a potential issue with disk IO, such as packets failing to write to disk.
record is a terminating action, tx counters are expected to be 0.dmf-controller-1> show managed-service-device sn1 stats ~~~~~~~~~~~~~~~~~~~~~~~~~~~~~~~~~~~~~~~~~~~~~~~~~~~~~~~~~~~~~~~~~~~~~~~~~~~ Stats ~~~~~~~~~~~~~~~~~~~~~~~~~~~~~~~~~~~~~~~~~~~~~~~~~~~~~~~~~~~~~~~~~~~~~~~~~~~ # Interface Name Service Name Action Load Rx packets Rx bytes Rx Bit Rate Applied packets Applied bytes Applied Bit Rate Tx packets Tx bytes Tx Bit Rate -|--------------|-------------|------|----|----------|-----------|-----------|---------------|-------------|----------------|----------|--------|-----------| 1 sni1 ms1 record low 46021696 11782283982 102Kbps 46021696 11782283982 102Kbps 0 0 -
The show policy policy command provides detailed information about a policy and identifies any errors related to the record service. The Service Interfaces section displays packets transmitted to the SN and IPFIX packets received from the SN. These stats appear under the pre-service role; packets do not egress from the SN post-service.
dmf-controller-1> show policy policy1 Policy Name : policy1 Config Status : active - forward Runtime Status : installed Detailed Status : installed - Installed to forward Priority : 100 Overlap Priority : 0 # of switches with filter interfaces : 1 # of switches with delivery interfaces : 0 # of switches with service interfaces : 1 # of filter interfaces : 1 # of delivery interfaces : 0 # of core interfaces : 0 # of services : 1 # of pre service interfaces : 1 # of post service interfaces : 1 Push VLAN : 2 Post Match Filter Traffic : - Total Delivery Rate : - Total Pre Service Rate : - Total Post Service Rate : - Overlapping Policies : none Component Policies : none Runtime Service Names : ms1 Installed Time : 2025-10-29 17:20:38 UTC Installed Duration : 11 hours, 8 minutes Timestamping enabled : False ~ Match Rules ~ # Rule -|-----------| 1 1 match any ~~~~~~~~~~~~~~~~~~~~~~~~~~~~~~~~~~~~~~~~~~~~~~~~~~~~ Filter Interface(s) ~~~~~~~~~~~~~~~~~~~~~~~~~~~~~~~~~~~~~~~~~~~~~~~~~~~~ # DMF IF Switch IF Name State Dir Packets Bytes Pkt Rate Bit Rate Counter Reset Time -|------|---------------------------|------------|-----|---|-------|--------|--------|--------|------------------------------| 1 F1 dmf-r267-tb2-7280dr3am-54-1 Ethernet25/1 up rx 60000 30720000 0 - 2025-10-29 15:55:36.435000 UTC ~ Delivery Interface(s) ~ None. ~~~~~~~~~~~~~~~~~~~~~~~~~~~~~~~~~~~~~~~~~~~~~~~~~~~~~~~~~~~~~ Service Interface(s) ~~~~~~~~~~~~~~~~~~~~~~~~~~~~~~~~~~~~~~~~~~~~~~~~~~~~~~~~~~~~~ # Service name Role Switch IF Name State Dir Packets Bytes Pkt Rate Bit Rate Counter Reset Time -|------------|------------|---------------------------|-----------|-----|---|-------|--------|--------|--------|------------------------------| 1 ms1 pre-service dmf-r267-tb2-7280dr3am-54-1 Ethernet4/1 up tx 60000 30720000 0 - 2025-10-29 15:55:36.435000 UTC 2 ms1 post-service dmf-r267-tb2-7280dr3am-54-1 Ethernet4/1 up rx 0 0 0 - 2025-10-29 15:55:36.435000 UTC ~ Core Interface(s) ~ None. ~ Failed Path(s) ~ None.
If the managed service is down, the show fabric warnings
service-action-invalid command provides troubleshooting details.
dmf-controller-1> show fabric warnings service-action-invalid ~~~~~~~~~~~~~~~~~~~~~~~~~ Service with an invalid action ~~~~~~~~~~~~~~~~~~~~~~~~~~ # Name Warning -|-------|-------------------------------------------------------------------------| 1 record2 Managed service record2 has invalid action record; Recording action is not supported on service node
Recording Health
The following commands display recording health stats for an SN.
Mount Health
The show service-node name recording
mount-health command displays the status of the file system mount points.
dmf-controller-1> show service-node sn1 recording mount-health Collection Time : 2025-10-30 04:40:38 UTC ~~~~~~~~~~~~~~~~~~ Index Mount(s) ~~~~~~~~~~~~~~~~~~ Volume Mount Point File System Mount Point Health ---------|-----------|-----------|------------------| /dev/sdb1 /idx xfs healthy ~~~~~~~~~~~~~~~~~~ Packet Mount(s) ~~~~~~~~~~~~~~~~~~ Volume Mount Point File System Mount Point Health ---------|-----------|-----------|------------------| /dev/sda1 /pkt xfs healthy
Query Service Health
The show service-node name recording
query-health command verifies the status of the core query service (Stenographer). This output tracks file initialization and caching metrics across recording instances.
dmf-controller-1> show service-node sn1 recording query-health ~~~~~~~~ Stenographer Application ~~~~~~~~ Collection Time : 2025-10-30 04:45:41 UTC Initialized : True Tracked Files : 1315 Cached Files : 2630 Max Cached Files : 750000 ~~~~~~~~~~ Stenographer Recording Instance ~~~~~~~~~~ Instance Tracked Files Cached Files Max Cached Files --------|-------------|------------|----------------| 4 325 650 187500 8 340 680 187500 9 325 650 187500 10 325 650 187500
Storage Health
The show service-node name recording
storage-health command provides a detailed breakdown of disk utilization for both packet data and indexing metadata.
dmf-controller-1> show service-node sn1 recording storage-health Collection Time : 2025-10-30 04:46:40 UTC Index Utilization : 0% Index Free : 1.73TB Index Total : 1.74TB Backup Index Utilization : 0% Backup Index Free : 0B Backup Index Total : 0B Packet Utilization : 0% Packet Free : 28.9TB Packet Total : 29.1TB Backup Packet Utilization : 0% Backup Packet Free : 0B Backup Packet Total : 0B
Queries
SNs support several query types for retrieving and analyzing recorded data. While the UI supports all query types, the CLI supports only a subset.
Supported Query Types
-
window: Displays the time range of available recorded packets. -
size: Reports the number of packets and total data size matching a filter. -
packet-data: Generates a PCAP file of the filtered traffic. -
packet-object:Generates a TGZ archive of the filtered traffic. -
analysis-http-tree: Analyzes HTTP traffic in a tree structure. -
analysis-http-srv-tree: Analyzes HTTP server traffic in a tree structure. -
analysis-http-stat: Provides HTTP traffic statistics. -
analysis-conv-ipv4: Analyzes IPv4 conversations. -
analysis-conv-ipv6: Analyzes IPv6 conversations. -
analysis-tcp-flow-health: Analyzes the health of TCP flows.
Query Parameters
The following parameters are relevant for SN queries:
-
stenographer-query: The filter string used to select specific packets. -
limit-packets: Restricts the result to a maximum number of packets. -
limit-bytes: Restricts the result to a maximum data size in bytes. -
timeout-ms: (UI only) Sets a time limit for the query execution. -
coalesce: (UI only) Combines results into a single file.
dedup-time-window, dedup-enabled, and fail-fast.Window Query
Use the query recorder-node name
window command to see the data availability range.
dmf-controller-1> query recorder-node sn1 window ~~~~~~~~~~~~~ Window Query Results ~~~~~~~~~~~~~ Oldest Packet Available : 2025-10-27 16:32:31 UTC Newest Packet Available : 2025-10-31 08:27:23 UTC
Size Query
Use the query recorder-node name size filter
"string" command to check data volume.
dmf-controller-1> query recorder-node sn1 size filter "before 5s ago" ~ Size Query Results ~ # Packets : 14766093281 Size : 5.80TB
Packet-Data and Packet-Object Queries
Use the query recorder-node name packet-data filter
"string" or query
recorder-node name packet-object filter
"string" commands to generate download URLs for traffic files.
dmf-controller-1> query recorder-node sn1 packet-data filter "before 5s ago" ~~~~~~~~~~~~~~~~~~~~~~~~~~~ Packet Data Query Results ~~~~~~~~~~~~~~~~~~~~~~~~~~~~~ Coalesced URL : /pcap/__packet_recorder__/coalesced-dmf-2025-10-31-19-11-59-78f69b5f.pcap Individual URL(s) : /pcap/__packet_recorder__/sn1-2025-10-31-19-11-39-679a8cac.pcap
dmf-controller-1> query recorder-node sn1 packet-object filter "before 5s ago" ~~~~~~~~~~~~~~~~~~~~~~~~~~~ Packet Object Query Results ~~~~~~~~~~~~~~~~~~~~~~~~~~~~~ Coalesced URL : /pcap/__packet_recorder__/coalesced-dmf-2025-10-31-19-17-23-471a96d2.tgz Individual URL(s) : /pcap/__packet_recorder__/sn1-2025-10-31-19-17-23-45f9decd.tgz
Managing Queries
Abort Query
Use the abort recorder-node name filter
"string" command to cancel ongoing queries. SNs currently support cancellation by the filter string rather than by query ID.
dmf-controller-1> abort recorder-node sn1 filter "before 5s ago" Abort any request with the specified filter? This cannot be undone. enter "yes" (or "y") to continue: y None.
Query Cancellation Verification
Executing the abort recorder-node name
filter command terminates any ongoing queries matching the specified filter. For example, a packet-object query running in a separate terminal displays a cancellation error when aborted:
dmf-controller-1> query recorder-node sn1 packet-object filter "before 5s ago" Error: cancelled: Query cancelled None.
Allowed Queries
Use the show recorder-node allowed-queries command to verify which queries a specific user group can execute based on RBAC permissions.
dmf-controller-1> show recorder-node allowed-queries # Recording Device Allowed Query Type --|--------------------|------------------------| 1 sn1 abort 2 sn1 analysis-conv-ipv4 3 sn1 analysis-conv-ipv6 4 sn1 analysis-http-srv-tree 5 sn1 analysis-http-stat 6 sn1 analysis-http-tree 7 sn1 analysis-tcp-flow-health 8 sn1 packet-data 9 sn1 packet-object 10 sn1 size 11 sn1 window 12 sn2 abort 13 sn2 analysis-conv-ipv4 14 sn2 analysis-conv-ipv6 15 ...
Use the show recorder-node query-history command to audit previously executed queries, including the Query string, Type, Start time, and Duration.
dmf-controller-1> show recorder-node query-history # Recording Device Query Type Start Duration ---|--------------------|----------------------------------------------------------|-------------|-----------------------|--------| 1 dmf-rack267-tb2-sn-1 after 1m ago packet-data 2025-10-29 10:01:24 UTC 5258 2 dmf-rack267-tb2-sn-1 after 2025-10-29T10:00:24Z packet-data 2025-10-29 10:01:24 UTC 5258 3 dmf-rack267-tb2-sn-1 after 1m ago packet-data 2025-10-29 10:02:16 UTC 5201 4 dmf-rack267-tb2-sn-1 after 2025-10-29T10:01:16Z packet-data 2025-10-29 10:02:16 UTC 5201 5 dmf-rack267-tb2-sn-1 after 1m ago size 2025-10-29 10:03:35 UTC 5220 6 dmf-rack267-tb2-sn-1 after 2025-10-29T10:02:35Z size 2025-10-29 10:03:35 UTC 5220 7 dmf-rack267-tb2-sn-1 before 1m ago size 2025-10-29 10:05:46 UTC 5219 8 dmf-rack267-tb2-sn-1 before 2025-10-29T10:04:46Z size 2025-10-29 10:05:46 UTC 5219 9 dmf-rack267-tb2-sn-1 before 2025-10-29T10:09:02Z size 2025-10-29 10:10:02 UTC 5196 10 dmf-rack267-tb2-sn-1 before 1m ago size 2025-10-29 10:10:02 UTC 5196 11 dmf-rack267-tb2-sn-1 before 2025-10-29T10:09:25Z size 2025-10-29 10:10:25 UTC 5212 12 dmf-rack267-tb2-sn-1 before 1m ago size 2025-10-29 10:10:25 UTC 5212 13 dmf-rack267-tb2-sn-1 before 1m ago size 2025-10-29 10:10:44 UTC 5194 14 dmf-rack267-tb2-sn-1 before 2025-10-29T10:09:44Z size 2025-10-29 10:10:44 UTC 5194 15 dmf-rack267-tb2-sn-1 before 2025-10-29T10:17:33Z size 2025-10-29 10:18:33 UTC 5208 16 dmf-rack267-tb2-sn-1 before 1m ago size 2025-10-29 10:18:33 UTC 5208 17 dmf-rack267-tb2-sn-1 before 1m ago size 2025-10-29 10:20:19 UTC 5214 18 dmf-rack267-tb2-sn-1 before 2025-10-29T10:19:19Z size 2025-10-29 10:20:19 UTC 5214 19 dmf-rack267-tb2-sn-1 before 2025-10-29T10:16:51Z packet-data 2025-10-29 10:26:51 UTC 5547 20 dmf-rack267-tb2-sn-1 before 10m ago packet-data 2025-10-29 10:26:51 UTC 5547 21 dmf-rack267-tb2-sn-1 before 10m ago packet-data 2025-10-29 10:55:36 UTC 5554
Quick Verification Commands
- Confirm Recording Support: Use the
show service-node propertycommand to ensure the SN hardware supports recording. - Verify Table Programming: Use the
show service-node table contents recordcommand to confirm the recording gentable is active. - Audit Disk Writes: Use the
show managed-service-device statscommand to compare Rx packets against Applied packets, ensuring data is successfully written to disk.
Troubleshooting
The following steps facilitate troubleshooting when the record action is configured on a Service Node but is not performing as expected:
- Use the
show service-node name propertycommand to check if the Service Node supports recording. - Check for any managed service action related warnings using the
show fabric warnings service-action-invalidcommand. - Use the
show managed-service namecommand to verify if the service is installed. - Use the
show service-node name interface statscommand to show the Rx/Tx stats including drops and errors. - Verify policy status, as a policy using the record managed service can fail if a delivery interface is added to the configuration, or if the record service is inactive due to the reasons mentioned above.
- Use the
show policy namecommand to verify if the traffic is being sent to the service interface. This command does not confirm if the Service Node is actually recording the packets to the disk, but the output provides an indication that the policy configuration is working as expected and the issue is likely on the Service Node. - If the Controller side config appears correct, verify if the Service Node is informed of recording being enabled. This verification is performed by checking if the record gentable is successfully programmed on the Service Node. Use the
show service-node name table contents recordcommand to verify the table. - If there is any discrepancy between the interface stats and the data recorded on the SN, use the following command to check the Service Node disk and recording engine health.
dmf-controller-1> show service-node name recording [mount-health | query-health | storage-health]
If a query fails to run, verify the necessary permissions by checking allowed queries with the
show recorder-node allowed-queriescommand.
Use the show debug debug-counters name
description command to view SN debug counters pertaining to writing packets to disk.
dmf-controller-1> show debug debug-counters dmf-rack267-tb2-sn-1 description | grep record # Service node ID Counter Name Description Value ---|--------------------|---------------------------------------|-------------------------------------------|---------| 238 dmf-rack267-tb2-sn-1 record.lcore10.close_complete close_complete 13 239 dmf-rack267-tb2-sn-1 record.lcore10.file_rotate file rotate 13 240 dmf-rack267-tb2-sn-1 record.lcore10.in_flight_write_complete in_flight_write_complete 13 241 dmf-rack267-tb2-sn-1 record.lcore10.ioring_close_wakeup ioring_close_wakeup 13 242 dmf-rack267-tb2-sn-1 record.lcore10.ioring_rename_wakeup ioring_rename_wakeup 13 243 dmf-rack267-tb2-sn-1 record.lcore10.ioring_write_wakeup ioring_write_wakeup 13 244 dmf-rack267-tb2-sn-1 record.lcore10.rename_complete rename to active file completed 13 245 dmf-rack267-tb2-sn-1 record.lcore10.uring_cq_pop uring_cq_pop 39 246 dmf-rack267-tb2-sn-1 record.lcore10.write_active write active block 13 247 dmf-rack267-tb2-sn-1 record.lcore10.write_total count of in-flight writes 13 248 dmf-rack267-tb2-sn-1 record.lcore4.close_complete close_complete 13 249 dmf-rack267-tb2-sn-1 record.lcore4.file_rotate file rotate 13 250 dmf-rack267-tb2-sn-1 record.lcore4.in_flight_write_complete in_flight_write_complete 13 251 dmf-rack267-tb2-sn-1 record.lcore4.ioring_close_wakeup ioring_close_wakeup 13 252 dmf-rack267-tb2-sn-1 record.lcore4.ioring_rename_wakeup ioring_rename_wakeup 13 253 dmf-rack267-tb2-sn-1 record.lcore4.ioring_write_wakeup ioring_write_wakeup 13 254 dmf-rack267-tb2-sn-1 record.lcore4.rename_complete rename to active file completed 13 255 dmf-rack267-tb2-sn-1 record.lcore4.uring_cq_pop uring_cq_pop 39 256 dmf-rack267-tb2-sn-1 record.lcore4.write_active write active block 13 257 dmf-rack267-tb2-sn-1 record.lcore4.write_total count of in-flight writes 13 258 dmf-rack267-tb2-sn-1 record.lcore8.close_complete close_complete 13 259 dmf-rack267-tb2-sn-1 record.lcore8.file_rotate file rotate 13 260 dmf-rack267-tb2-sn-1 record.lcore8.in_flight_write_complete in_flight_write_complete 13 261 dmf-rack267-tb2-sn-1 record.lcore8.ioring_close_wakeup ioring_close_wakeup 13 262 dmf-rack267-tb2-sn-1 record.lcore8.ioring_rename_wakeup ioring_rename_wakeup 13 263 dmf-rack267-tb2-sn-1 record.lcore8.ioring_write_wakeup ioring_write_wakeup 13 264 dmf-rack267-tb2-sn-1 record.lcore8.rename_complete rename to active file completed 13 265 dmf-rack267-tb2-sn-1 record.lcore8.uring_cq_pop uring_cq_pop 39 266 dmf-rack267-tb2-sn-1 record.lcore8.write_active write active block 13 267 dmf-rack267-tb2-sn-1 record.lcore8.write_total count of in-flight writes 13 268 dmf-rack267-tb2-sn-1 record.lcore9.close_complete close_complete 13 269 dmf-rack267-tb2-sn-1 record.lcore9.file_rotate file rotate 13 270 dmf-rack267-tb2-sn-1 record.lcore9.in_flight_write_complete in_flight_write_complete 13 271 dmf-rack267-tb2-sn-1 record.lcore9.ioring_close_wakeup ioring_close_wakeup 13 272 dmf-rack267-tb2-sn-1 record.lcore9.ioring_rename_wakeup ioring_rename_wakeup 13 273 dmf-rack267-tb2-sn-1 record.lcore9.ioring_write_wakeup ioring_write_wakeup 13 274 dmf-rack267-tb2-sn-1 record.lcore9.rename_complete rename to active file completed 13 275 dmf-rack267-tb2-sn-1 record.lcore9.uring_cq_pop uring_cq_pop 39 276 dmf-rack267-tb2-sn-1 record.lcore9.write_active write active block 13 277 dmf-rack267-tb2-sn-1 record.lcore9.write_total count of in-flight writes 13
Additional record debug counters that indicate potential issues include:
- missing_tmc : missing traffic metadata config
- no_timestamp : no timestamp in traffic metadata
- in_flight_empty : unable to allocate write-block
- write_error : write error
- packets_lost : number of packets which write failed
- active_null : number of packets lost due to insufficient blocks/buffers
- post_error : failure when posting request
- cqe_op_unknown : uring cqe op unknown
- completion_user_data : uring completion user_data value out of bounds
- record_file_exhaustion : unable to allocate files entry
- open_fail : unable to open/create record file
- chown_fail : unable to chown record file
Limitations
- The Service Node will not provide
memoryandcpustats for recording-specific applications, as the device can support other features while recording, so resource usage is not exclusive to packet recording. - In this release, the Service Node supports only a subset of the queries available on a Recorder Node. The Service Node does not support the following queries:
sip-conversationstcp-conversationsudp-conversationsanalysis-dns-treehttp-requesthostrtp-streamhttp-statisticsevent
- The Service Node also excludes support for the following operations:
- Erasing packets from a SN (
delete recorder-node name ...). - Replay packets (
replay recorder-node name ...). - Ongoing queries (
show recorder-node queries). - Query cancellation is only doable using
filter, and not byid. In other words,abort recorder-node name id ...is not supported.
- Erasing packets from a SN (
- Service Nodes do not support the packet storage management options available for Recorder Nodes. Instead, the Service Node uses a fixed storage management policy. After the packet or index disk reaches 95% capacity, the system automatically deletes the oldest stored packets. The device will delete the minimum amount of packets required to fall below this threshold. In Recorder Node terms, the Service Node uses a
max-disk-utilizationof 95 and adisk-full-policyofrolling-fifo.
Session Slicing for TCP and UDP Sessions
Session-slice keeps track of TCP and UDP sessions (distinguished by source and destination IP address and port) and counts the number of packets sent in each direction (client-to-server and vice versa). After recognizing the session, the action transmits a user-configured number of packets to the tool node.
For TCP packets, session-slice tracks the number of packets sent in each direction after establishing the TCP handshake. Slicing begins after the packet count in a direction has reached the configured threshold in both directions.
For UDP packets, slicing begins after reaching the configured threshold in either direction.
By default, session-slice will operate on both TCP and UDP sessions but is configurable to operate on only one or the other.
Refer to the DANZ Monitoring Fabric (DMF) Verified Scale Guide for session-slicing performance numbers.
Configure session-slice in managed services through the Controller as a Service Node action.
Configure Session Slicing
Configure session-slice in managed services through the Controller as a Service Node action.
action keyword is required to add or modify actions within a managed service.Configuration Steps
The following show commands provide helpful information.
show running-config managed-service managed
service
command helps verify whether the session-slice configuration is complete.
dmf-controller-1(config)# show running-config managed-service managed_service_1
! managed-service
managed-service managed_service_1
!
1 action session-slice
slice-after 1000
idle-timeout 60000
show managed-services managed service command provides status information about the service.
dmf-controller-1(config)# show managed-services managed_service_1
# Service Name Switch Switch Interface Installed Max Post-Service BW Max Pre-Service BW Total Post-Service BW Total Pre-Service BW
-|-----------------|---------------|----------------|---------|-------------------|------------------|---------------------|--------------------|
1 managed_service_1 DCS-7050CX3-32S ethernet2/4 True 25Gbps 25Gbps 624Kbps 432Mbps
Regex-Session Action
Description
The regex-session action enables matching of Regular Expression patterns against packet content. When a packet matches the specified pattern, its session is tracked based on configured timeouts and other parameters including, anchor, offset, and ip-proto.
| Parameter | Description | Optional |
|---|---|---|
pattern |
Regular expression to match against packet content. | No |
anchor |
Anchor where to start regex matching. The default is packet-start. | Yes |
offset |
Offset from anchor where to start regex matching. The default is 0. | Yes |
tcp-idle-timeout |
The number of milliseconds a TCP connection may be idle before it is removed from the session cache. The default is 60000 milliseconds. | Yes |
udp-idle-timeout |
The number of milliseconds a UDP connection may be idle before it is removed from the session cache. The default is 60000 milliseconds. | Yes |
ip-proto |
Protocol to track. 6=TCP or 17=UDP. If not specified, both protocols are tracked. | Yes |
Configuration
Command Line Interface
action keyword is required to add or modify actions within a managed service.Configure the regex-session action under the managed-service submode. To configure regex-session parameters, enter the regex-session submode and configure the parameters in the regex-session submode.
Configuration Notes:
-
Configuring an anchor requires specifying an offset value.
-
The pattern must be a valid Java regular expression.
-
DMF only supports TCP and UDP protocols for tracking.
dmf-controller-1(config)# managed-service Test
dmf-controller-1(config-managed-srv)# 1 action regex-session
dmf-controller-1(config-managed-srv-regex-session)# pattern [a-zA-Z0-9._%+-]+@[a-zA-Z0-9.-]+\.[a-zA-Z]{2,}
Configure optional parameters.
dmf-controller-1(config-managed-srv-regex-session)# ip-proto <Ip-proto> Protocol to track. 6=TCP or 17=UDP. If not specified, both protocols are tracked. dmf-controller-1(config-managed-srv-regex-session)# ip-proto 6 dmf-controller-1(config-managed-srv-regex-session)# anchor l3-header-start l4-payload-start ; > l4-header-start packet-start | <cr> dmf-controller-1(config-managed-srv-regex-session)# anchor l3-header-start Offset from configured anchor dmf-controller-1(config-managed-srv-regex-session)# anchor l3-header-start 10 dmf-controller-1(config-managed-srv-regex-session)# tcp-idle-timeout 50000 dmf-controller-1(config-managed-srv-regex-session)# udp-idle-timeout 65000
Show Commands
The show commands specific to regex-session have not changed from standard managed service commands. If a managed service includes regex-session actions, the output displays those actions and their parameters along with the other configured actions.
dmf-controller-1(config-managed-srv)# show running-config managed-service Test
! managed-service
managed-service Test
!
1 regex-session
anchor l3-header-start 10
ip-proto 6
pattern [a-zA-Z0-9._%+-]+@[a-zA-Z0-9.-]+\.[a-zA-Z]{2,}
tcp-idle-timeout 50000
udp-idle-timeout 65000
Filter Managed Service Action
The Filter Managed Service Action filters packets on the Service Node (SN) interface and supports optional VLAN tagging. Utilizing ACL rules, the system forwards or drops matched traffic. Traffic tagged with a VLAN exits the interface (Tx) after processing through the action chain. VLAN tagging specifically facilitates traffic steering in Switch-less SN deployments, where the forwarding plane relies on VLANs. This configuration produces no functional impact when the SN connects directly to a DMF switch within the fabric.
The feature is compatible with all platforms.
Configuration
Managed service configuration supports Service Nodes connected to a DMF switch or operating in switch-less mode. The configured interface type (installation point) determines how the service is programmed. Configure the Filter Managed Service Action feature using the GUI or CLI. A Summary section provides a consolidated reference of the Filter Managed Service Action specifications, configuration limits, and operational behaviors.
Using the CLI to Configure Filter Managed Service Action
Configure a managed service using the following command.
dmf-controller-1> dmf-controller-1> en dmf-controller-1# config dmf-controller-1(config)# managed-service ms1
Configure a Service Interface
Configuring the Service Interface triggers a validation sequence. The system verifies that the SN connects to a DMF switch and that a policy utilizes the service. The Controller proceeds with installation on the SN only after passing these checks.
dmf-controller-1(config-managed-srv)# service-interface switch core1 ethernet
Configure a Service Node Interface
Configuring the Service Node Interface designates the managed service for switch-less operation. This mode applies when the SN lacks a physical connection to a DMF switch or when the Controller is unable to discover the link. The Controller installs the managed service immediately upon valid configuration, without requiring policy association. However, any DMF policy configured with this service will fail due to the absence of a reachability path from the fabric.
dmf-controller-1(config-managed-srv)# service-node-interface service-node sn1 sni1 dmf-controller-1(config-managed-srv)# service-node-interface service-node sn1 sni2
Configure Filter Action
The Filter action functions at any position within the managed service action sequence. Configuring it as the initial action filters and tags traffic on the service node interface, passing only the filtered traffic to subsequent actions in the chain.
action keyword is required to add or modify actions within a managed service.dmf-controller-1(config-managed-srv)# 1 action filter
Default Actions and Overrides
The Filter configuration supports defining a default action and an optional forwarding VLAN. The system applies this default behavior to every ACL rule upon installation, though individual rules can override it.
In the following example, the configuration tags matching packets with VLAN 100 and forwards them to the service node interface Tx (post-processing).
dmf-controller-1(config-managed-srv-filter)# default action forward push-vlan 100
ACL Rule Structure
ACL definitions begin with a sequence number that determines the packet matching order (lowest to highest). The logic supports 5-tuple matching based on:
- Source/Destination IP
- Source/Destination Port
- Protocol Number
Rule Configuration Examples
- Action Override (Drop) Specific ACL rules can override the global default action. The following command drops TCP traffic from Source IP
1.1.1.1to Destination IP2.2.2.2, provided the packet does not match a lower-sequence rule.dmf-controller-1(config-managed-srv-filter)# 10 drop src-ip 1.1.1.1 dst-ip 2.2.2.2 ip-proto 6
- Subnet Matching Source and Destination IP fields support subnet masks to match specific host ranges.
dmf-controller-1(config-managed-srv-filter)# 9 src-ip 192.168.1.1 255.255.255.0 src-port 22
- 3. Port Ranges The configuration accepts individual ports or port ranges. The following rule matches TCP traffic from the specified Source IP/Port to any destination port within the range
1–100.dmf-controller-1(config-managed-srv-filter)# 8 src-ip 192.168.1.1 src-port 100 range-dst-port 1 100 ip-proto 6
Runtime Expansion Logic
The Controller expands missing matches at runtime to generate complete rules. A complete rule strictly requires Source/Destination IP, Source/Destination Port, and Protocol Number.
- IP Expansion: If the configuration lacks a specific IP match, the Controller generates ACL rules for both IPv4 and IPv6 using the corresponding wildcard values.
- Protocol Expansion: If the protocol remains undefined, the Controller expands the entry into separate ACL rules for TCP and UDP traffic.
11 drop
any, triggers the Controller to generate four distinct rules to cover all IP versions and protocols:
11 drop src-ip 0.0.0.0 dst-ip 0.0.0.0 range-src-port 1 65535 range-dst-port 1 65535 ip-proto 6 12 drop src-ip 0.0.0.0 dst-ip 0.0.0.0 range-src-port 1 65535 range-dst-port 1 65535 ip-proto 17 13 drop src-ip ::0 dst-ip ::0 range-src-port 1 65535 range-dst-port 1 65535 ip-proto 6 14 drop src-ip ::0 dst-ip ::0 range-src-port 1 65535 range-dst-port 1 65535 ip-proto 17
Max Rule Limits
Each Filter managed service action supports a maximum of 2048 rules. The Controller calculates this total based on the expanded runtime rules rather than the initial configuration lines.
The system tracks IPv4 and IPv6 rules in separate tables, with each table supporting 1024 entries post-expansion.
- Capacity Handling: Upon reaching table capacity, the system halts the installation of further expanded rules.
- Overflow Behavior: The Controller skips any configured rule if the corresponding table (IPv4 or IPv6) is full.
Show Commands
Use the show running-config managed-service Service
name command to display the complete configuration for a managed service.
The following example illustrates a managed service (ms1) configured with a Filter function on a switch-less Service Node (sn1). The deployment targets interfaces sni1 and sni2, implementing two forward rules and one drop rule.
dmf-controller-1# show running-config managed-service ms1
! managed-service
managed-service ms1
service-node-interface service-node sn1 sni1
service-node-interface service-node sn1 sni2
!
1 action filter
default action forward push-vlan 100
8 src-ip 192.168.1.1 src-port 100 range-dst-port 1 100 ip-proto 6
9 src-ip 192.168.1.1 255.255.255.0
11 drop any
!
2 action dedup
region full-packet
window-duration 2
Use the show managed-service Service name command to verify that the system successfully installed the managed service on the Service Node.
For switch-less Service Node deployments, the output omits the switch name and interface details.
dmf-controller-1# show managed-service ~~~~~~~~~~~~~~~~~~~~~~~~~~~~~~~~~~~~~~~~~~~~~~~~~~~~~~~~~ Managed-service ~~~~~~~~~~~~~~~~~~~~~~~~~~~~~~~~~~~~~~~~~~~~~~~~~~~~~~~~~ # Service Name Switch Switch Interface Installed Max Post-Service BW Max Pre-Service BW Total Post-Service BW Total Pre-Service BW -|------------|------|----------------|---------|-------------------|------------------|---------------------|--------------------| 1 ms1 True 2Gbps 2Gbps 792bps 2.19Kbps
Use the show managed-service-device Service node
name command to verify the actions installed on Service Node interfaces. The output displays the service name for each interface and provides statistics for each configured action within the managed service.
dmf-controller-1# show managed-service-device sn1 ~~~~~~~~~~~~~ Device ~~~~~~~~~~~~~ Service Node Name : sn1 Service Node IP : 10.243.254.159 ~~~~~~~~~~~~~~~~~~~~~~~~~ Interfaces ~~~~~~~~~~~~~~~~~~~~~~~~~ # Service Node Interface Switch Switch Interface Service Name -|------------|---------|------|----------------|------------| 1 sn1 sni1 ms1 2 sn1 sni2 ms1 ~~~~~~~~~~~~~~~~~~~~~~~~~~~~~~~~~~~~~~~~~~~~~~~~~~~~~~~~~~~~~~~~~~~~~~~~~~~~~~ Stats ~~~~~~~~~~~~~~~~~~~~~~~~~~~~~~~~~~~~~~~~~~~~~~~~~~~~~~~~~~~~~~~~~~~~~~~~~~~~~~ # Service Node Interface Name Function Service Name Rx packets Rx bytes Rx Bit Rate Applied packets Applied bytes Applied Bit Rate Tx packets Tx bytes Tx Bit Rate -|------------|--------------|--------|------------|----------|--------|-----------|---------------|-------------|----------------|----------|--------|-----------| 1 sn1 sni1 filter ms1 303 18180 319bps 303 18180 319bps 0 0 - 2 sn1 sni2 filter ms1 304 18250 319bps 304 18250 319bps 0 0 -
Applied statistics vary based on the specific action type. For the Filter action, these metrics quantify the traffic matching the configured ACL rules:
- Applied packets: Total count of matched packets.
- Applied bytes: Total count of matched bytes.
- Applied rate: Current data rate of matched traffic.
Troubleshooting
- Verify Managed Service Installation: Execute the
show managed-servicecommand to confirm successful installation. Absence from the output indicates configuration processing failures or runtime errors. - Verify Action Sequence: Execute the
show managed-service-devicecommand to confirm the action sequence installation on all service node interfaces. Consult the Service Node and Controller logs for detailed information on specific installation failure. - Verify Packet Flow and Logic: Analyze Rx/Tx statistics using
show managed-service-device Service node name statsandshow service-node Service node name interface statsto validate traffic processing. For example, comparable Tx and Rx counts on an interface configured with adrop filteraction indicate that the ACL rules are not matching packets.
Resources
Switch-less Service Node TOI for deploying managed services on a Service Node not connected to a switch in DMF fabric.
VN-TAG Decapsulation
VN-TAG Decapsulation (decap) provides native support for removing the VN-TAG header within the DMF platform. Execution occurs directly on the DMF Service Node to process traffic frames. The Controller schema and standard CLI workflow facilitate comprehensive control-plane support. All DMF Service Nodes support this feature.
Configuration
Configure the feature using the decap-vntag action within a managed service, which enables the Service Node to identify the VN-TAG (by inspecting up to seven VLAN tags) and remove the header before forwarding the resulting frame.
Show Commands
The show running-config managed-service command outputs the configuration of the decap-vntag action for a given managed-service.
dmf-controller-1# show running-config managed-service
! managed-service
managed-service vntag-s1
!
1 action decap-vntag
drop
The show running-config policy policy-name command displays the policy configuration, including the decap-vntag managed service.
dmf-controller-1# show running-config policy drop-decap-vntag ! policy policy drop-decap-vntag action forward delivery-interface delivery1 filter-interface filter1 start on-date-time 2025-09-19T08:49:06.138000+00:00 use-managed-service vntag-s1 sequence 1 optional 1 match any
Controller Schema Additions
The decap action feature adds a new entry for the decap-vntag action to the managed-service-action type.
typedef managed-service-action {
description "Defines the actions supported by a managed service";
type enumeration {
...
...
enum decap-vntag {
description "Remove VNTag header";
}
...
...
}
}
The option decap-vntag is a supported managed-service action.
module dmf {
container applications {
container dmf {
list managed-service {
list action {
...
...
container decap-vntag {
presence "name=decap-vntag";
uses dmf-types:managed-service-decap-common;
}
...
...
}
}
}
}
}
CLI Configuration Workflow
Configure a managed-service with the decap-vntag action in the config mode. Use the optional drop parameter to discard any incoming packets that do not contain a VN-TAG.
action keyword is required to add or modify actions within a managed service.dmf-controller-1# en
dmf-controller-1# config
dmf-controller-1(config)# managed-service vntag-s1
dmf-controller-1(config-managed-srv)# 1 action decap-vntag
dmf-controller-1(config-managed-srv-decap-vntag)# drop
dmf-controller-1(config-managed-srv-decap-vntag)# show this
! managed-service
managed-service vntag-s1
!
1 action decap-vntag
drop
Create a policy with a filter-interface, delivery-interface, and action. Add a decap-vntag managed-service in the policy using following commands:
dmf-controller-1# en dmf-controller-1# config dmf-controller-1(config)# policy drop-decap-vntag dmf-controller-1(config-policy)# use-managed-service vntag-s1 sequence 1 dmf-controller-1(config-policy)# show this ! policy policy drop-decap-vntag action forward delivery-interface delivery1 filter-interface filter1 start on-date-time 2025-09-19T08:49:06.138000+00:00 use-managed-service vntag-s1 sequence 1 1 match any
Implementation
Service Node decap action Implementation
The Service Node actively decapsulates VN-TAG frames by examining up to seven VLAN tags to locate the VN-TAG header precisely. After locating the VN-TAG, the Service Node removes the single header and forwards the clean frame. The action's statistics track the entire process:
rx-frame/rx-byte: Counts frames received by the action.applied-frame/applied-count: Identifies frames that contain a VN-TAG.tx-frame/tx-bytes: Tracks the final count of frames forwarded after decapsulation.
Configuring the Arista Analytics Node
Arista Analytics Node capabilities are enhanced to handle NetFlow V5/V9 and IPFIX Packets. All these flow data are represented with the Netflow index.
Enter the 1 netflow command and identify the configuration name and the submode changes to the config-managed-srv-netflow mode for viewing and configuring a specific NetFlow configuration.
action keyword is required to add or modify actions within a managed service.The DMF Service Node replicates NetFlow packets received without changing the source IP address. Packets that do not match the specified destination IP address and packets that are not IPv4 or UDP are passed through. To configure a NetFlow-managed service, perform the following steps:
Multiple Services Per Service Node Interface
The service-node capability is augmented to support more than one service action per service-node interface. Though this feature is economical regarding per-interface cost, it could cause packet drops in high-volume traffic environments. Arista Networks recommends using this feature judiciously.
action keyword is required to add or modify actions within a managed service.controller-1# show running-config managed-service Test ! managed-service managed-service Test service-interface switch CORE-SWITCH-1 ethernet13/1 1 action dedup full-packet window 2 2 action mask BIGSWITCH 3 action slice l4-payload-start 0 ! 4 action netflow an-collector collector 10.106.6.15 udp-port 2055 mtu 1500
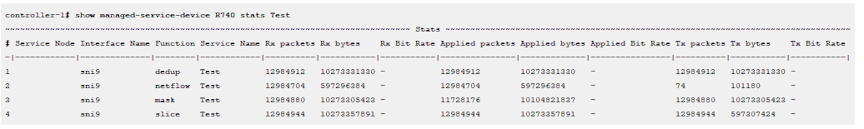
- The NetFlow/IPFIX-action configuration should not be followed by the timestamp service action.
- Ensure the UDP-replication action configuration is the last service in the sequence.
- The header-stripping service with post-service-match rule configured should not be followed by the NetFlow, IPFIX, udp-replication, timestamp and TCP-analysis services.
- When configuring a header strip and slice action, the header strip action must precede the slice action.
Using SNMP to Monitor DPDK Service Node Interfaces
interfaces MIB: ❵.1.3.6.1.2.1.2❵ ifMIBObjects MIB: ❵.1.3.6.1.2.1.31.1❵
snmpget -v2c -c public 10.106.6.5 .1.3.6.1.2.1.31.1.1.1.6.105 IF-MIB::ifHCInOctets.105 = Counter64: 10008
snmpget -v2c -c public 10.106.6.5 .1.3.6.1.2.1.31.1.1.1.10.105 IF-MIB::ifHCOutOctets.105 = Counter64: 42721
[root@TestTool anet]# snmpwalk -v2c -c onlonl 10.106.6.6 .1.3.6.1.2.1.2.2.1.8.109 IF-MIB::ifOperStatus.109 = INTEGER: down(2) [root@TestTool anet]# snmpwalk -v2c -c onlonl 10.106.6.6 .1.3.6.1.2.1.2.2.1.8.105 IF-MIB::ifOperStatus.105 = INTEGER: up(1)
Service Node Management Migration L3ZTN
After the first boot (initial configuration) is completed, in the case of Layer-3 topology mode an administrator can move a Service Node (SN) from an old DANZ Monitoring Fabric (DMF) Controller to a new one via the CLI.
pre-configure.
To migrate a Service Node's management to a new Controller, follow the steps outlined below:
Redundancy of Managed Services in Same DMF Policy
Using the CLI to Configure a Backup Managed Service
action keyword is required to add or modify actions within a managed service.Packet Slicing on the 7280 Switch
This feature removes unwanted or unneeded bytes from a packet at a configurable byte position (offset). This approach is beneficial when the data of interest is situated within the headers or early in the packet payload. This action reduces the volume of the monitoring stream, particularly in cases where payload data is not necessary.
Another use case for packet slicing (slice action) can be removing payload data to ensure compliance with the captured traffic.
Within the DANZ Monitoring Fabric (DMF) fabric, two types of slice-managed services (packet slicing service) now exist. These types are distinguished based on whether installing the service on a service node or on an interface of a supported switch. The scope of this document is limited to the slice-managed service configured on a switch. The managed service interface is the switch interface used to configure this service.
All DMF 8.4 and above compatible 7280 switches support this feature. Use the show switch all property command to check which switch in DMF fabric supports this feature. The feature is supported if the Min
Truncate Offset and Max Truncate Offset properties have a non-zero value.
# show switch all property # Switch Min Truncate Offset ... Max Truncate Offset -|------|-------------------| ... |--------------------------------- 1 7280 100 ... 9236 2 core1 ...
Using the CLI to Configure Packet Slicing - 7280 Switch
slice-managed service on a switch using the following steps.
action keyword is required to add or modify actions within a managed service.This feature requires the service interface to be in MAC loopback mode.
Once a managed service for slice action exists, any policy can use it.
Key points to consider while configuring the slice action on a supported switch:
- Only the
packet-startanchor is supported. - Ensure the offset is within the Min/Max truncate size bounds reported by the
show switch all propertycommand. If the configured value is beyond the bound, then DMF chooses the closest value of the range.For example, if a user configures the offset as 64, and the min truncate offset reported by switch properties is 100, then the offset used is 100. If the configured offset is 10,000 and the max truncate offset reported by the switch properties is 9236, then the offset used is 9236.
- A configured offset for slice-managed service includes FCS when programmed on a switch interface, which means an offset of 100 will result in a packet size of 96 bytes (accounting for 4-byte FCS).
- Configuring an offset below 17 is not allowed.
- The same service interface cannot chain multiple managed services.
- The insert-original-packet-length option is not applicable for switch-based slice-managed service.
CLI Show Commands
Use the show policy policy name command to see the runtime state of a policy using the slice-managed service. The command shows the service interface information and stats.
Controller# show policy packet-slicing-policy Policy Name : packet-slicing-policy Config Status : active - forward Runtime Status : installed Detailed Status : installed - installed to forward Priority : 100 Overlap Priority : 0 # of switches with filter interfaces : 1 # of switches with delivery interfaces : 1 # of switches with service interfaces : 1 # of filter interfaces : 1 # of delivery interfaces : 1 # of core interfaces : 0 # of services : 1 # of pre service interfaces : 1 # of post service interfaces : 1 Push VLAN : 1 Post Match Filter Traffic : - Total Delivery Rate : - Total Pre Service Rate : - Total Post Service Rate: - Overlapping Policies : none Component Policies : none Runtime Service Names : packet-slicing-7280 Installed Time : 2023-08-09 19:00:40 UTC Installed Duration : 1 hour, 17 minutes ~ Match Rules ~ # Rule -|-----------| 1 1 match any ~~~~~~~~~~~~~~~~~~~~~~~~~~~~~~~~~~~~~~~~ Filter Interface(s) ~~~~~~~~~~~~~~~~~~~~~~~~~~~~~~~~~~~~~~~~ # DMF IF Switch IF Name State Dir Packets Bytes Pkt Rate Bit Rate Counter Reset Time -|------|------|-----------|-----|---|-------|-----|--------|--------|------------------------------| 1 f1 7280 Ethernet2/1 up rx 0 0 0 - 2023-08-09 19:00:40.305000 UTC ~~~~~~~~~~~~~~~~~~~~~~~~~~~~~~~~~~~~~~~ Delivery Interface(s) ~~~~~~~~~~~~~~~~~~~~~~~~~~~~~~~~~~~~~~~ # DMF IF Switch IF Name State Dir Packets Bytes Pkt Rate Bit Rate Counter Reset Time -|------|------|-----------|-----|---|-------|-----|--------|--------|------------------------------| 1 d1 7280 Ethernet3/1 up tx 0 0 0 - 2023-08-09 19:00:40.306000 UTC ~~~~~~~~~~~~~~~~~~~~~~~~~~~~~~~~~~~~~~~~~~~~~~~~~ Service Interface(s) ~~~~~~~~~~~~~~~~~~~~~~~~~~~~~~~~~~~~~~~~~~~~~~~~~ # Service name Role Switch IF Name State Dir Packets Bytes Pkt Rate Bit Rate Counter Reset Time -|-------------------|----|------|------------|-----|---|-------|-----|--------|--------|------------------------------| 1 packet-slicing-7280 pre 7280 Ethernet10/1 up tx 0 0 0 - 2023-08-09 19:00:40.305000 UTC 2 packet-slicing-7280 post 7280 Ethernet10/1 up rx 0 0 0 - 2023-08-09 19:00:40.306000 UTC ~ Core Interface(s) ~ None. ~ Failed Path(s) ~ None.
Use the show managed-services command to view the status of all the managed services, including the packet-slicing managed service on a switch.
Controller# show managed-services
~~~~~~~~~~~~~~~~~~~~~~~~~~~~~~~~~~~~~~~~~~~~~~~~~~~~~~~~~~~~ Managed-services ~~~~~~~~~~~~~~~~~~~~~~~~~~~~~~~~~~~~~~~~~~~~~~~~~~~~~~~~~~~~
# Service Name Switch Switch Interface Installed Max Post-Service BW Max Pre-Service BW Total Post-Service BW Total Pre-Service BW
-|-------------------|------|----------------|---------|-------------------|------------------|---------------------|--------------------|
1 packet-slicing-7280 7280 Ethernet10/1 True 400Gbps 400Gbps 80bps 80bps
~~~~~~~~~~~~~~~~~~~~~~~~~~~~~~~~~~~~~~ Actions of Service Names ~~~~~~~~~~~~~~~~~~~~~~~~~~~~~~~~~~~~~~
# Service Name Sequence Service Action Slice Anchor Insert original packet length Slice Offset
-|-------------------|--------|--------------|------------|-----------------------------|------------|
1 packet-slicing-7280 1 slice packet-start False 101
Using the GUI to Configure Packet Slicing - 7820 Switch
Managed Service Configuration
- To configure or edit a managed service, navigate to the DMF Managed Services page from the Monitoring menu and select Managed Services.
Figure 190. DANZ Monitoring Fabric (DMF) Managed Services 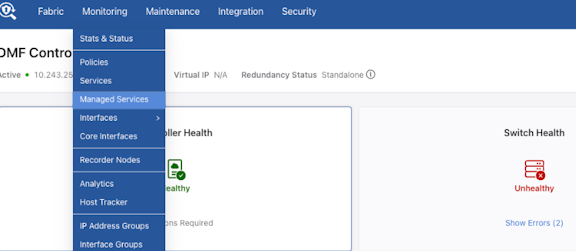
Figure 191. DMF Managed Services Add Managed Service 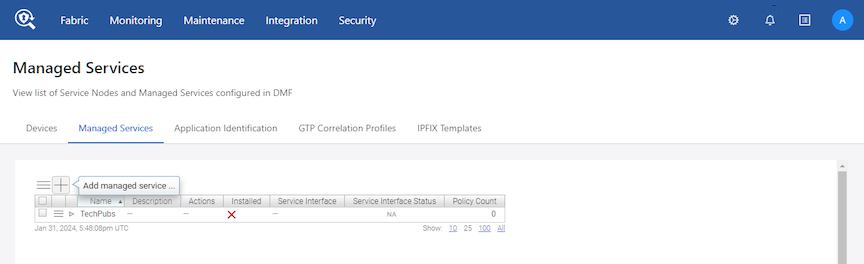
- Configure a managed service interface on a switch that supports packet slicing. Make sure to deselect the Show Managed Device Switches Only checkbox.
Figure 192. Create Managed Service 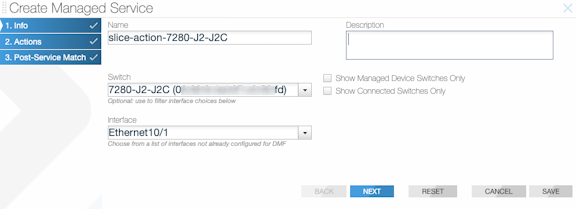
- Configure a new managed service action using Add Managed service action. The action chain supports only one action when configuring packet slicing on a switch.
Figure 193. Add Managed service action 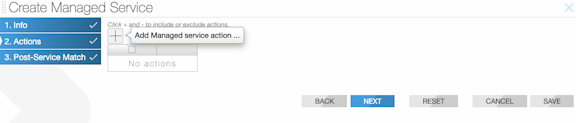
- Use with to configure the packet slicing managed service on a switch.
Figure 194. Configure Managed Service Action 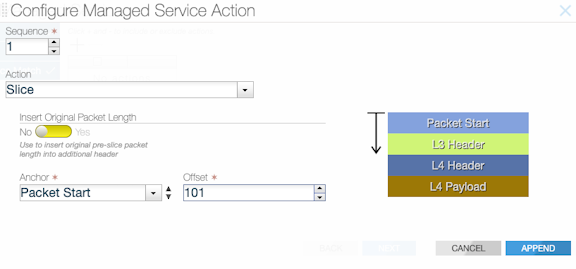
- Select Append to continue. The slice action appears on the Managed Services page.
Figure 195. Slice Action Added 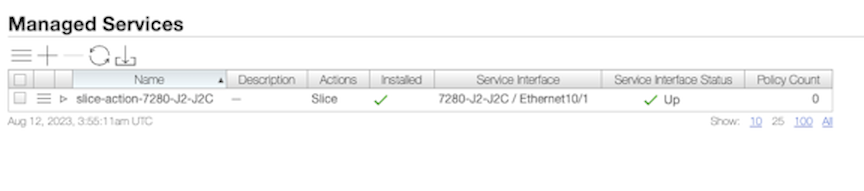
Interface Loopback Configuration
The managed service interface used for slice action must be in MAC loopback mode.
- Configure the loopback mode in the page by selecting the configuration icon of the interface.
Figure 196. Interfaces 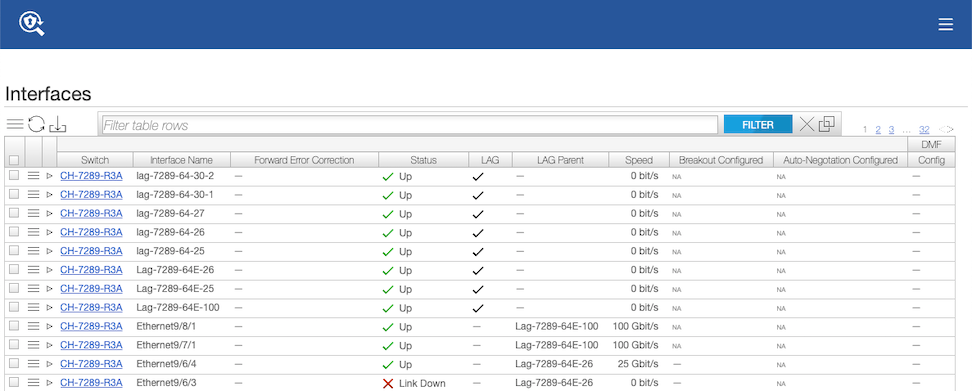 Note: The image above has been edited for documentation purposes. The actual output will differ.
 - Enable the toggle for MAC Loopback Mode (set the toggle to Yes).
Figure 197. Edit Interface 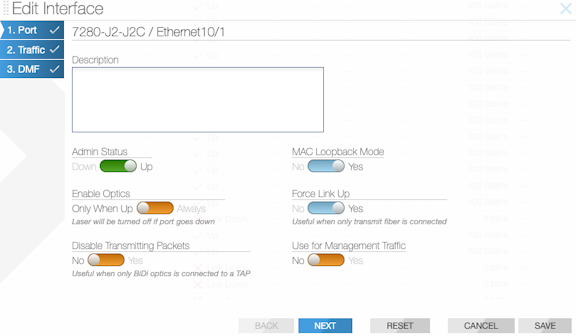
Policy Configuration
- Create a new policy from the DMF Policies page.
Figure 198. DMF Policies Page 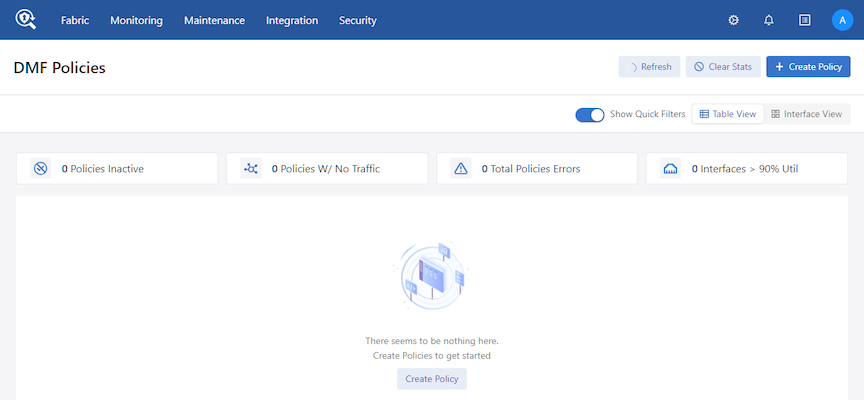
- Add the previously configured packet slicing managed service.
Figure 199. Create Policy 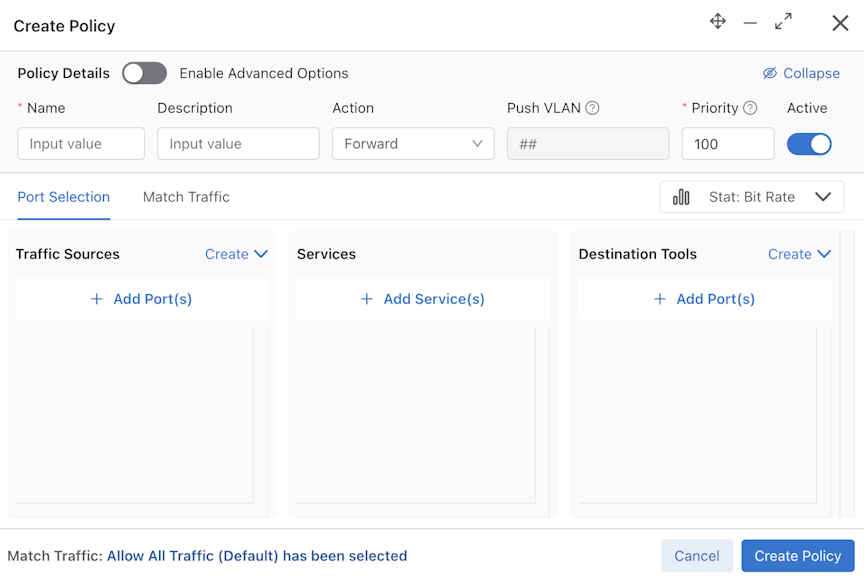
- Select Add Service under the + Add Service(s) option shown above.
Figure 200. Add Service 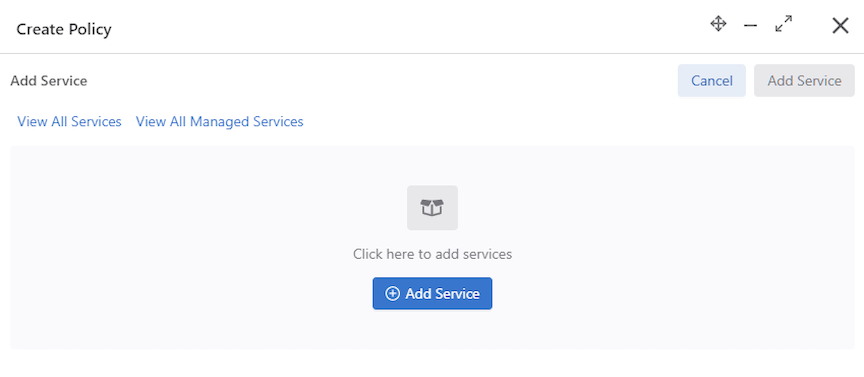
Figure 201. Service Type - Service - Slice Action 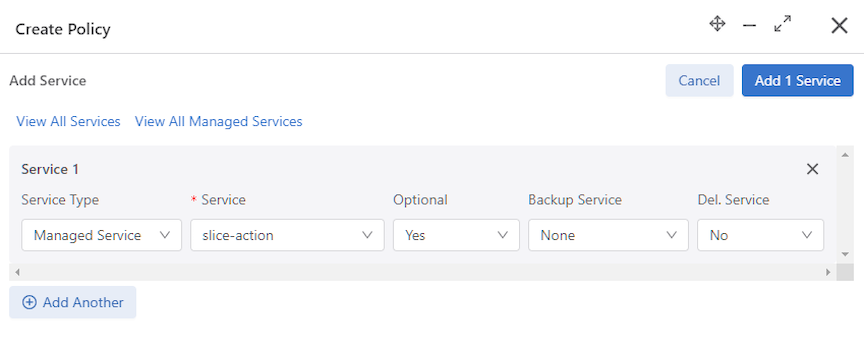
- Select Add 1 Service and the slice-managed service (packet-slicing-policy) appears in the Create Policy page.
Figure 202. Manage Service Added 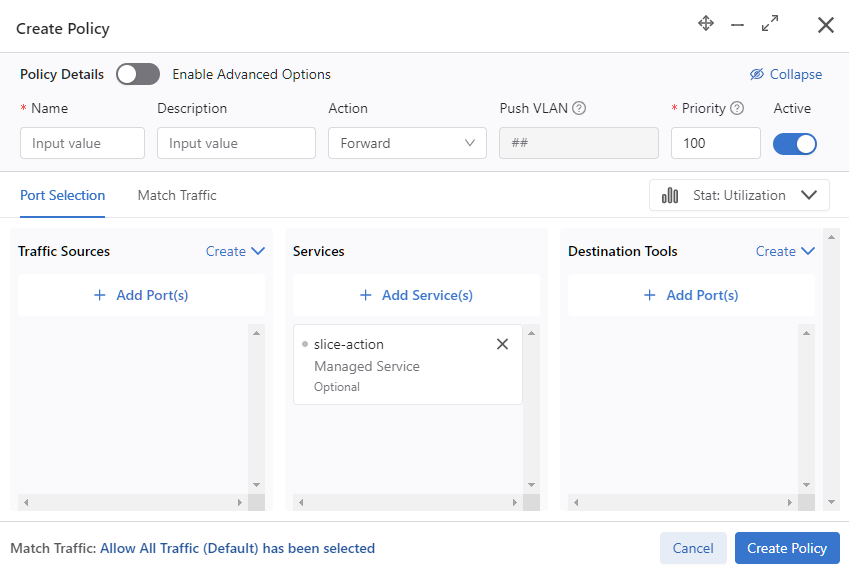
- Select Create Policy and the new policy appears in DMF Policies.
Figure 203. DMF Policy Configured 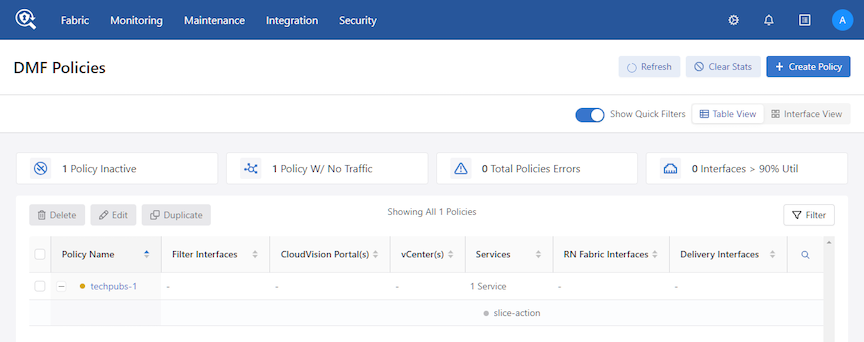 Note: The images above have been edited for documentation purposes. The actual outputs may differ.
Troubleshooting Packet Slicing
The show switch all property command provides upper and lower bounds of packet slicing action’s offset. If bounds are present, the feature is supported; otherwise, the switch does not support the packet slicing feature.
The show fabric errors managed-service-error command provides information when DANZ Monitoring Fabric (DMF) fails to install a configured packet slicing managed service on a switch.
- The managed service interface is down.
- More than one action is configured on a managed service interface of the switch.
- The managed service interface on a switch is neither a physical interface nor a LAG port.
- A non-slice managed service is configured on a managed service interface of a switch.
- The switch does not support packet slicing managed service, and its interface is configured with slice action.
- Slice action configured on a switch interface is not using a packet-start anchor.
- The managed service interface is not in MAC loopback mode.
Use the following commands to troubleshoot packet-slicing issues.
Controller# show fabric errors managed-service-error ~~~~~~~~~~~~~~~~~~~~~~~~~~~~~~~~~~~~~~~~~~~~~~~~~~~~~~~~~~~~~~~~~~ Managed Service related error ~~~~~~~~~~~~~~~~~~~~~~~~~~~~~~~~~~~~~~~~~~~~~~~~~~~~~~~~~~~~~~~~~~ # Error Service Name -|---------------------------------------------------------------------------------------------------------------------------------------------|-------------------| 1 Pre-service interface 7280-Ethernet10/1-to-managed-service on switch 7280 is inactive; Service interface Ethernet10/1 on switch 7280 is down packet-slicing-7280 2 Post-service interface 7280-Ethernet10/1-to-managed-service on switch 7280 is inactive; Service interface Ethernet10/1 on switch 7280 is down packet-slicing-7280
The show switch switch name interface interface
name dmf-stats command provides Rx and Tx rate information for the managed service interface.
Controller# show switch 7280 interface Ethernet10/1 dmf-stats # Switch DPID Name State Rx Rate Pkt Rate Peak Rate Peak Pkt Rate TX Rate Pkt Rate Peak Rate Peak Pkt Rate Pkt Drop Rate -|-----------|------------|-----|-------|--------|---------|-------------|-------|--------|---------|-------------|-------------| 1 7280 Ethernet10/1 down - 0 128bps 0 - 0 128bps 0 0
The show switch switch name interface interface
name stats command provides Rx and Tx counter information for the managed service interface.
Controller# show switch 7280 interface Ethernet10/1 stats # Name Rx Pkts Rx Bytes Rx Drop Tx Pkts Tx Bytes Tx Drop -|------------|-------|--------|-------|-------|--------|-------| 1 Ethernet10/1 22 843477 0 5140 845937 0
Packet Slicing Considerations
- Managed service action chaining is not supported when using a switch interface as a managed service interface.
- When configured for a supported switch, the managed service interface for slice action can only be a physical interface or a LAG.
- When using packet slicing managed service, packets ingressing on the managed service interface are not counted in the ingress interface counters, affecting the output of the
show switch switch name interface interface name statsandshow switch switch name interface interface name dmf-statscommands. This issue does not impact byte counters; all byte counters will show the original packet size, not the truncated size. -
A Dynamic Overlap policy causes all DMF-8.7.0 compatible 7820 switches to append an additional
Vlan Tag Post Slice Serviceaction. The default behavior of a fabric deployed inPush-per-Policymode handlesSingle Vlan Stripat the delivery interface, removing the additional VLAN tag and leaving the original policy VLAN tag intact. In a non-default fabric deployment (Push-per-filter), to deliver the original packet to the tool node after a slice action, enablestrip-two-vlanon the delivery interface.
VXLAN Stripping on the 7280R3 Switch
Virtual Extensible LAN Header Stripping
Virtual Extensible LAN (VXLAN) Header Stripping supports the delivery of decapsulated packets to tools and devices in a DANZ Monitoring Fabric (DMF) fabric. This feature removes the VXLAN header, previously established in a tunnel for reaching the TAP Aggregation switch or inherent to the tapped traffic within the DMF. Within the fabric, DMF supports the installation of the strip VXLAN service on a filter interface or a filter-and-delivery interface of a supported switch.
Platform Compatibility
For DMF deployments, the target platform is DCS-7280R3.
Use the show switch
all property command to verify which switch in the DMF fabric supports this feature.
Strip Header
Supported property has the value BSN_STRIP_HEADER_CAPS_VXLAN.
# show switch all property
# : 1
Switch : lyd599
Max Phys Port : 1000000
Min Lag Port : 1000001
Max Lag Port : 1000256
Min Tunnel Port : 15000001
Max Tunnel Port : 15001024
Max Lag Comps : 64
Tunnel Supported : BSN_TUNNEL_L2GRE
UDF Supported : BSN_UDF_6X2_BYTES
Enhanced Hash Supported : BSN_ENHANCED_HASH_L2GRE,BSN_ENHANCED_HASH_L3,BSN_ENHANCED_HASH_L2,
BSN_ENHANCED_HASH_MPLS,BSN_ENHANCED_HASH_SYMMETRIC
Strip Header Supported : BSN_STRIP_HEADER_CAPS_VXLAN
Min Rate Limit : 1Mbps
Max Multicast Replication Groups : 0
Max Multicast Replication Entries : 0
PTP Timestamp Supported Capabilities : ptp-timestamp-cap-replace-smac, ptp-timestamp-cap-header-64bit,
ptp-timestamp-cap-header-48bit, ptp-timestamp-cap-flow-based,
ptp-timestamp-cap-add-header-after-l2
Min Truncate Offset : 100
Max Truncate Offset : 9236
Using the CLI to Configure VXLAN Header Stripping
Configuration
Use the following steps to configure strip-vxlan on a switch:
- Set the optional field
strip-vxlan-udp-portat switch configuration, and the defaultudp-portforstrip-vxlanis4789. - Enable or disable
strip-vxlanon afilterorboth-filter-and-delivery interfaceusing therole both-filter-and-delivery interface-name filter-interface strip-vxlancommand.> enable # config (config)# switch switch-name (config-switch)# strip-vxlan-udp-port udp-port-number (config-switch)# interface interface-name (config-switch-if)# role both-filter-and-delivery interface-name filter-interface strip-vxlan (config-switch-if)# role both-filter-and-delivery interface-name filter-interface no-strip-vxlan (config)# show running-config
- After enabling a filter interface with
strip-vxlan, any policy can use it. From theconfig-policysubmode, add thefilter-interfaceto the policy:(config)# policy p1 (config-policy)# filter-interface filter-interface
Proceed to Show Commands.
Show Commands
show policy policy name command to see the runtime state of a policy using a filter interface with strip-vxlan configured. It will also show the service interface information and stats.
# show policy strip-vxlan Policy Name : strip-vxlan Config Status : active - forward Runtime Status : installed Detailed Status : installed - installed to forward Priority : 100 Overlap Priority : 0 # of switches with filter interfaces : 1 # of switches with delivery interfaces : 1 # of switches with service interfaces : 0 # of filter interfaces : 1 # of delivery interfaces : 1 # of core interfaces : 0 # of services : 0 # of pre service interfaces : 0 # of post service interfaces : 0 Push VLAN : 1 Post Match Filter Traffic : - Total Delivery Rate : - Total Pre Service Rate : - Total Post Service Rate : - Overlapping Policies : none Component Policies : none Installed Time : 2024-05-02 19:54:27 UTC Installed Duration : 1 minute, 18 secs Timestamping enabled : False ~ Match Rules ~ # Rule -|-----------| 1 1 match any ~~~~~~~~~~~~~~~~~~~~~~~~~~~~~~~~~~~~~~~~ Filter Interface(s) ~~~~~~~~~~~~~~~~~~~~~~~~~~~~~~~~~~~~~~~~ # DMF IF Switch IF Name State Dir Packets Bytes Pkt Rate Bit Rate Counter Reset Time -|------|------|-----------|-----|---|-------|-----|--------|--------|------------------------------| 1 f1 lyd598 Ethernet1/1 up rx 0 0 0 - 2024-05-02 19:54:27.141000 UTC ~~~~~~~~~~~~~~~~~~~~~~~~~~~~~~~~~~~~~~~ Delivery Interface(s) ~~~~~~~~~~~~~~~~~~~~~~~~~~~~~~~~~~~~~~~ # DMF IF Switch IF Name State Dir Packets Bytes Pkt Rate Bit Rate Counter Reset Time -|------|------|-----------|-----|---|-------|-----|--------|--------|------------------------------| 1 d1 lyd598 Ethernet2/1 up tx 0 0 0 - 2024-05-02 19:54:27.141000 UTC ~ Service Interface(s) ~ None. ~ Core Interface(s) ~ None. ~ Failed Path(s) ~ None.
Using the GUI to Configure VXLAN Header Stripping
Filter Interface Configuration
To configure or edit a filter interface, proceed to Interfaces from the Monitoring menu and select .
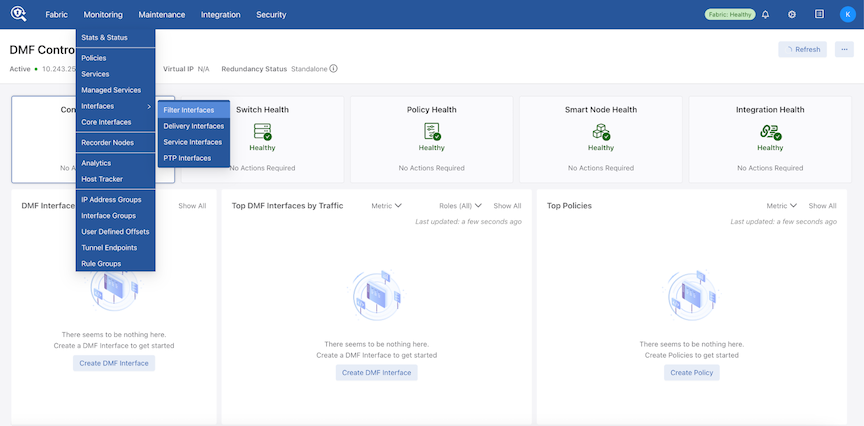
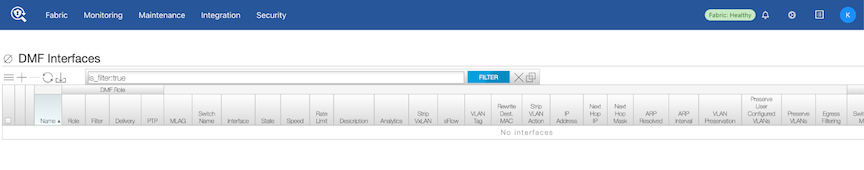
Configure a filter interface on a switch that supports strip-vxlan.
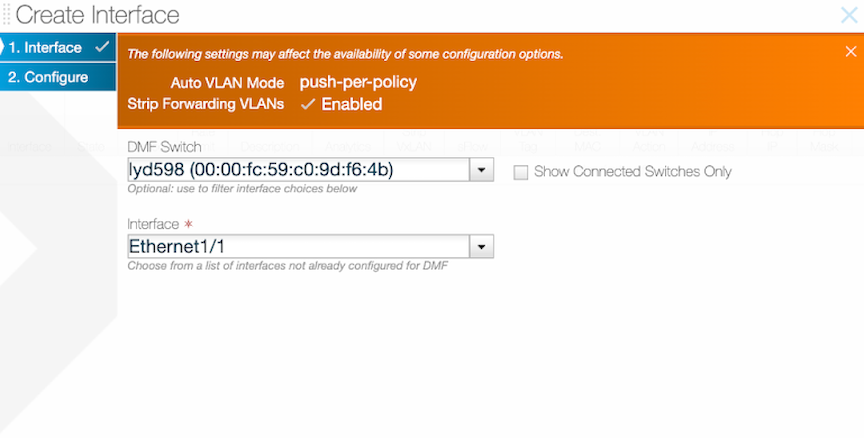
Enable or Disable Strip VXLAN.
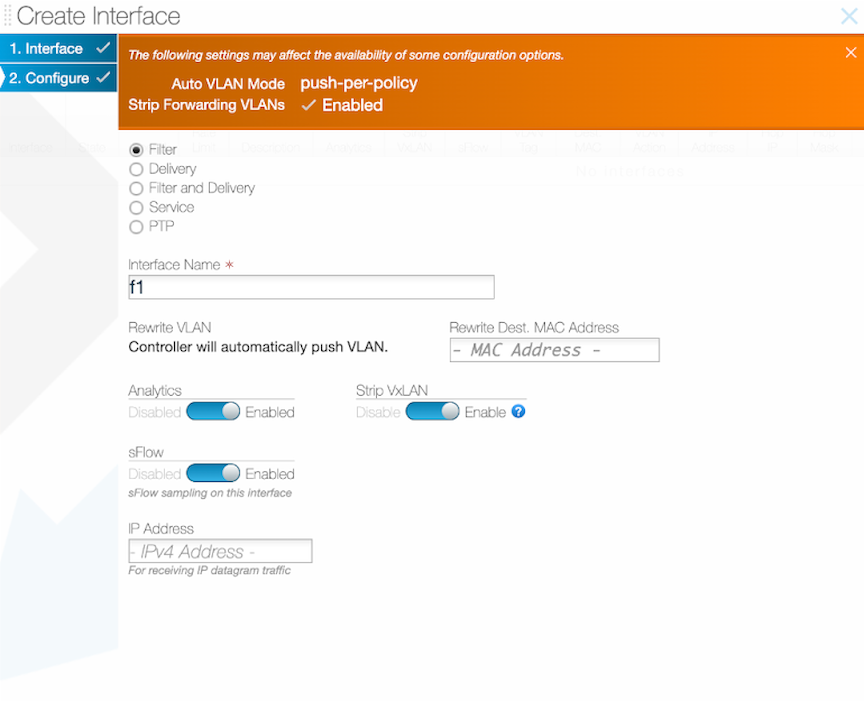
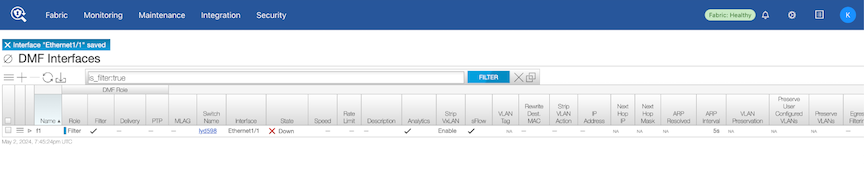
Policy Configuration
Create a new policy using DMF Policies and add the filter interface with strip VXLAN enabled.
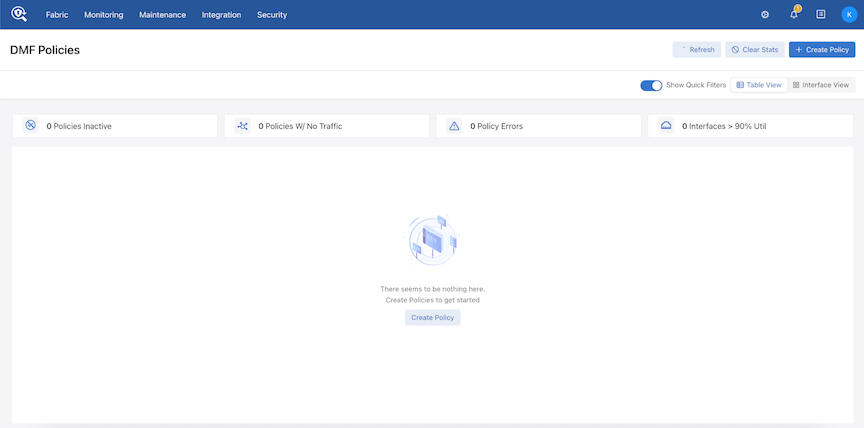
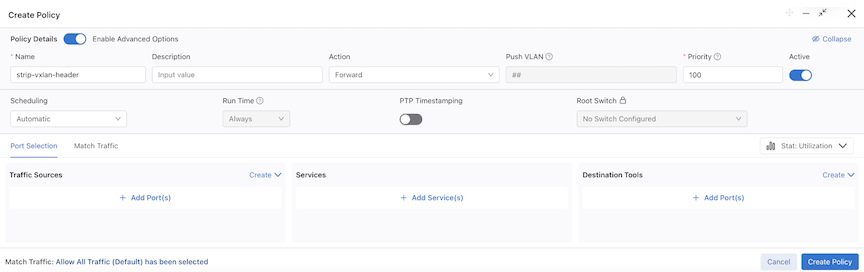
Select Add port(s) under the Traffic Sources option and add the Filter Interface.
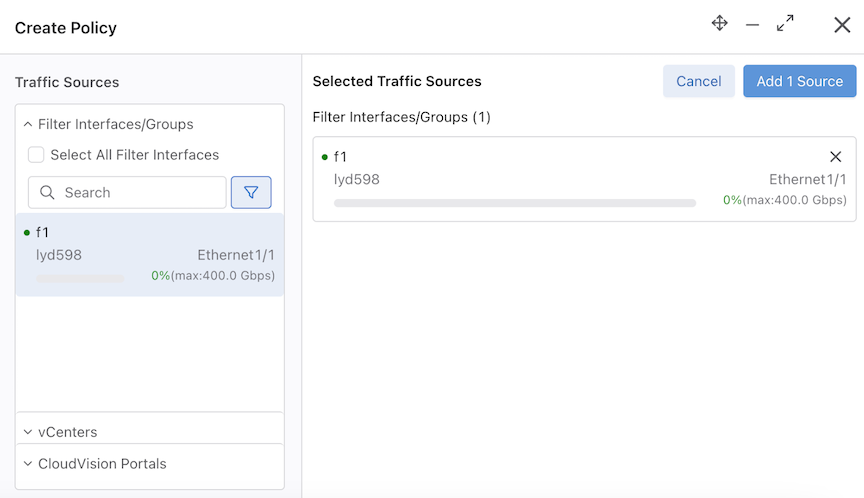
Add another delivery interface and create the policy.
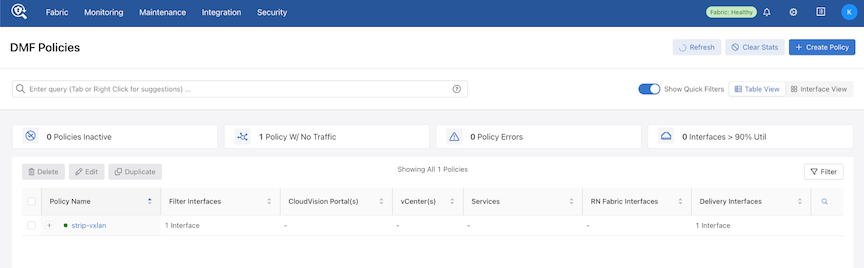
Syslog Messages
There are no syslog messages associated with this feature.
Troubleshooting
The show switch all property command provides the Strip Header Supported property of the switch. If the value BSN_STRIP_HEADER_CAPS_VXLAN is present, the feature is supported; otherwise, the switch does not support this feature.
The show fabric warnings feature-unsupported-on-device command provides information when DMF fails to enable strip-vxlan on an unsupported switch.
The show switch switch-name table
strip-vxlan-header command provides the gentable details.
The following are examples of several failure cases:
- The filter interface is down.
- The interface with
strip-vxlanis neither a filter interface nor a filter-and-delivery interface. - The switch does not support
strip-vxlan. - Tunneling / UDF is enabled simultaneously with
strip-vxlan. - Unsupported pipeline mode with
strip-vxlanenabled (strip-vxlanrequires a specific pipeline modestrip-vxlan-match-push-vlan).
Limitations
- When configured for a supported switch, the filter interface for
decap-vxlanaction can only be a physical interface or a LAG. - It is not possible to enable
strip-vxlansimultaneously with tunneling / UDF. - When enabling
strip-vxlanon one or more switch interfaces on the same switch, other filter interfaces on the same switch cannot be matched on the VXLAN header.