CIDR Document Filtering for Analytics Node Dashboards
The Analytics Node includes CIDR (Classless Inter-Domain Routing) filtering for records and documents. The feature applies to dashboards including Netflow, sFlow®, ICMP, TCP Analysis, and others. The filtering uses Lucene and KQL syntaxes and introduces two new fields: sIp.ip and dIp.ip.
Search Functionality
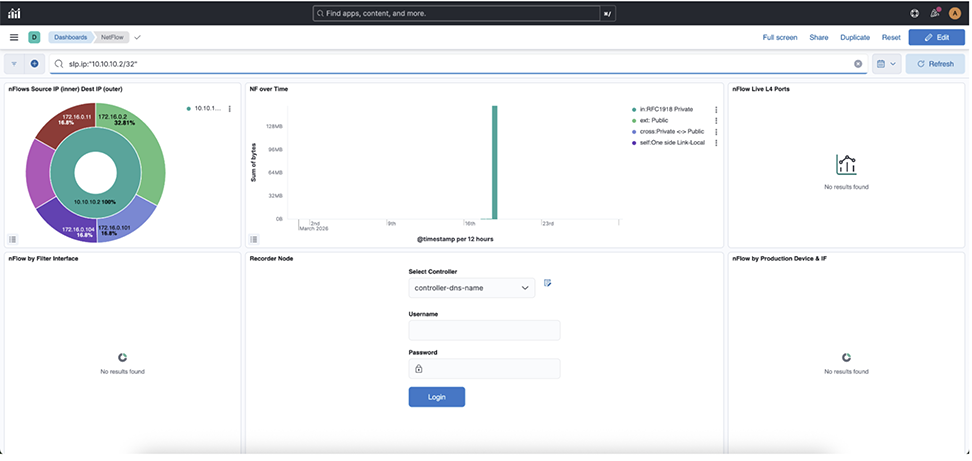
The Search Option filters documents and records. Entering sIp.ip:10.10.10.0/24 retrieves documents with Source IP addresses ranging from 10.10.10.0 to 10.10.10.255. The dIp.ip field functions identically for Destination IP addresses. The following Dashboard View section contains usage details.
Boolean Operators
The search operation supports Boolean Operators such as AND and OR for combining multiple search patterns. Examples include:
- sIp.ip:10.10.10.0/24 AND dIp.ip:20.20.20.0/24
- sIp.ip:10.10.10.0/24 OR dIp.ip:20.20.20.0/24
Applying a 0.0.0.0/0 pattern to sIp.ip and dIp.ip retrieves all IP addresses.
Configuration
- Navigate to Dev Tools and execute POST/flow-netflow-datastream/_rollover. Executing the command creates a new write index containing the updated mapping for sIp.ip. Omitting the rollover action prevents field creation.
- Navigate to , select the relevant data view, and select Refresh field list (the ↺ icon). Skipping the refresh prevents sIp.ip from appearing in the Discover field sidebar post-rollover.
- Verify the data view index pattern logs-*) covers the newly rolled-over index. For fixed index names, update the data view to include the new index.
- Select for runtime fields named sIp or sIp.ip functioning as prior workarounds. Delete the workaround fields; the native field takes precedence after removal.
- Scope the time range to post-rollover data during testing. If sIp.ip returns zero results, verify the time range before diagnosing further errors.
SIP Usage and Dashboard View
The SIP dashboard provides information about SIP responses, call attempts, and call events.
sIp.ip and sIp Usage
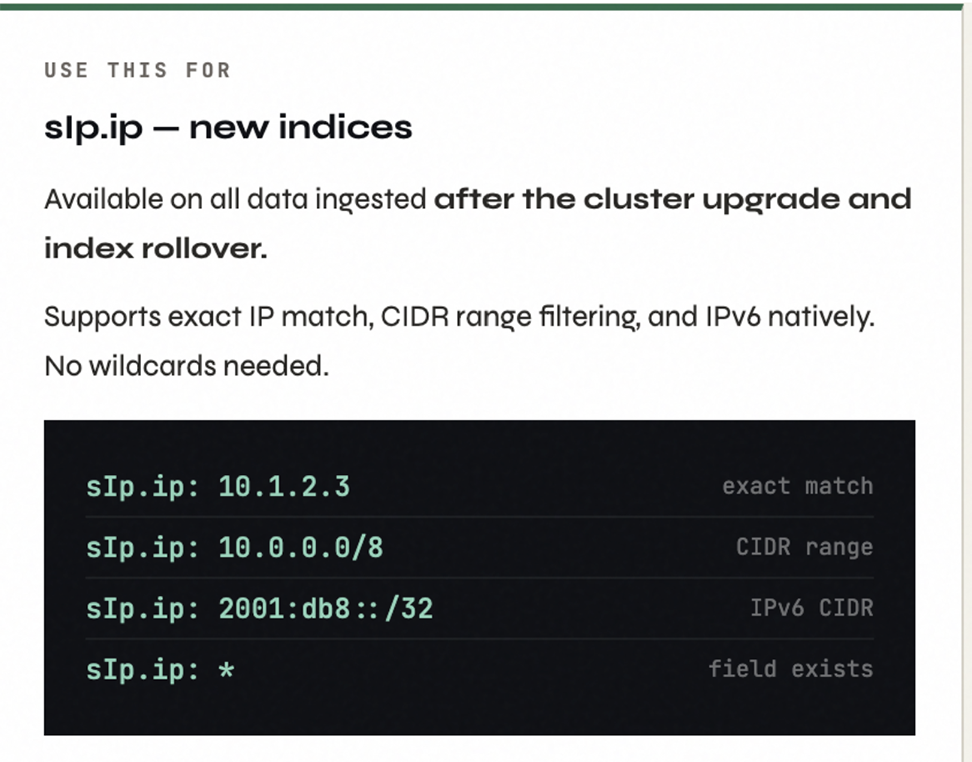
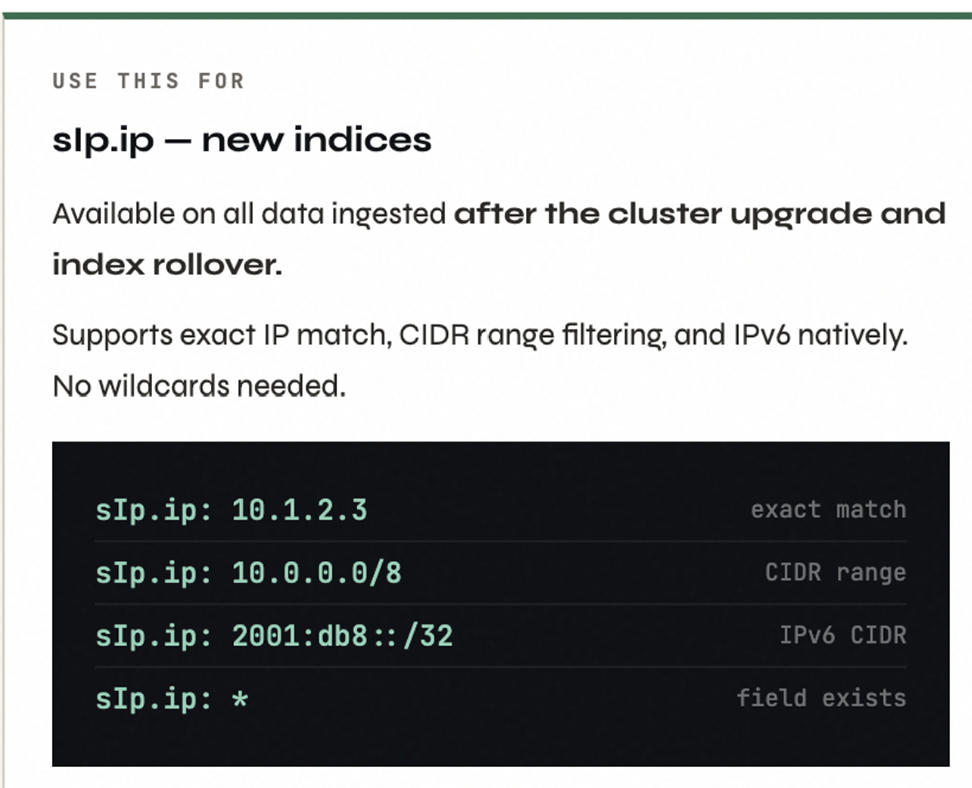
The following figures show the new and old indices before and after thecluster upgrade.

| Capability | SIP | SIP.ip |
|---|---|---|
| Exact IP match | Yes | Yes |
| CIDR range filter | No | Yes |
| IPv6 native support | No | Yes |
| Wildcard match | Yes | Not needed |
| Old index data | Yes | Zero result |
| New index data | Yes | Yes |
| Exists filter | Yes | Yes |
Debugging Tips
- Zero Results on Old Data: Querying sIp.ip: 10.0.0.0/8 within a time range that covers old data returns zero results. The zero-result return is expected behavior. Restrict the time range to post-rollover data, or select the legacy sIp ield to query older records.
- Dashboard and Visualization Compatibility: Visualizations and dashboards currently lack updates for sIp.ip and continue referencing the previous field. Applying CIDR filters in the global KQL bar functions correctly on new-index panels; old-index panels return empty results.
- Wildcard Limitations: sIp.ip: 192.168.* — Wildcards fail on ip type fields. Utilize CIDR notation instead: sIp.ip: 192.168.0.0/16.
- Missing Discover Fields: If sIp.ip remains absent from the Discover field list, refresh the Data View (). The refresh action serves as a required one-time step following an upgrade.
- Result Variations: Results generated by sIp.ip CIDR searches might differ from the previous sIp: 192.168.* wildcard searches due to higher CIDR precision. The variation represents correct behavior rather than data loss.

Dashboard View
The dashboard displays the following panel:
- nFlows Source IP (inner) Dest IP (outer): Displays NetFlow data over a selected time range, showing the count of flows grouped by source (slp) and destination (dlp) IP addresses in descending order to identify the most active endpoints.
- NF over Time: Displays the sum of bytes over a selected time range, with time-based aggregation on the X-axis and filtered series split by traffic direction tags (for example, internal, external, cross, self) for comparative flow analysis.
- nFlow Live L4 Ports: Displays the count of NetFlow records over a selected time range, grouped by the l4App.keyword field using a row-based split to categorize traffic based on Layer 4 application types.
- nFlow by Filter Interface: Displays NetFlow data as a pie chart over a selected time range, counting flow records grouped by BTifName (interface name) in descending order to highlight the top 50 interfaces by activity.
- Recorder Node
- nFlow by Production Device & IF: Displays NetFlow data as a nested pie chart over a selected time range, showing the count of flow records grouped first by device name and then by device port, sorted in descending order to highlight the most active sources and interfaces.