Telemetry Collector
A DANZ Monitoring Fabric (DMF) consists of a pair of Controllers, switches, and managed appliances. The Telemetry Collector feature centrally retrieves the infrastructure metrics (interface counters, CPU usage, etc.) affiliated with all these devices from the controllers using its REST API.
Deployment
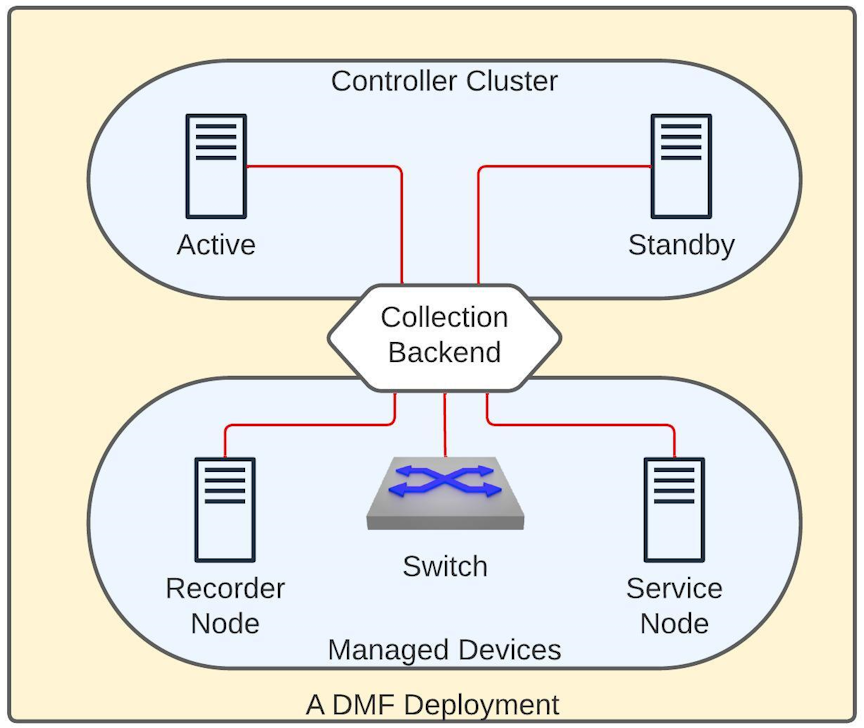
The diagram above shows a DMF deployment with an Active/Standby Controller cluster. In this environment, each Controller collects metrics from all the devices it manages and the controller nodes. Each Controller establishes a gNMI connection to all the devices and the other Controller in a fabric to collect telemetry streams. gNMI is a gRPC-based protocol to configure and access states on network devices. The REST API exposes this information in the /api/v1/data/controller/telemetry/data subtree. The Controller exposes several metrics about CPU, memory, disk utilization, interface counters, and sensor states of all devices in a fabric. All metrics are fetched at a 10-second frequency except those associated with the sensors, which are collected every minute.
Configuration
No additional configuration is necessary on the DMF Controller to enable the metric collection. However, to read these metrics, the user must be an admin user or configured with the privilege, category:TELEMETRY. To set the telemetry permission for a custom group and associate the user with this group, use the following commands:
dmf-controller(config)# group group_name
dmf-controller(config)# permission category:TELEMETRY privilege read-only
dmf-controller(config)# associate user username
Connection Status
The Controller uses the gNMI protocol to collect telemetry data from all devices. DMF reports the status of these connections in both the REST API and the CLI.
REST API
The REST API subtree /api/v1/data/controller/telemetry/connection reports the telemetry connection state. The API Schema browser of the GUI provides more details.
CLI
The following show commands display the connection details. All these commands support filtering the output with a device name.
show telemetry connection device-name | all
show telemetry connection device-name | all details
show telemetry connection device-name | all last-failure
The show telemetry connection device-name all command shows the state and the latest state change of the connection between the Controller and the devices.
dmf-controller# show telemetry connection all
# Name                         State Last state change
-|----------------------------|-----|------------------------------|
1 c2                           ready 2023-11-10 13:10:02.718000 UTC
2 core2                        ready 2023-11-10 13:22:56.311000 UTC
<snip>
The show telemetry connection device-name all command displays the state and the latest state change of the connection between the Controller and the devices.
dmf-controller# show telemetry connection all details
# Name  State Last state change              Target              Connection type Last message time
-|-----|-----|------------------------------|-------------------|---------------|------------------------------|
1 core2 ready 2023-11-10 13:22:56.311000 UTC 10.243.255.102:6030 clear-text      2023-11-10 13:59:35.437000 UTC
<snip>
The show telemetry connection device-name all last-failure command displays more details about a connection failure. The time of the latest failure and the potential reason appear in the output. If the connection is still in the failed state, this output also shows when the next reconnection is attempted.
dmf-controller# show telemetry connection all last-failure
# Name  Fail time                      Fail type       Root cause                Next retry in
-|-----|------------------------------|---------------|-------------------------|-------------|
1 core2 2023-11-10 13:19:34.237000 UTC unavailable     UNAVAILABLE: io exception 0
<snip>
Limitations
- Software interfaces (for example, loopback, bond, and management) do not report counters for broadcast and unicast packets.
- The reported interface names are the raw physical interface name (e.g.,
et1) rather than the user-configured name associated with the role of an interface (e.g.,filter1). - Resetting the interface counter does not affect the counter values stored at the /telemetry/data path. The value monotonically increases and corresponds to the total count since the device was last powered up. This value only gets reset when rebooting the device.
Usage Notes
- DMF uses the configured name of a managed device (e.g., switch, recorder node, etc.) on the Controller as the value of the key name for the node device for all the metrics corresponding to it. In the case of a Controller, DMF uses the configured hostname as the key. Thus, these names must be unique in a specific DMF deployment.
- The possibility exists that metrics are not collected from a device for a short period. This data gap may happen when rebooting the device or when the Controllers experience a failover event.
- If the gNMI connection between the Controller and the device is interrupted, the Controller attempts a new connection after 2 minutes. The retry timeout for a subsequent connection attempt increases exponentially and can go up to 120 minutes. Upon a successful reconnection, this timeout value resets to 2 minutes.
- There might be gNMI warning messages in the floodlight log during certain events, e.g., when first adding a device or it is reloading. Ignore these messages.
- This feature enables an OpenConfig agent on switches running EOS to collect telemetry.
Telemetry Availability
As a DMF fabric consists of different types of devices, the metrics of each vary. The following outlines the metrics collected from each device type by the Controller and typically made available over its REST API. However, some specific platforms or hardware might not report a particular metric. For brevity, the following list mentions the leaves that can correspond to a metric. For more details, use the API Schema browser of the GUI.
telemetry
+-- data
     +-- device
         +-- interface
         |  +-- oper-status                Ctrl, SWL, EOS, SN, RN
         |  +-- counters
         |     +-- in-octets               Ctrl, SWL, EOS, SN, RN
         |     +-- in-pkts                 Ctrl, SWL, EOS, SN, RN
         |     +-- in-unicast-pkts         Ctrl, SWL, EOS, SN, RN
         |     +-- in-broadcast-pkts       Ctrl, SWL, EOS, SN, RN
         |     +-- in-multicast-pkts       Ctrl, SWL, EOS, SN, RN
         |     +-- in-discards             Ctrl, SWL, EOS, SN, RN
         |     +-- in-errors               Ctrl, SWL, EOS, SN, RN
         |     +-- in-fcs-errors           Ctrl, SWL, EOS, SN, RN
         |     +-- out-octets              Ctrl, SWL, EOS, SN, RN
         |     +-- out-pkts                Ctrl, SWL, EOS, SN, RN
         |     +-- out-unicast-pkts        Ctrl, SWL, EOS, SN, RN
         |     +-- out-broadcast-pkts      Ctrl, SWL, EOS, SN, RN
         |     +-- out-multicast-pkts      Ctrl, SWL, EOS, SN, RN
         |     +-- out-discards            Ctrl, SWL, EOS, SN, RN
         |     +-- out-errors              Ctrl, SWL, EOS, SN, RN
         +-- cpu
         |  +-- utilization                Ctrl, SWL, EOS, SN, RN
         +-- memory
         |  +-- total                      Ctrl, SWL, SN, RN
         |  +-- available                  Ctrl, SWL, EOS, SN, RN
         |  +-- utilized                   Ctrl, SWL, EOS, SN, RN
         +-- sensor
         |  +-- fan
         |  |  +-- oper-status             Ctrl, SWL, EOS, SN, RN
         |  |  +-- rpm                     Ctrl, SWL, EOS, SN, RN
         |  |  +-- speed                   SWL
         |  +-- power-supply
         |  |  +-- oper-status             Ctrl, SWL, EOS, SN, RN
         |  |  +-- capacity                EOS
         |  |  +-- input-current           Ctrl, SWL, EOS, SN, RN
         |  |  +-- output-current          SWL, EOS
         |  |  +-- input-voltage           Ctrl, SWL, EOS, SN, RN
         |  |  +-- output-voltage          SWL, EOS
         |  |  +-- input-power             Ctrl, SWL, SN, RN
         |  |  +-- output-power            SWL, EOS
         |  +-- thermal
         |     +-- oper-status             Ctrl, SWL, SN, RN
         |     +-- temperature             Ctrl, SWL, EOS, SN, RN
         +-- mount-point
         |  +-- size                       Ctrl, SWL, SN, RN
         |  +-- available                  Ctrl, SWL, SN, RN
         |  +-- utilized                   Ctrl, SWL, SN, RN
         |  +-- usage-percentage           Ctrl, SWL, SN, RN
         +-- control-group
         +-- memory                     Ctrl, SWL, SN, RN
         +-- cpu                        Ctrl, SWL, SN, RN

* Ctrl = Controller, SWL = A switch running SwichLight OS,
EOS = A switch running Arista EOS, SN = Service Node, RN = Recorder Node
Storage Health
Storage Health exposes metrics and health status of storage devices on controllers and all managed nodes, but not switches. Metrics and health status are updated every minute and exposed through the Telemetry Collector.
The feature is compatible with all the supported platforms. However, the exact set of metrics may vary depending on the hardware configuration.
The appliance does not require additional configuration. The metrics are exposed using the Telemetry Collector, and reading the collected data requires the same permissions.
REST API
REST subtree /api/v1/data/controller/os/status/storage reports the storage configuration of the current appliance - it contains attributes of available physical drives, RAID controllers, and virtual drives. REST subtree /api/v1/data/controller/telemetry/data/device/storage reports the storage devices’ metrics and health status. The API Schema browser of the GUI (/schema-browser URL on the Controller) provides more details.
Show Commands
The show hardware storage-configuration command, corresponding to the REST subtree /api/v1/data/controller/os/status/storage, lists storage devices and their attributes.
ctrl01> show hardware storage-configuration
Collection result : success
~~~~~~~~~~~~~~~~~~~~~~~~~~~~~~~~~~~~~~~~~ Virtual Drives  ~~~~~~~~~~~~~~~~~~~~~~~~~~~~~~~~~~~~~~~~~
# Virtual Drive ID                       Name OS Name  RAID  Controller ID             Internal ID
-|--------------------------------------|----|--------|-----|-------------------------|-----------|
1 scsi-362cea7f0c91726002f62b6e605537f47 os   /dev/sda RAID5 PERC_H330_Adapter/18I031B /c0/v0
2 scsi-362cea7f0c91726002f62e0cb115e191e data /dev/sdb RAID5 PERC_H330_Adapter/18I031B /c0/v1

~~~~~~~~~~~~~~~~~~~~~~~~~~~~~~~~~~~ Physical Drives  ~~~~~~~~~~~~~~~~~~~~~~~~~~~~~~~~~~~
# Physical Drive ID    Model        Serial Number     Controller ID         Internal ID
-|--------------------|------------|-------------|-------------------------|-----------|
1 HFS1T9-BA10A/0307O1F HFS1T9-BA10A 0307O1F       PERC_H330_Adapter/18I031B /c0/e32/s2
2 HFS1T9-BA10A/0307O1G HFS1T9-BA10A 0307O1G       PERC_H330_Adapter/18I031B /c0/e32/s0
3 HFS1T9-BA10A/0307O1S HFS1T9-BA10A 0307O1S       PERC_H330_Adapter/18I031B /c0/e32/s1
4 HFS1T9-BA10A/0307O8S HFS1T9-BA10A 0307O8S       PERC_H330_Adapter/18I031B /c0/e32/s3

~~~~~~~~~~~~~~~~~~~~~~~~~~~~~ Controllers  ~~~~~~~~~~~~~~~~~~~~~~~~~~~~~
# Controller ID             Model             Serial Number Internal ID
-|-------------------------|-----------------|-------------|-----------|
1 PERC_H330_Adapter/18I031B PERC H330 Adapter 18I031B       /c0
ctrl01> show hardware storage-configuration virtual-drive scsi-362cea7f0c91726002f62b6e605537f47
Virtual Drive ID : scsi-362cea7f0c91726002f62b6e605537f47
Controller ID    : PERC_H330_Adapter/18I031B
Internal ID      : /c0/v0
Name             : os
OS Name          : /dev/sda
RAID             : RAID5
~~~ Physical Drives ~~~
# Physical Drive ID
-|--------------------|
1 HFS1T9-BA10A/0307O1F
2 HFS1T9-BA10A/0307O1G
3 HFS1T9-BA10A/0307O1S
4 HFS1T9-BA10A/0307O8S
The Controller ID, Internal ID, RAID, and Name fields are empty for drives not managed by a RAID controller. The Name field is also empty if no name is assigned to the virtual drive within the RAID controller's configuration. The show hardware storage-health command prints the overall health status of the storage devices collected from all the DMF cluster nodes.
ctrl01> show hardware storage-health
~~~~~~~~~~~~~~~~~~~~~~ Device Summary ~~~~~~~~~~~~~~~~~~~~~~
# Device Status Collection result Collection error messages
-|------|------|-----------------|-------------------------|
1 ctrl01 ok     success
2 ctrl02 ok     success

~~~~~~~~~~~~~~~~~~~~~~~~~~~~~~~~~~~~~~~~~~~~~~~~~~~~~~~~ Virtual Drives ~~~~~~~~~~~~~~~~~~~~~~~~~~~~~~~~~~~~~~~~~~~~~~~~~~~~~~~
# Device Virtual Drive ID                       Status  Messages
-|------|--------------------------------------|-------|----------------------------------------------------------------------|
1 ctrl01 scsi-362cea7f0c91726002f62b6e605537f47 ok
2 ctrl01 scsi-362cea7f0c91726002f62e0cb115e191e ok
3 ctrl02 scsi-36d0946603abfc90022181eae0f6f9708 ok
3 ctrl02 scsi-36d0946603abfc90022181eae0f6f9708 warning Physical drive "HUS722/D1N42T" is in a suboptimal state

~~~~~~~~~~~~~~~~~~~~~~~~~~~~~~~~~~~~~~~~~~~~~~~~~~~~~~~~~ Physical Drives  ~~~~~~~~~~~~~~~~~~~~~~~~~~~~~~~~~~~~~~~~~~~~~~~~~~~~~~~~~
# Device Physical Drive ID    Status Messages
-|------|--------------------|------|----------------------------------------------------------------------------------------------|
1 ctrl01 HFS1T9-BA10A/0307O1F ok
2 ctrl01 HFS1T9-BA10A/0307O1G ok
3 ctrl01 HFS1T9-BA10A/0307O1S ok
4 ctrl01 HFS1T9-BA10A/0307O8S ok
5 ctrl02 HUS722/D1N42T        error  SMART self-assessment failed, SMART attribute "Raw_Read_Error_Rate" (1) is below the threshold
6 ctrl02 HUS722/D94WR9        ok

~~~~~~~~~~~~~~~~~~~ Controllers ~~~~~~~~~~~~~~~~~~~
# Device Controller ID             Status Messages
-|------|-------------------------|------|--------|
1 ctrl01 PERC_H330_Adapter/18I031B ok
1 ctrl02 PERC_H330_Adapter/7AA004D ok
- OK - no issues identified.
- Warning - the device is operational, but not at the full performance level.
- Error - the device has already failed or is deemed to fail soon.
Regarding warning and error statuses, further details are in the Messages column. The detailed metrics for physical drives are accessible using the show hardware storage-health device-id
physical-drive drive-id command:
cont01> show hardware storage-health cont01 physical-drive HFS1T9-BA10A/0307O1F
~~~~~~~~~~~~~~~~~~~~~~~~~~~~~~~~~~~~~~~~~~~~~~~~~~~~~~~ Drives  ~~~~~~~~~~~~~~~~~~~~~~~~~~~~~~~~~~~~~~~~~~~~~~~~~~~~~~~
# Physical Drive ID    Power-on Hours SMART Status Status Temperature Grown defect list length Used endurance Messages
-|--------------------|--------------|------------|------|-----------|------------------------|--------------|--------|
1 HFS1T9-BA10A/0307O1F 12380          ok           ok     30

~~~~~~~~~~~~~~~~~~~~~~~~~~~~~~~~~~~~~~~~~~~~~~~ SMART Attributes ~~~~~~~~~~~~~~~~~~~~~~~~~~~~~~~~~~~~~~~~~~~~~~~
#  Physical Drive ID    ID  Name                    Raw              Threshold Type     Update Type Value Worst
--|--------------------|---|-----------------------|----------------|---------|--------|-----------|-----|-----|
1  HFS1T9-BA10A/0307O1F 1   Raw_Read_Error_Rate     0000000000000000 6         advisory online      100   100
2  HFS1T9-BA10A/0307O1F 5   Reallocated_Sector_Ct   0000000000000000 2         prefail  online      100   100
3  HFS1T9-BA10A/0307O1F 9   Power_On_Hours          000000000000305C 0         advisory online      87    87
4  HFS1T9-BA10A/0307O1F 12  Power_Cycle_Count       00000000000000FC 20        advisory online      100   100
5  HFS1T9-BA10A/0307O1F 13  Read_Soft_Error_Rate    0000000000000000 0         advisory online      100   100
6  HFS1T9-BA10A/0307O1F 173 Unknown_Attribute       0000000000000020 0         advisory online      100   100
7  HFS1T9-BA10A/0307O1F 175 Program_Fail_Count_Chip 0000000000000007 0         advisory online      100   100
8  HFS1T9-BA10A/0307O1F 179 Used_Rsvd_Blk_Cnt_Tot   0000000000000000 2         prefail  online      100   100
9  HFS1T9-BA10A/0307O1F 180 Unused_Rsvd_Blk_Cnt_Tot 000000000000124D 0         advisory offline     100   100
10 HFS1T9-BA10A/0307O1F 181 Program_Fail_Cnt_Total  0000000000000000 0         advisory online      100   100
11 HFS1T9-BA10A/0307O1F 182 Erase_Fail_Count_Total  0000000000000000 0         advisory online      100   100
12 HFS1T9-BA10A/0307O1F 194 Temperature_Celsius     0000002C0012001E 0         advisory online      70    56
13 HFS1T9-BA10A/0307O1F 195 Hardware_ECC_Recovered  0000000000000000 0         advisory online      100   100
14 HFS1T9-BA10A/0307O1F 198 Offline_Uncorrectable   0000000000000290 0         advisory offline     100   100
15 HFS1T9-BA10A/0307O1F 199 UDMA_CRC_Error_Count    0000000000000000 0         advisory online      100   100
16 HFS1T9-BA10A/0307O1F 201 Unknown_SSD_Attribute   0000000000000000 50        prefail  online      100   100
17 HFS1T9-BA10A/0307O1F 202 Unknown_SSD_Attribute   0000000000000000 50        prefail  online      100   100
18 HFS1T9-BA10A/0307O1F 233 Media_Wearout_Indicator 000000000000377D 0         advisory online      100   100
19 HFS1T9-BA10A/0307O1F 235 Unknown_Attribute       000000000000377D 0         advisory online      100   100
20 HFS1T9-BA10A/0307O1F 241 Total_LBAs_Written      00000000000031C5 0         advisory online      100   100
21 HFS1T9-BA10A/0307O1F 245 Unknown_Attribute       0000000000000064 1         prefail  online      100   100

~~ SCSI Read Errors  ~~
# Physical Drive ID
-|--------------------|
1 HFS1T9-BA10A/0307O1F

~~ SCSI Write Errors ~~
# Physical Drive ID
-|--------------------|
1 HFS1T9-BA10A/0307O1F

~ SCSI Verify Errors  ~
# Physical Drive ID
-|--------------------|
1 HFS1T9-BA10A/0307O1F

~~~~~~~~~~~~~~~~~~~~~~~~~~~~~~~~ DELL PERC Metrics  ~~~~~~~~~~~~~~~~~~~~~~~~~~~~~~~~
# Physical Drive ID    Media Errors Other Errors Predictive Failures Shield counter
-|--------------------|------------|------------|-------------------|--------------|
1 HFS1T9-BA10A/0307O1F 0            0            0                   0
The exact set of metrics may vary between physical drives. In the earlier example, the drive reports SMART attributes. However, it doesn’t report metrics through the SCSI log pages. The following example shows the output for a drive that doesn’t report SMART attributes, but reports metrics through SCSI log pages.
cont01> show hardware storage-health cont02 physical-drive MG07SCA1/21X0A14Z
~~~~~~~~~~~~~~~~~~~~~~~~~~~~~~~~~~~~~~~~~~~~~~~~~~~~~~ Drives ~~~~~~~~~~~~~~~~~~~~~~~~~~~~~~~~~~~~~~~~~~~~~~~~~~~~~~
# Physical Drive ID Power-on Hours SMART Status Status Temperature Grown defect list length Used endurance Messages
-|-----------------|--------------|------------|------|-----------|------------------------|--------------|--------|
1 MG07SCA1/21X0A14Z 18578          ok           ok     27          0
~~~~~~~~~~~~~~~~~~~~~~~~~~~~~~~~~~~~~~~~~~~~~~~~~~~~~~~~~~~~~~~~~~~~~~~~~~~~~~~~~~~~~~~~~~ SCSI Read Errors  ~~~~~~~~~~~~~~~~~~~~~~~~~~~~~~~~~~~~~~~~~~~~~~~~~~~~~~~~~~~~~~~~~~~~~~~~~~~~~~~~~~~~~~~~~~
# Physical Drive ID Correction Algorithm Invocations Errors Corrected by ECC Delayed Errors Corrected by ECC Fast Errors Corrected by Rereads/Rewrites Total Errors Corrected Total Errors Uncorrected
-|-----------------|--------------------------------|-------------------------------|----------------------------|------------------------------------|----------------------|------------------------|
1 MG07SCA1/21X0A14Z 21573                            6907                            0                            6961                                 6907                   54
~~~~~~~~~~~~~~~~~~~~~~~~~~~~~~~~~~~~~~~~~~~~~~~~~~~~~~~~~~~~~~~~~~~~~~~~~~~~~~~~~~~~~~~~~~ SCSI Write Errors ~~~~~~~~~~~~~~~~~~~~~~~~~~~~~~~~~~~~~~~~~~~~~~~~~~~~~~~~~~~~~~~~~~~~~~~~~~~~~~~~~~~~~~~~~~
# Physical Drive ID Correction Algorithm Invocations Errors Corrected by ECC Delayed Errors Corrected by ECC Fast Errors Corrected by Rereads/Rewrites Total Errors Corrected Total Errors Uncorrected
-|-----------------|--------------------------------|-------------------------------|----------------------------|------------------------------------|----------------------|------------------------|
1 MG07SCA1/21X0A14Z 0                                0                               0                            0                                    0                      0
~~~~~~~~~~~~~~~~~~~~~~~~~~~~~~~~~~~~~~~~~~~~~~~~~~~~~~~~~~~~~~~~~~~~~~~~~~~~~~~~~~~~~~~~~ SCSI Verify Errors  ~~~~~~~~~~~~~~~~~~~~~~~~~~~~~~~~~~~~~~~~~~~~~~~~~~~~~~~~~~~~~~~~~~~~~~~~~~~~~~~~~~~~~~~~~
# Physical Drive ID Correction Algorithm Invocations Errors Corrected by ECC Delayed Errors Corrected by ECC Fast Errors Corrected by Rereads/Rewrites Total Errors Corrected Total Errors Uncorrected
-|-----------------|--------------------------------|-------------------------------|----------------------------|------------------------------------|----------------------|------------------------|
1 MG07SCA1/21X0A14Z 14475                            4951                            0                            5005                                 4951                   54
~~~~~~~~~~~~~~~~~~~~~~~~~~~~~~~ DELL PERC Metrics ~~~~~~~~~~~~~~~~~~~~~~~~~~~~~~~
# Physical Drive ID Media Errors Other Errors Predictive Failures Shield counter
-|-----------------|------------|------------|-------------------|--------------|
1 MG07SCA1/21X0A14Z 0            0            0                   0
Nodes and Cluster User Interface
Storage Health Monitoring
The system monitors storage health across Recorder Nodes, Service Nodes, and Cluster Nodes, providing integrated alerting to identify potential disk or filesystem issues.
Refer to the table below to locate the Storage Health tab based on the specific node type.
| Node Type | Path |
|---|---|
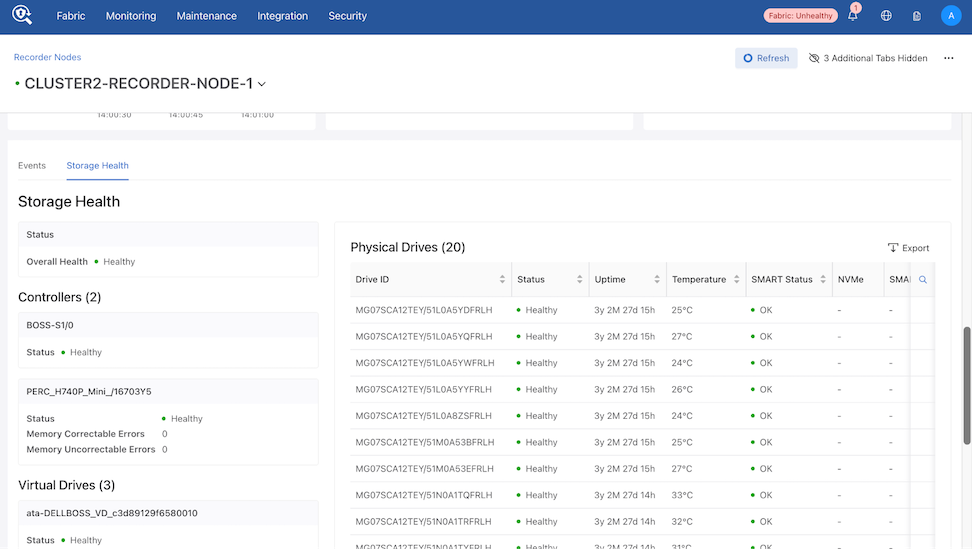
| DMF Recorder Node | Monitoring → Recorder Nodes → [Node] → Storage Health |
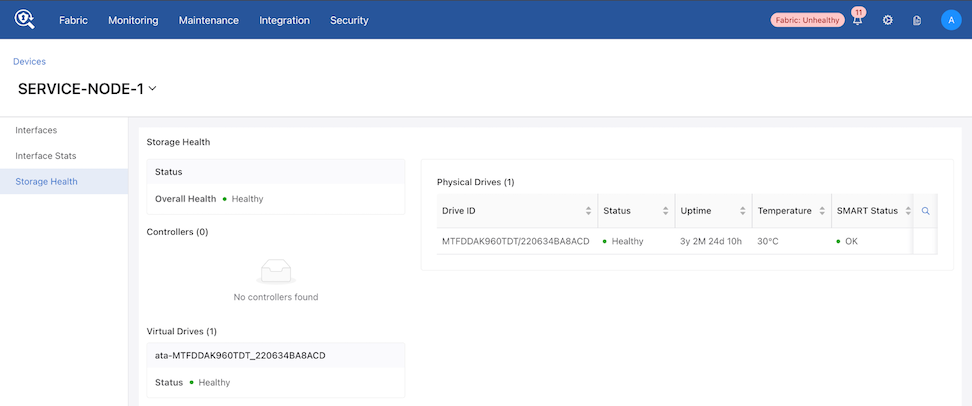
| DMF Service Node | Monitoring → Managed Services → Devices → [Device] → Storage Health |
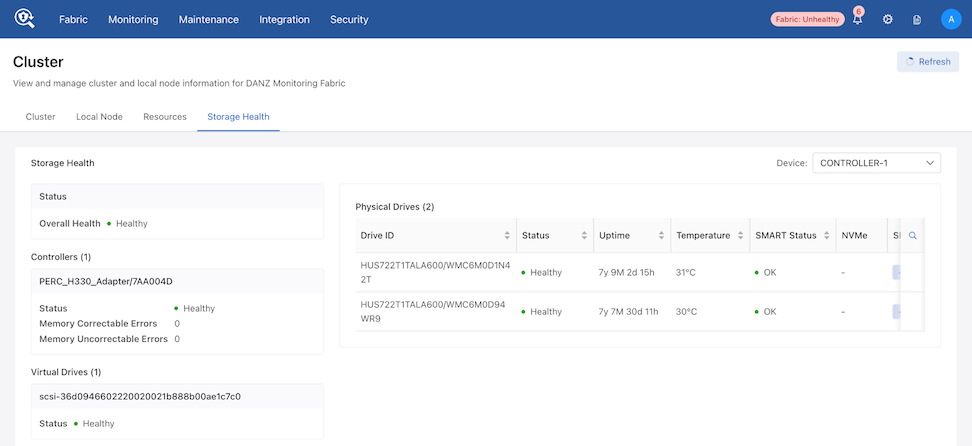
| DMF Cluster Controller | Maintenance → Cluster → Storage Health |
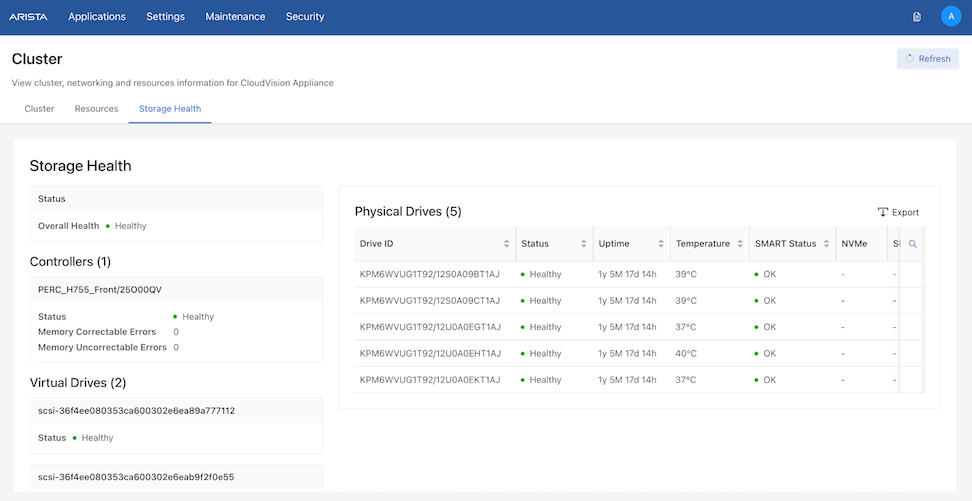
| CVA Cluster | Settings → Cluster → Storage Health |
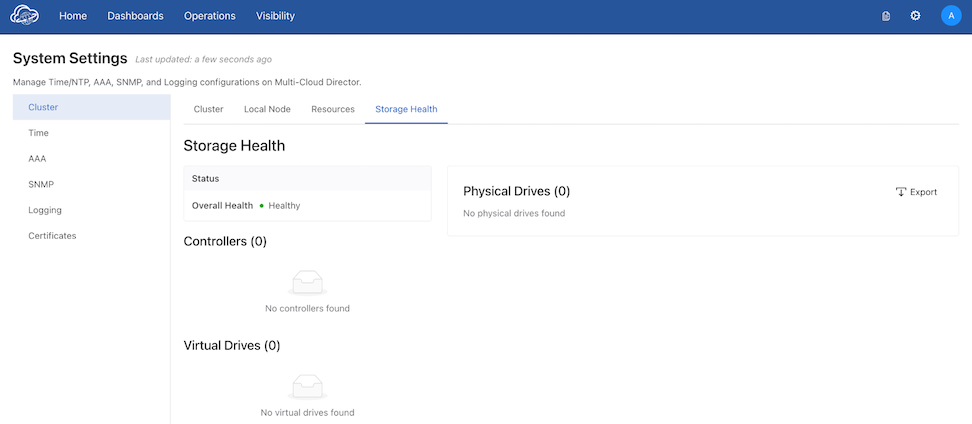
| MCD Cluster | Settings (⚙️) → System Settings → Cluster → Storage Health |
Storage Health for Recorder Node
Storage Health for Service Node
Storage Health for Cluster
DMF Controller - Use the Device drop-down menu to switch between cluster nodes.
CVA Cluster
MCD Cluster
Alerts
The system generates alerts at the node level rather than per-drive. A single node may trigger multiple alerts, with specific details provided in the alert message.
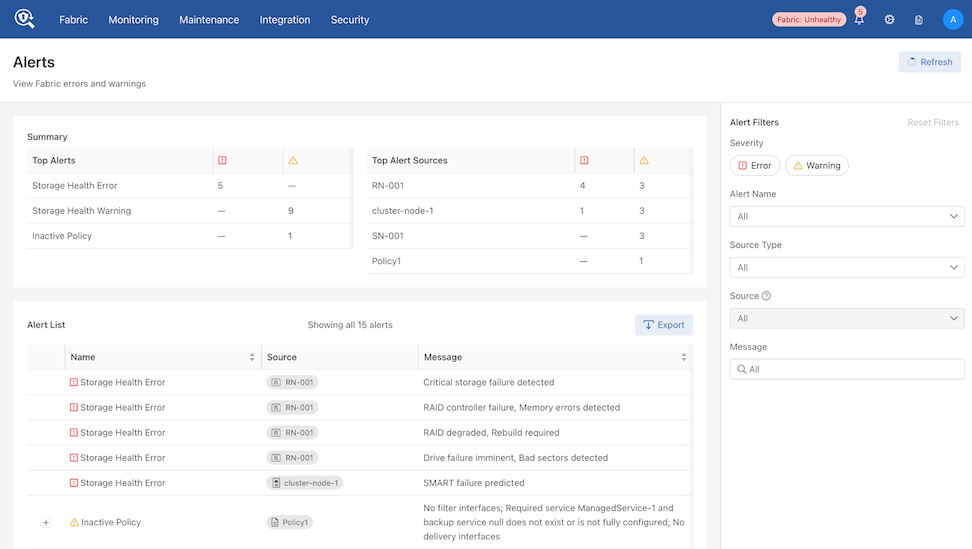
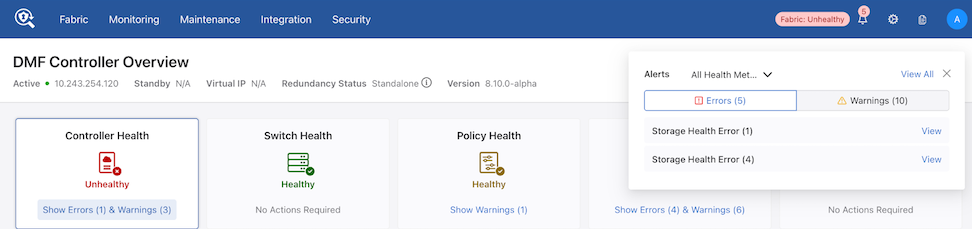
The Notification icon displays all active alerts. Additionally, verify warnings and errors in the following sections:
-
Cluster Nodes: Refer to the Controller Health section.
-
Recorder and Service Nodes: Refer to the Smart Node Health section.
Troubleshooting
- If functionality is hampered, the REST API and CLI report error collection status and messages describe the issue. Review the device’s floodlight.log and events.log for further details about the issue.
Note: The log files do not report certain storage issues, such as a failing hard drive.
Considerations
- The feature relies on metrics reported by storage devices (drives and controllers). Therefore, the exact set of metrics, accuracy, and reliability may vary depending on the hardware.
- The feature only gathers metrics exposed by the devices. It does not perform any tests, including physical drive self-tests, which may provide additional data points for assessing storage device health.
- The feature is stateless. It does not track changes in metrics or changes in hardware configuration. However, metrics' dynamics can be tracked with external tooling, e.g., by exporting them to Prometheus (refer to https://www.arista.com/en/support/toi/dmf-8-5-0/18913-prometheus-endpoint-support-for-infrastructure-metrics).