Monitor Enterprise
VeloCloud SD-WAN allows an Enterprise user to monitor the events and services using a redesigned portal.
In the SD-WAN service of the Enterprise portal, select Monitor. The following screen displays:
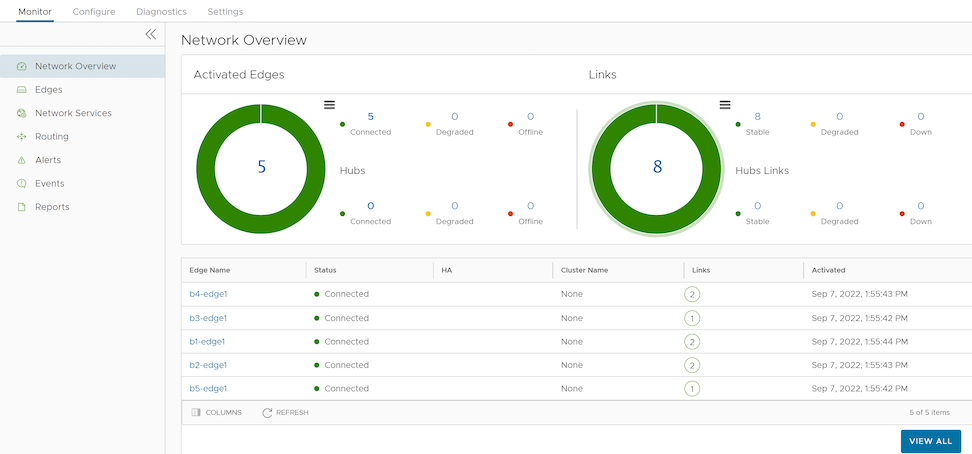
Users can explore each monitoring option and select the graphs to view detailed reports.
- Search - Enter a term to search for specific details. select the Filter icon to filter the view by a specific criterion.
- Column - Select the columns to be shown or hidden in the view.
- Refresh – Select to refresh the details displayed with the most current data.
Monitor Network Overview
The Network Overview page displays the overall summary of the network, like total count of activated Edges, links, top performing applications, and Edges by traffic data volume, and other configuration data for an Enterprise.
To view the Network Overview summary, traffic usage data, and configuration data in the SD-WAN service of the Enterprise portal, select .
The Network Overview page displays. Turn on the Auto-Refresh button to automatically refresh the page every 30 seconds.
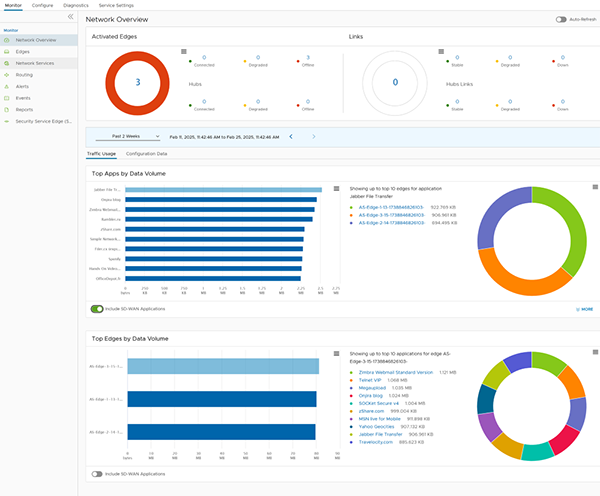
On the top of the Network Overview page, the Activated Edges section displays the total number of Activated Edges and Hubs connected, degraded, and offline, along with a graphical representation for the Enterprise. The Links section displays the Links and Hub Links stable, degraded, and down, along with a graphical representation.
Selecting a number in the Activated Edges or Links section redirects users to the Edges list page with the corresponding filter applied. Note that Only Hub enables automatically in the Edges list page when users select the number on the Hub or Hub Links.
Users can select the time range for which they want to display the traffic usage data in the dashboard. The default value is Past 12 hours.
Traffic Usage Summary
| Option | Description |
|---|---|
| Top Apps by Data Volume |
Displays the top 10 performing applications sorted by volume of data. Select an application to view the top 10 Edges for the selected application. To learn more about an Edge, select the Edge link, and it redirects users to the page. |
| Top Edges by Data Volume |
Displays the top 10 Edges sorted by volume of data. Select an Edge to view the top 10 applications for the selected Edge. To learn more about an application, select the application link, and it redirects users to the page. |
| Include SD-WAN Applications | Select to include SD-WAN applications and traffic data. |
| More | Select More to show the next 10 performing applications/Edges. A maximum of 20 items can be displayed in the dashboard. |
Configuration Data Summary
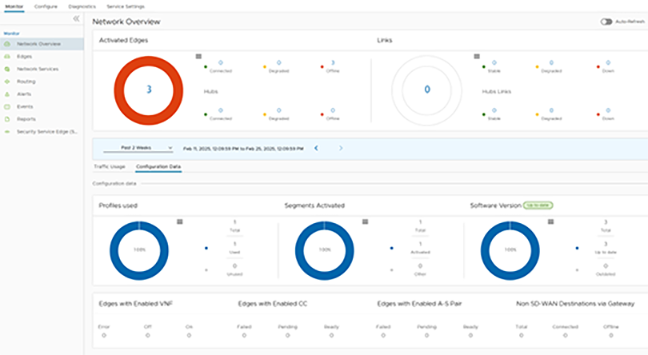
To view configuration data for the Enterprise, select the Configuration Data tab.
| Option | Description |
|---|---|
| Profiles Used | Displays the details of used and unused profiles. |
| Segments Activated | Displays the details of activated and other segments. |
| Software Version | Displays the details of software versions of the Edges such as up-to-date and outdated versions. |
| Edges with Enabled VNF | Displays the number of Edges activated with VNF with statuses Error, Off, and On. |
| Edges with Enabled CC | Displays the number of Edges activated with CC with statuses Failed, Pending, and Ready. |
| Edges with Enabled A-S Pair | Displays the number of Edges activated as Active-Standby pair with statuses Failed, Pending, and Ready. |
| Non SD-WAN Destinations via Gateway | Displays the number of non SD-WAN destinations connected and offline. |
Monitor Security Overview
The Security Overview page displays the overall impact summary of configured security services, such as Intrusion Detection System (IDS)/Intrusion Prevention System (IPS), URL Categories, URL Reputations, and Malicious IP for all Edges within an Enterprise, based on the metrics that the Orchestrator collects using the various Enhanced Firewall Services (EFS) engines (IDS/IPS/URL Filtering/Malicious IP).
Monitor Security Overview - Enterprise View
To view the overall impact summary of configured Security services for an Enterprise, in the SD-WAN service of the Enterprise portal, select .





| Option | Description |
|---|---|
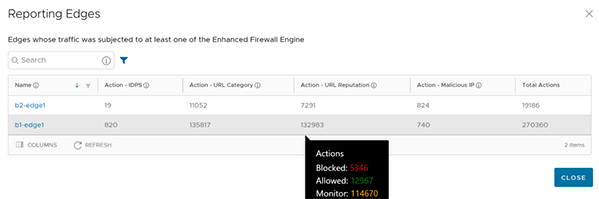
| Overall Impact Summary | Displays the total count of Edges within the Enterprise and the total count of Reporting Edges whose traffic encountered at least one of the Enhanced Firewall Engines. Under Reporting Edges, selecting the link to the number displays a tabular view of all Edges whose traffic encountered at least one EFS engine, along with the Action count details. Hover the mouse over the Action count to view the split count by supported Action types.
 |
| IDS/IPS Summary | Displays the total count of IDS/IPS Threats Detected and Prevented for all Edges within the Enterprise, along with the Threat Severity and Action details in a graphical representation. Hover the mouse over the graphs to view specific threat details. For detailed information about the IDS/IPS Threat distribution, see the section Monitor IDS/IPS. |
| URL Category Summary | Displays the total count of URL Categories and Action count details for all Edges within the Enterprise, along with the Top 5 URL Categories details in a graphical representation. For detailed information about the URL Category Threats distribution, see the section Monitor URL Filtering. |
| URL Reputation Summary | Displays the total count of URL Reputation risks and Action count details for all Edges within the Enterprise in a graphical representation. For detailed information about the URL Reputation Threats distribution, see the section Monitor URL Filtering. |
| Malicious IP Summary | Displays the total count of Malicious IP Blocked and Monitored. For detailed information about the distribution of malicious IP threats, see the section Monitor Malicious IP. |
Monitor IDS/IPS
For a detailed view of IDS/IPS-specific threats for an Enterprise, select .
- Impacted Edge Distribution: Represents a map view of all the IDS/IPS Impacted Edges, by Severity, and Protected Edges.
Figure 10. Impacted Edge Distribution 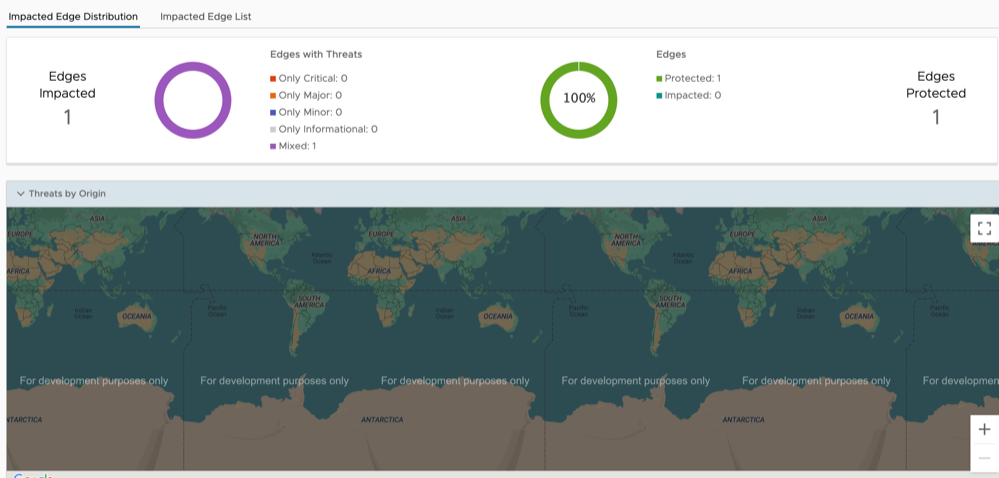
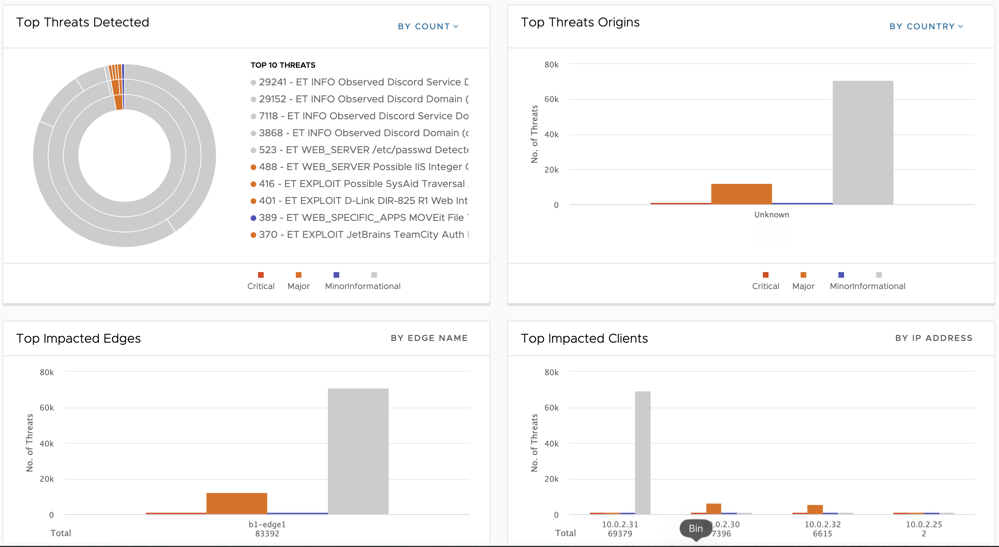 The page graphically displays the following IDS/IPS Threat details for an Enterprise:
- Total count of Edges Impacted
- Total count of Edges Protected
- Top Threats Detected filtered "By Count" (Default) or "By Impact"
- Top Threat Origins filtered "By Country" (Default) or "By IP Address"
- Top Impacted Edges filtered "By Edge Name"
- Top Impacted Clients filtered "By IP Address"
- Impacted Edge List: Represents a tabular view of all the IDS/IPS impacted Edges along with Threat details.
Figure 11. Impacted Edge List 
The page displays the following details: Name and Description of the impacted Edge, Threat Impact on Edge, and Status of the impacted Edge.
Monitor URL Filtering
To view the URL Filtering specific threats details for an Enterprise, select .


- Total count of URL Categories
- Total count of URL Category Actions
- Top URL Categories
- Top URL categories filtered by "Action" (Blocked, Allowed, and Monitored) or "Total Count" (Default)
- Top Edges filtered by "Category Actions" (Blocked, Allowed, and Monitored) or "Total Count" (Default)
- Total count of URL Reputations
- Total count of URL Reputation Actions
- Top Websites filtered by "URL Reputation" (High Risk, Suspicious, Medium Risk, Low Risk, and Trustworthy) or "Total Count" (Default)
- Top Edges filtered by "Reputation Actions" (Blocked, Allowed, and Monitored) or "Total Count" (Default)
Monitor Malicious IP
For a detailed view of the Malicious IP-specific threats, select .
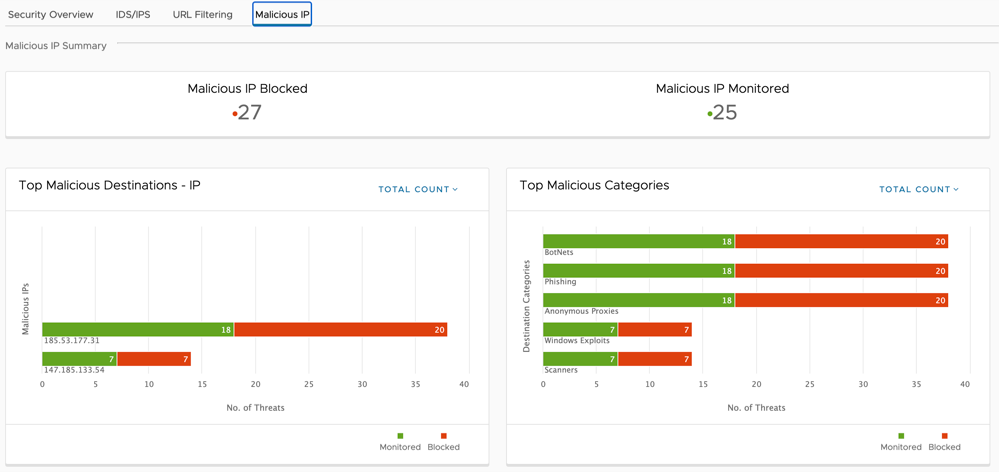
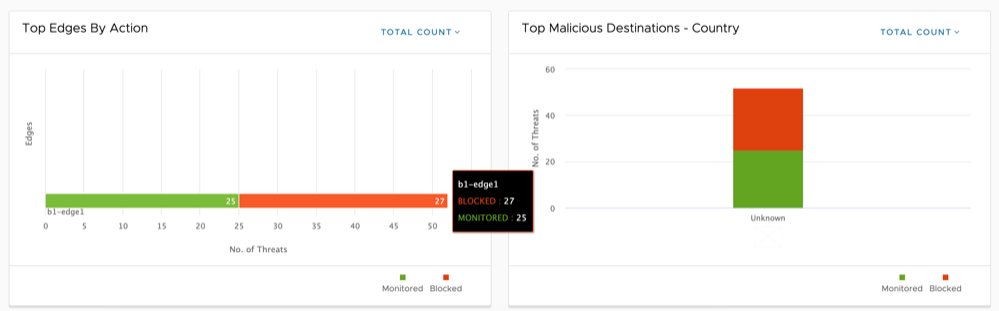
- Total count of Blocked Malicious IP
- Total count of Monitored Malicious IP
- Top Malicious Destination IPs filtered by "Action" (Blocked and Monitored) or "Total Count" (Default)
- Top Malicious Categories filtered by "Action" (Blocked and Monitored) or "Total Count" (Default)
- Top Edges filtered by "Action" (Blocked and Monitored) or "Total Count" (Default)
- Top Malicious Destination Countries filtered by "Action" (Blocked and Monitored) or "Total Count" (Default)
Monitor Security Overview- Edge View
To view the EFS Threat details for a specific Edge:
- In the SD-WAN service of the Enterprise portal, select . The list of Edges associated with the Enterprise appears.
- Select an Edge by selecting the link to an Edge. The Network Overview page (default page view) appears.
- From the Network Overview menu, select Security Overview. The Security Overview page displays the overall impact summary of configured Security services, such as IDS/IPS, URL Categories, URL Reputations, and Malicious IP for the selected Edge.
Monitor Edges
Users can monitor the status of Edges and view the details of each Edge, like the WAN links, top applications used by the Edges, usage data through the network sources and traffic destinations, business priority of network traffic, system information, or details of Gateways connected to the Edge.
To monitor the Edge details:
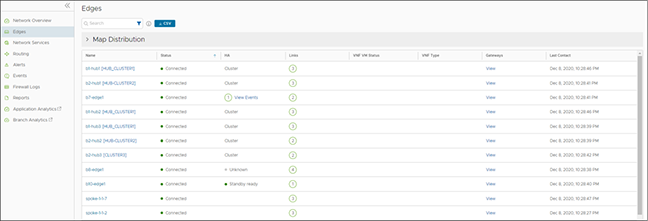
Select CSV to download a report of the Edges in CSV format.
Select View in the Gateways column to view the details of the Gateways connected to the corresponding Edge.
Select an Edge name in the Name column to view the details of the selected Edge. Select the relevant tabs to view the corresponding information. Each tab displays a drop-down list at the top, from which users can select a specific time period. The tab displays the details for the selected duration.
Some of the tabs provide a drop-down menu of metric parameters. Users can choose the metrics from the list to view the corresponding data. The following table lists the available metrics:
| Metrics Option | Description |
|---|---|
| Average Throughput | Total bytes in a given direction divided by the total time. The total time is the periodicity of statistics uploaded from the Edge. By default, the periodicity in Orchestrator is 5 minutes. |
| Total Bytes | Total number of bytes sent and received during a network session. |
| Bytes Received/Sent | Split up details of the number of bytes sent and received during a network session. |
| Total Packets | Total number of packets sent and received during a network session. |
| Packets Received/Sent | Split up details of number of packets sent and received during a network session. |
| Bandwidth | The maximum rate of data transfer across a given path. Displays both the upstream and downstream bandwidth details. |
| Latency | Time taken for a packet to get across the network, from source to destination. Displays both the upstream and downstream Latency details. |
| Jitter | Variation in the delay of received packets caused by network congestion or route changes. Displays both the upstream and downstream Jitter details. |
| Packet loss | Packet loss happens when one or more packets fail to reach the intended destination. A lost packet is calculated when a path sequence number is missed and does not arrive within the re-sequencing window. A “very late” packet is counted as a lost packet. |
| Auto Dual-Mode SIM | Status of the Edge with respect to the Automatic Switchover feature configured on that Edge, and is applicable only for a 610-LTE. For more information on the Automatic Switchover feature, see Configure Automatic SIM Switchover. |
| Signal | Signal strength of the Edge indicated by the number of bars. |
| Filter Option | Description |
|---|---|
| Application | The application used by the Edge. |
| Category | The category of the application used by the Edge. |
| Operating System | The operating system used by the Edge. |
| Hostname | The hostname associated with the flow. |
| IP Address | The IP address associated with the flow. |
| Client Device | The Client device associated with the flow. |
| Destination | The destination domain of the flow. |
| Destination IP | The destination IP address of the flow. |
| FQDN | The Fully Qualified Domain Name (FQDN) of the flow. |
| Next Hop | The Next hop SD-WAN destination for the flow based on indicated Route. |
| Route | The WAN route taken by the flow. Refer to table Route to Next Hop Mapping for description of each route and its relation to Next hop. |
| Route Name | Nexthop |
|---|---|
| cloudViaGateway | The name of the Gateway that routes traffic to the cloud. |
| internetViaDirectBreakout | Nexthop has no name. The traffic is coming from the Internet directly. |
| branchToBranch (Gateway) | The name of the Gateway responsible for routing traffic to the other branch. |
| branchToBranch (Edge) | The name of the Edge used to route traffic to the other branch. |
| branchToNVSDirect | The name of the HUB device serving as the nexthop Edge. |
| branchToNVSViaGateway | The name of the Gateway that routes traffic to NVS. |
| branchToBackhaul | The name of the Edge or enterprise object used to route traffic to a non-VeloCloud site. |
| cloudViaGateway (Edge – to Partner Gateway) | The nexthop is the name of the Partner Gateway that will route the traffic. |
| branchRouted | Nexthop has no name. For basic routed traffic, there is no destination object, specifically, via an Edge router. |
| internetViaBranchCSS | Name of enterprise object used to route traffic to a non-VeloCloud branch. |
- Configure: Navigates to the Configuration tab of the selected Edge. See
- View Events: Displays the Events related to the selected Edge.
- Remote Diagnostics: Allows running the Remote Diagnostics tests for the selected Edge. See
- Generate Diagnostic Bundle: Allows the generation of a Diagnostic Bundle for the selected Edge. See
- Remote Actions: Allows Remote actions for the selected Edge. See
- View Profile: Navigates to the Profile page associated with the selected Edge.
- View Gateways: Displays the Gateways connected to the selected Edge.
| Option | Description |
|---|---|
| Search | Enter a term to search for the matching text across the page. Use the advanced search option to narrow down the search results. |
| Columns | Select and select the columns to be displayed or hidden on the page. |
| Refresh | Select to refresh the page to display the most current data. |
Monitor Edge Overview
The Overview tab of an Edge in the monitoring dashboard displays the details of WAN links along with bandwidth consumption and network usage.
- In the SD-WAN service of the Enterprise portal, select to view the Edges associated with the Enterprise.
- Select the link to an Edge to display the Overview tab.
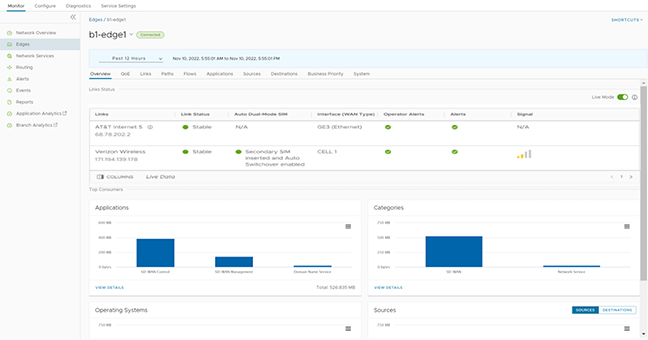
Users can choose to view the Edge information live using the Live Mode option. When this mode is ON, live monitoring of the Edge happens, and the data in the page updates whenever a change occurs. The live mode automatically switches to offline mode after a specified period of time to reduce network load.
The Links Status section displays the details of Links, including Link Status, Auto Dual-Mode SIM, WAN Interface, Throughput, Bandwidth, Signal, Latency, Jitter, and Packet Loss. For additional information on these parameters, see Monitor Edges.
The Top Consumers section displays a graphical representation of bandwidth and network usage for the following: Applications, Categories, Operating Systems, Sources, and Destinations of the Edges. Select View Details in each panel to navigate to the corresponding tab and view additional details.
Monitor Quality of Experience
The Quality of Experience (QoE) tab displays the Quality Score for different applications. The Quality score rates an applications quality of experience that a network can deliver over a period of time. The QoE calculates based on the best score comparing all the Static tunnels, Edge to Gateways and Edge to Hubs, and then displays the best-performing tunnel.
- In the SD-WAN service of the Enterprise portal, select to view the Edges associated with the Enterprise.
- Select the link to an Edge, and then select the QoE tab.
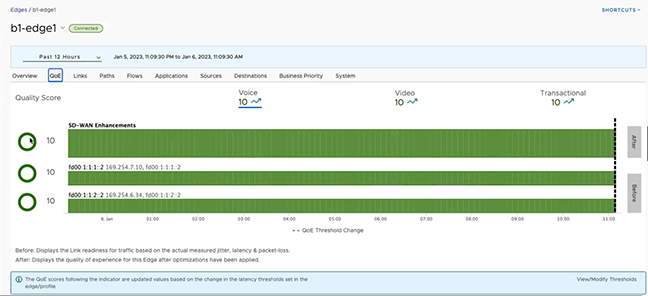
- Voice
- Video
- Transactional
| Color | Rating | Rating Option |
|---|---|---|
| Green | Good | All metrics are better than the objective thresholds. Application SLA is met/exceeded. |
| Yellow | Fair | Some or all metrics are between the objective and maximum values. Application SLA is partially met. |
| Red | Poor | Some or all metrics have reached or exceeded the maximum value. Application SLA is not met. |
To modify the threshold values, select the View/Modify Thresholds link located at the bottom of the screen, and view the page.
Monitor Links of an Edge
Users can monitor the WAN links connected to a specific Edge along with the status, interface details, and other metrics.
To view the details of Links and Transport groups used by the traffic:
- In the SD-WAN service of the Enterprise portal, select to view the Edges associated with the Enterprise.
- Select the link to an Edge, and then select the Links tab.
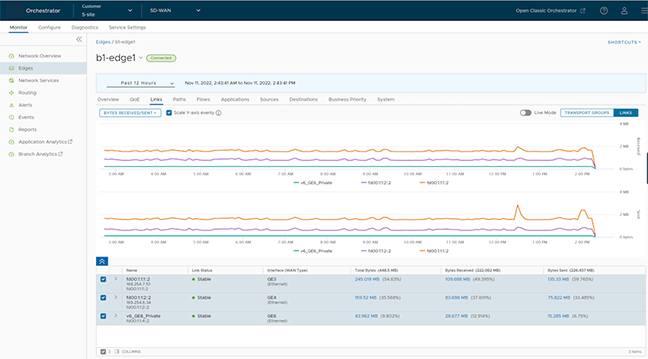
At the top of the page, users can choose a specific time period to view the details of the priorities for the selected duration.
By default, Orchestrator enables Scale Y-axis evenly. This option synchronizes the Y-axis between the charts. If desired, users can turn off this option.
Hover over the graphs to view additional details.
Select Transport Groups to view the links grouped into one of the following categories: Public Wired, Public Wireless, or Private Wired.
Users can choose viewing the information live using the Live Mode option. When enabled, users can view live monitoring of the links and the transport groups.
Select the metrics from the list to view the details related to the selected parameter.
The bottom panel displays the details of the selected metrics for the links or the transport groups. Users can view the details of a maximum of four links at a time.
Select the arrow prior to the link name or the transport group to view the break-up details. To view drill-down reports with additional details, select the links displayed in the metrics column.
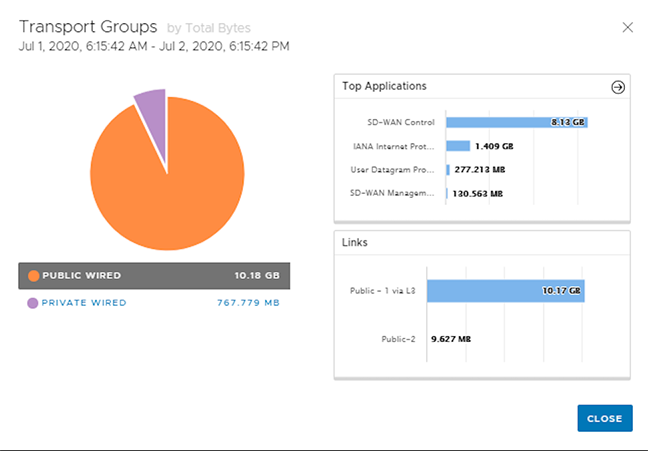
Select the arrow next to Top Applications to navigate to the Applications tab.
Monitor Path Visibility
A path consists of a tunnel between two endpoints. Path visibility provides a report on the utilization and quality of the paths between an Edge and VeloCloud SD-WAN peers. With Orchestrator, an Enterprise user can monitor the Path visibility using the Monitoring dashboard.
- In the SD-WAN service of the Enterprise portal, select Monitor Edges to view the Edges associated with the Enterprise.
- Select the link to an Edge, and then select the Paths tab.
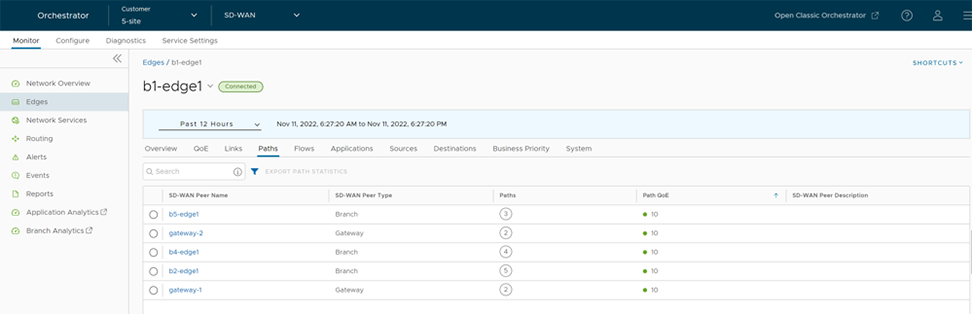
At the top of the page, users can select a specific time period to view the details of the priorities for that duration.
To obtain a report of a VeloCloud SD-WAN peer in CSV format, select the peer and then select Export Path Statistics.
Select the link to a VeloCloud SD-WAN peer to view the corresponding Path details as follows:
- All of the VeloCloud SD-WAN peers with observed traffic during the selected time period.
- The status of the paths available for a selected peer.
- Overall quality score of the paths for a selected peer for voice, video, and transactional traffic.
- Time series data for each path, including metrics such as Throughput, Latency, Packet loss, and Jitter. For additional information on the parameters, see Monitor Edges.
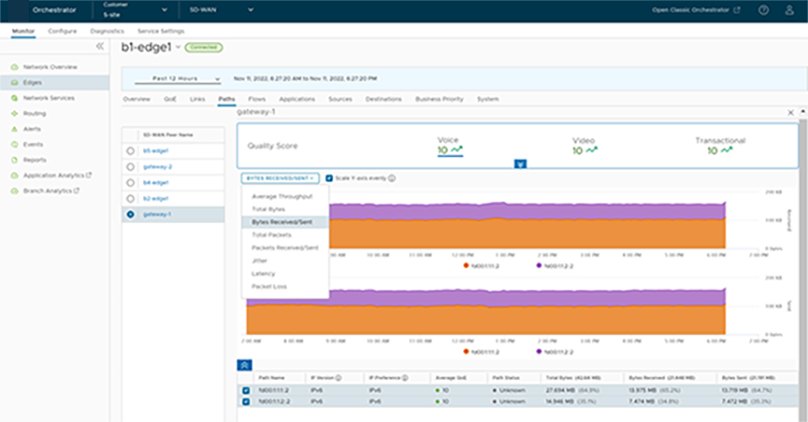
The metrics time-series data displays in a graphical format. Users can select and view the details of a maximum of 4 paths at a time.
By default, Orchestrator enables Scale Y-axis evenly. This option synchronizes the Y-axis between the charts. If desired, users can disable this option.
Hover over the graphs to view additional details.
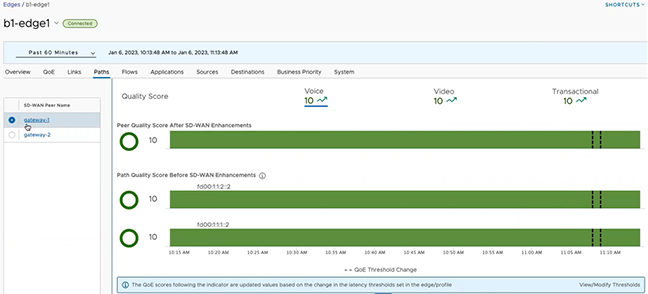
Users can select a VeloCloud SD-WAN peer displayed in the left pane to view the corresponding Path details.
A black vertical dotted line indicating an anchor appears on the graph whenever a threshold value changes in a Profile or an Edge. Users can hover over the anchor to see the modified latency threshold values for Voice, Video, and Transactional. To modify the threshold values, select the View/Modify Thresholds link located at the bottom of the screen which displays the page.
Monitor Flow Visibility
The Flow Visibility feature introduces a new Flows tab under , which provides detailed flow data for each traffic flow on each Edge. The comprehensive end-to-end flow (non-live flow) builds based on certain flow parameters, such as Source IP, Destination IP, Destination Port, Protocol, and Link ID. These parameters display in a single-view table format, which can assist with monitoring and troubleshooting non-live flows. Starting with the 6.1 release, Orchestrator supports the Live Mode monitoring feature. The Live Mode monitoring provides visibility into a Source Port in addition to non-live flows. It allows users to select individual or multiple live flows, up to four flows, to monitor and compare the metrics as live time series graphs.
Monitor Non-Live Flows
- In the SD-WAN service of the Enterprise portal, select to view the Edges associated with the Enterprise.
- Select the link of an Edge, and then select the Flows tab.
- At the top of the page, from the Time Duration menu, choose a specific time or create a custom time filter to view the flow information. By default, Past 12 Hours is selected. The feature supports filter capabilities from the past 60 minutes to 1 year. The current data retention policy retains high-resolution, per 5 minutes, flows for 4 weeks and low-resolution, per day, flows for up to a year.
High-resolution tables provide detailed insights into individual flows and short-term trends. They provide insight useful for in-depth analysis and troubleshooting. Low-resolution tables offer a broader perspective on network traffic over longer periods. Use for capacity planning, trend identification, and reporting.
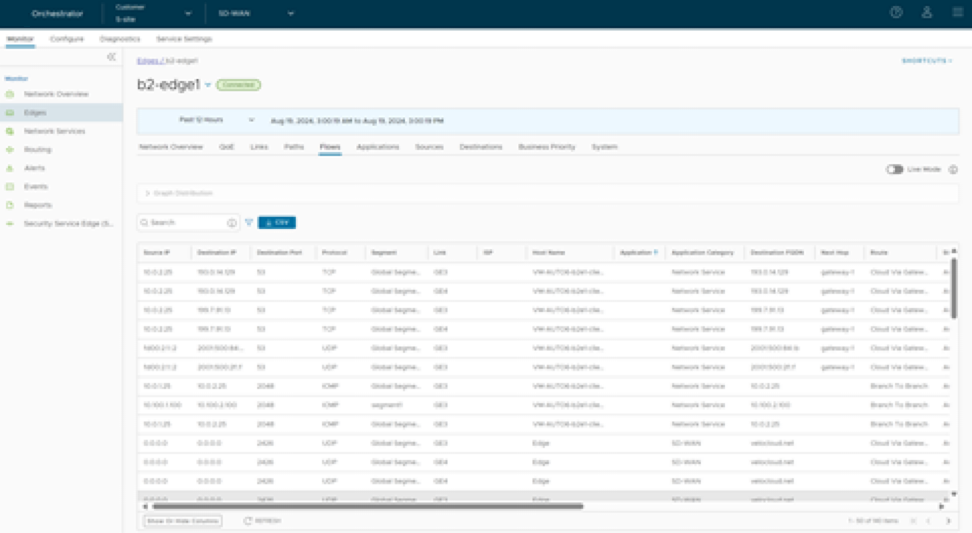
The Search field provides search capabilities to find a specific flow. Enter a search string to find text that matches the Source IP, Destination IP, Destination FQDN, and Destination Domain fields. Use the Advanced Search feature for more advanced filtering criteria.
- Source IP
- Destination IP
- Destination Port
- Segment
- Host Name
- Application
- Category
- Destination FQDN
- Destination Domain
- Next Hop
Select CSV to create customized reports by exporting flow data in CVS format.
Monitor Live Flows
edge.liveData.enterFlowLiveMode.delay.seconds and edge.liveData.enterFlowLiveMode.flow.count System Properties. See the section List of System Properties in the Operator Guide for a description of these properties and information on how to configure them.
- In the SD-WAN service of the Enterprise portal, select to view the Edges associated with the Enterprise.
- Select the link of an Edge, and then select the Flows tab.
- In the Flows tab area of the Orchestrator, enable Live Mode to activate the live monitoring of flow data. The Time Remaining countdown of five minutes begins.
Figure 23. Activate Live Flow Monitoring 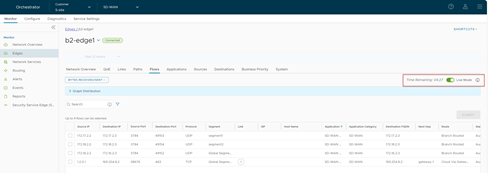
- In the Flows table, select up to four flows to monitor and compare the flow metrics. The selected flows move to the top of the table for better visibility. Then, select any of the graph plots criteria Bytes Received/Sent, Total Bytes, Packets Received/Sent, Total Packets, and Average Throughput, and select Submit.
Figure 24. Plot Flow Metrics Graph 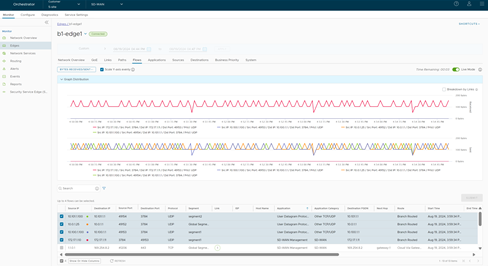
For the selected Edge with Live Mode activated, the Flows tab displays time series graphs of the selected flows, plotted at a rate of two seconds for a period of five minutes based on the selected graph plots criteria.
The Time Remaining countdown resets after selecting and submitting the flows and submitted. The timer begins counting down from five minutes. After five minutes, a Mode Selection pop-up dialog displays.Figure 25. Mode Selection 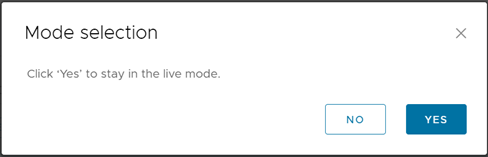 By default, Orchestrator enables Scale Y-axis evenly. This option synchronizes the Y-axis scale between the two charts. If desired, users can disable this option.
- Select Yes to stay in Live Mode, which resets the mode to Live, and the countdown of five minutes begins.
- Select No to exit the Live Mode. The Flows tab returns to a static view.
Note: At any given time, only one user can initiate live flows on a specific edge. The Mode selection dialog displays for 30 seconds. If no action occurs, the user automatically exits Live Mode.Note: A maximum of 100 concurrent Edges can be monitored by default.
- Select Breakdown by Links to view the breakdown of flows by link. The link-level breakdown provides a detailed analysis of the graph flows displaying the data flow through each link since the flow started.
Orchestrator calculates the breakdown of flows by link by using the flow tuple and link headers. This is in contrast with using the flow tuple with no added headers as in non-breakdown by link When breaking down network flows by link, if the flow is a local network flow, no Wide Area Network (WAN) link), then no WAN link information displays.
- Selecting Refresh retrieves active flows in a batch of 1000- 4999 flows from the Edge and updates existing flows displayed in the table.
Note: When the live mode is activated, if users select Refresh the Time Remaining counter does not refresh.
If a customer actively monitor flows and refreshes the table, the active live flows displayed on the graph no longer display, and the graph empty.
Functionality Deviations from the Non-Live Mode
| Deviation | Behavior |
|---|---|
| Deviation of Filter functionality from non-live mode | In Live Mode, users must provide a CIDR-formatted IPv4 or IPv6 address to apply filters based on Source/Destination IP addresses of current flows on the Edge. Users cannot filter flows based on Link or Destination Domain. |
| Deviation of Search functionality from non-live mode | In Live Mode, the search performs locally and does not require a server-side search. Consequently, it filters data already provided to the Orchestrator and not active flows on the Edge. |
| Deviation of Flow fields from non-live mode |
|
| Field Item | Description |
|---|---|
| Source IP | Displays the IP address with the flow item. This information also displays on the Source tab and can be mapped to the name of the client device/operating system.
Note: When using the search features, IP filters do not support contains, startsWith or endsWith. Use CIDR format for similar results.
Note: When using the filter in the Live Mode, provide a CIDR formatted IPv4 or IPv6.
|
| Destination IP | Displays flow data of the Destination (Domain, FQDN, and IP). This information can also be found in the Destination tab.
Note: When using the search features, IP filters do not support contains, startsWith or endsWith. Use CIDR format for similar results.
Note: When using the filter in live mode, provide a CIDR formatted IPv4 or IPv6.
|
| Source Port | Displays the source port number of the flow.
Note: Source port is not available in the non-live mode.
|
| Destination Port | Displays the destination port number of the flow that identifies the process receiving the data. |
| Protocol | Displays Protocols , such as UDP or TCP, associated with the flow. |
| Segment | Routing domain. Each segment has a unique routing table. |
| Link | The underlying link reporting the flow stats. |
| ISP | Displays the Internet Service Provider associated with the flow. |
| Host Name | The hostname associated with the source device of the flow. |
| Application | Column that displays the application. This information can also be found in the Application tab. |
| Application Category | Similar applications that are used by a specific Edge can be grouped into a category. |
| Destination FQDN | The Fully Qualified Domain Name (FQDN) of the Destination to which the traffic flow was directed. |
| Next Hop | The name of next-hop device for the flow (for example, the name of the Gateway if the route is Cloud via Gateway). See the Route to Nexthop Mapping Table for checkbox details. |
| Route | The path taken to the next hop across one or more networks. |
| Start Time | The timestamp of when the Edge started the flow stats aggregation period. |
| End Time | The timestamp of when the Edge ended the flow stats aggregation period. The difference between start and end times equals the amount of time a flow stat record was aggregated for. |
| Average Throughput | Displays the average throughput. |
| Total Bytes | Displays the total number of bytes sent and received during a flow. |
| Bytes Received | Displays details about the number of bytes received during a flow. |
| Bytes Sent | Displays details about the number of bytes sent during a flow. |
| Total Packets | Total number of packets sent and received during a flow. |
| Packets Received | Displays details about the number of packets received during a flow. |
| Packets Sent | Displays details about the number of packets sent during a flow. |
| Destination Domain | This field is grayed out for the Live Mode. Ensure use destination FQDN or destination IP for the same filter outcomes. |
| Business Policy | Displays the name of the business policy rule associated with the flow. |
| Firewall Rule | Displays the name of the firewall rule associated with the flow. |
| Route Name | Nexthop |
|---|---|
| cloudViaGateway | The name of the Gateway that routes traffic to the cloud. |
| internetViaDirectBreakout | Nexthop has no name. The traffic comes from the Internet directly. |
| branchToBranch (Gateway) | The name of the Gateway responsible for routing traffic to the other branch. |
| branchToBranch (Edge) | The name of the Edge used to route traffic to the other branch. |
| branchToNVSDirect | The name of the HUB device serving as the nexthop Edge. |
| branchToNVSViaGateway | The name of the Gateway that routes traffic to NVS. |
| branchToBackhaul | The name of the Edge or enterprise object used to route traffic to a non-VeloCloud site. |
| cloudViaGateway (Edge – to Partner Gateway) | The nexthop is the name of the Partner Gateway that routes the traffic. |
| branchRouted | Nexthop has no name. For basic routed traffic, there is no destination object, specifically, via an Edge router. |
| internetViaBranchCSS | Name of enterprise object used to route traffic to a non-VeloCloud branch. |
Monitor Edge Applications
Monitor the network usage of applications or application categories used by a specific Edge.
- In the SD-WAN service of the Enterprise portal, select to view the Edges associated with the Enterprise.
- Select the link to an Edge, and then select the Applications tab.
The Applications tab displays the details of the applications used by the selected Edge.
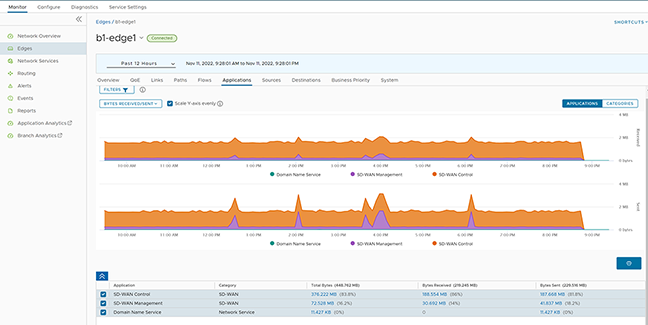
At the top of the page, select a specific duration to view the details of the priorities for the selected duration.
Select Filter to define a criterion and view the application details filtered by the specified criteria, such as Application, Category, Operating System, Hostname, IP Address, Client Device, FQDN, Next Hop, and Route. For additional information about filter descriptions, see Monitor Edges.
By default, Orchestrator enables Scale Y-axis evenly. This option synchronizes the Y-axis between the charts. If desired, users can disable this option.
Select Categories to view similar applications grouped into categories. Hover the mouse over the graphs to view additional details.
Select the metrics from the list to view the details related to the selected parameter.
The bottom panel displays the details of the selected metrics for the applications or categories. Users can select and view the details of a maximum of four applications at a time. Select Columns to select the columns the user wants to see or hide in the view.
To view drill-down reports with additional details, select the links displayed in the metrics column.
The following image displays a detailed report of the top applications.
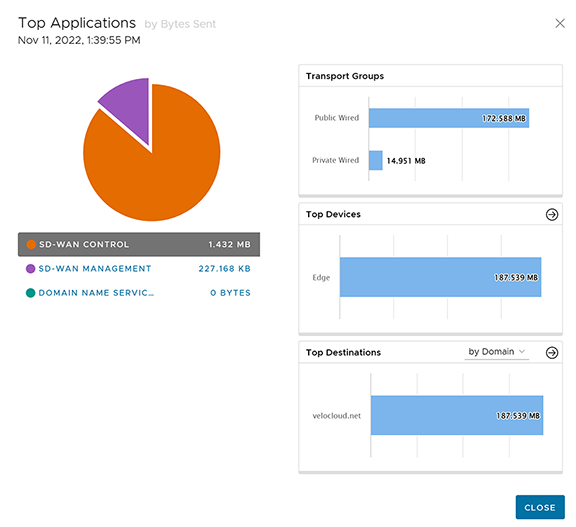
Select the arrows next to Transport Groups, Top Devices, or Top Destinations to navigate the corresponding tabs.
Monitor Edge Sources
Users can monitor the network usage of devices and operating systems for a specific Edge.
- In the SD-WAN service of the Enterprise portal, select to view the Edges associated with the Enterprise.
- Select the link to an Edge, and then select the Sources tab.
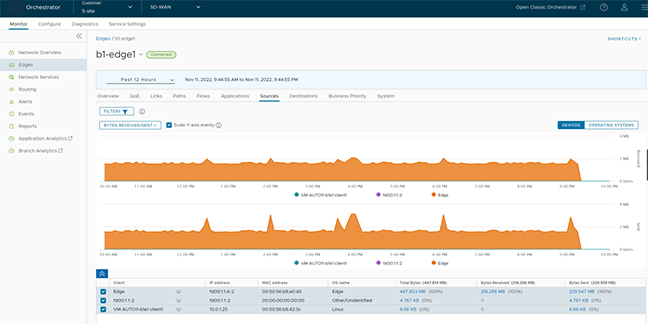
At the top of the page, select a specific time period to view the details of the priorities for the selected duration.
By default, Orchestrator enables Scale Y-axis evenly. This option synchronizes the Y-axis between the charts. If desired, users can disable this option.
Hover the mouse on the graphs to view additional details.
Select Filter to define a criterion and view the application details filtered by the specified criteria, such as Category, Operating System, Hostname, IP Address, Client Device, Destination, Destination IP, FQDN, Next Hop, and Route. For additional information about filter descriptions, see Monitor Edges.
Select Operating Systems to view the report based on the Operating Systems used on the devices.
Select metrics from the list to view the details related to the selected parameter.
The bottom panel displays the details of the selected metrics for the devices or operating systems. Users can select and view the details of a maximum of 4 client devices at a time. Select Columns to select the columns to be shown or hidden in the view.
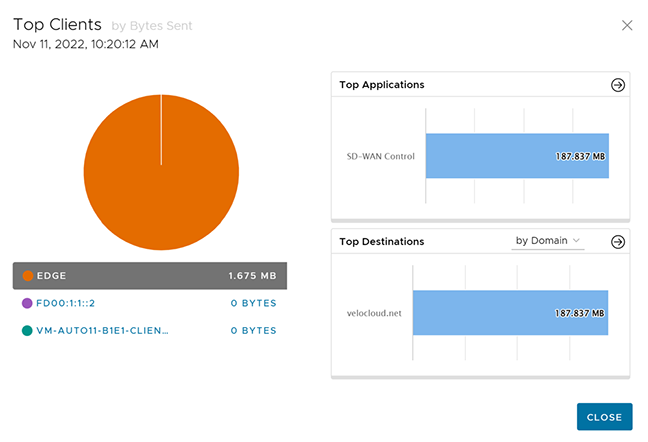
To view reports with additional details, select the links displayed in the Metrics column.
Monitor Edge Destinations
Users can monitor the network usage data about the destinations of network traffic.
- In the SD-WAN service of the Enterprise portal, select to view the Edges associated with the Enterprise.
- Select the link to an Edge, and then select the Destinations tab.
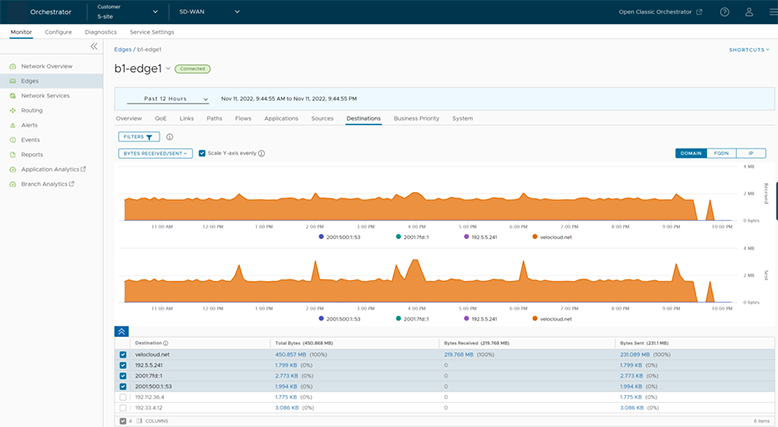
At the top of the page, select a specific time period to view the details of the priorities for the selected duration.
Select Filter to define a criterion and view the application details filtered by the specified criteria, such as Application, Category, Operating System, Hostname, IP Address, Client Device, Destination, Destination IP, FQDN, Next Hop, and Route. For additional information about filter descriptions, see Monitor Edges.
By default, Orchestrator enables Scale Y-axis evenly. This option synchronizes the Y-axis between the charts. If desired, users can disable this option.
users can view the report of Destinations by Domain, FQDN, or IP address. Select the relevant type to view the corresponding information.
Hover the mouse on the graphs to view additional details.
Select metrics from the list to view the details related to the selected parameter.
The bottom panel displays the details of the selected metrics for the destinations by the selected type. Users can select and view the details for a maximum of four destinations. Select Columns to select the columns to be shown or hidden in the view.
To view reports with additional details, select the links displayed in the metrics column.
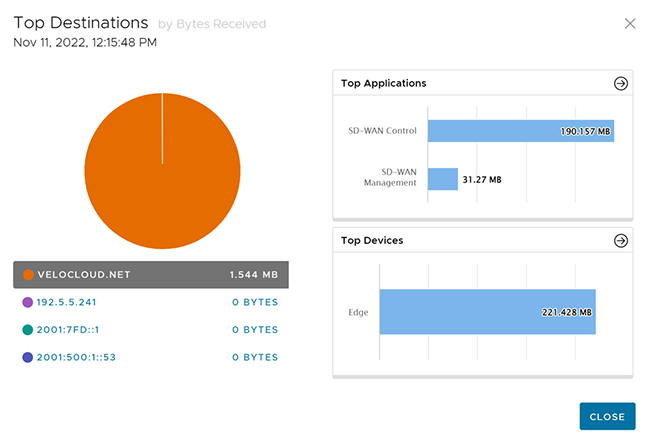
Select the arrows displayed next to Top Applications or Top Devices to navigate to the corresponding tabs.
Monitor Business Priorities of an Edge
- In the SD-WAN service of the Enterprise portal, select to view the Edges associated with the Enterprise.
- Select the link to an Edge, and then select the Business Priority tab.
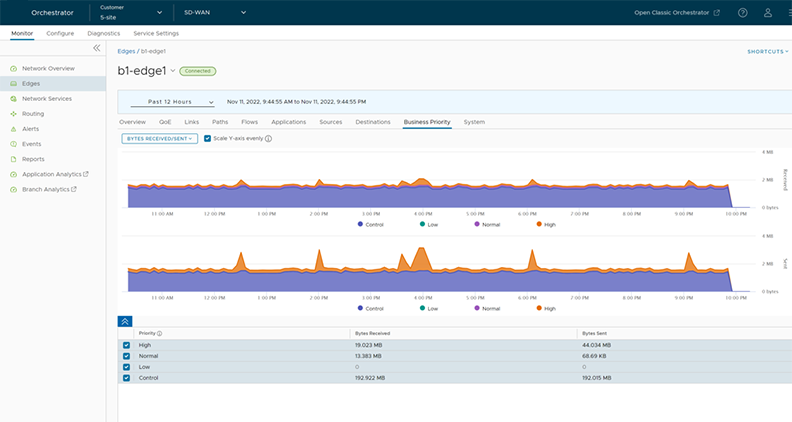
At the top of the page, select a specific time period to view the details of the priorities for the selected duration.
Choose the metrics from the drop-down to view the details related to the selected parameter.
By default, Orchestrator enables Scale Y-axis evenly. This option synchronizes the Y-axis between the charts. If desired, users can disable this option.
Hover the mouse on the graphs to view additional details.
The bottom panel displays the details of the selected metrics for the business priorities.
Monitor System Information of an Edge
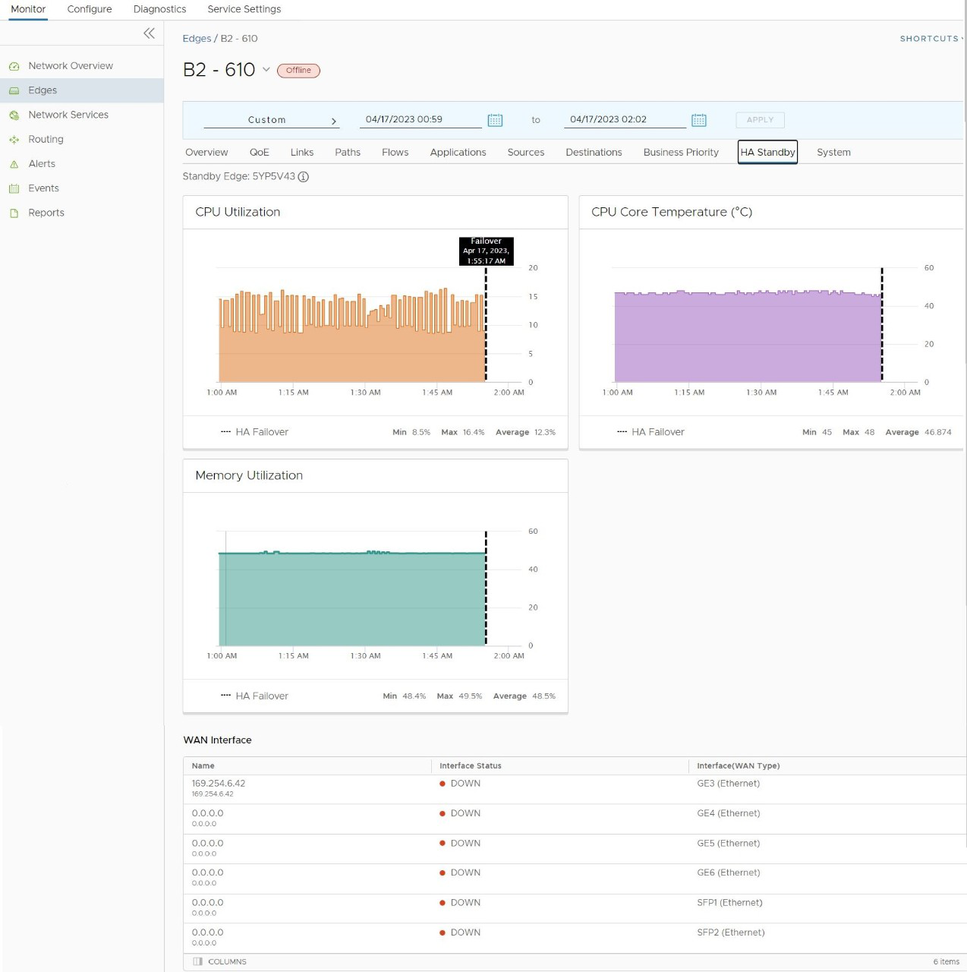
Beginning with the 6.1.0 release, the System tab displays not only the detailed network usage by the system for a specific Edge, but also the system health statistics for an HA Standby Edge.
- In the SD-WAN service of the Enterprise portal, select to view the Edges associated with the Enterprise.
- Select the link to an Edge, and then select the System tab. Orchestrator enables System Overviewby default.
Figure 33. Monitor System Overview of an Edge 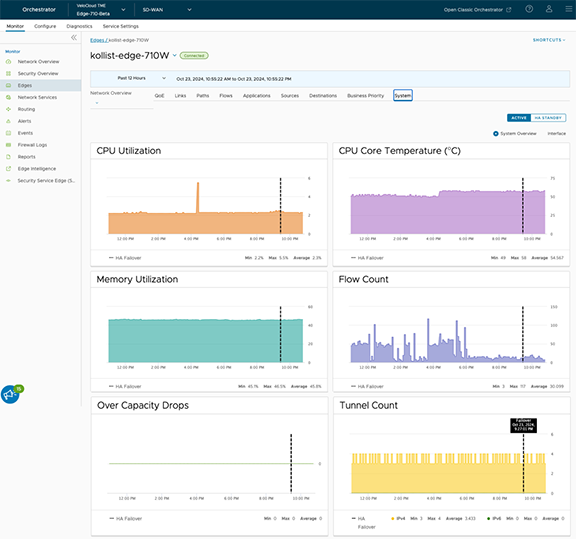 Note: Beginning with the 6.4.0 release, Orchestrator enables the Interface feature. For additional information, see Network Interface Statistics Monitoring
The screen displays graphical representation of usage details about the following over the period of selected time duration, along with the minimum, maximum, and average values.
Table 12. Usage Details Graph Graph Description CPU Utilization Percentage of usage of CPU. CPU Core Temperature (C) The core temperature of the Edge CPU. Note: Only versions 5.1 and later support this on Edges.Memory Utilization Percentage of memory usage. Flow Count Traffic flow count Over Capacity Drops Total number of packets dropped due to over capacity since the last sync interval. Occasional drops occur, usually caused by a large burst of traffic. However, a consistent increase in drops usually indicates an Edge capacity issue. Tunnel Count Count of tunnel sessions. Hover the mouse on the graphs to view additional details.
- By default, the System tab displays the information of an Active Edge. Select HA Standbyto view the System Health statistics for an HA Edge. The Orchestrator includes special monitoring for a Site deployed with a High Availability topology outlined in the following sections.
High Availability Failover Bars
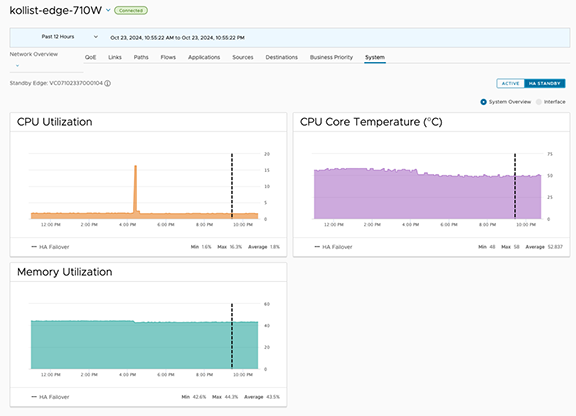
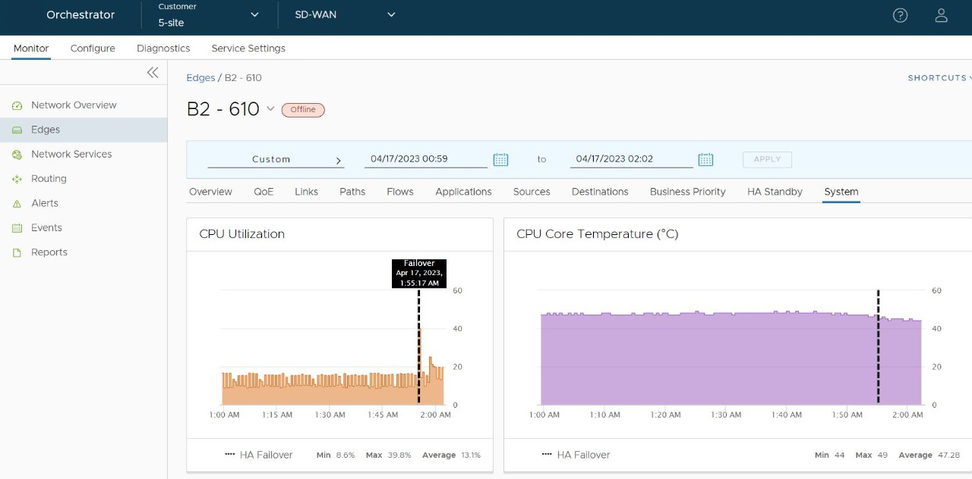
- If users hover the mouse on the bar, it indicates when the failover occurred. This failover bar represents a boundary marking how the system statistics apply to each respective HA Edge when they serve as the Active Edge.
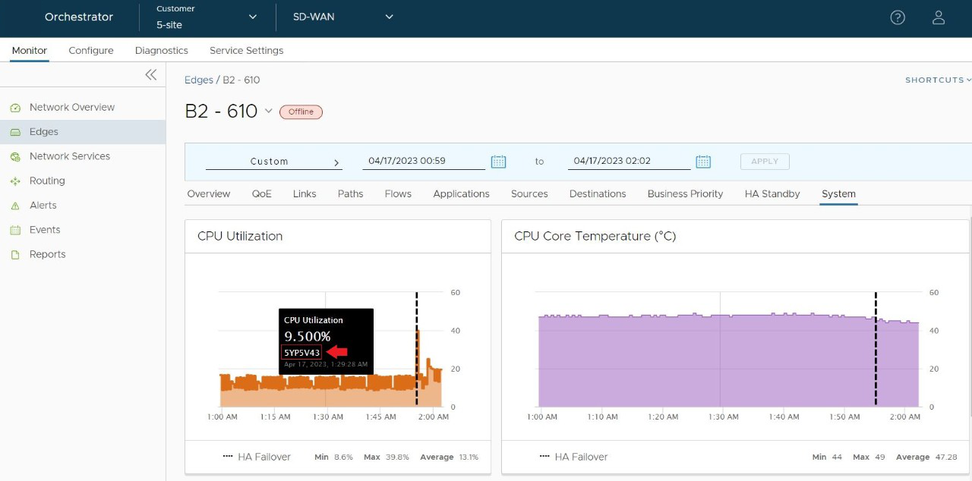
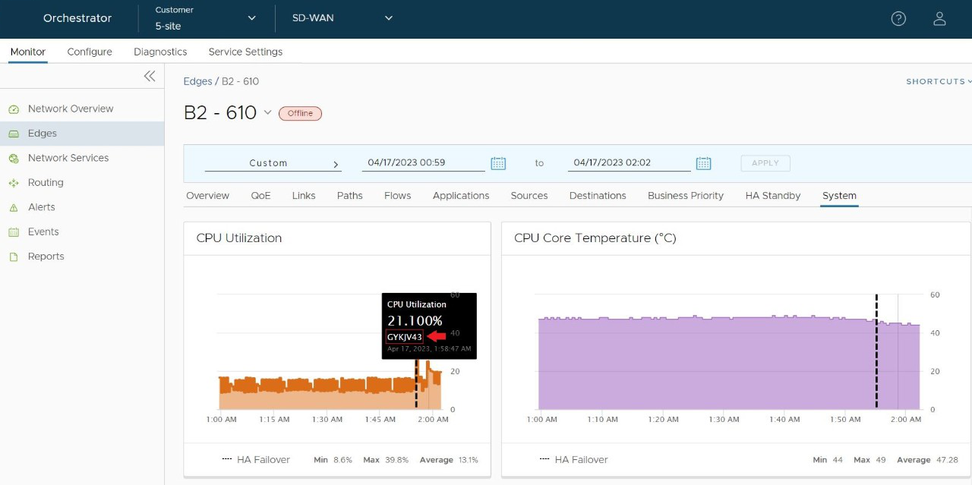
- If users select on the graph to the left side of the failover bar, the Orchestrator indicates the Active Edge at the time of those statistics.
- If users select on the graph to the right side of the failover bar, the Orchestrator indicates the Active Edge for the post-failover statistics. This helps determine which Edge applies to the System values.
- The HA Standby screen also provides live WAN Interface information which is especially helpful in Enhanced HA deployments where the Standby Edge is using unique WAN links.
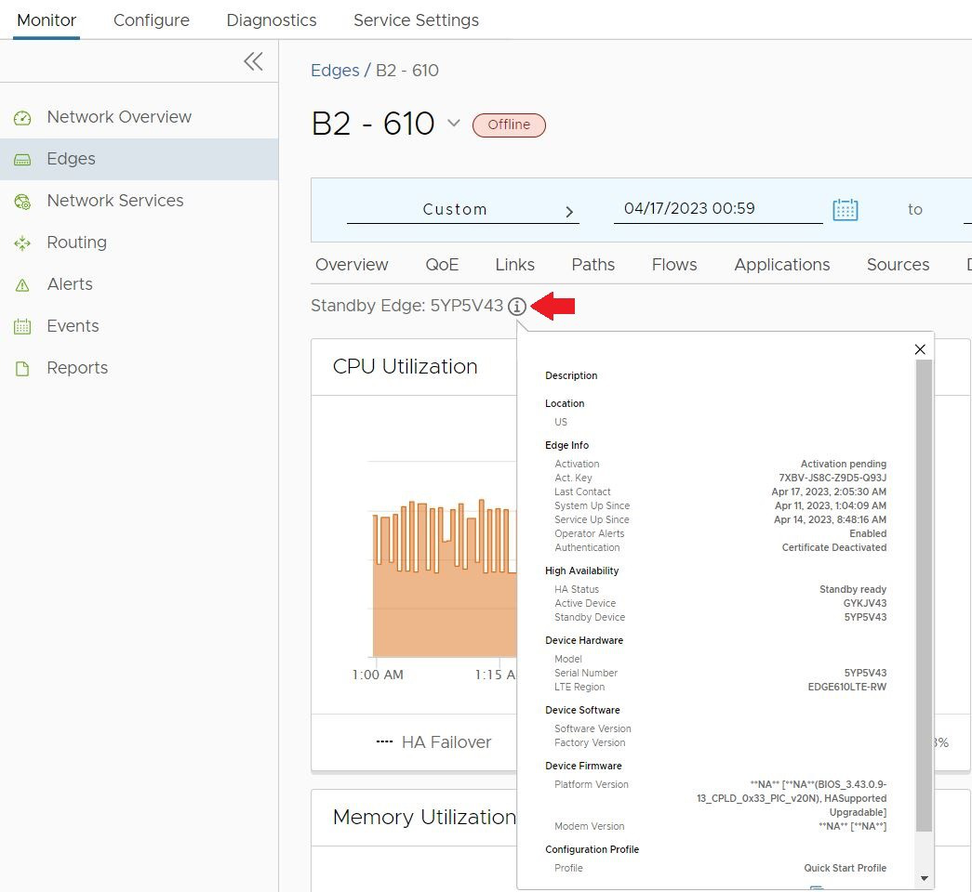
- Select Information to receive Standby Edge information at the same level as a user sees on the tab, for the Active Edge.
- To view the interface export details, select Interface.
High Availability Specific Information on the Overview Tab
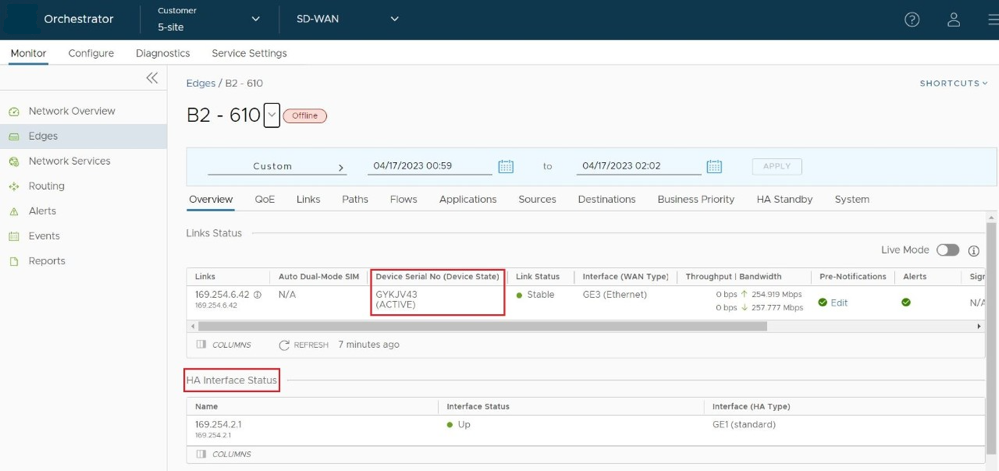
- In the Link Status section, each connected WAN link includes a column Device Serial No (Device State) that includes the Edge serial number associated with that WAN link and the HA status of the Edge as Active or Standby. This information becomes valuable in Enhanced HA deployments where WAN links uniquely associate with different HA Edges and allows users to see the status of WAN links on the Standby Edge just as users see them on the Active Edge.
- The Overview tab adds an HA Interface Status section which includes the IP Address, Interface Status as Up or Down, and Interface as HA Type.
Network Interface Statistics Monitoring
Beginning with the 6.4.0 release, users can view both real time and historical interface statistics data, on the screen of the Orchestrator. This feature allows users to monitor data at the interface level.
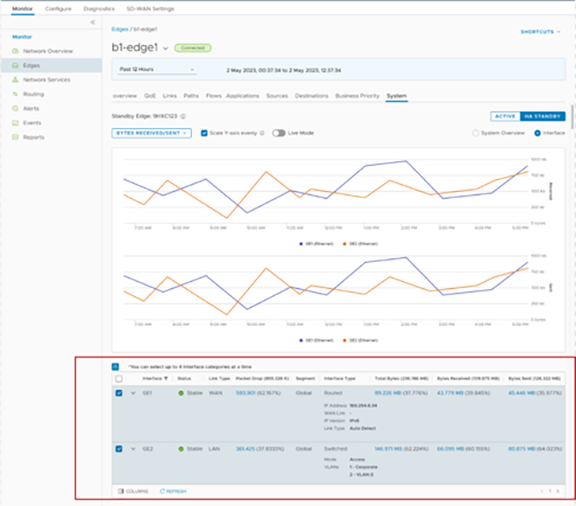
- Non-Live Mode:
- The non-live mode activates by default.
- Displays historical stats of an interface. View all of the previously captured data.
- Both Active and HA Standby Edges support this mode.
- Live Mode:
- To view real time interface stats, enable Live Mode.
- Only Active Edges support Live Mode.
The table displays the following information:
| Option | Description | ||||||||
|---|---|---|---|---|---|---|---|---|---|
| Interface | Displays the interface name GE, Loopback and SFPs. | ||||||||
| Status | Displays the status of the interface. | ||||||||
| Link Type | Displays the type of the link, for example, LAN, WAN, or HA. | ||||||||
| Packet Drop | Displays the packet drop details. | ||||||||
| Segment | Displays the segment name. | ||||||||
| Interface Type | Displays the interface type, and the corresponding details.
|
||||||||
| Total Bytes | Displays the total number of bytes. | ||||||||
| Bytes Received | Displays the number of bytes received. | ||||||||
| Bytes Sent | Displays the number of bytes sent. | ||||||||
| Packets Received | Displays the number of packets received. | ||||||||
| Packets Sent | Displays the number of packets sent. | ||||||||
| Packet Errors | Displays the packet errors. |
Select Columns to hide or view the required columns. Users can also select the columns using the menu at the top left of the screen.
Select Refresh to view the latest data.
Monitor High Availability Edges
The Orchestrator includes special monitoring for a site deployed with a High Availability topology.
Overview
- In the SD-WAN service of the Enterprise portal, the tab includes two HA specific improvements:
- WAN link information includes the serial number of an HA Edge link association which is especially important with Enhanced HA deployments.
- HA Interface Status.
- HA specific failover bars on the tab denoting when an HA Edge site failed over.
- A new tab for Standby Edge monitoring information.
High Availability Specific Information
In the SD-WAN service of the Enterprise portal, when users navigate to the tab, a site deployed in High Availability displays additional information specific to an HA deployment: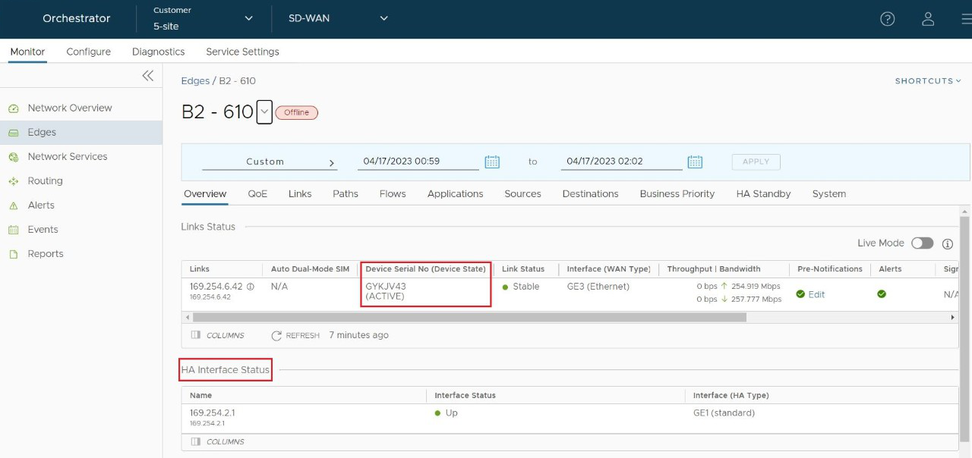
- In the Link Status section, each connected WAN link includes a column, Device Serial No (Device State) that includes the Edge serial number associated with that WAN link and the HA status of that Edge (Active or Standby). This information becomes helpful for Enhanced HA deployments where WAN links uniquely associate to different HA Edges and allows users to see the status of WAN links on the Standby Edge just as users see them on the Active Edge.
- The Overview tab adds an HA Interface Status section which includes the IP Address, Interface Status (Up or Down), and Interface (HA Type).
High Availability Failover Bars
In the SD-WAN service of the Enterprise portal, when users navigate to the tab, a site deployed in High Availability has additional functionality when a HA failover has occurred. When an HA failover occurs, the Orchestrator renders a vertical bar marking the point of the failover.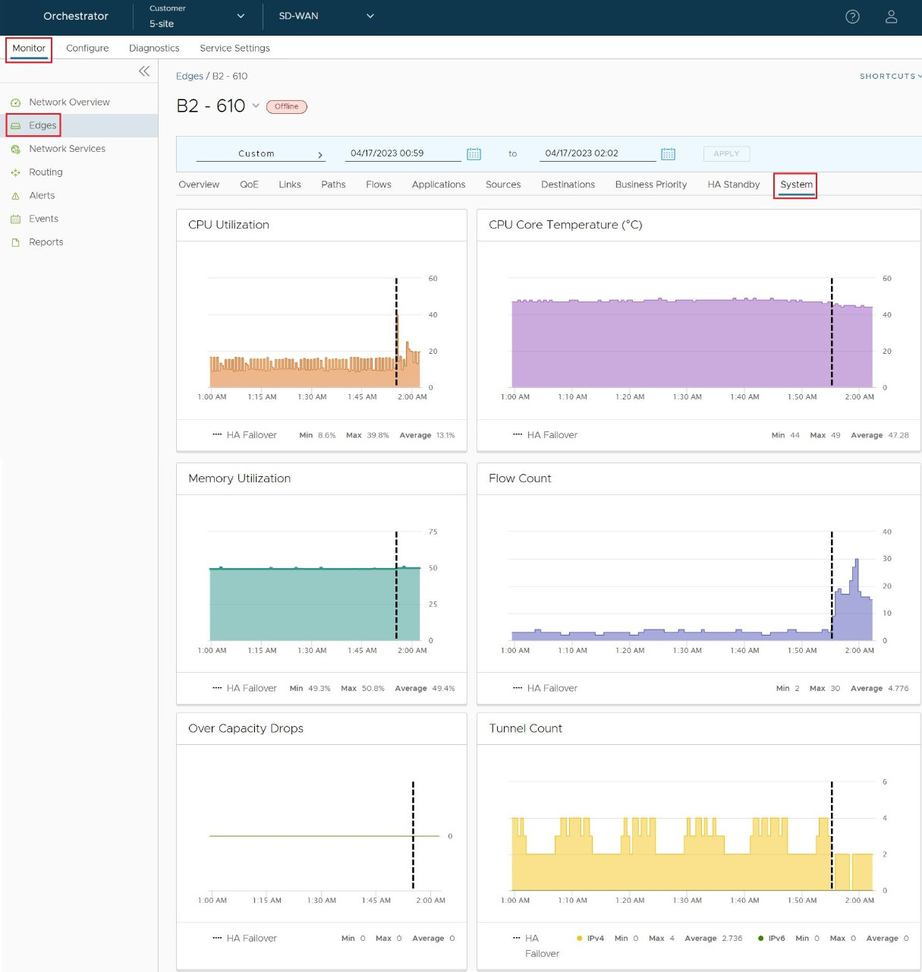
HA Standby Tab
Users can now view the System Health statistics for the HA Edge when serving as a standby role by clicking on the tab. This page also includes a failover bar indicating when an HA site has triggered a failover and a different Edge has the role of Standby.
Monitor Network Services
View the details of configured network services for an enterprise.
To view the details of network services, log in to the SD-WAN service of the Enterprise portal, then select .
Monitor Non SD-WAN Destinations through Gateway
View the configured Non SD-WAN Destinations along with the VPN Gateways, Site Subnets, and other configuration details.
To view the configured Non SD-WAN Destinations, in the SD-WAN service of the Enterprise portal, select to display Non SD-WAN Destinations via Gateway and review the details of configured Non SD-WAN Destinations.
To configure Non SD-WAN Destinations via Gateway, see Configure Non SD-WAN Destinations via Gateway.
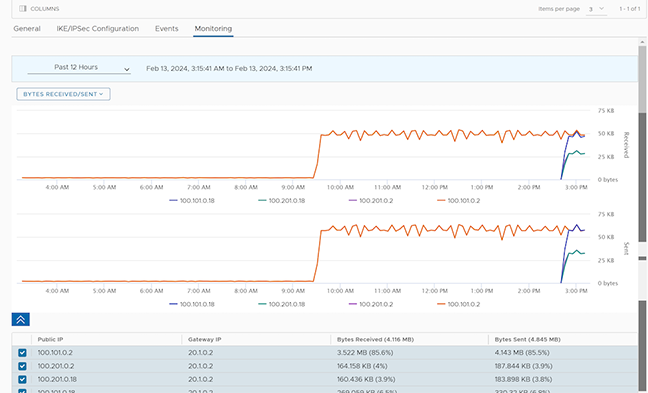
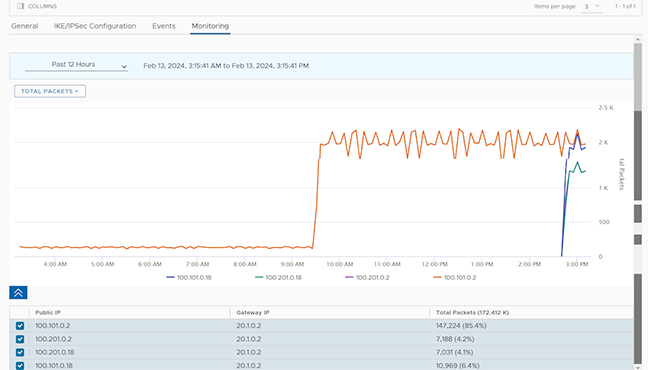
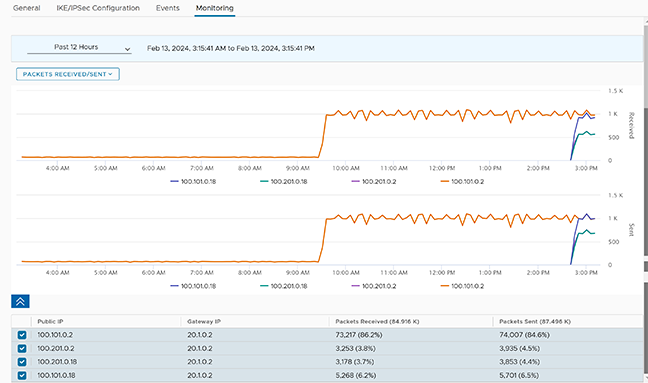
Graphical Monitoring Options
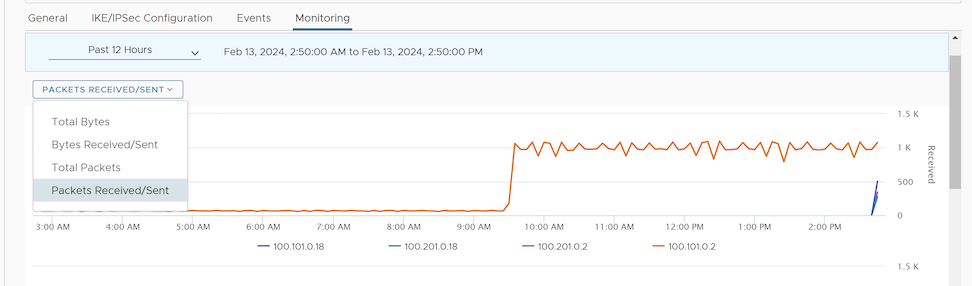
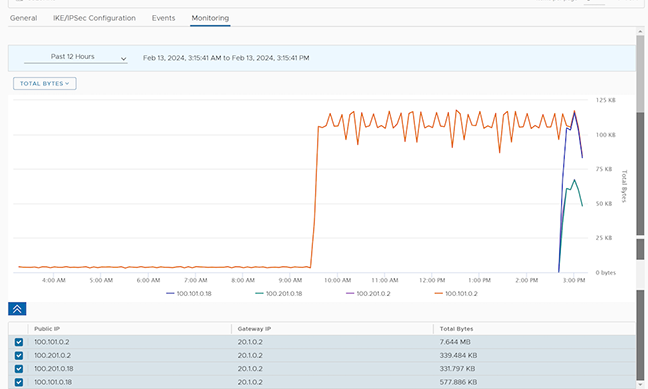
- Total Bytes
- Bytes Received and Sent
- Total Packets
- Total Packets Received and Sent
- SD-WAN Destination Name
- Public IP Address
- SD-WAN Destination Status
- Tunnel Status
- Profiles and Edges Names using the Non SD-WAN Destination
- Last contacted date and time
Sort the report by selecting the header of each column or use Filter to sort the details by specific Name, IP Address, or Status.
Select a Non SD-WAN Destination to view the following details:
| Options | Description |
|---|---|
| General | Displays the Name, Type, IP address and tunnel settings of Primary and Secondary VPN Gateways, location details, and Site subnet details. |
| IKE/IPsec Configuration | View a sample configuration template for Primary and Secondary VPN Gateways. Users can copy the template and customize the settings to meet their requirements. |
| Events | View the events related to the selected Non SD-WAN Destination. Select the arrow displayed in the first column to view more details of an event. |
| Monitoring | View the NSD tunnels display statistics in both table and chart format of the Bytes, Packets Sent and Received. |
Monitor Non SD-WAN Destinations through an Edge
View the configured Non SD-WAN Destinations along with the VPN Gateways, Site Subnets, and other configuration details.
To view the configured Non SD-WAN Destinations, in the SD-WAN service of the Enterprise portal, select to display Non SD-WAN Destinations via Edge and review the details of configured Non SD-WAN Destinations.
To configure Non SD-WAN Destinations via Edge, see Configure Non SD-WAN Destinations via Edge.
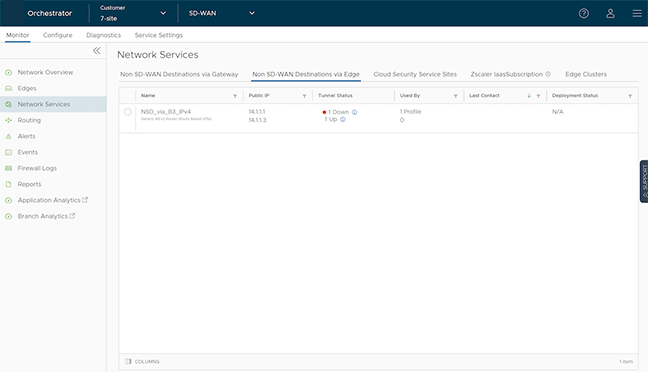
- SD-WAN Destination Name
- Public IP Address
- SD-WAN Destination Status
- Tunnel Status
- Profiles and Edges Names using the Non SD-WAN Destination
- Last contacted date and time
Sort the report by selecting on the header of each column or use Filter to sort the details by specific Name, IP Address, or Status.
Selecting a Non SD-WAN Destination displays Name, Type, IP address and tunnel settings of Primary and Secondary VPN Gateways, location details, and Site subnet details under General.
Monitor Cloud Security Service Sites
View the details of Cloud Security Services (CSS) configured for the Enterprise.
To view the configured Cloud Security Services, in the SD-WAN service of the Enterprise portal, select to display Cloud Security Service Sites and review the details of configured Cloud Security Service Sites.
To configure a new Cloud Security Service, see Configure a Cloud Security Service.
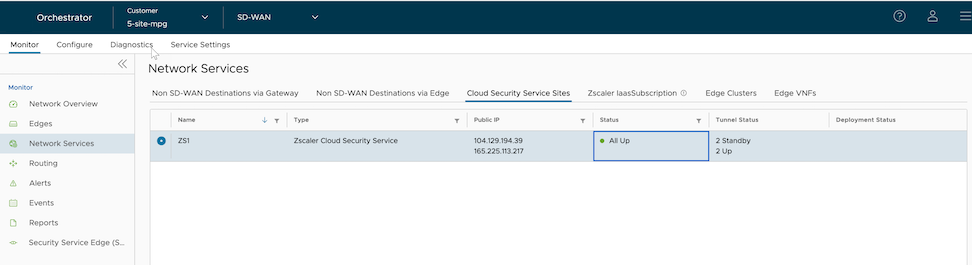
The page displays the following details:
| Column Name | Description |
|---|---|
| Name | CSS service provider name |
| Type | CSS service provider type |
| Public IP | CSS service provider IP address |
| Status | CSS service provider overall status |
| Tunnel Status | Status of tunnels created from the CSS provider from different Edges. Also, status of the external service as recorded by each Edge. |
| Deployment Status | CSS service provider deployment status |
Users can also sort the report by selecting the header of each column. Use Filter to filter the details by specific Name, Type, IP address, or Status.
Select View under Deployment Status to view the deployment status of the CSS provider.
- L7 health check status data only available through the API.
- To view related tunnel state change events, navigate to and filter by CSS tunnel events.
Monitor Zscaler IaaSSubscription
To view the Zscaler IaaSSubscription, in the SD-WAN service of the Enterprise portal, select . To configure a new IaaS subscription, see Configure API Credentials.
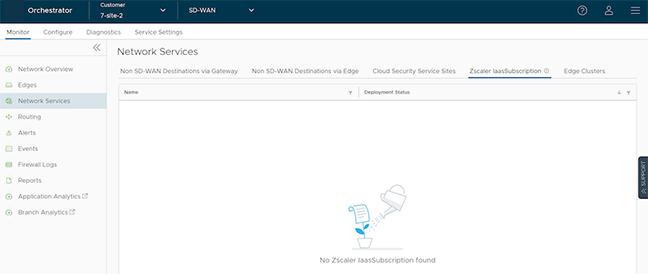
The page displays the name of the service along with the deployment status.
Monitor Edge Clusters
To view Edge Clusters, in the SD-WAN service of the Enterprise portal, select .
The Edge Clusters pages displays details of configured Edge Clusters.

The page displays the following details:
| Option | Description |
|---|---|
| Cluster Name | Name of the Cluster as configured under . |
| Edges | Name of the Hub Edges in this Cluster. |
| CPU Utilization | Percentage value of CPU utilization of the corresponding Edge. |
| Memory Utilization | Percentage value of memory utilization in the corresponding Edge. |
| # Tunnels | Number of tunnels associated with the Hub Edge in the Cluster. |
| Flow Count | Number of flows associated with the Hub Edge in the Cluster. |
| # Handoff Queue Drops | Number of packets dropped when they exceed the capacity of Hub Edge in the Cluster. |
Monitor Edge VNFs
To view Edge VNFs, in the SD-WAN service of the Enterprise portal, select .
The Edge VNFs pages displays details of configured Edge VNFs.
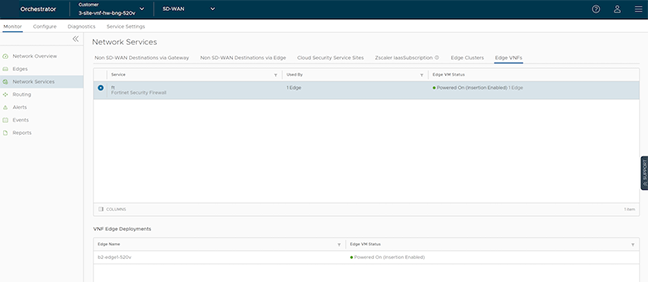
- VNF Service Name
- Number of Edges using the VNF
- Edge VM Status
Select a VNF to view the corresponding VNF Edge deployment details.
Monitor Routing Details
Users can view the routing services configured in the Enterprise.
Monitor Multicast Groups
View the multicast groups configured for the Enterprise.
In the SD-WAN service of the Enterprise portal, select to display Multicast Groups.
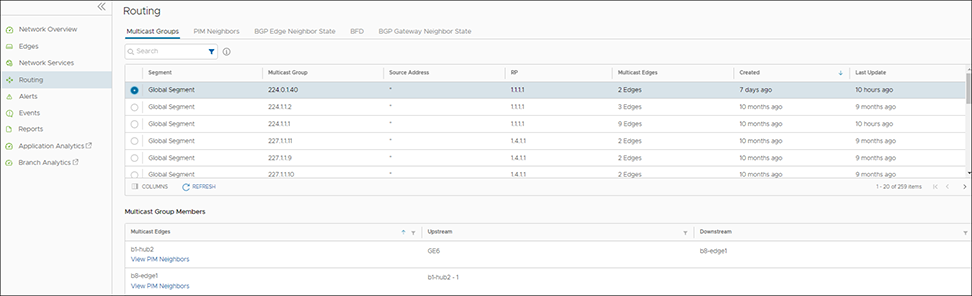
The page displays the following details: multicast group address, segment with the multicast group, Source IP address, RP address, number of Edges in the multicast group, created time period, and the last updated time period.
Select a multicast group to view the details of the Edges in the group, along with the upstream and downstream information. Select View PIM Neighbors to view the detail of the PIM neighbors connected to a specific Edge.
Monitor PIM Neighbors
Users can view the details of Edges and the PIM neighbors available in the multicast groups.
In the SD-WAN service of the Enterprise portal, select .
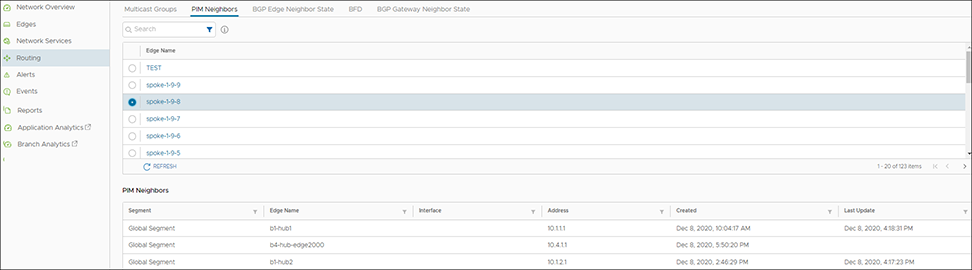
Select an Edge to view the PIM neighbors connected to the Edge. The PIM Neighbors section displays the following details: Segment of the multicast group, Edge name, Interface details, IP address of the neighbor, created and last updated date with time.
Monitor BGP Edge Neighbor State
View the details BGP neighbors connected to Edges.
In the SD-WAN service of the Enterprise portal, select .
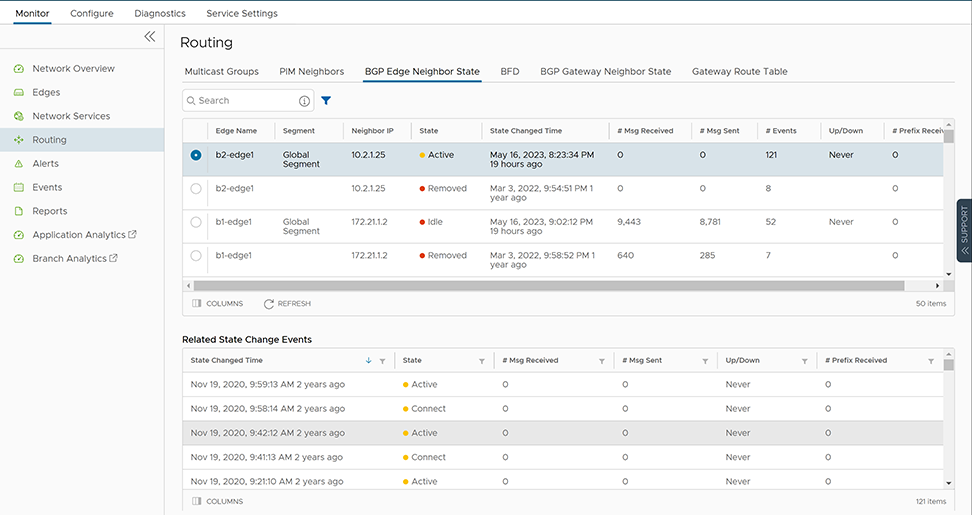
The page displays the following details: Edge name, IPv4 and IPv6 address of the neighbor, State of the neighbor, Date and time of the state change, number of messages received and sent, number of Events, duration the BGP neighbor has the status, Up/Down, and number of prefixes received.
- Users can select the Filter Icon next to the Search option to filter the details by Edge Name, Neighbor IP, Neighbor IP Type, and Status.
- BGP Edge Neighbor State (API -
monitoring/getEnterpriseEdgeBgpPeerStatus) - At the time of calling the API, if the Edge state has the status,OFFLINE, then the neighbor state displays Unavailable with appropriate tooltip showing the current Edge state to the user.
Monitor BFD
Users can view the BFD sessions on Edges and Gateways.
In the SD-WAN service of the Enterprise portal, select .
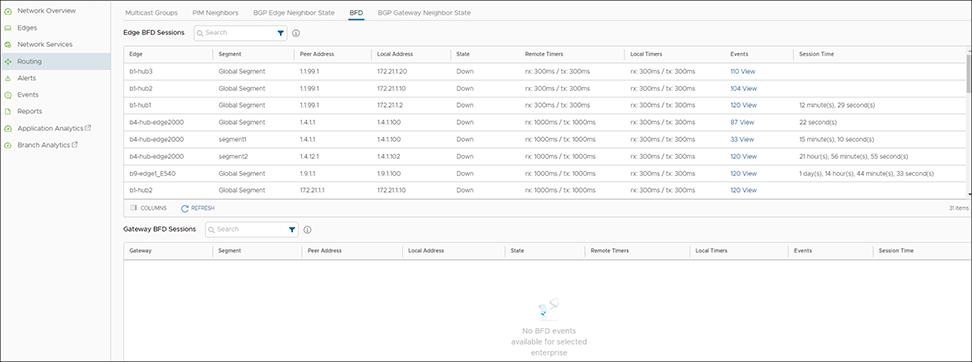
The page displays the following details for the Edges and Gateways: Name of the Edge or Gateway, Segment name, Peer IP address, Local IP address, State of the BFD session, Remote and Local timers, number of Events, and duration of the BFD session.
Select the link to an event number to view the details of the events.
Monitor BGP Gateway Neighbor State
Users can view the details of the BGP neighbors connected to Gateways.
- In the SD-WAN service of the Enterprise portal, select .
- Select a Gateway name to view the corresponding event details. The Related State Change Events section displays the change in the state and other details for the selected Gateway.
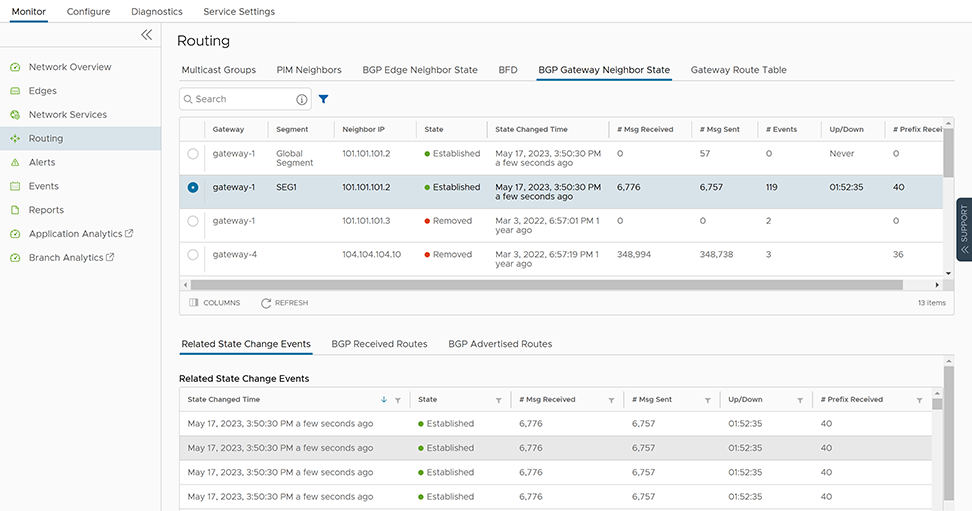
monitoring/getEnterpriseBgpPeerStatus): At the time of calling the API, if the Gateway state isQUIESCED, OUT_OF_SERVICE, or OFFLINE, then the user interface displays the Neighbor state as Unavailable with appropriate tooltip displaying the current Gateway state to the user.BGP Received Routes and BGP Advertised Routes
The BGP Received Routes displays routes, up to 16K, received from the selected BGP neighbor at the Gateway, providing valuable insight into the routing information available in the network. This information can be used to troubleshoot connectivity issues in Customer deployments. The BGP Advertised Routes displays all routes advertised to a selected BGP neighbor, providing visibility into the routes used to reach destinations in the network.
| Status Code | Displays the status code of the BGP route, as follows:
|
| Network Prefix/Mask | Displays the prefix carried by the BGP route. |
| Next Hop | Displays the Next-hop IP address used by BGP to reach the BGP prefix. |
| Metric | Displays the MED (multi-exit discriminator) value associated with a route. |
| Local Preference | Displays the local preference value assigned by a BGP router to a route. |
| Weight | Displays the weight value assigned by the BGP router to a route. |
| AS Path | Displays the list of AS Path numbers that are carried by the BGP route. |
| Community | Displays the community attribute carried by the BGP route. |
| CSV | Select the CSV button to export the data to an Excel sheet. |
Monitor Gateway Route Table
The Gateway Route Table provides a comprehensive view of routing information on an SD-WAN Gateway. It displays the routes (up to 16k) known to a Gateway, including both learned routes and statically configured routes.
The 5.2 release introduces the Gateway Route Table, which displays important information about each route, such as the Network Prefix and Mask Preference, Flags, and Metric, to name a few. The Gateway Route Table is updated in real-time, providing an up-to-date view of the routing information on a Gateway to diagnose routing issues and to optimize routing policies.
To access the Gateway Route Table:
In the SD-WAN service of the Enterprise portal, select , as shown in the following image.
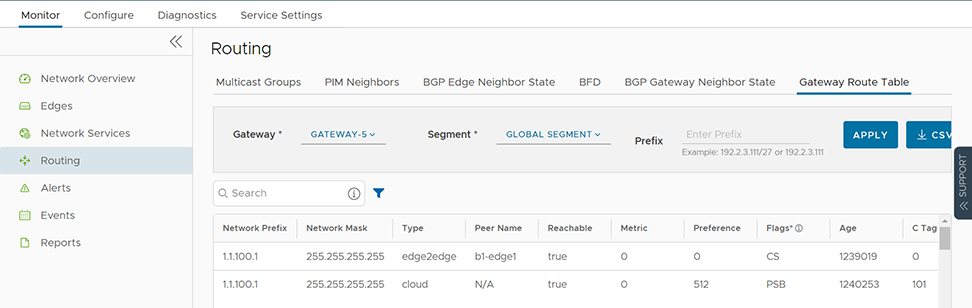
See the following table for a description of the fields in the Gateway Route Table.
| Field | Description |
|---|---|
| Network Prefix | The destination address of the route. It specifies the network to which the route applies. |
| Network Mask | Displays the prefix carried by the BGP route. |
| Type | Indicates the type of routes:
|
| Peer Name | Indicates the name of the BGP peer that learned the route. |
| Reachable | Indicates whether the route is reachable or not. If the route is reachable, it can be used for forwarding packets. |
| Metric | A value that represents the cost of using a particular route. Lower values indicate a lower cost. |
| Preference | A value that is used to influence the preferred path for outbound traffic. A lower value indicates a more preferred route. |
| Flags | Flags are listed below:
|
| Age | Indicates the amount of time that has elapsed since the route was last updated. |
| C Tag | Use to identify the customer that the route belongs to in a multi-tenant environment. |
| CSV | Select the CSV button to export the data to an Excel sheet. |
Monitor Alerts
Orchestrator allows the configuration of alerts that notify the Enterprise Administrators or other support users whenever an event occurs.
Ensure that users have configured the relevant alerts, along with the notification delay, in . See Configure Alerts and Notifications.
In the SD-WAN service of the Enterprise portal, select .
The Alerts window displays the alerts received for different types of events:
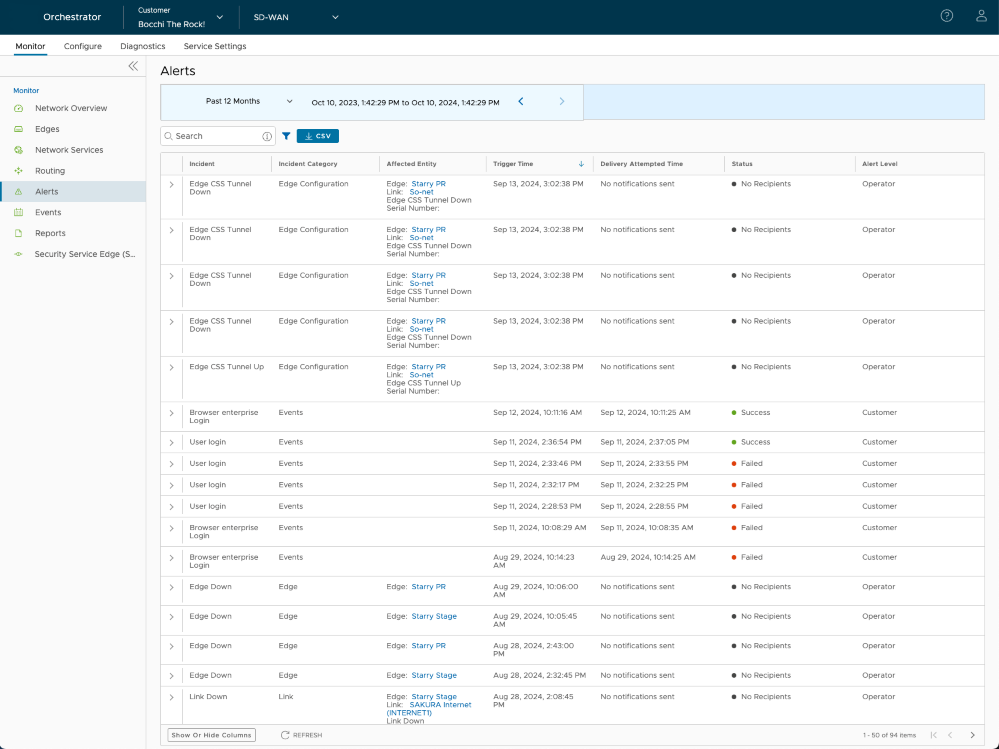
Select a specific time period from the drop-down menu to view alerts for the specified duration.
Select the Filter icon in the Search option to define the filter criteria to view details of specific alerts.
Select the CSV option to download a report of the Alerts in CSV format. Users can also select to include the Operator alerts.
The Alerts window displays the following details:
| Option | Description |
|---|---|
| Incident | The name of the event that triggered the alert. |
| Incident Category | The category of the incident. |
| Affected Entity | The entities (Edge/Link) affected by the incident. |
| Trigger Time | Time at which the alert got triggered. |
| Delivery Attempted Time | Time at which the operator or customer received the alert notification. The notification time depends on the delay time configured in the Alerts & Notifications page. |
| Status | Status of the alert as Success, Failed, or No Recipients. |
| Alert Level | Indicates whether the Operator or the Customer receives the alert. |
Monitor Events
The Events page displays the events generated by the Orchestrator. These events help to determine the operational status of the system.
In the SD-WAN service of the Enterprise portal, select .
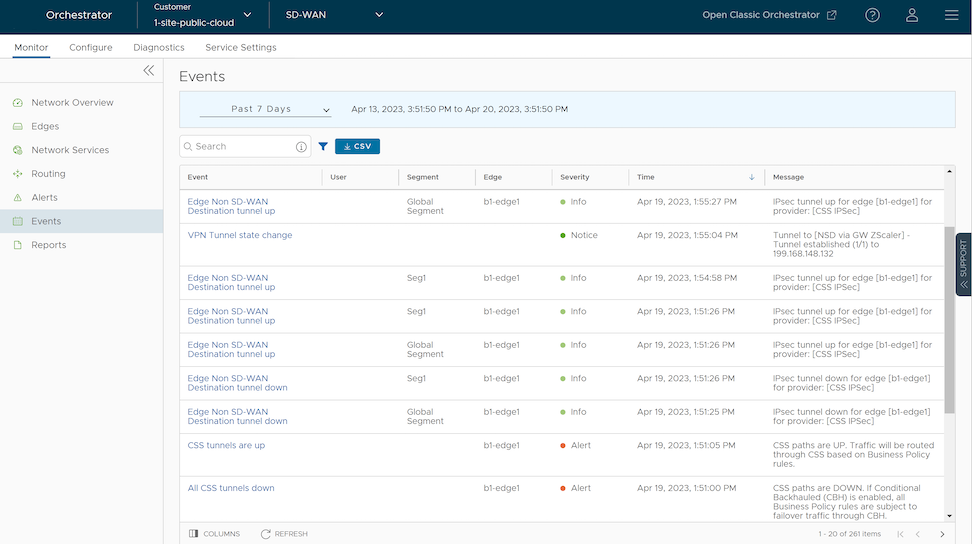
Select a specific time period from the list to view the events for the selected duration. Select an event name to view more details.
To view details related to specific events, users can select Filter in the Search option and define the filter criteria.
Select the CSV option to download a report of the events in CSV format.
The Events window displays the following details:
| Option | Description |
|---|---|
| Event | Name of the event |
| User | Name of the user for events that involve the user. |
| Segment | Name of the segment for segment related events. |
| Edge | Name of the Edge for Edge related events. |
| Severity | Severity of the event. The available options are: Alert, Critical, Debug, Emergency, Error, Info, Notice, and Warning. |
| Time | Date and time of the event. |
| Message | A brief description of the event. |
Auto Rollback to the Last Known Good Configuration
If an Administrator changes a device configuration that causes the Edge to disconnect from the Orchestrator, the Administrator receives an Edge Down alert. After the Edge detects that it cannot reach the Orchestrator, it will roll back to the last known configuration and generate an event on the Orchestrator Bad Configuration.
The rollback time, which is the time necessary to detect a bad configuration and apply the previous known “good” configuration for a standalone Edge, is between 5 and 6 minutes. For High-Availability (HA) Edges, the rollback time is between 10 and 12 minutes.
Platform Firmware Upgrade Progress
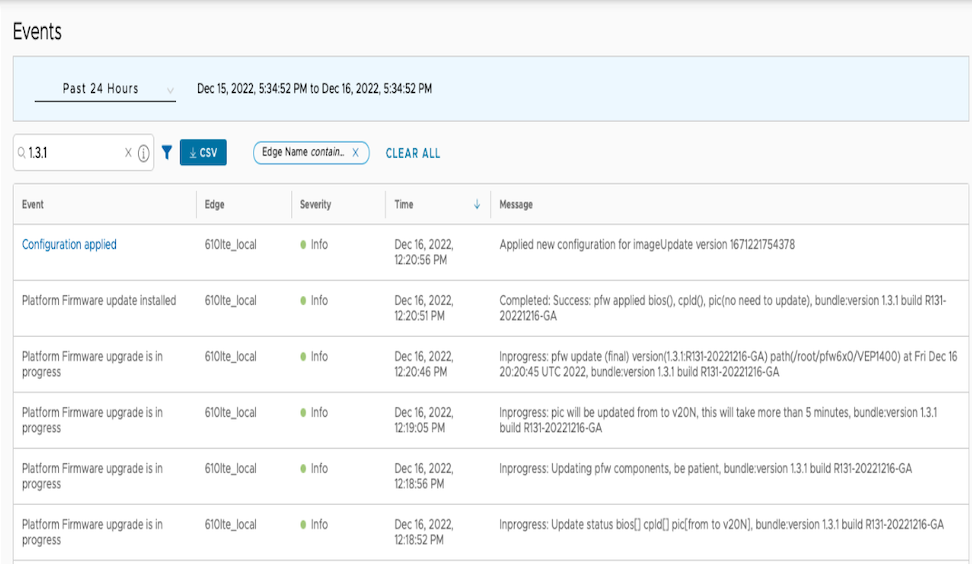
To view the progress for the Platform Firmware upgrade on the Orchestrator UI, go to . The Events page displays a list of events and shows the status of the Platform Firmware upgrade as 'In Progress' or 'Installed'.
Monitor Firewall Logs
The Firewall Logs page displays the details of firewall logs originating from VeloCloud Edges. Previously, users could only store and view firewall logs. The Firewall Logs page displays the details of firewall logs originating from VeloCloud Edges. Previously, users could only store and view firewall logs by forwarding them to a Syslog server. With Release 5.2.0, users can store firewall logs on the Orchestrator, where users can view, sort, and search for them. By default, Edges cannot send firewall logs to Orchestrator. To enable Edge to send Firewall logs to Orchestrator, ensure that users activate the 'Enable Firewall Logging to Orchestrator' capability at the Customer level under Global Settings. By default, Orchestrator retains firewall logs until they reach the maximum retention time of 7 days or a maximum log size of 15 GB per customer tenant, on a rotation basis.
The firewall generates logs under the following conditions:
- The configuration accepts a new flow during creation.
- The system closes a flow.
- The firewall denies a new flow.
- A firewall configuration change updates an existing flow.
- If a firewall rule has URL Categories filtering service activated, the URL Category engine looks up the categories of destination URLs. It detects if that matches the Blocked or Monitor categories configured. If the URL matches the Blocked categories, the URL Categories engine generates an alert and blocks the Edge traffic. If the URL matches the Monitor categories, the engine allows the Edge traffic and captures the firewall logs.
- If a firewall rule has URL Reputation filtering service activated, the URL Reputation engine looks up the reputation score of the URL. It takes action (Allow/Block) based on the minimum reputation configured. If the reputation score of the URL is less than the minimum reputation configured, the Edge blocks the traffic and generates EFS alerts and logs; otherwise, it allows the traffic. The URL Reputation engine generates EFS logs for the allowed traffic based on the Capture Logs configuration.
- If a firewall rule has Malicious IP filtering service activated, the Malicious IP engine checks if the destination IP is present in the Malicious IP Database (Network Query dB and Local dB). If the engine detects the destination IP in the Malicious IP database, then the engine generates EFS alerts and logs and takes Edge traffic decisions based on the configured action (Block/Monitor).
- If a firewall rule has only Intrusion Detection System (IDS) activated, the Edges detect if the traffic flow is malicious or not based on certain signatures configured in the engine. If an attack is detected, the EFS engine generates an alert and sends the alert message to Orchestrator/Syslog Server
- If a firewall rule has Intrusion Prevention System (IPS) activated, the Edges detect if the traffic flow is malicious or not based on certain signatures configured in the engine. If the EFS engine detects an attack, it generates an alert and blocks traffic to the client only if the signature rule specifies a "Reject" action and the engine matches the malicious traffic. If the signature rule specifies an "Alert" action, the engine allows the traffic without dropping packets, even when users configure IPS.
View Edge Firewall Logs
- In the SD-WAN service of the Enterprise portal, navigate to to display the Firewall Logs.
When a user activates the Stateful Firewall and Enhanced Firewall Services (EFS) features, the firewall logs report more information. The following list describes all parameters that the firewall logs report.
Figure 63. View Edge Firewall Logs 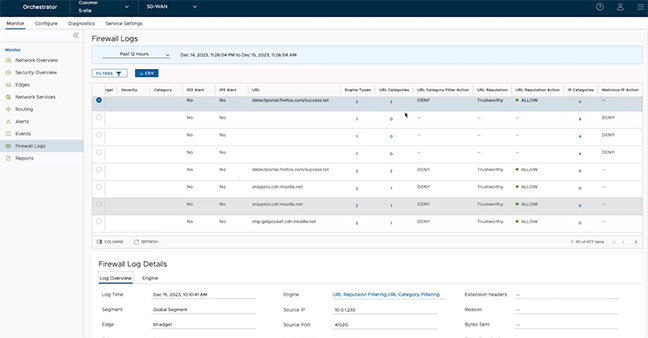
Table 22. Edge Firewall Logs Field Descriptions Field Descriptions Time The timestamp of the traffic flow session that triggered the alert. Segment The name of the segment to which the session belongs. Edge The name of the Edge to which the session belongs. Action Any of the following actions triggered against the event/alert: - Allow
- Close
- Deny
- Open
- Update
Interface The name of the interface that received the first packet of the session. In the case of received overlay packets, this field will contain the Virtual Private Network (VPN). For any other packets (received through the underlay), this field displays the name of the interface in the Edge. Protocol The type of IP protocol used by the session. The possible values are TCP, UDP, GRE, ESP, and ICMP. Source IP The source IP address of the traffic flow session that triggered the alert. Source Port The source port number of the traffic flow session that triggered the alert. Destination IP The Destination IP address of the traffic flow session that triggered the alert. Destination Port The Destination port number of the traffic flow session that triggered the alert. Extension Headers The extension headers of the traffic flow packet. Rule The Rule to which the Signature belongs. Reason The reason for closure or denial of the session. This field is available for Close and Deny log messages. Bytes Sent The amount of data sent in bytes in the session. This field is available only for Close log messages. Bytes Received The amount of data received in bytes in the session. This field is available only for Close log messages. Duration The duration for which the session has been active. This field is available only for Close log messages. Application The name of the application is what the DPI Engine classified for the session. This field is available only for Close log messages. Destination Domain The destination domain of the traffic flow session. Destination Name The name of the destination device of the traffic flow session. Session ID The Session ID of the traffic flow that triggered the alert. Signature ID A unique ID of the Signature rule. Signature The Signature the Edge currently runs. Attack Source The Source of the attack. Attack Target The Target of the attack. Severity The severity of the intrusion. Category The category type to which the intrusion belongs. IDS Alert Displays "Yes" if an alert notification is received from the Intrusion Detection System (IDS) engine, or "No" otherwise. IPS Alert Displays "Yes" if an alert notification is received from the Intrusion Prevention System (IPS) engine, or "No" otherwise. URL The destination URL that received the traffic flow. Engine Types Total count of Engine types that match the flow. Select the link in this column to view the Engine types that match the flow. URL Categories Total count of URL category types that match the flow. Select the link in this column to view the URL categories that match the flow. URL Category Filter Action The URL Category Engine-specific filtering action: - Block
- Monitor
URL Reputation The URL Reputation type that the policy rule defines. URL Reputation Action The URL Reputation Engine-specific filtering action: - Block
- Monitor
IP Categories Total count of threat types that match the flow. Select the link in this column to view the IP categories that match the flow. Malicious IP Action The Malicious IP Engine-specific filtering action: - Block
- Monitor
Note: The system does not populate all fields for every firewall log. For example, the system includes fields such as Reason, Bytes Received/Sent, and Duration only when it closes a session. Similarly, the system populates EFS-specific fields such as Signature ID, Signature, Attack Source, Attack Target, Severity, Category, IDS Alert, IPS Alert, URL, Engine Types, URL Categories, URL Category Filter Action, URL Reputation, URL Reputation Action, IP Categories, and Malicious IP Action only for EFS alerts rather than standard firewall logs. - To view more detailed information about a specific Firewall log, select the Firewall log entry. Under the Firewall Log Details section, users can view the detailed log overview and engine information for the selected log entry.
Note: The Engine tab remains unavailable if an engine other than Enhanced Security Services generates the selected firewall log entry.
Figure 64. View Edge Firewall Log Details 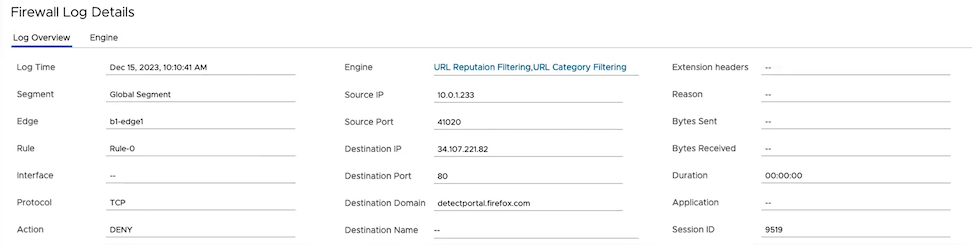
- On the Log Overview tab, select the link next to Engine to view detailed information about the specific Engine that matched the flow, along with the Engine-specific filtering action.
Figure 65. View Edge Firewall Log Engine Details 
Troubleshoot Firewall Logs
To collect the firewall diagnostic logs, run the remote diagnostic tests on an Edge.
- Flush Firewall Sessions - Run this test on the required Edge by providing the Source and Destination IP addresses to flush the active firewall sessions users need to reset. This test is specifically for the Stateful Firewall. Running this test on an Edge not only flushes the firewall sessions, but actively sends a TCP RST for the TCP-based sessions.
- List Active Firewall Sessions - Run this test to view the current state of the active firewall sessions (up to a maximum of 1000 sessions). The Orchestrator allows filtering by Source and Destination IP and Port, and Segment, to limit the number of sessions returned.
Figure 66. View Active Firewall Sessions 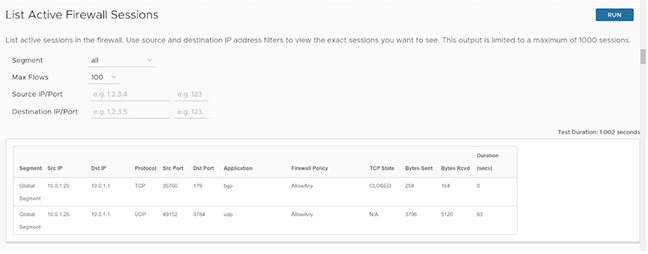 Note: Users cannot see denied sessions as they are not active sessions. To troubleshoot those sessions, check the firewall logs.
Run the following remote diagnostic tests to obtain the category and reputation score of a given URL, and the threat category of a given IP:
- Get IP Threat Reputation - Run this test on the required Edge by providing the IP address to view the threat category of the given IP.
Figure 67. Obtain IP Threat Reputation 
- Get URL Category/Reputation - Run this test on the required Edge by providing the URL to view the category and reputation score of a given URL.
Figure 68. Obtain URL Category and Reputation 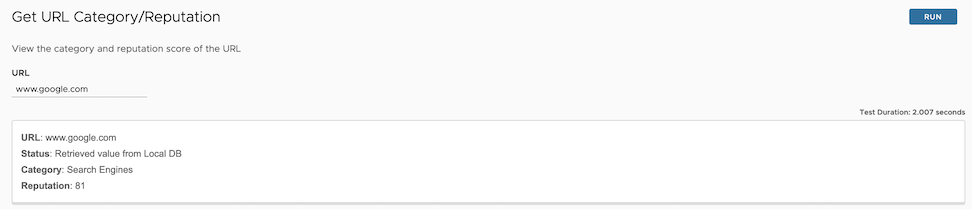
Enterprise Reports
VeloCloud SD-WAN allows users to generate exportable secure SD-WAN Enterprise reports based on historical data for selected or all Edges across the Enterprise. The Enterprise reports include Network and Security data useful for network analysis.
- Generate a Quick Report with default values, including all of the data for the past month, beginning from the time of request, and for all Edges currently present in the Enterprise network.
- Generate a Custom Report with customized settings by specifying the time range, required data, and Edges to include.
- Generate a Gen AI Traffic Report with information on Generative AI (Gen AI) applications traffic within the network of an Enterprise.
vco.reporting.maxReportsPerEnterprise.
A report has a 60 day age-out period and then automatically deletes. When users exceed the maximum report value, the oldest report deletes first.
Accessing Enterprise Reports
In the SD-WAN service of the Enterprise portal, select .
On the Reports page, users can create a new Enterprise report, customize the report, and schedule report generation for a recurring period.
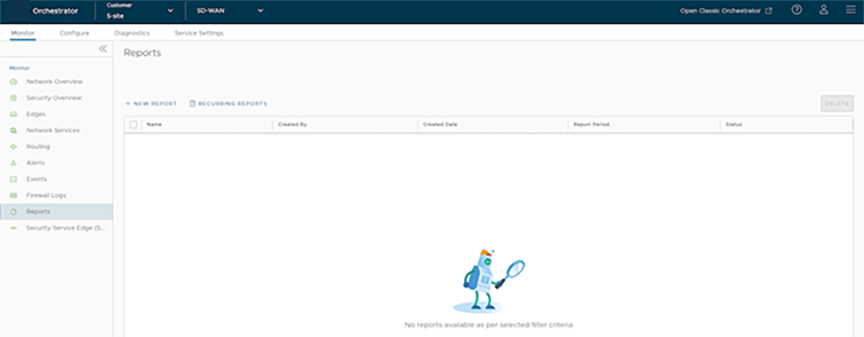
Create a Quick Enterprise Report
VeloCloud SD-WAN allows users to generate a consolidated report with default values, including all of the data for the past month beginning with the time of request, and for all Edges currently present in the Enterprise network. Note that the Quick report does not include the Gen AI Application traffic-related information.
- On the Reports page, select New Report.
Figure 70. Create a Quick Enterprise Report 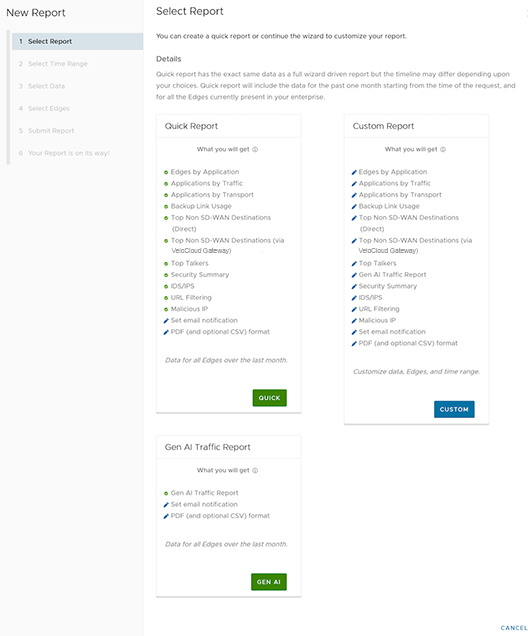
- Select Done.
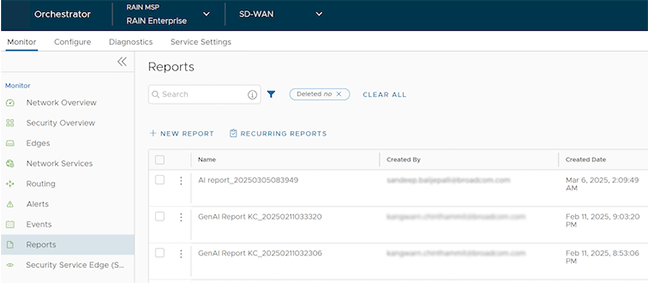
Once users submit the report, the report details display with the status in the Reports page. See Monitor Enterprise Reports.
Figure 71. View Enterprise Reports 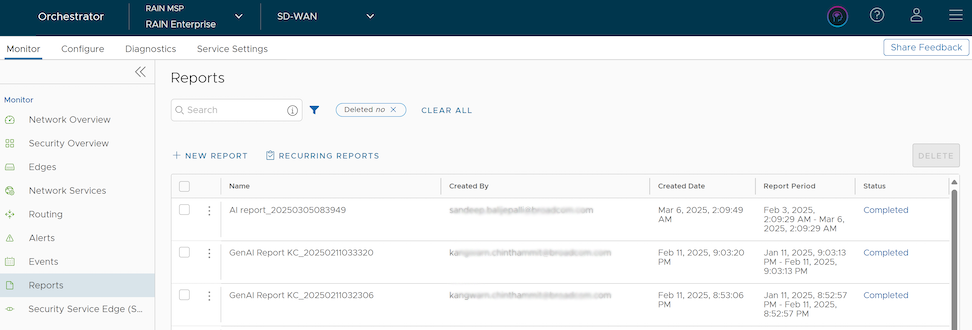
Users can generate a customized report with specific values including Gen AI Traffic data by selecting Custom. For additional information, see Create a Custom Enterprise Report.
Create a Custom Enterprise Report
Users can create an Enterprise report with customized settings by specifying the time range, required data, and Edges. Custom report generation allows users to select and include Gen AI Application traffic.
- In the SD-WAN service of the Enterprise portal, select .
- On the Reports page, select New Report.
Figure 72. Create a Custom Enterprise Report 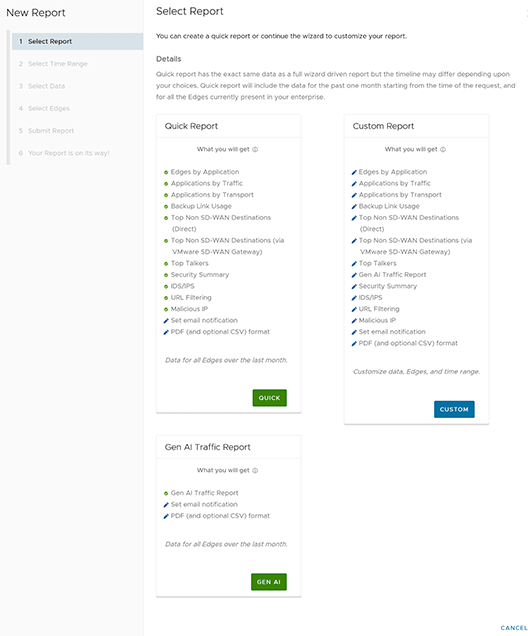
- On the Select Report page, select Custom.
Next Step:
Follow the instructions on the screen to select the configuration settings for the custom report. See Select Time Range.
Select Time Range for Report
Users can customize a report for a selected time period. In addition, users can schedule a report to run on recurring basis.
- When users choose to customize the Enterprise report and select Custom in Create a Custom Enterprise Report, Select Time Range displays.
Figure 73. Select Time Range 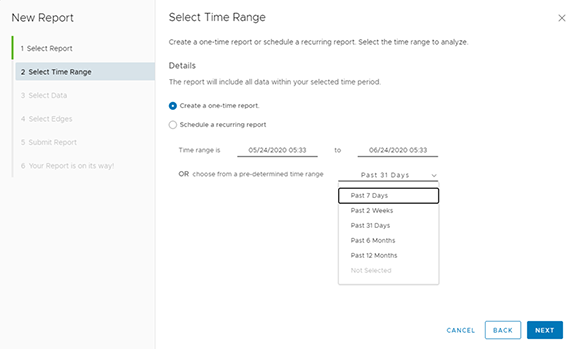
- The Create a one-time Report option is selected by default. Users can either enter the start and end date to generate the report, or choose the time range from the list.
- To configure a scheduled report, choose Schedule a recurring report and select the schedule period and time from the list.
Figure 74. Schedule a Recurring Report 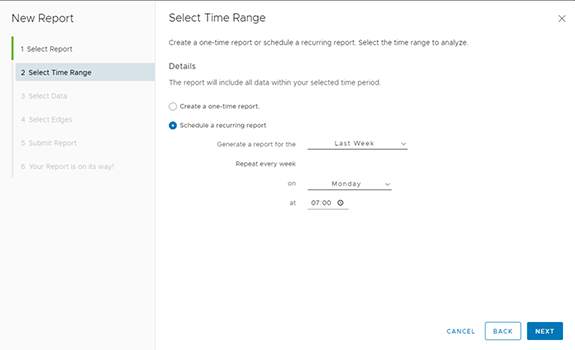
- Select Next.
Select Data for Report
Users can select the data to be included in a custom report.
- When users select Next after selecting the time range in Select Time Range, the Select Data window appears.
Figure 75. Selecting Data for Report 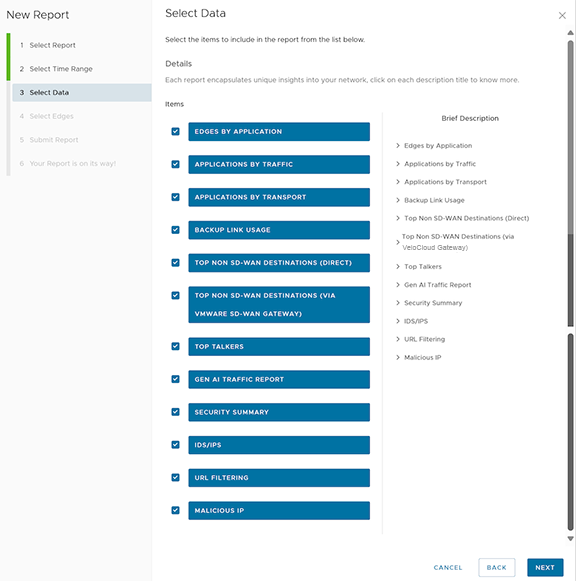
- Select the check boxes of the data items to include in the report from the following available options. By default, the report selects all of the data items.
- Edges by Application – Breakdown details of top 10 applications and the top 10 Edges using each application.
- Applications by Traffic – Breakdown details of SD-WAN consumption based on traffic distribution with top 10 applications for each traffic type.
- Applications by Transport – Breakdown details of SD-WAN consumption based on transport distribution with top 10 applications for each transport type.
- Backup Link Usage – List of top backup links based on traffic with top 5 applications for each backup link.
- Top Non SD-WAN Destinations (Direct) – List of top Non SD-WAN destinations directly from the VeloCloud Edges with top 5 Edges for each destination.
- Top Non SD-WAN Destinations (via Gateway ) – List of top Non SD-WAN destinations via VeloCloud Gateways with top 5 Edges for each destination.
- Top Talkers – List of top clients across Edges with top 5 applications for each client.
- Security Summary – Comprises of the following data collected from all Enhanced Firewall Service (EFS) engines (IDS/IPS, URL Filtering, Malicious IP):
- Total Edges – Total count of Edges in the Enterprise.
- Reporting Edges – The count of Edges that have at least one EFS engine data.
- Reporting Edges table – Displays the top 10 Edges, based on total actions across all EFS engines.
- IDS/IPS – Total count of IDS/IPS Threats Detected and Prevented for selected Edges within the Enterprise, along with the Threat Severity and Action details.
- URL Filtering – Total count of URL Categories with Action count details and URL Reputation risks with Action count details for selected Edges within the Enterprise, along with the Top 5 URL Filtering details.
- Malicious IP – Total count of Malicious IPs Blocked and Monitored.
Note: The user can generate the EFS report only when EFS is activated at the customer level. For more information on how to activate EFS, see the see the topic Configure Customers in the Arista VeloCloud SD-WAN Operator Guide. - Select Next.
Select Edges for Report
Users can select to generate an Enterprise report including all the Edges or choose to include specific Edges.
- When users select Next after selecting the data to be included in the report in Select Data, Select Edges displays.
Figure 76. Select Edges to Include in the Report 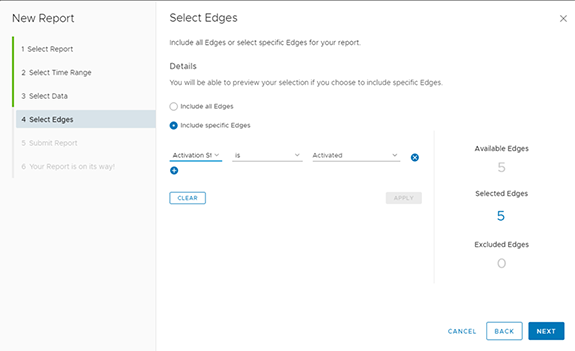
- By default, the report selects Include all edges and generates the report including data from all Edges in the Enterprise.
- Users can choose Include specific edges to generate the report with data from specific Edges. Select the appropriate condition from the list to include the corresponding Edges. Select + to include more conditions. After specifying the conditions, select Apply and the details of Edges selected according to the conditions display to the right.
- Select Next.
Submit Report
After configuring all the settings, users can generate the Enterprise report.
- When users select Quick to create a Quick Report in Create a Quick Enterprise Report, or select Next after selecting the Edges in Select Edges, Submit Report displays.
Figure 77. Submit Report 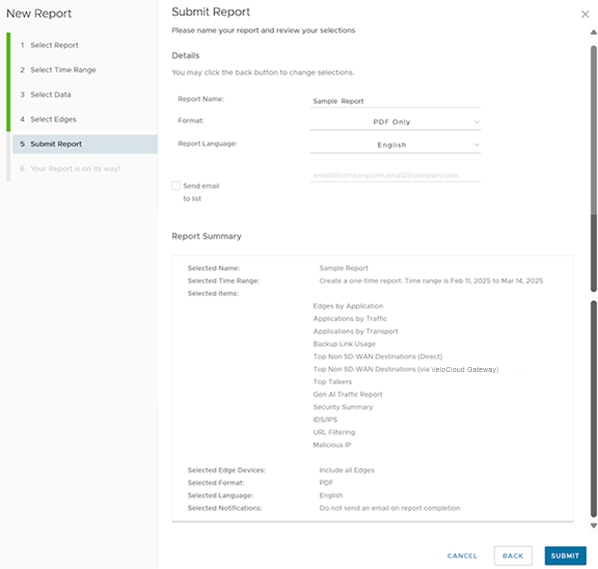
- Configure the following:
- Report Name - Enter a name for the report.
- Format - Choose the format of the report from the list, as PDF or PDF and CSV.
- Report Language - Choose the language in which users want to generate the report. Currently the report supports the following languages:
- English
- Simplified Chinese
- Czech
- Italian
- French
- German
- Send email to list - If users want to send the generated report through Email, select the check box and enter the Email addresses separated by a comma. The Email attaches the report and sends it to the recipients.
- In Report Summary, verify the settings and select Submit.
- Select Done.
The report generates and displays on the Reports page. See Monitor Enterprise Reports.
Create a Generative AI Traffic Report for Enterprise
- In the SD-WAN service of the Enterprise portal, select .
- Select New Report.
Figure 79. Create a New Generative AI Traffic Report 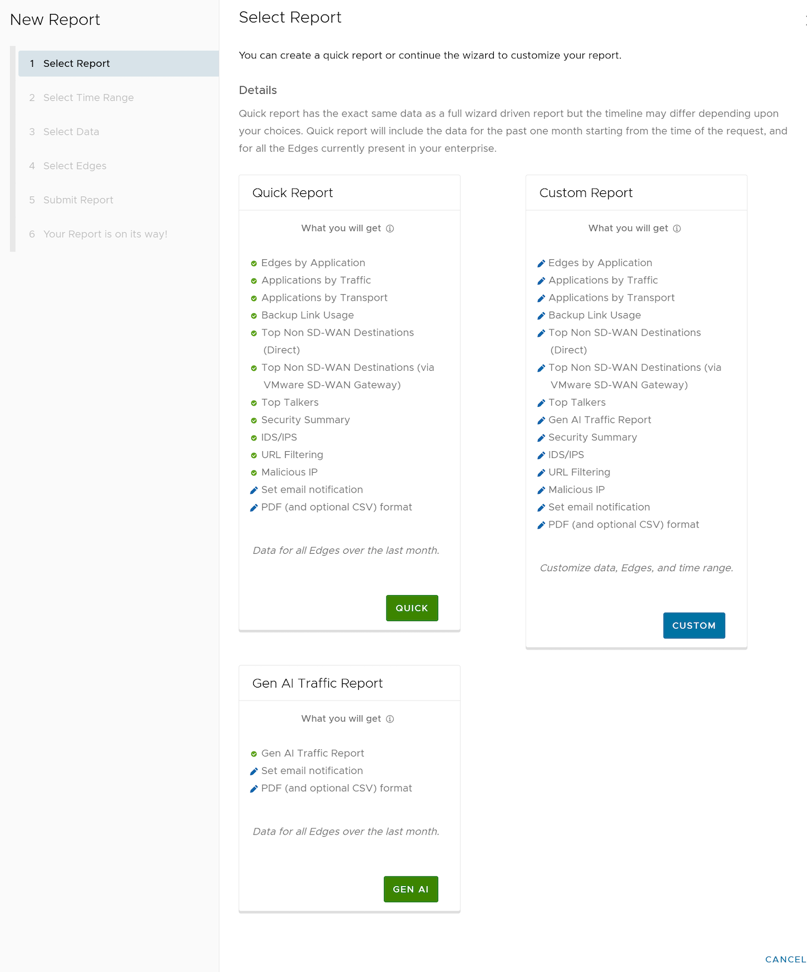
- On the Select Report page, select Gen AI to generate a Gen AI Traffic report with the default settings displayed in the Gen AI Traffic Report pane. By default, this report includes data for the last 30 days, with breakdown details of the following:
- Top Ten Gen AI Applications within the network of an Enterprise
- Top Ten Edges by Gen AI Applications
- Top Talkers across an entire Enterprise
- Top Ten Gen AI Applications presence across Edges
- Gen AI Applications Growth across Edges over time
- In the Submit Report window, enter the Report Name, and choose the format as PDF. Then, select the language of the Report, and choose if users want to send the generated report as email and specify the email IDs. See Submit Report.
After users submit the report, the report details display with the status on the Reports page, where users can download and view the report data.
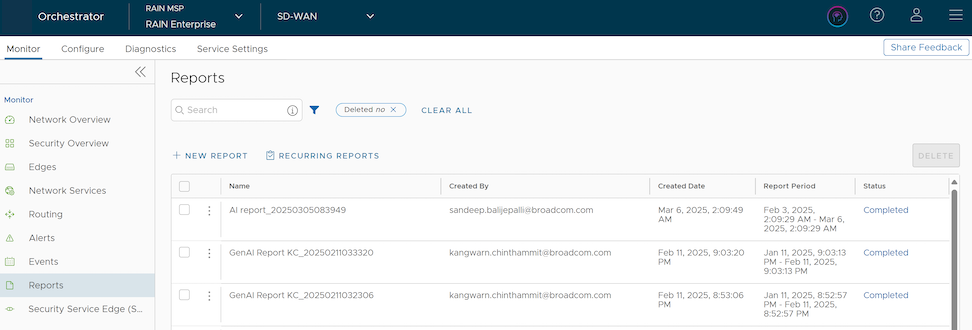
To download a report, select Completed next to the report. The report downloads as a ZIP file, which consists of the PDF format of the report.
- Top Ten Gen AI Applications - Displays the top ten Gen AI applications usage by traffic volume and percentage measure compared to the overall Enterprise traffic volume.
-
Top Ten Edges By Applications – Displays the top ten contributing Edges for each of the Gen AI applications along with the ratio of Download (RX) to Upload (TX) traffic volume. Download-to-Upload Ratio (DUR) is an indicator that helps identify traffic patterns for Gen AI applications. A DUR value more than 1 indicates that the download occurs more than the upload. A DUR value less than 1 indicates that the upload occurs more than the download, and a DUR value equal to 1 means symmetrical.
Figure 81. View GenAI Traffic Report 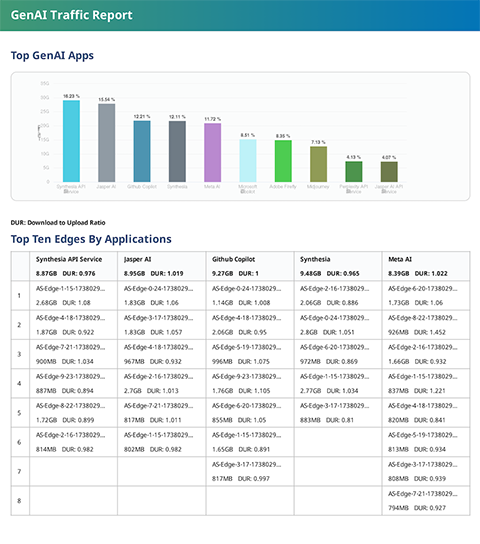
- Top Talkers Across An Entire Enterprise – Displays the top five client devices that contributed traffic to each of the top ten Gen AI applications, along with details like the Edge site of the client and the DUR associated with the client.
Note: The top talkers are based on the union of top sites for each of the top ten Gen AI applications.
Figure 82. View Top Ten Talkers 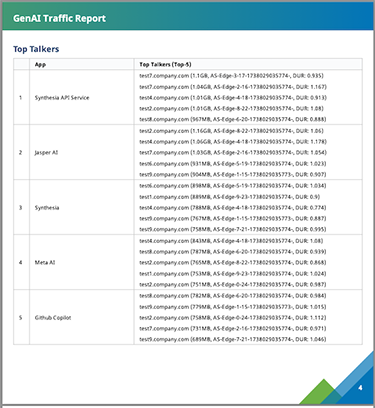
- Top Ten Gen AI Applications Presence Across Edges - Displays each of the top ten Gen AI applications, and the percentage of Edges across the entire Enterprise that contribute to the traffic.
Figure 83. View Top Ten Applications Presence Across Edges 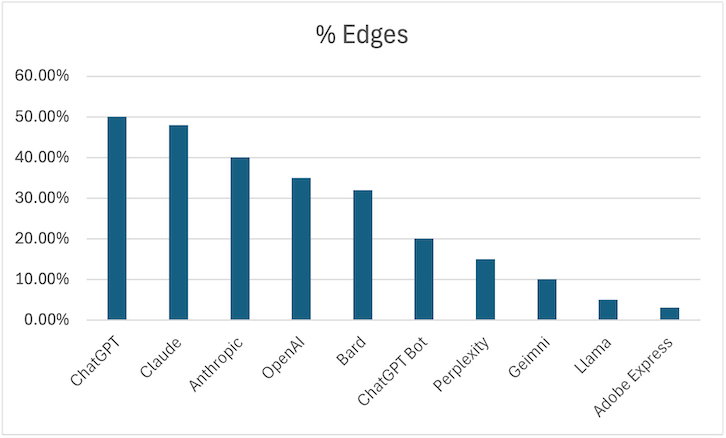
- Gen AI Applications Growth Across Edges Over Time – Displays the time growth across Edges for each of the top ten Gen AI applications. Regardless of the time range selected for the report, the time growth for Gen AI applications is shown for one year month by month.
Figure 84. View GenAI Applications Growth Across Edges over Time 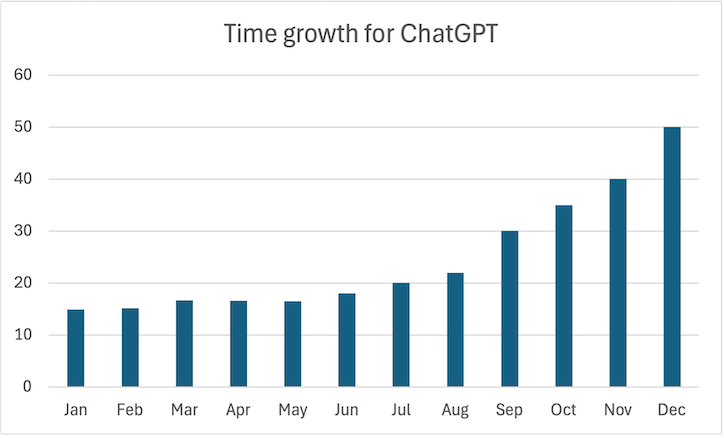
Monitor Enterprise Reports
Generate a secure SD-WAN Enterprise report with Network and Security data, by using the default values, or a custom report with specified values, or a Gen AI-specific report for Gen AI applications traffic. Users can also schedule a custom report to run regularly. All reports display on the Reports page, where users can download and view the report data. Users can also view the scheduled reports on this page.
In the SD-WAN service of the Enterprise portal, select and display all of the generated reports.
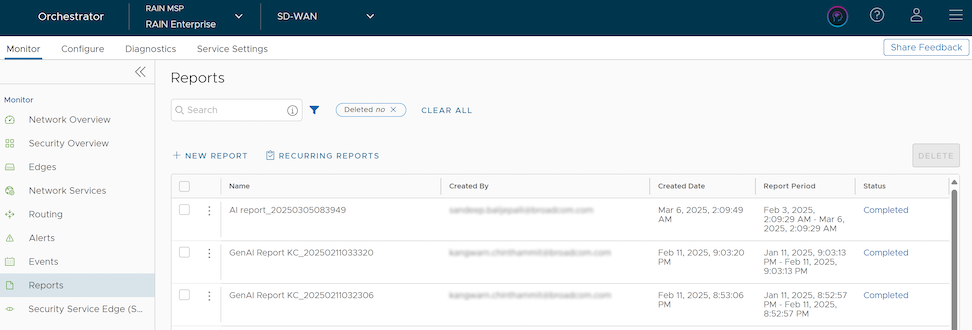
- PDF
- Graphical representation of distribution of Enterprise Traffic, Transport, and top Applications.
- Top 10 Applications by Traffic and Transport types
- Top 10 Edges by Applications
- Top Backup links with top Applications
- Top Talkers with top Applications
- Gen AI Traffic Report including the following details:
- Top Ten Gen AI Applications within the network of an Enterprise
- Top Ten Edges by Gen AI Applications
- Top Talkers across an entire Enterprise
- Top Ten Gen AI Applications presence across Edges
- Gen AI Applications Growth across Edges over time
- Top Edges in top Non SD-WAN Destinations from Edge
- Top Sites in top Non SD-WAN Destinations via Gateway
- Overall Impact Summary of the following data collected from all Enhanced Firewall Service (EFS) engines (IDS/IPS, URL Filtering, Malicious IP):
- Total Edges
- Reporting Edges
- Top Ten Reporting Edges and Actions
- IDS/IPS Summary
- URL Category Summary
- URL Reputation Summary
- Malicious IP Summary
- IDS/IPS
- Top Ten Impacted Edges by Total Count
- Top Ten Impacted Edges by Critical and High Count
- Top Threats Detected
- URL Filtering
- Top Ten Edges By Category Actions
- Top Ten Edges By Category Blocked Actions
- Top Ten URL Categories By Action
- Top Ten Edges By Reputation Actions
- Malicious IP
- Top Ten Malicious Edges By Actions
- Top Ten Malicious Edges By IP
- Top Ten Malicious Destinations By Country
- Top Ten Malicious Categories
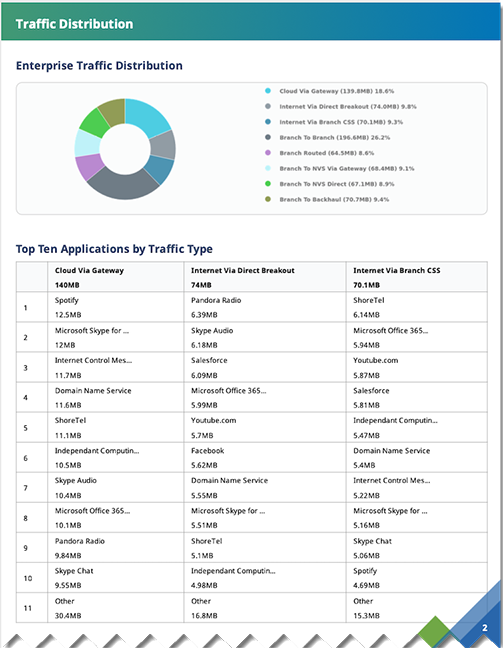
- Cloud Via Gateway - Internet bound traffic that goes through the Gateway.
- Internet Via Direct Breakout - Internet bound traffic that breaks out directly from branch and does not go through VeloCloud Tunnels.
- Internet Via Branch CSS - Traffic bound to Cloud Security Services directly from VeloCloud branch.
- Branch To Branch - Traffic going through Gateway /Hub / dynamic SD-WAN Tunnels, directly between two VeloCloud branches.
- Branch Routed - Traffic bound to local connected / static / routed (underlay) destinations.
- Branch To NVS Via Gateway - Traffic bound from branch to Non SD-WAN Destination through Gateway.
- Branch To NVS Direct - Traffic bound from branch to Non SD-WAN Destination over direct IPsec tunnels.
- Branch To Backhaul - Internet bound traffic backhauled from branch to VeloCloud Hubs.
- Top Sites by Applications - Lists all the applications, Edge name, Edge description, Bytes transmitted, and Bytes received.
- Traffic Type - Lists all the flow paths, applications, Edge name, Edge description, Bytes transmitted, and Bytes received.
- Transport Type - Lists all the Transport types, applications, Edge name, Edge description, Bytes transmitted, and Bytes received.
- Backup Link Usage - Lists the names of all the Backup links, total bytes and applications used by the links, Bytes transmitted, and Bytes received.
- Non SD-WAN Destinations from Edge - Lists all the Non SD-WAN Destinations connected directly from the Edges, name and description of the connected Edges, Bytes transmitted, and Bytes received.
- Non SD-WAN Destinations via Gateway - Lists all the Non SD-WAN Destinations connected through Gateways, name of the Gateway, Bytes transmitted, and Bytes received. This report also lists the name and description of the Edges connected to each destination along with the Bytes transmitted, and Bytes received.
- Top Talkers - Lists the names of clients, source IP address, source MAC address, name and description of the Edges connected to each client, total bytes used by the client, applications, Bytes transmitted, and Bytes received.
- Gen AI Traffic Report - A comprehensive summary of traffic usage based on Gen AI applications detected in the network. Details include Top 10 Applications, Top 10 Edges per top application, Top Talkers per top edge per top application, footprint of top application across all edges and growth of footprint of top application across all edges over the past year.
- Security Summary - Lists all the Reporting Edges and total action count by category (IDPS, URL Category, URL Reputation, and Malicious IP).
- IDPS Edge Stats - Lists all the impacted Edges and total count by severity (Critical, High, Medium, Low, and Suspicious).
- IDPS Signature Stats - Lists all the signature names along with the severity and total count.
- URL Categories - Lists all the impacted Edges and total count by Category Actions (Blocked, Allowed, and Monitored).
- URL Reputation Stats - Lists all the impacted Edges and total count by Reputation Actions (Blocked, Allowed, and Monitored).
- Malicious IP - Lists all the impacted Edges and total count by Malicious Actions (Blocked and Monitored).
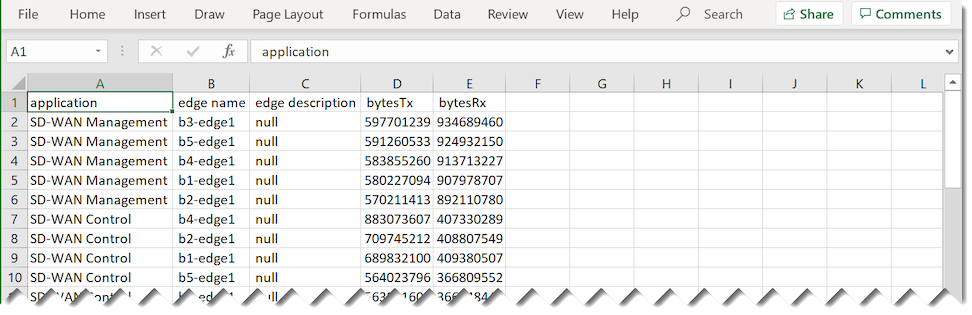
To delete a report, select the report and select Delete.
To view scheduled reports, select Recurring Reports.
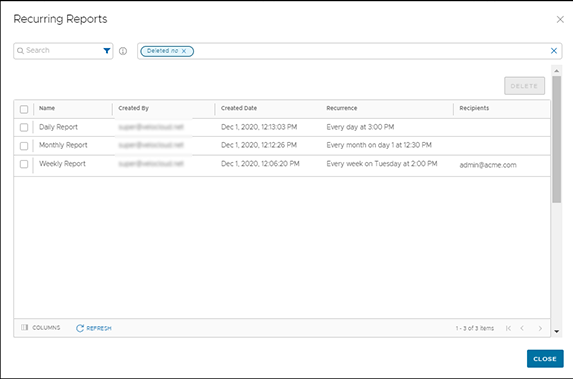
The Recurring Reports panel displays the details of reports and the recurrence schedule.
To remove a report from the scheduled list, select the report and select Delete.