NetFlow Dashboard Management
NetFlow and IPFIX
Configure the NetFlow collector interface on the Arista Analytics Node to obtain NetFlow packets.
- The Arista Analytics Node cluster listens to NetFlow v9 and IPFIX traffic on UDP port 4739. NetFlow v5 traffic learn on UDP port 2055.
- Refer to DANZ Monitoring Fabric User Guide for NetFlow and IPFIX service configuration.
- Analytics Node capability augments in support of the following Arista Enterprise-Specific Information Element IDs:
- 1036 -AristaBscanExportReason
- 1038 -AristaBscanTsFlowStart
- 1039 -AristaBscanTsFlowEnd
- 1040 -AristaBscanTsNewLearn
- 1042 -AristaBscanTagControl
- 1043 -AristaBscanFlowGroupId
Netflow v9/IPFIX Records
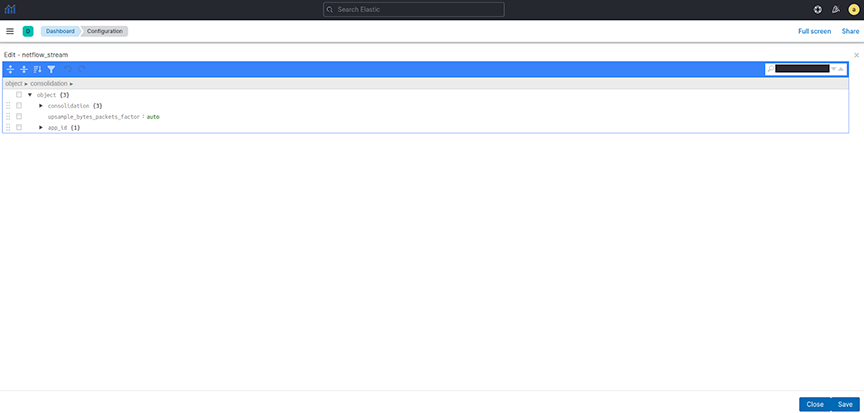
You can consolidate NetFlow v9 and IPFIX records by grouping those with similar identifying characteristics within a configurable time window. This process reduces the number of documents published in Elasticsearch, decreases hard drive usage, and improves efficiency. It is particularly beneficial for long flows, where consolidations as high as 40:1 also happen. However, enabling consolidation is not recommended for environments with low packet flow rates, as it may cause delays in the publication of documents.
cluster:analytics# config
analytics(config)# analytics-service netflow-v9-ipfix
analytics(config-controller-service)# load-balancing policy source-hashing
- Source hashing: forwards packets to nodes statistically assigned by a hashtable of their source IP address. Consolidation operations are performed on each node independently in source hashing.
- Round-robin: distributes the packets equally between the nodes if source-hashing results in significantly unbalanced traffic distribution. Round-robin is the default behavior.
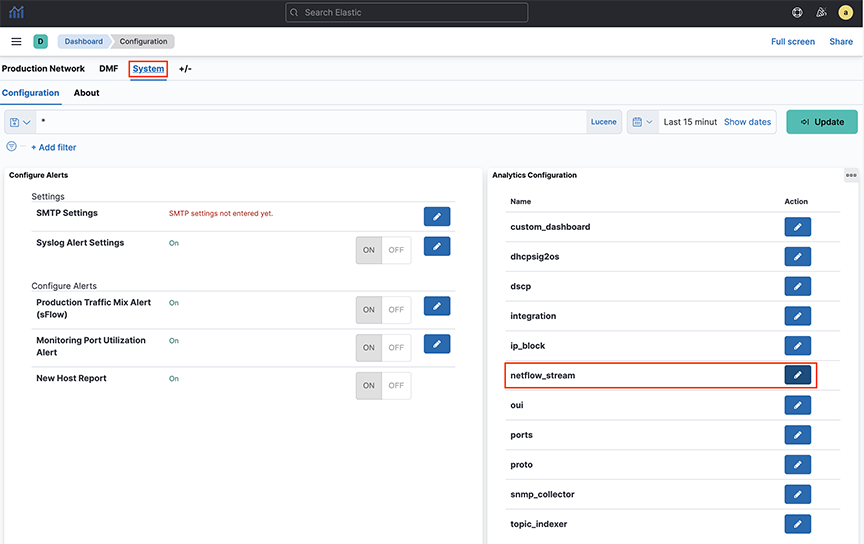
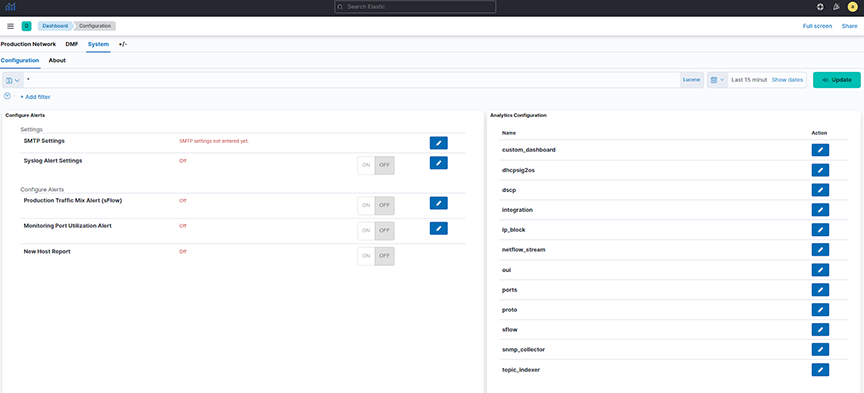
Kibana Setup
To perform the Kibana configuration, select the tab on the Fabric page and open the panel:
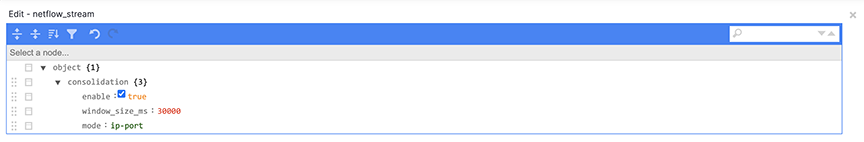
- enable: turn consolidation on or off.
- window_size_ms: adjust window size using the Netflow v9/IPFIX packet rate per second the analytics node receives. The default window size is 30 seconds but measured in milliseconds.
- mode: There are three supported modes:
- ip-port: records with the same source IP address, destination IP address, and IP protocol number. It also consolidates the lower numerical value of the source or destination Layer 4 port number with others.
- dmf-ip-port-switch: records from common DMF Filter switches that meet ip-port criteria.
- src-dst-mac: records with the same source and destination MAC addresses.
Note:It uses the mode when Netflow v9/IPFIX templates collect only Layer 2 fields.

Consolidation Troubleshooting
If consolidation is enabled but does not occur, Arista Networks recommends creating a support bundle and contacting Arista TAC.
Load-balancing Troubleshooting
If there are any issues related to load-balancing, Arista Networks recommends creating a support bundle and contacting Arista TAC.
NetFlow and IPFIX Flow with Application Information
Arista Analytics combines Netflow and IPFIX records containing application information with Netflow and IPFIX records containing flow information.
It improves the data visibility per application by correlating flow records with applications identified by the flow exporter.
It supports only applications exported from Arista Networks Service Nodes. In a multi-node cluster, you must configure load balancing in the Analytics Node CLI command.
Configuration
analytics# config
analytics(config)# analytics-service netflow-v9-ipfix
analytics(config-an-service)# load-balancing policy source-hashingKibana Configuration
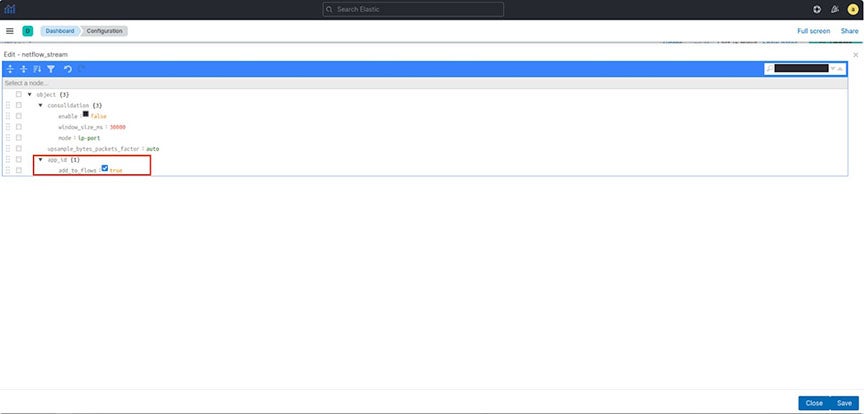
- add_to_flows: Enables or turns off the merging feature.
ElasticSearch Documents
Three fields display the application information in the final NetFlow/IPFIX document stored in ElasticSearch:
- appScope: Name of the NetFlow/IPFIX exporter.
- appName: Name of the application. This field is only populated if the exporter is NTOP.
- appID: Unique application identifier assigned by the exporter.
Troubleshooting
If merging is enabled but does not occur, Arista Networks recommends creating a support bundle and contacting Arista TAC.
Limitations
- Some flow records may not include the expected application information when configuring round-robin load balancing of Netflow/IPFIX traffic. Arista Networks recommends configuring the source-hashing load-balancing policy and sending all Netflow/IPFIX traffic to the Analytics Node from the same source IP address.
- Application information and flow records are correlated if the application record is available before the flow record.
- Arista Networks only supports collecting application information from Netflow/IPFIX exporters: NTOP, Palo Alto Networks firewalls, and Arista Networks Service Node.
- This feature isn’t compatible with the consolidation feature documented in the Netflow v9/IPFIX Records. When merging with application information is enabled, consolidation must be disabled.
NetFlow and sFlow Traffic Volume Upsampling
Arista Analytics can upsample traffic volume sampled by NetFlow v9/IPFIX and sFlow. This feature provides better visibility of traffic volumes by approximating the number of bytes and packets from samples collected by the NetFlow v9/IPFIX or sFlow sampling protocols. It gives those approximation statistics along with the Elasticsearch statistics. The feature bases the approximations on the flow exporter’s sampling rate or a user-provided fixed factor.
The Analytic Node DMF 8.5.0 release does not support the automated approximation of total bytes and packets for Netflow v9/IPFIX. If upsampling is needed, Arista Networks recommends configuring a fixed upsampling rate.
NetFlow/IPFIX Configuration
- Auto: This is the default option. Arista Networks recommends configuring an integer if upsampling is needed.
- Integer: Multiply the number of bytes and packets for each collected sample using this configured number.
sFlow Configuration

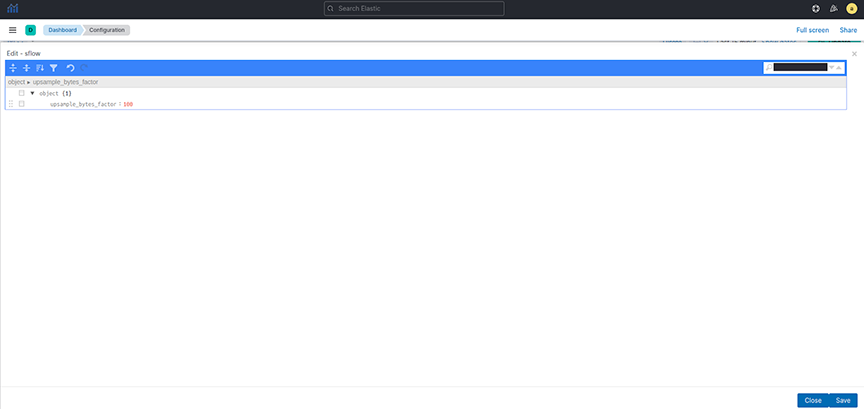
- Auto: Approximate the bytes and packets for each collected sample based on the collector’s sampling rate. Auto is the default option.
- Integer: Multiply the number of bytes and packets for each collected sample using this configured number.
Troubleshooting
Arista Networks recommends creating a support bundle and contacting Arista Networks TAC if upsampling isn’t working correctly.
Non-standard Ports Support for IPFIX and NetFlow v5
- NetFlow v5 (Standard Port: 2055): Alternates 1 and 2 are UDP ports 9555 and 9025.
- NetFlow v9/IPFIX (Standard Port: 4739): Alternates 1 and 2 are UDP ports 9995 and 9026.
Configuration
The alternate ports do not require special configuration; DMF automatically configures them to allow Netflow from any subnet, as illustrated in the following show command outputs.
Show Commands
ana1ytics(config-cluster-access)# show this
! cluster
cluster
access-control
access-list active-directory
!
access-list api
1 permit from ::/0
2 permit from 0.0.0.0/0
!
access-list gui
1 permit from ::/0
2 permit from 0.0.0.0/0
!
access-list ipfix
1 permit from ::/0
2 permit from 0.0.0.0/0
!
access-list ipfix-alt1
1 permit from ::/0
2 permit from 0.0.0.0/0
!
access-list ipfix-alt2
1 permit from ::/0
2 permit from 0.0.0.0/0
!
access-list netflow
1 permit from ::/0
2 permit from 0.0.0.0/0
!
access-list netflow-alt1
1 permit from ::/0
2 permit from 0.0.0.0/0
!
access-list netflow-alt2
1 permit from ::/0
2 permit from 0.0.0.0/0
access-list redis
!
access-list replicated-redis
!
access-list snmp
1 permit from ::/0
2 permit from 0.0.0.0/0
!
access-list ssh
1 permit from ::/0
2 permit from 0.0.0.0/0
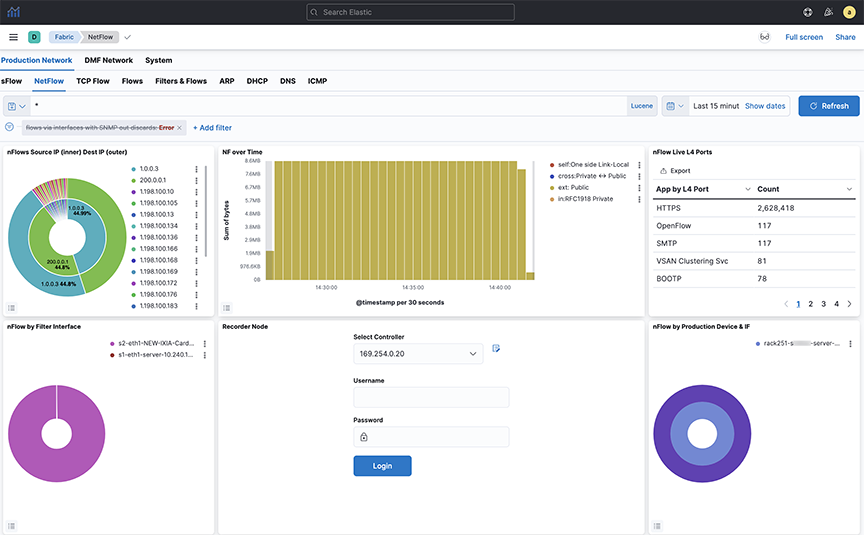
Displaying Flows with Out-Discards
The NetFlow dashboard allows displaying flows with out-discards when the NetFlow packets come from third-party devices. To display this information, select the flows via interfaces with SNMP out-discards tab at the top of the Arista Analytics NetFlow dashboard.
To display the flows with out-discards, click the flows via interfaces with SNMP out-discards tab and click the Re-enable button. This window displays the flows with out-discards. This capability is valuable for network monitoring and troubleshooting as out-discards on interfaces can indicate potential issues such as congestion, rate limiting, errors or configuration issues.
Latency Differ and Drop Differ Dashboard
The DANZ Monitoring Fabric (DMF) Latency Differ Dashboard and Drop Differ Dashboard feature provides a near real-time visual representation of latency and drops in the DMF Analytics Node (AN) dedicated to NetFlow Records.
For a given flow, it reports the latency and drop of packets over time between two existing tap points (A, B), with network flows traversing the managed network from A towards B.
This feature introduces the concept of DiffPair, defined as a flow from A towards B.
The Dashboards provide comprehensive information about the flows. The data helps determine which applications are running slow and identifies peak times. A configurable mechanism alerts on abnormal drops and latency.
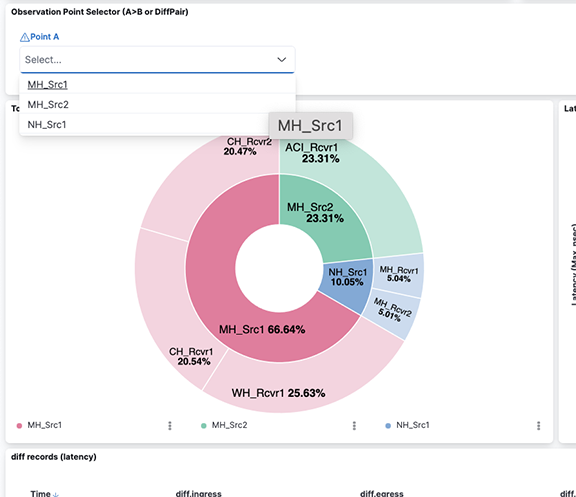
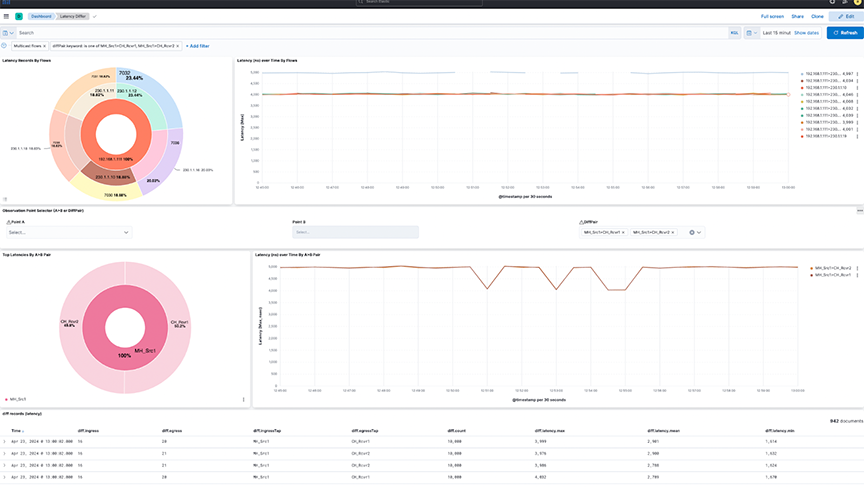
Introducing DiffPair
When identifying the flows between two tap points or filter interfaces, the aggregation occurs as A towards B pairs. It implies that point B receives a flow originating from point A. The term DiffPair is employed to visualize this flow as a cohesive set. This newly introduced field in the flow data selects the ingress and egress tap points encompassing a flow in between. The utilization of this DiffPair facilitates tap point filtering and comparison.
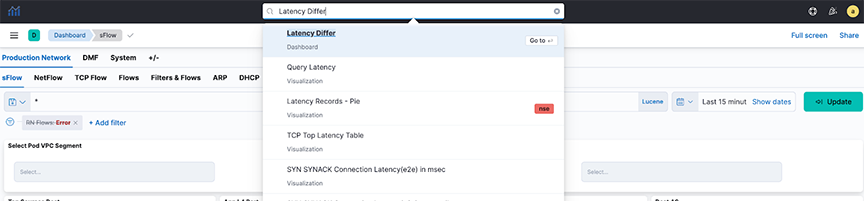
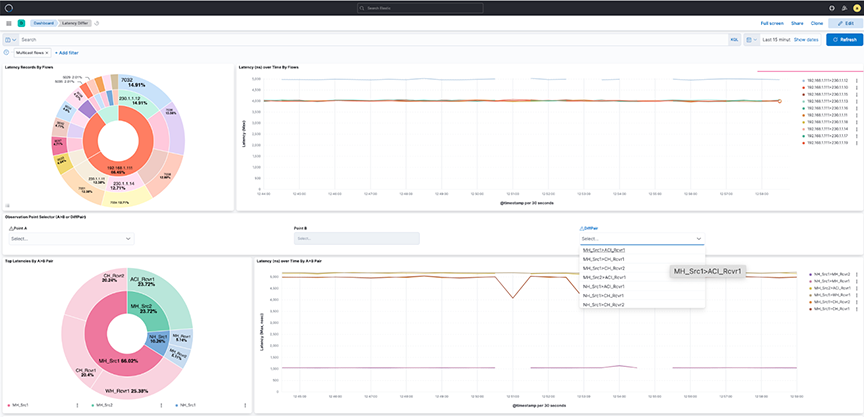
Latency Differ Dashboard
Locate the Latency Differ dashboard by searching for the term Latency Differ.
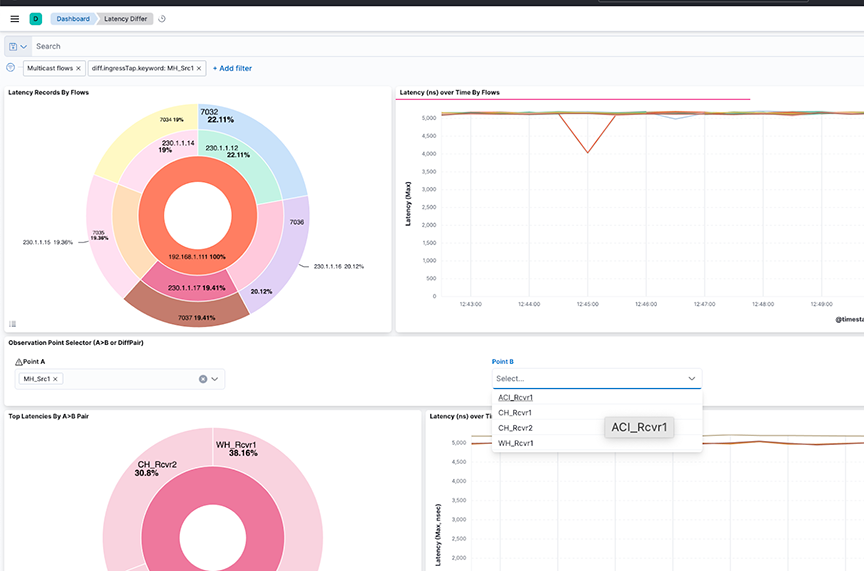
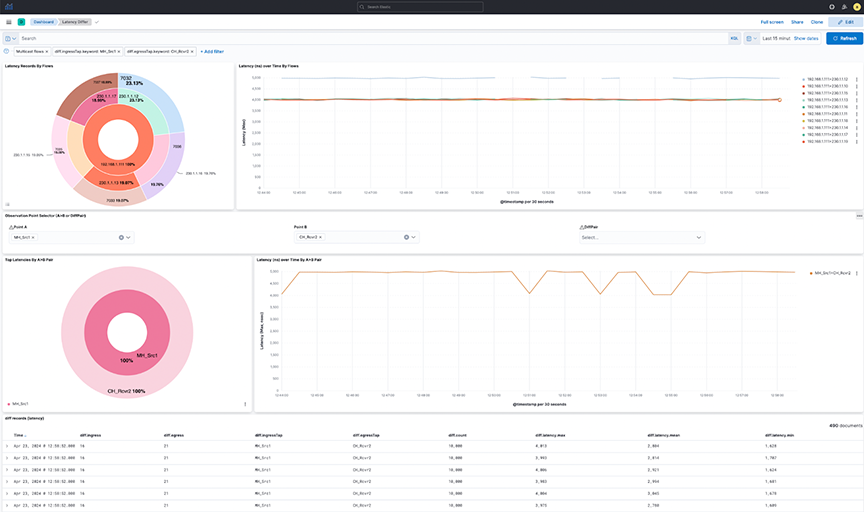
- Latency Records By Flows: The pie chart represents the proportions of flow latency summed. The inner circle displays source IP addresses, the middle circle displays destination IP addresses, and the outermost circle displays destination ports.
- Latency over time By Flows: The line chart represents the maximum Latency in nanoseconds (ns) over time, split by each flow between source IP and destination IP addresses.
- Observation Point Selector ( or DiffPair): Use the drop-down menus to filter by pair or DiffPair. The point B selector is dependent on point A.
- Top Latencies By Pair: The pie chart shows the Latency max summed by Points. The inner circle displays the source A tap point, while the outer circle displays the B destination tap point.
- Latency over time By Pair: The line chart represents the maximum Latency in nanoseconds (ns) over time, split by each pair between the source tap point and destination tap point.
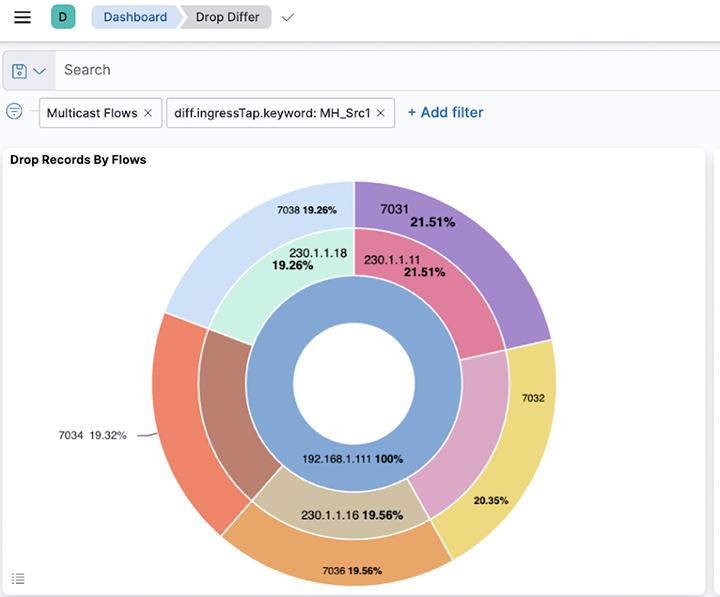
Figure 15. Latency Record by Flows 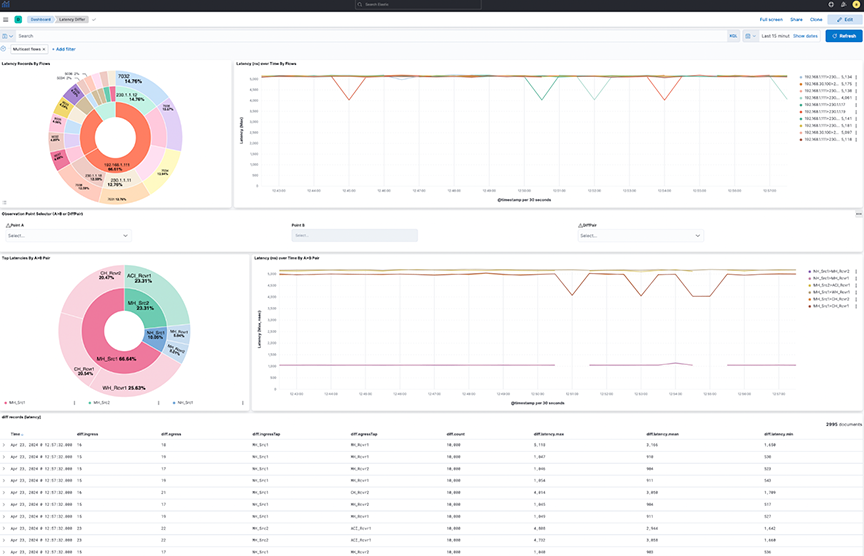

The dashboard displays the latency between points A and B(s), separated by flows between the points in the upper view or filtered by the pairs in the lower view. The diff records appear on the lower dashboard.
Select individual data points in the visualization for further analysis.
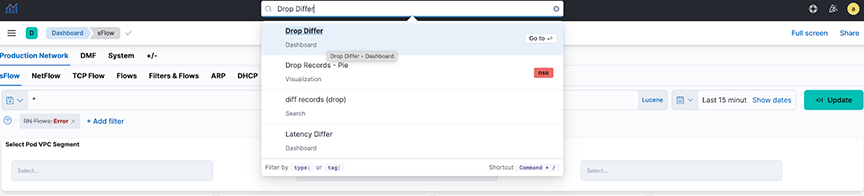
Drop Differ Dashboard
Locate the Drop Differ dashboard by searching for the term Drop Differ.
- Drop Records By Flows: The pie chart represents the proportions of drop packets for each flow summed. The inner circle displays source IP addresses, the middle circle displays destination IP addresses, and the outermost circle displays destination ports.
- Max Drops By Flows: The line chart represents the maximum number of drop packets, separated by each flow between source IP and destination IP addresses. If fewer data points exist, the chart displays them as individual points instead of complete lines.
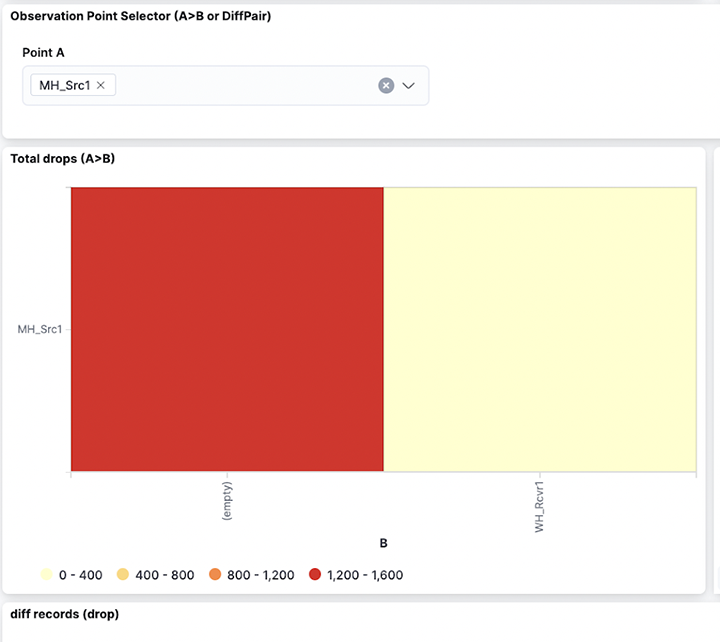
- Observation Point Selector (A>B or DiffPair): Use the drop-down menus to filter by pair or DiffPair. The point B selector is dependent on point A.
- Top Drop A>B: The heat map displays the drop of packets summed by Points. The map plots the source tap point, A, on the vertical axis and the destination tap point, B, on the horizontal axis.
- Top Dropping A>B Pairs: The bar chart represents the sum of drop packets over time, separated by each pair between the source and destination. It shows the Top 10 available dropping pairs.
Figure 23. Top Dropping A>B Pairs 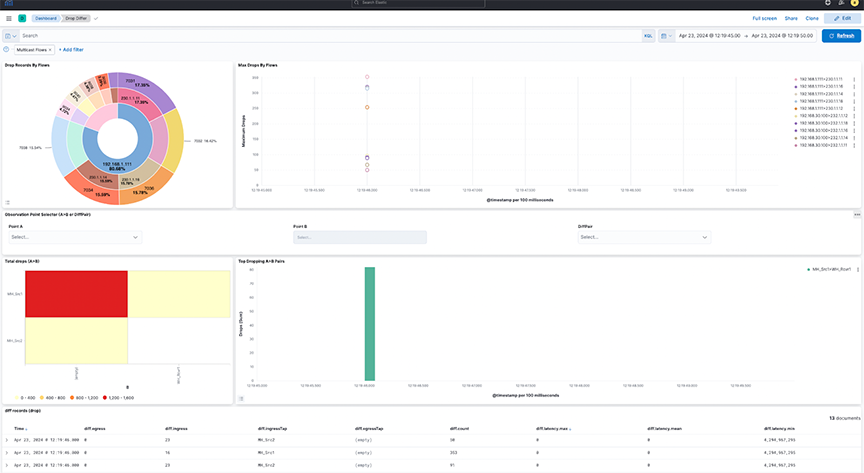
Select selection or DiffPair to visualize the data types.
Filter the data using Points by selecting a single source (A) and one or more receivers (B).
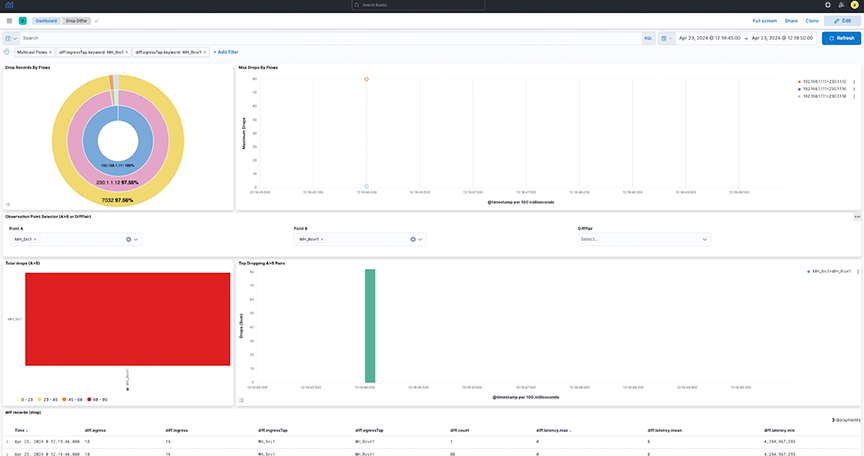
- It provides a dashboard for packet drops between points A and B(s), either split by flows in between those points (Top) or filtered by pairs (bottom) as selected. View the diff records at the bottom of the dashboard.
- Select individual data points in the visualization for further analysis.
- Selecting DiffPairs can provide a similar visualization perspective. Choose one or more DiffPairs for analysis.
Figure 27. DiffPair Analysis for Drop Differ 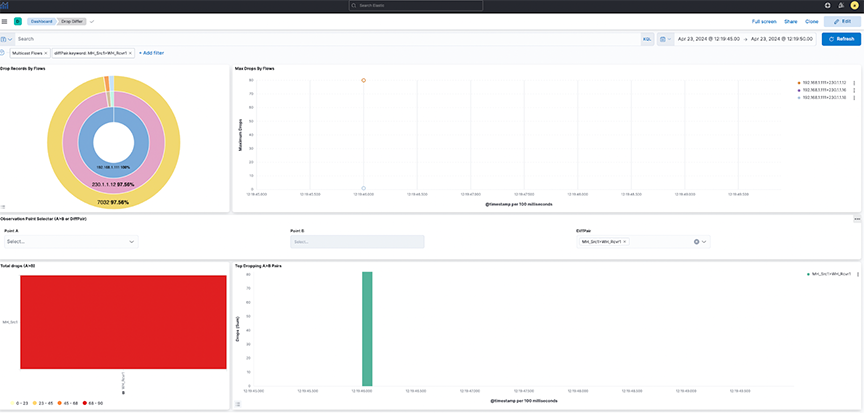
Configuring Watcher Alerts
Watcher is an elastic search feature that supports the creation of alerts based on conditions triggered at set intervals. For more information, refer to the https://www.elastic.co/guide/en/kibana/8.15/watcher-ui.html.
- Arista_NetOps_Drop_Differ_Watch
- arista_NetOps_Latency_Differ_Watch
By default, it disables the templates and requires manual configuration before use.
- Navigate to .
- Under Configuration for the SMTPForAlerts Connector, specify the Senderand Service field values.
- Email alerts may require authentication based on the type of mail service selected.
- Test and validate the settings using the Test tab.
Figure 28. Testing SMTP Connector 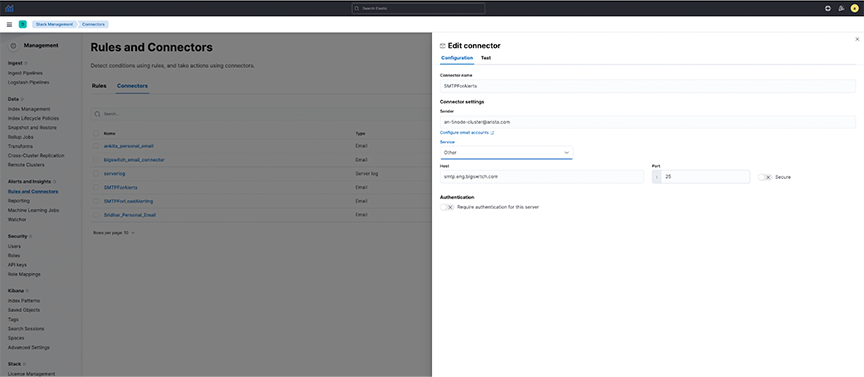
- arista_NetOps_Drop_Differ_Watch:
- It configures the watcherto send an alert when the maximum drop count of packets in NetFlow in the last 5-minute interval exceeds the historical average (last 7-day average) of drop of packets by a threshold percentage.
- By default, it configures the watcher to be triggered every 10 minutes.
- As this may be incorrect for all flows combined, configure it for a particular Flow and Destination Port.
- Search for CHANGE_ME in the watcher and specify the flow and destination port value (introduced to correctly compare each flow and destination port individually instead of comparing all flows together).
- Specify the percentage_increase parameter in the condition using a positive value between 0-100.
- Enter the recipient's email address receiving the alert.
- Select Save watch.
Figure 29. NetOps_Drop_Differ_Watch-1 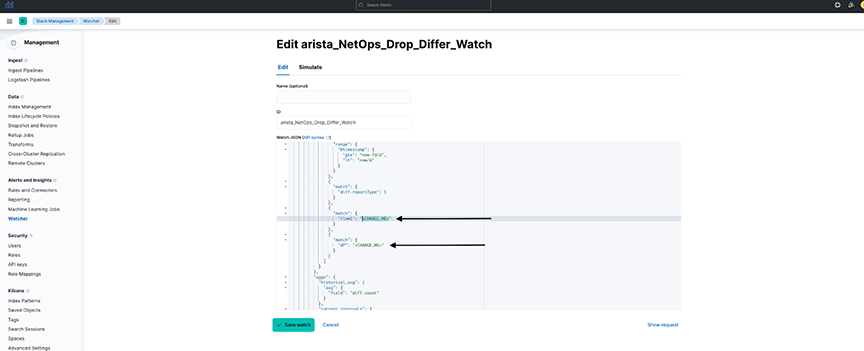
Figure 30. NetOps_Drop_Differ_Watch-2 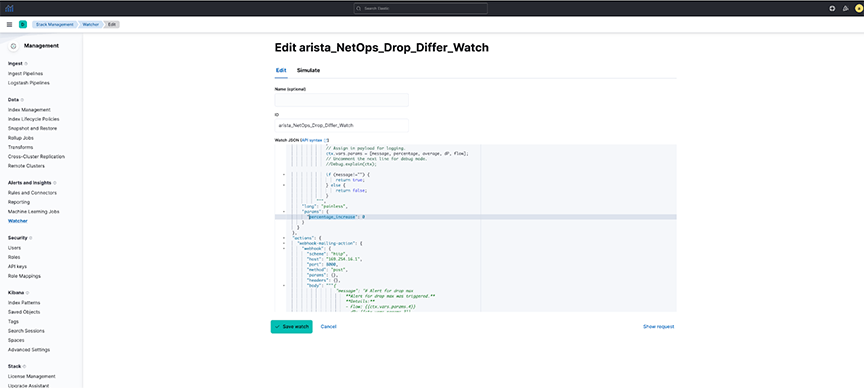
Figure 31. Editing NetOps_Drop_Differ_Watch 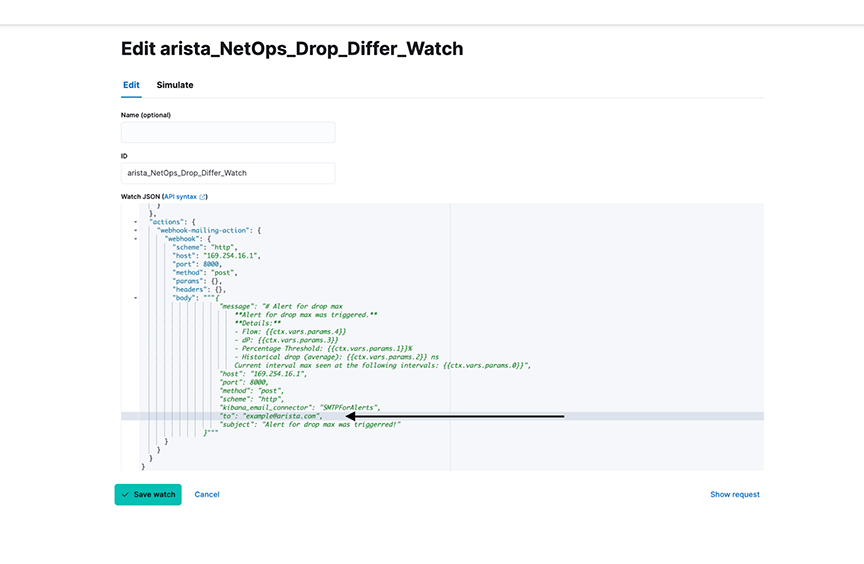
- arista_NetOps_Latency_Differ_Watch:
- It configures the watcher to send an alert when NetFlow's maximum latency (or lag) in the last 5-minute interval exceeds the historical average (last 7-day average) latency by a threshold percentage.
- By default, it configures the watcher to be triggered every 10 minutes.
- As this may be incorrect for all flows combined, configure it for a particular Flow and Destination Port.
- Search for CHANGE_ME in the watcher and specify the flow and destination port value (introduced to correctly compare each flow and destination port individually instead of comparing all flows together).
- Specify the percentage_increase parameter in the condition using a positive value between 0-100.
- Enter the recipient's email address receiving the alert.
- Select Save watch.
Considerations
- Default Watchers are disabled and modified with user-configured alert settings before being enabled.
Figure 32. Arista_NetOps_Drop_Differ_Watch 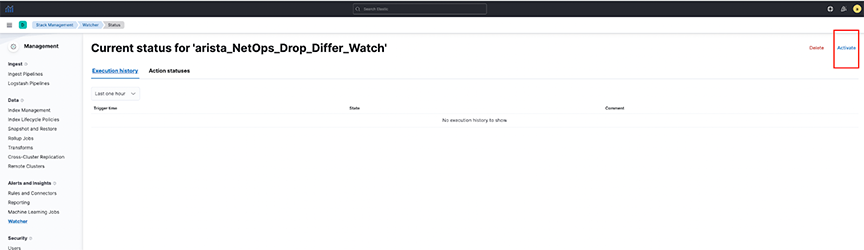
Troubleshooting
- The dashboard obtains its data from the flow-netflow index. If no data is present in the dashboard, verify there is sufficient relevant data in the index.
- Watchers trigger at a set interval. To troubleshoot issues related to watchers, navigate to . Select the requisite watcher and navigate to Action statuses to determine if there is an issue with the last trigger.
Figure 33. Watcher Action Status 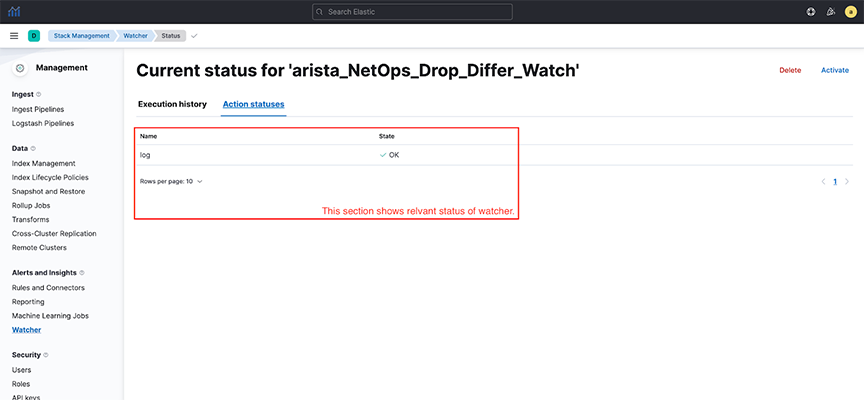
Usage Notes
- The dashboards only show partial and not full drops during a given time and are configured with filtering set to the egress.Tap value as empty.
- A full drop occurs when the flow of packets is at the source tap point, but no packet is at the destination tap point. The dashboards are configured to filter out full drop flows.
- A partial drop is a scenario in which the flow of packets at the source tap point and some, if not all, packets are observed at the destination tap point. The dashboards clearly show partial drop flows.