Arista Analytics Nodes
This chapter describes the Arista Analytics Nodes available from Arista Networks.
Arista Analytics Node (DCA-DM-AA3) Specification
This section describes the LEDs for monitoring environmental and port status on the Arista Analytics Node (DCA-DM-AA3).
The Arista Analytics Node (DCA-DM-AA3) is an enterprise-class, 2-socket, 1 RU rack-mounted hardware appliance designed to deliver the right combination of performance, redundancy, and value in a high-density chassis.
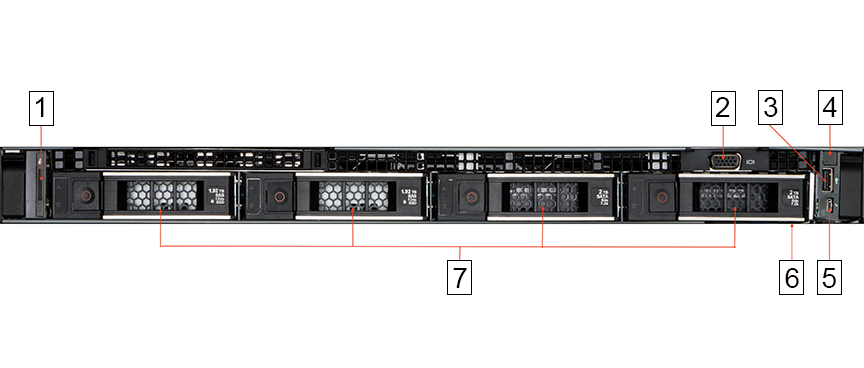
Figure 1. Arista Analytics Node (DCA-DM-AA3) Bezel
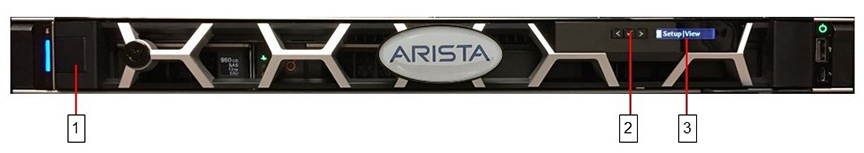
| 1 | Analytics Node security bezel |
| 2 | LCD menu buttons |
| 3 | LCD panel |
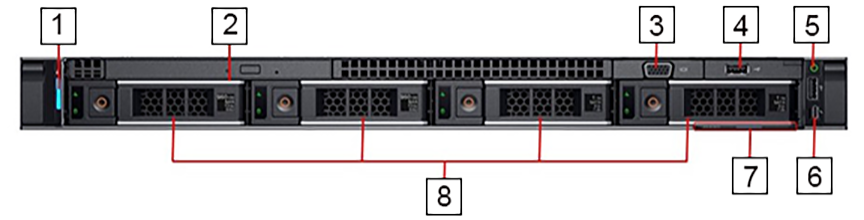
| 1 | System identification button / indicator | 5 | Power-on indicator / Power button |
| 2 | Optical drive | 6 | Micro USB (not supported) |
| 3 | Video connector | 7 | Information tag |
| 4 | USB ports | 8 | Hard drives |
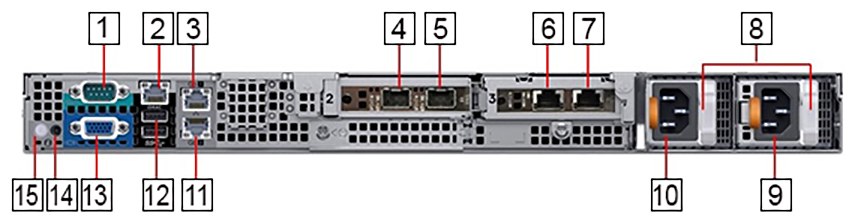
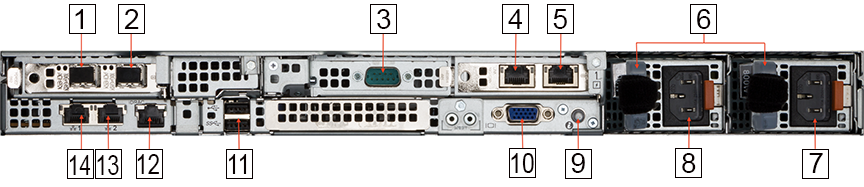
The following lists the meaning of the callouts in the rear panel.
| 1 | Serial connector (default baud rate 115200) | 9 | Power supply 2 |
| 2 | iDRAC Ethernet interface | 10 | Power supply 1 |
| 3 | Ethernet connector 1 – Analytics Node management port 1, active (10/100/1000Mb/s) | 11 | Ethernet connector 2 – Analytics Node management port 2, backup (10/100/1000Mb/s) |
| 4 | Ethernet connector 3 – Analytics Node 10GbE SFP+ Collector Interface 1, active | 12 | USB ports |
| 5 | Ethernet connector 4 – Analytics Node 10GbE SFP+ Collector Interface 2, backup | 13 | Video connector |
| 6 | Ethernet connector 5 – Not supported | 14 | System identification button |
| 7 | Ethernet connector 6 – Not supported | 15 | System identification indicator |
| 8 | PSU status indicators |
LEDs and Indicators
The following table lists the meaning of each LED or other indicator.
| Indicator, Button, or Connector | Description | |
|---|---|---|
| Power-on indicator | Green: System power is on | |
| Off: System power is off | ||
| System identification indicator in front panel | Off: Normal operating conditions | |
| Blue blinking: Activates system identification | ||
| System identification indicator in rear panel | Blue: Normal operation condition | |
| Blue blinking: Activates system identification | ||
| Amber blinking: Fault detected with error code followed by descriptive text in LCD panel | ||
| 10/100/1000Mbps Ethernet connector 1, 2 | Link indicator | Green: Establishes a valid 1000Mb/s network link |
| Amber: Establishes a valid 10/100Mb/s network link | ||
| Off: Link is down | ||
| Activity indicator | Green blinking: Sends or receives Network data | |
| Off: No link activity | ||
| 10G SFP+ Ethernet connector 3, 4 | Link indicator | Green: Establishes a valid 10G network link |
| Off: Link is down | ||
| Activity indicator | Green blinking: Sends or receives Network data | |
| Off: No link activity | ||
| Power supply status | Green: The power supply has a valid power source and is operational. | |
| Amber blinking: Indicates a problem with the power supply | ||
| Off: Power is off | ||
Platform Management Tool
Arista Analytics Node (DCA-DM-AA3) supports iDRAC 9 platform management tools.
- iDRAC 9 supported features: Remote power management, virtual console.
Technical Specification
| Analytics Node | DCA-DM-AA3 |
|---|---|
| Processor | 2 x Intel Xeon Silver 4114 2.20GHz, 10 cores, 20 threads, 9.6GT/s 2UPI, 14M cache, turbo, HT, 85W, DDR4-2400 |
| Form Factor (H X W X D) | 1-RU Rack server (4.28cm x 43.4cm x 69.3cm) |
| Memory | 8 X 16GB RDIMM, 2666MT/s |
| Hard drive | 2 X 960GB SSD SAS hot-plug drive
2 X 1TB 7.2K RPM SATA 6Gbps 3.5in hot-plug hard drives; no RAID, PERC H330+ |
| Networking | Embedded NIC: 2 X 1GbE LOM
Network adapter 1: Intel X710 dual port 10Gb DA/SFP+ server adapter Network adapter 2: Intel X550 dual port 10Gb Base-T server adapter |
| Power | 2 X Hot-plug power supplies 550W |
| Additional features | Fan fault tolerance; ECC memory; interactive LCD screen; ENERGY STAR® compliant |
| Environment | Specification |
|---|---|
| Temperature – Continuous | 5°C to 40°C (41°F to 104°F) with no direct sunlight on the equipment |
| Temperature - Storage | -40°C to 65°C (-40°F to 149°F) with a maximum temperature gradation of 20°C per hour |
| Relative humidity – Continuous | 5% to 85% with 29°C (84.2°F) maximum dew point |
| Relative humidity – Storage | 5% to 95% at a maximum wet bulb temperature of 33°C (91°F), atmosphere must be non-condensing at all times |
| Altitude – Continuous | 3048m (10,000ft) |
| Altitude – Storage | 12,000m (39,370ft) |
Arista Analytics Node (DCA-DM-AN450) Specification
This section describes the LEDs or monitoring environmental and port status on the Arista Analytics Node (DCA-DM- AN450).
The Arista Analytics Node (DCA-DM-AN450) is an enterprise-class, 2-socket, 1-RU rack-mounted hardware appliance designed to deliver the right combination of performance, redundancy, and value in a high-density chassis.
Figure 4. DMF Analytics Node (DCA-DM-AN450) Bezel
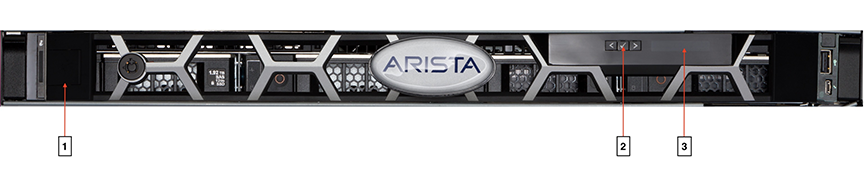
| 1 | Controller Node security bezel |
| 2 | LCD menu buttons |
| 3 | LCD panel |
| 1 | System identification button / indicator | 5 | Micro USB (not supported) |
| 2 | Video connector | 6 | Information tag |
| 3 | USB ports | 7 | Hard drives |
| 4 | Power-on indicator / Power button |
| 1 | Ethernet connector 3 – 10GbE SFP+ Collector Interface | 8 | Power supply 1 |
| 2 | Ethernet connector 4 – 10GbE SFP+ Collector Interface | 9 | System identification indicator/button |
| 3 | Serial connector (default baud rate 115200) | 10 | Video connector |
| 4 | Ethernet connector 5 – Not supported | 11 | USB ports |
| 5 | Ethernet connector 6 – Not supported | 12 | iDRAC Ethernet interface |
| 6 | PSU status indicators | 13 | Ethernet connector 2 – Analytics Node management port 2 (10/100/1000Mb/s) |
| 7 | Power supply 2 | 14 | Ethernet connector 1 – Analytics Node management port 1 (10/100/1000Mb/s) |
LEDs and Indicators
The following table lists the meaning of each LED or other indicator.
| Indicator, Button, or Connector | Description | |
|---|---|---|
| Power-on indicator | Green: System power is on | |
| Off: System power is off | ||
| System identification indicator in front panel | Off: Normal operating conditions | |
| Blue blinking: Activates system identification | ||
| System identification indicator in rear panel | Blue: Normal operation condition | |
| Blue blinking: Activates system identification | ||
| Amber blinking: Fault detected with error code followed by descriptive text in LCD panel | ||
| 10/100/1000Mbps Ethernet connector 1, 2 | Link indicator | Green: Establishes a valid 1000Mb/s network link |
| Amber: Establishes a valid 10/100Mb/s network link | ||
| Off: Link is down | ||
| Activity indicator | Green blinking: Sends or receives Network data | |
| Off: No link activity | ||
| 10G SFP+ Ethernet connector 4 | Link indicator | Green: Establishes a valid 10G network link |
| Off: Link is down | ||
| Activity indicator | Green blinking: Sends or receives Network data | |
| Off: No link activity | ||
| Power supply status | Green: The power supply has a valid power source and is operational. | |
| Amber blinking: Indicates a problem with the power supply | ||
| Off: Power is off | ||
Platform Management Tool
Arista Analytics Node (DCA-DM-AN450) supports iDRAC 9 platform management tools.
- iDRAC 9 supported features: remote power management, virtual console.
Technical Specification
| Analytics Node | DCA-DM-AN450 |
|---|---|
| Processor | 2 x Intel Xeon Silver 4310 2.10GHz, 12 cores, 24 threads, 10.4GT/s 2UPI, 18M cache, turbo, HT, 120W, DDR4-2666 |
| Form Factor (H X W X D) | 1-RU Rack server (4.28cm x 43.4cm x 69.3cm) |
| Memory | 8 X 16GB RDIMM, 3200MT/s |
| Hard drive | 2 X 1.92TB SSD vSAS mixed use 12Gbps 3.5in; AG drive SED, 3DWPD
2 X 2TB 7.2K RPM SATA 6Gbps 3.5in hot-plug hard drives; No RAID, PERC H355 |
| Networking | Embedded NIC: 2 X 1GbE LOM (BCM5720)
Network adapter 1: Intel X710 dual port 10Gb SFP+ adapter Network adapter 2: Intel X710-T2L dual port 10Gb Base-T adapter |
| Power | 2 X Hot-plug power supplies 800W |
| Additional features | Fan fault tolerance; ECC memory; interactive LCD screen; ENERGY STAR® compliant |
| Environment | Specification |
|---|---|
| Temperature – Continuous | 5°C to 40°C (41°F to 104°F) with no direct sunlight on the equipment |
| Temperature - Storage | -40°C to 65°C (-40°F to 149°F) with a maximum temperature gradation of 20°C per hour |
| Relative humidity – Continuous | 5% to 85% with 29°C (84.2°F) maximum dew point |
| Relative humidity – Storage | 5% to 95% at a maximum wet bulb temperature of 33°C (91°F), atmosphere must be non-condensing at all times |
| Altitude – Continuous | 3048m (10,000ft) |
| Altitude – Storage | 12,000m (39,370ft) |