White Paper
Arista Network Telemetry
Table of Contents
– Network-Wide Visibility
– Lack of Visibility Cost
– Advanced Network Telemetry
– Telemetry Triggered Workflows
– DANZ for TAP Aggregation
– NetDB State Streaming
– Telemetry for Visibility
– MapReduce Tracer
– Container Tracer
– CloudVision Analytics Engine
– CloudVision Telemetry Apps
– Conclusion
With phenomenal DC growth that includes the expansion of web, cloud datacenters, software defined networks, and big data, there is a need for a complete solution to optimize the networks and gain visibility into top network challenges. Arista’s advanced Network Telemetry alleviates these challenges and provides end-to-end visibility into networks through Arista’s Telemetry Tracer solution.
As enterprises and service providers are evolving from traditional static networks to virtualized, on-demand cloud networks, the network troubleshooting and monitoring toolsets also need to evolve to provide both fine-grained visibility into application performance and network-wide monitoring capabilities that integrate with both industry standard and customer specific DevOps solutions.
Network-Wide Visibility
In modern highly scalable cloud networks, two-tier leaf-spine networks are deployed to support East-West traffic patterns and remove over-subscription from adding additional tiers and performance bottlenecks. The changes in traffic patterns, accompanied by the sheer volume of traffic and the increasing data rates from 1/10G to 10/25/40/50/100G, are making it increasingly challenging to predict and analyze performance issues proactively.How can you capture, analyze and troubleshoot traffic between two virtual servers, when there are literally hundreds of paths between the racks where servers are located and the exact location of the server is unknown?
Or how do you identify, track, and resolve a network issue that comes and goes on a sub-second interval?
The challenge is troubleshooting and gaining visibility to packet loss events in an ECMP (equal cost multi-pathing) and VXLAN-based network. This is especially difficult with legacy polling-based approaches that only offer limited visibility. There is an ever-growing need to have end-to-end visibility and monitoring that helps with troubleshooting these large-scale cloud networks from virtual to physical infrastructure and with mission critical applications running on top of the network infrastructure.
How Much is Lack of Visibility Costing You?
Published studies have shown that operational costs of running a network are many times more than the capital expenditures. For a general enterprise, an estimated cost of downtime from lack of visibility is around $5,600 per minute. This amounts to $84,000 for a 15 minute outage and more than half a million dollars for a 2 hour outage. Enterprises and service providers with large scale DC growth want to reduce the downtime and be able to detect, isolate, and resolve application performance problems proactively before costly outages.Advanced Network Telemetry from Arista
Network telemetry provides the linkage between the network infrastructure and critical business application performance that ensures visibility into critical real-time information. Arista Network Telemetry works in conjunction with applications so that the network does not slow the pace of IT operations. It dramatically reduces application downtime and network operations costs through improved real-time system and network performance visibility, correlating to application behavior and advanced end-to-end path monitoring tools.Arista’s Telemetry Tracer strategy includes three key components (shown in Figure 1) that bring this deeper network and application level visibility through modern software-defined approaches, by integrating with distributed applications like big data, cloud, and virtualized environments.
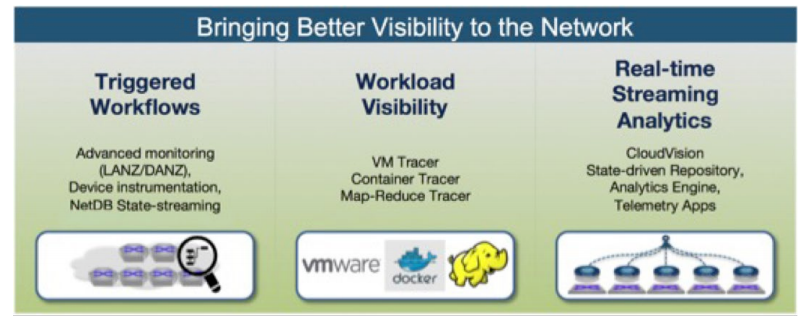
Figure 1: Arista Network Tracer Telemetry Strategy
Telemetry for Triggered Workflows
Health Tracer
EOS Health Tracer helps achieve infrastructure resiliency at the hardware and software layers to increase overall service availability across all EOS platforms. A distributed set of features running at the heart of every Arista switch, Health Tracer monitors the health of the entire system using EOS agents. These features include a dedicated agent for software fault detection and process monitoring, platform agents for real-time switch fabric and hardware monitoring, environmental agents for thermal monitoring and airflow control, monitoring of optical link quality and integrity of critical forwarding tables.Path Tracer
Large-scale cloud networks are based on layer 3 Equal Cost Multi-Pathing (ECMP). In these networks, the number of unique paths between two end systems (from the virtual switch, leaf switch, spine switch and application layer controllers to the destination) is measured in the hundreds and potentially determines the success or failure of delivery of a flow as much as the actual destination of the packet (see Figure 2).Path Tracer is a network monitoring and analysis tool that monitors all paths in the active-active layer 2 and ECMP networks. The Path Tracer detects link issues, logs packet losses and automates reactions to alert the network operator. It then allows the use of predetermined responses, making it extremely easy to detect, diagnose and react to common issues in massively scalable networks.
Path Tracer achieves this by actively probing the network for packet loss using synthetic packets, sent to IP destinations in the network.
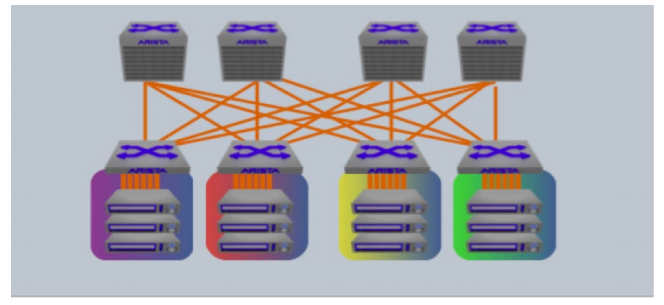
Figure 2: ECMP and LAG multi-pathing based networks
Path Tracer enables a distributed version of traceroute with following benefits:
- Active fault detection
- Hop by hop path statistics
- Comprehensively covers all first-hop ECMP or LAG members to the destination with IP address randomization for route and flow entropy of all available links.
- Tracing of real destination interfaces on the target device to provide visibility for drops that affect only one member of a port channel.
- Checks for unidirectional paths. Probes going in other direction verify the reverse path health.
Arista DANZ for TAP Aggregation
Arista EOS also simplifies TAP Aggregation with the Arista Data ANalyZer (DANZ) feature set. Organizations that need to perform critical analytical and monitoring functions can leverage Arista DANZ to meet security, compliance and reporting requirementseven for high performance data traffic environments, as well as to perform advanced filtering and precision time stamping at wire rate in hardware. DANZ meets these requirements while avoiding the need for proprietary out-of-band monitoring infrastructure or backhaul networks.Arista DANZ is an integrated feature set of Arista EOS and is available on Arista Networks 7150, 7280E, 7500E, 7280R and 7500R Series Switches. DANZ provides a solution to monitoring and visibility challenges at 10/25/40/50/100Gbps and higher with unmatched price-performance and precision. The Arista DANZ software features give IT operations and planning departments the following capabilities:
- Aggregate, replicate and capture traffic for processing without affecting production
- Apply advanced filtering and precision time stamping at wire rate in hardware
- Monitor, capture and correlate congestion and microburst events in real time
- Deliver application layer feedback directly to applications and tools
- Integrate with any standard 3rd party API and application/network management tools
- Achieve all of these features in Arista’s full featured switches without additional equipment
- Troubleshoot applications and performance problems
- Perform traffic interception when required (such as for lawful intercept or compliance)
NetDB State Streaming
Legacy network visibility approaches have been based on inefficient polling mechanisms, which only provide insight into a limited subset of what is happening within the network. Infrequent polling intervals completely miss many network events that take place in a sub-second basis. Inconsistent and inflexible MIBs gather only a limited amount of actual network state. The net effect is that network operators have essentially been left in the dark.The key to Arista’s telemetry solution is the state-based software architecture of Arista EOS. From the beginning, Arista EOS devices store all real-time state in one common database, SysDB, easily accessible through powerful APIs and SDKs. With the software infrastructure enhancements to NetDB, EOS-based devices are now able to stream every state change from every device into an aggregated network-wide view.
Since the collection method is based on a streaming technology, updates are provided the very instant a change is made. This makes the approach vastly superior to traditional polling models that have granularity on the order of every 10-15 minutes.
Unlike traditional pre-defined SNMP MIB-based approaches, NetDB state streaming is able to stream the full device state. This includes details such as configuration, counters, errors, statistics, tables, environmental, buffer utilization, flow data and much more. This streaming architecture is also the basis for our YANG-based OpenConfig data models.
By collecting every state change on the network, Arista customers will have access to both real-time and historic telemetry views of the network in one place and at a level of granularity never before achievable.
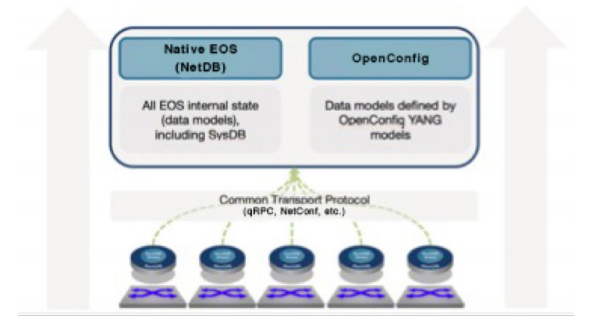
Figure 3: State Streaming Based on NetDB
Telemetry for Workload Visibility
VM Tracer
As virtualized datacenters have grown in size, the physical and virtual networks that support them have also grown in size and complexity. Virtual machines connect through virtual switches and then to the physical infrastructure, adding a layer of abstraction and complexity. Arista VM Tracer, shipping since 2010, coordinates VM provisioning and configuration information with networking data to provide a comprehensive view of the network topology and the provisioning of virtualized resources in the datacenter.Arista’s switches utilize the VMware vCenter API to collect provisioning information. It then combines this information with data from the switch database to provide a clear and concise mapping of the virtual to physical network.
Arista VM Tracer Functionality
a) VM Tracer for VXLAN visibility - Utilizes vCenter API to collect provisioning information for the virtual machines and provide visibility into where the VMs are created or moved to, what VXLANs they are part of, VLAN – VNI mapping for each VM amongst other useful information that this functionality provides(see Figure 3).
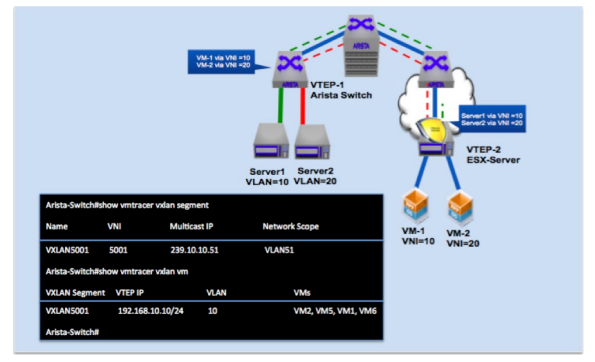
Figure 4: VM Tracer for VXLAN visibility exposes VM and VXLAN information enabled networks
b) VM Tracer with Arista OpenStack Integration
Arista enhancements to VM Tracer also include OpenStack integration that provides virtual machine traceability via Arista’s OpenStack agent (see Figure 4).
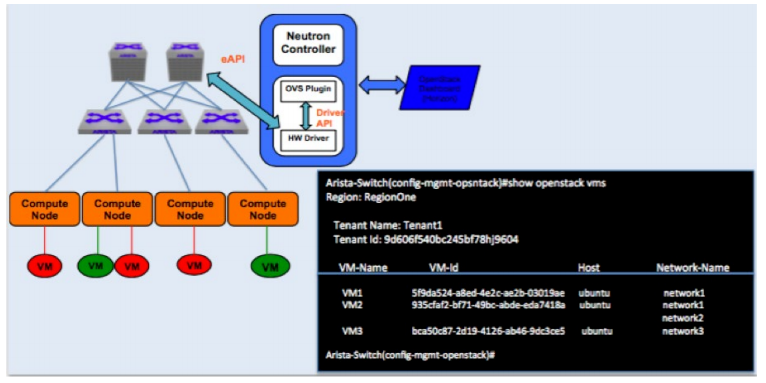
Figure 5: VM Tracer integration with Arista OpenStack agent provides VM traceability
Arista OpenStack CLI
is enhanced to provide VM related information to the user. In addition to the existing VM Tracer capabilities, when OpenStack auto provisions VLANs on a given interface, a network admin can track the count of VMs instantiated behind that interface. When the particular port is deleted or updated by the user, Arista OpenStack agent computes the new count of VMs behind an impacted interface. When the count reaches zero, the VLAN is automatically removed from that interface, reducing administrative overhead.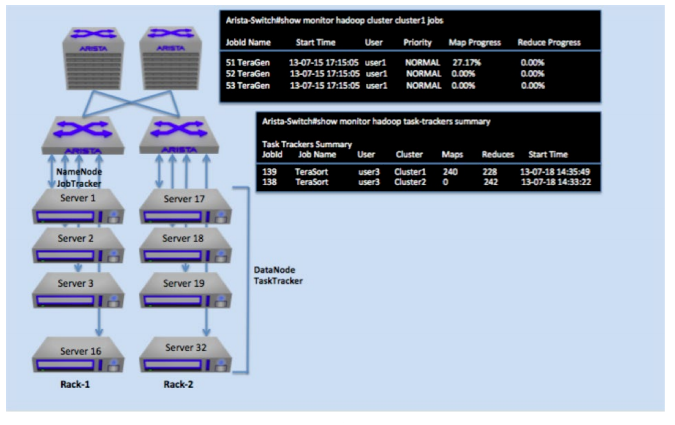
Figure 6: MapReduce Tracer running on Arista switches to provide visibility into Hadoop clusters
MapReduce Tracer
Hadoop workloads are both long lived, bursty and by the nature of Hadoop, fully distributed. One effect of this is that at any time, correlating job performance with network activity, location and the impact of adding new jobs is almost impossible to measure. Arista’s EOS MapReduce Tracer tracks and interacts with Hadoop nodes directly connected to Arista switches in a cluster. It communicates with the JobTracker to build a list of all the nodes in a cluster, and it then retrieves information from JobTracker and TaskTrackers (TT) on these directly connected nodes to track the jobs each node is actively running and the progress of those jobs.MapReduce Tracer creates a map of TaskTrackers with the kind of job they are running (see Figure 5).
MapReduce Tracer creates a local database of nodes from the list given by the JobTracker. MapReduce Tracer provides meaningful information to the network admin, including:
- What jobs are running, when and where
- How “big” each job is, network-wise
- Historical data of MapReduce activity
- MapReduce vs. HDFS traffic accounting
Container Tracer
Linux containers are isolated, compartmentalized application environments that allow efficient deployment of application workloads. Containers enclose an application, or software, in a complete filesystem that contains everything including code, runtime, system tools, system libraries and anything else needed to run it. This ensures that the application or software will behave in the same way regardless of its host environment. Docker, Inc. has developed by the Linux Foundation Open Container Initiative. The wide spread adoption of containers has come about due to the advances in their ecosystem making them easy to deploy. Arista’s EOS Container Tracer gives a view into the containerized workloads in a Docker Swarm environment. It utilizes the Docker Swarm API to locate the Docker containers then, using the Arista eAPI, it gathers the local network information from the switch. The Tracer provides information about the containers such as the nodes that they are running on, exposed ports and the switch port that they are attached to. This information is displayed in the CLI (see Figure 6).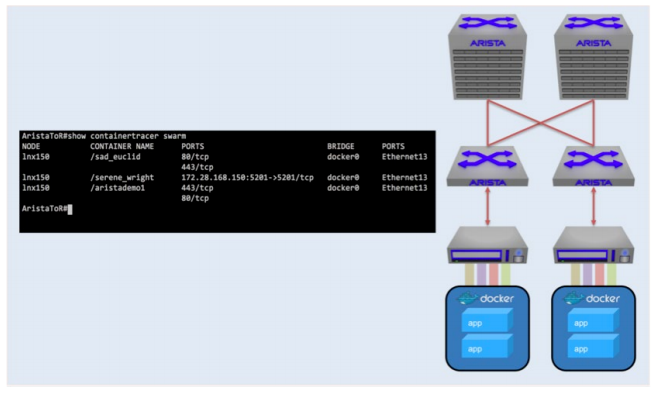
Figure 7: Container Tracer running on Arista switches to provide visibility into containerized workloads
Container Tracer creates a local view of the Container workloads associated with the switch, allowing the network admin to quickly see:
- Where workloads are
- Which switch port they are connected to
- What ports in a Docker node are exposed, including IP address information
Currently Docker Swarm 1.0 from Docker, Inc. is supported
Real-Time State Streaming Analytics
NetDB state streaming provides a modern and granular approach for capturing the state of each network device. To leverage this rich network data, the CloudVision platform is now enhanced to provide both the analytics engine and telemetry visualization for this network-wide state.CloudVision Analytics Engine
The CloudVision platform now includes a built-in storage infrastructure to serve as the state repository. This storage infrastructure provides a scalable big data environment for centrally collecting this streamed network state. On top of this storage infrastructure, CloudVision also now includes an Analytics Engine for processing the raw streamed data into actionable information. This analytics engine digs through the data to track trends, correlate data across devices and layers and detect anomalies. The Analytics Engine also includes easy access to the streamed state via open, RESTful APIs, as a point for integration into a variety of partner solutions and customer-specific infrastructure. Customers or partners can access the streamed state natively to their backend storage infrastructure, or they can access the aggregated state via APIs to the CloudVision backend.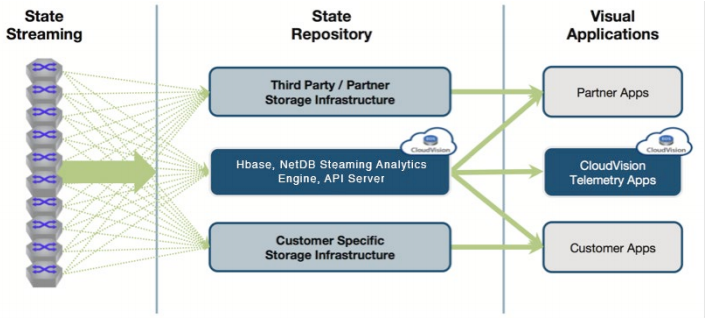
Figure 8: CloudVision Analytics Open Framework
CloudVision Telemetry Apps
The CloudVision Portal includes Telemetry Apps, including the Workstream Analytics Viewer, providing simplified visualization of network-wide state for faster time to resolution. With access to every statistic across the network in both a real-time and a historic view, the Analytics Viewer provides the network operator the ability to correlate events, devices, metrics and other views with a network-wide perspective. CloudVision also provides an extensible infrastructure for building customer-specific visibility apps directly into the portal.CloudVision Analytics and Telemetry deliver real time data center network telemetry at cloud scale and cloud class economics in an open and extensible framework.
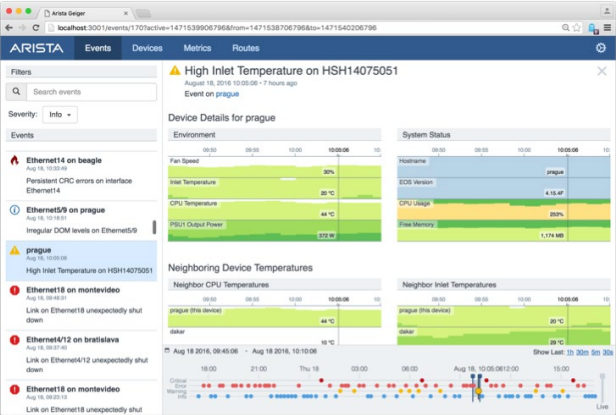
Figure 9: CloudVision Telemetry Apps: Analytics Viewer
Conclusion
The Arista Telemetry Tracer approach combines Triggered Workflow tools, Workload Visibility, and Real-time Streaming Analytics to enable tight linkages between the network infrastructure and the applications that result in considerable savings and operational expenditures. For a greater impact on today’s cloud network, new CloudVision Analytics engines and CloudVision Telemetry Apps take full advantage of the state streaming infrastructure of EOS and NetDB to give Arista customers improved visibility, faster problem isolation and correction, and greater visibility of network performance over time.Copyright © 2016 Arista Networks, Inc. All rights reserved. CloudVision, and EOS are registered trademarks and Arista Networks is a trademark of Arista Networks, Inc. All other company names are trademarks of their respective holders. Information in this document is subject to change without notice. Certain features may not yet be available. Arista Networks, Inc. assumes no responsibility for any errors that may appear in this document. 02-0009-01