This section is designed to convey the basic knowledge necessary to effectively interact with the MSS system. It focuses on practical MSS features and best practices for ongoing system management.
MSS Dashboard
The MSS Dashboard provides you with an at-a-glance overview of your network security domain or domains. View statuses of data sources, MSS devices, and monitoring nodes, as well as recent events, network topology, and more.
Policy Manager
Use Policy Manager to view the elements of security domain policies, including domains, policies, groups, and services. Review and accept dynamic groups that CloudVision has learned from onboarded data sources.
Policy Monitor
Use the Policy Monitor to view policy statistics, including packet and byte counts for security policies that have been pushed to devices.
Policy Builder
Use the Policy Builder to generate policy rule recommendations that can be reviewed, edited, deleted, submitted, or archived. Once you submit new policy rules, configuration changes are pushed to all devices in the relevant security domain VRF.
Policy Logs
Policy Logs provides an at-a-glance view of recent changes to externally-configured MSS groups. Logs are generated when a group from an onboarded data source is added, deleted, or changed at the source. Changes include member prefixes being added or removed.
MSS Studio
Use the MSS Studio to define static groups and policy rules for your security domain or domains and to configure traffic monitoring that allows CloudVision to generate security policy recommendations in the Policy Builder.
Create a Zero Trust Network with MSS
CloudVision’s Multi-Domain Segmentation Service (MSS) gives you the building blocks to easily implement a Zero Trust Network. Zero trust networking minimizes lateral movement by segmenting the network into increasingly smaller perimeters. Within these, communication between endpoints is governed by custom forwarding rules and only approved connections are permitted.
MSS Dashboard
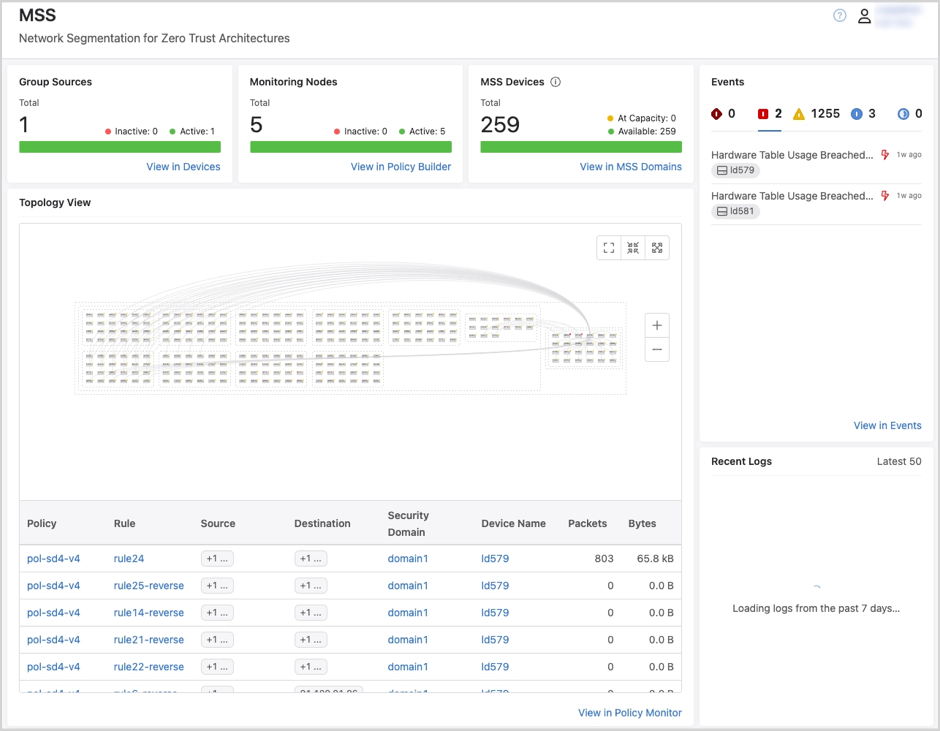
The MSS dashboard provides you with an at-a-glance overview of your network security domain or domains. View statuses of data sources, MSS devices, and monitoring nodes, as well as recent events and network topology. Recent Logs displays changes to static and dynamically learned groups. Use the Policy Monitor table to quickly view the impact of security policy rules on your network in packet and byte counts.
Figure 1. MSS Dashboard
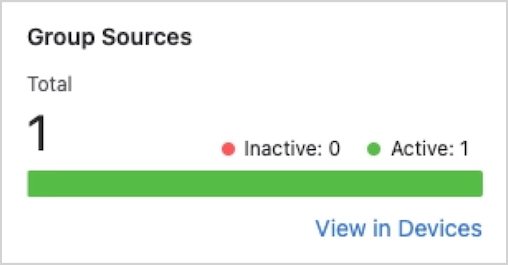
Group Sources
The Group Sources panel displays the streaming status of data sources that CloudVision uses to dynamically discover groups.
Click View in Devices to see data source details under Device Registration.
Figure 2. Group Sources
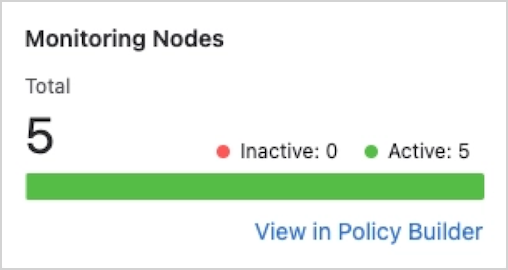
Monitoring Nodes
Monitoring Nodes shows you the streaming status of monitoring nodes that have been onboarded to CloudVision.
Figure 3. Monitoring Nodes
Click View in Policy Builder to view the status of monitoring rules that are using the nodes.
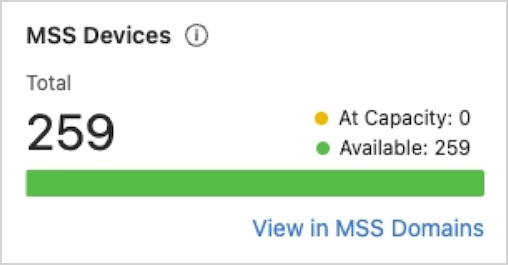
MSS Devices
View device capacity for devices that have been tagged with the security-domain: tag label.
Note: Device capacity does not represent the average of TCAM utilization across all device chips. It represents capacity for the chip with the highest utilization.
Figure 4. MSS Devices
Click View in MSS Domains to view details on device LPML and TCAM utilization rates in Policy Manager. Utilization is provided both as a percentage and as a count of total entities used.
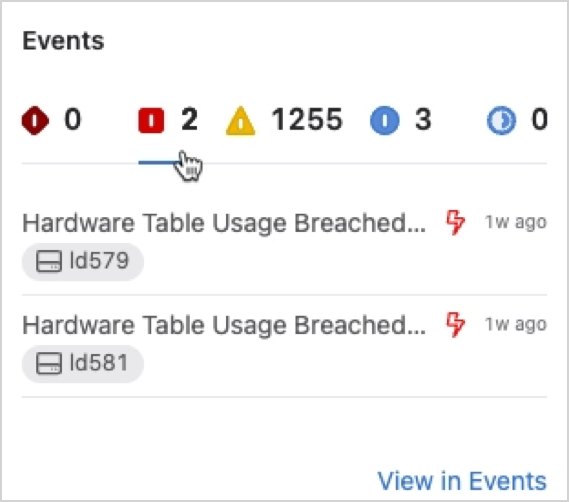
Events
The events panel displays events that are associated with devices that have been tagged with the security-domain: tag label or devices that are streaming traffic-policy configurations. Use the severity icons at the top of the panel to filter events by severity.
Figure 5. Events
Use the severity icons at the top of the panel to filter events by severity. Click View in Events for further event details.
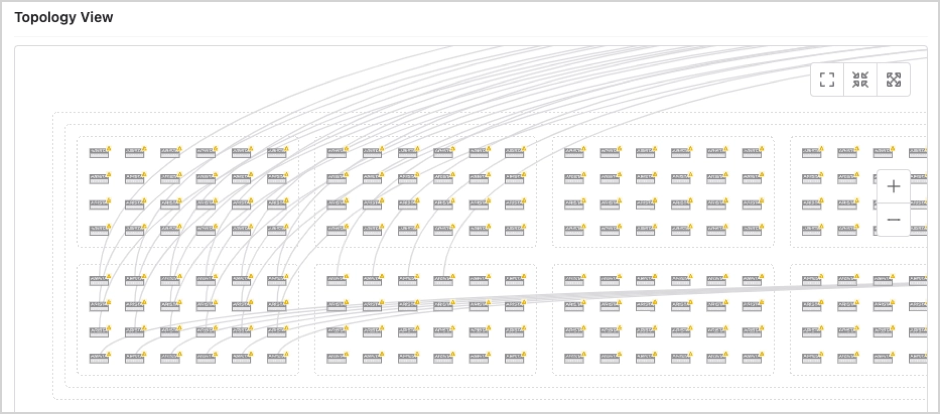
Topology View
View a topology of devices that have been tagged with the security-domain: tag label. The Topology View panel displays a topology including numerous devices. Use the icons to zoom to fit, expand, or collapse the topology view.
Figure 6. Topology View
Policy Logs
Policy Logs highlights changes to static and dynamically learned groups. The panel displays the 50 most recent changes from those that were made in the last 7 days.
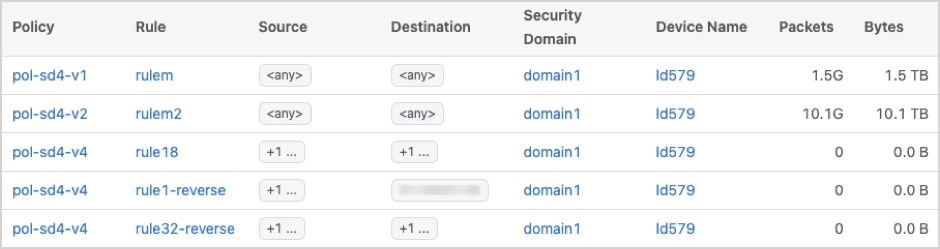
Policy Monitor
The Policy Monitor table provides packet and byte counts for security policy rules that have been pushed to devices.
Note: Counters shown in the Policy Monitor table are for traffic across all VRFs where the rule has been applied.
The Policy Monitor table shows 5 policy rules with relevant details, including packet and byte counts. Selecting a device name will take you to the device’s page in Inventory. Selecting a Policy, Rule, or Security Domain name will take you to the relevant tab in the Policy Manager.
Figure 7. Policy Monitor
Policy Manager
Policy Manager is where you’ll view the elements of security domain policies, including domains, policies, and groups. You’ll also review and accept dynamic groups that CloudVision has learned from onboarded data sources.
View Security Domain Policies
The Policy Manager is made up of five tables where you can view and sort domains, policies, rules, groups, and policy objects such as services, traffic monitors, and source and destination IP groups.
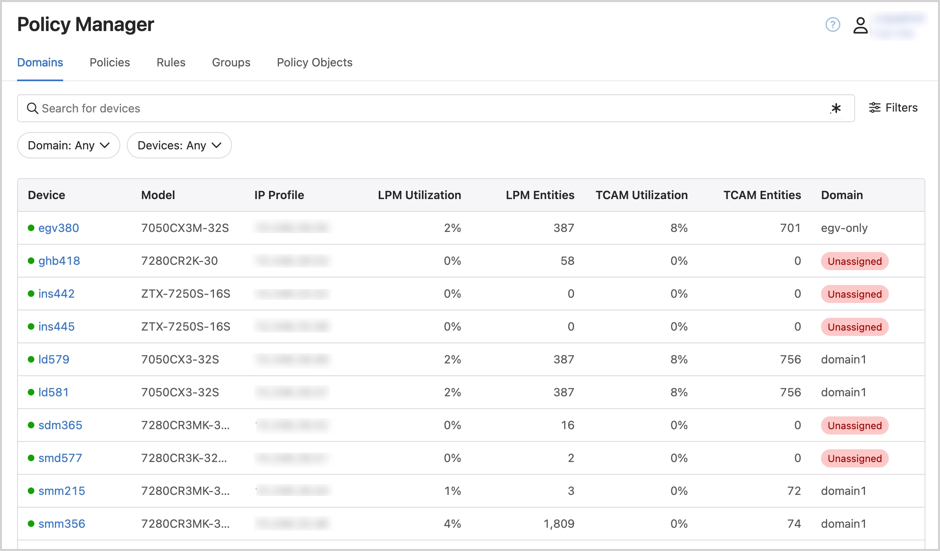
Domains
The Domains table includes a list of devices from your CloudVision device inventory. It provides details on device LPML and TCAM utilization rates. Utilization is provided both as a percentage and as a count of total entities used.
Note: The utilization percentage is not an average of capacity across all device chips. It represents capacity for the chip with the highest utilization. View utilization per device chip in Device Hardware Capacity.
Figure 8. Policy Manager - Domains
Devices that have been assigned to a security domain in the MSS Studio will include the domain name in the Domain column, while unassigned devices will be designated as Unassigned. ZTX monitor appliances will show as Unassigned.
Use the drop-downs to sort the table by security domain and by device. See relevant security domain details by clicking on the row of an assigned device.
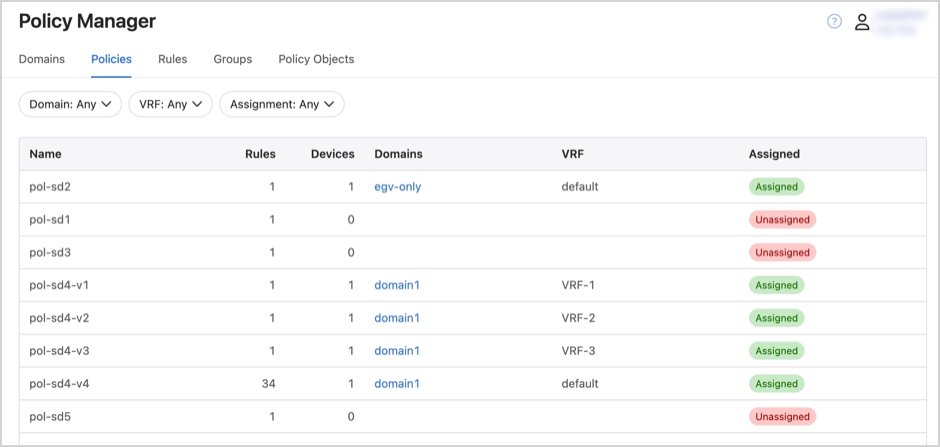
Policies
The Policies table includes a list of security policies configured in the MSS Studio. It provides an overview of the number of devices and rules that are included in each policy.
Policies designated as Assigned have been assigned to a security domain, while devices designated as Unassigned have not.
Figure 9. Policy Manager - Policies
Use the drop-downs to sort the table by security domain, VRF, and whether or not policies have been assigned.
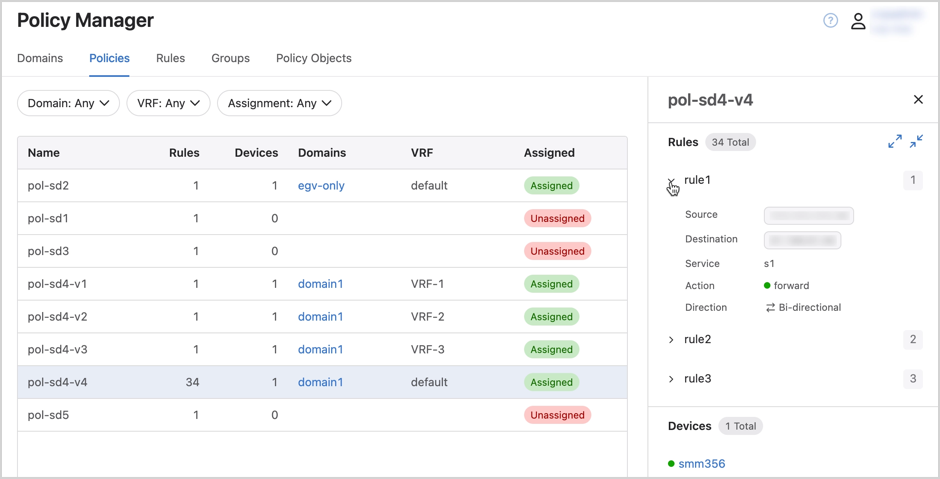
View a list of the rules included in a policy by clicking on the row of an assigned policy.
Figure 10. Policy Manager - Rule
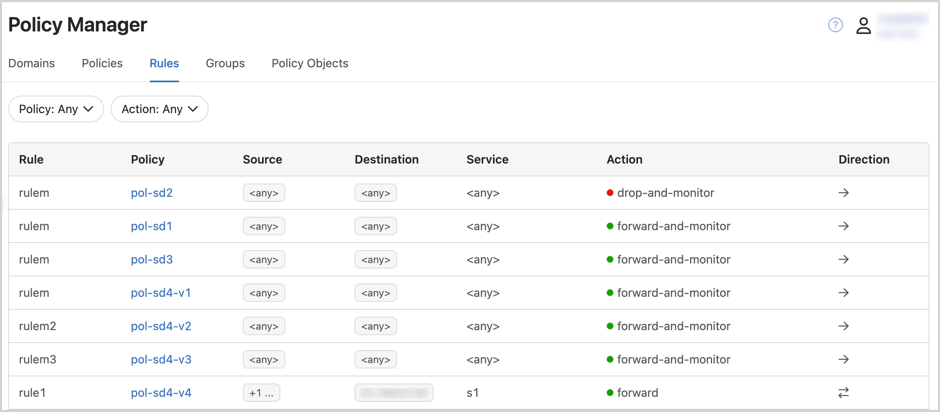
Rules
The Rules table includes all security policy and monitoring rules, including those that were statically configured in the MSS Studio and those that were recommended by CloudVision and accepted as part of a security policy.
Figure 11. Policy Manager - Rules
Use the drop-downs to sort the table by security policy and forwarding action.
Select any row in the table to view detailed lists of the policy objects included in the rule and the security policies that the rule is used in.
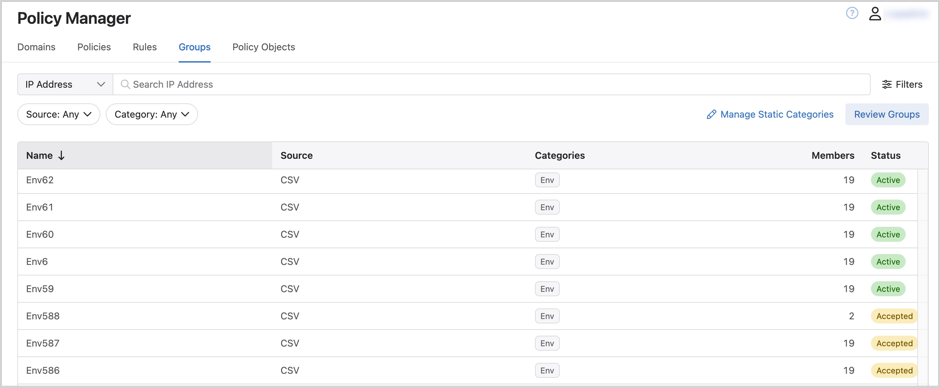
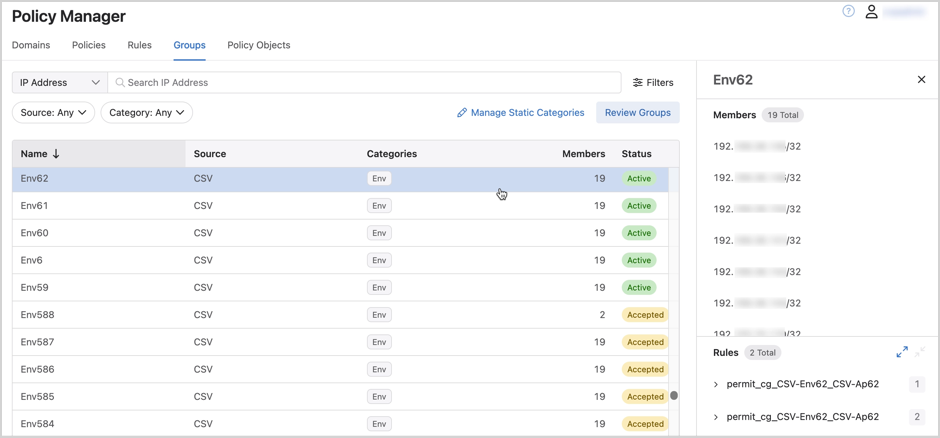
Groups
The Groups table includes a list of all groups, including those that were statically configured in the MSS Studio and those that were dynamically learned by external data sources and accepted for use in security policy configuration. It provides an overview of the group source, category, and number of members.
Groups designated as Active are being used in security policies, while groups designated as Accepted are not.
Figure 12. Policy Manager - Groups
Use the drop-downs to sort the table by group source and category.
View a list of group members and any policy rules that the group is included in by clicking on the row of an active policy.
Figure 13. Policy Manager - Group Members
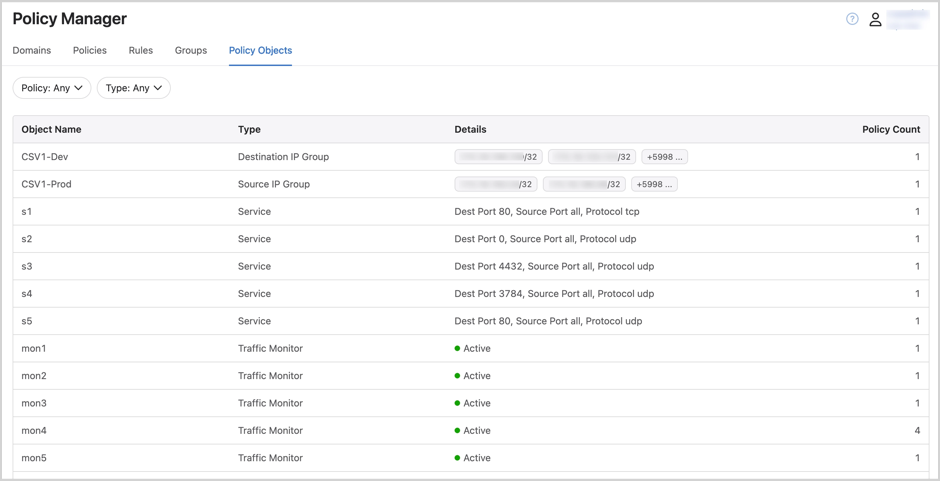
Policy Objects
The Policy Objects table includes a list of policy building blocks including destination IP groups, source IP groups, services, and traffic monitors. It provides an overview of the type of policy objects as well as their details and the number of policies that they’re included in.
Figure 14. Policy Manager - Policy Objects
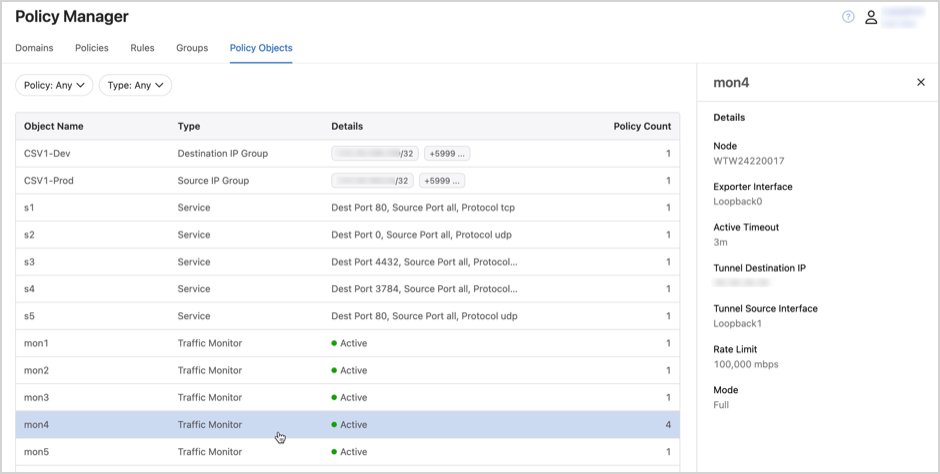
Use the drop-downs to sort the table by security policy and policy object type. Click on any row in the table to view a detailed list of the policies that the object is included in.
Figure 15. Policy Manager - Policy Objects Details
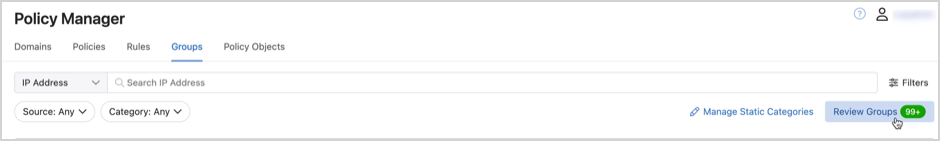
Review and Accept Dynamic Groups
Once you’ve onboarded data sources to CloudVision, you will be able to review dynamically learned groups in the Policy Manager.
From the Groups tab, click Review Groups.
Figure 16. Review Groups
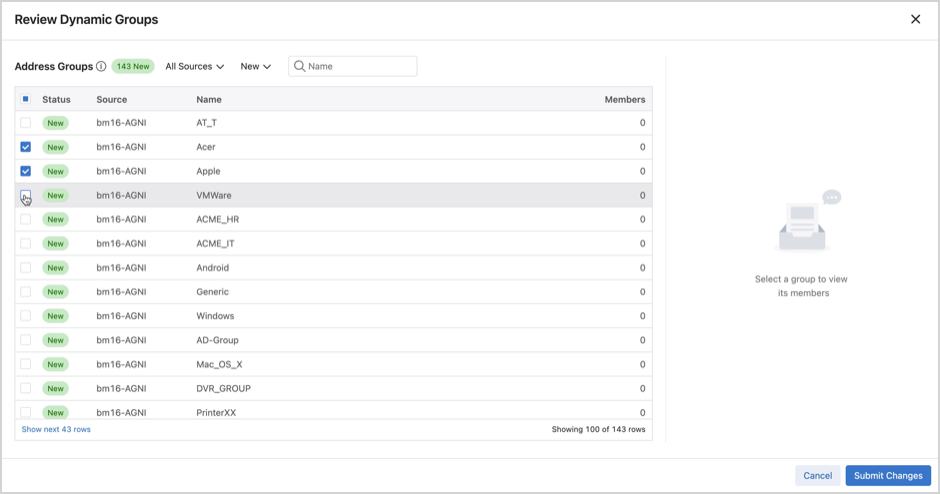
This launches a modal where you can review dynamically-learned groups.
Enable the checkbox next to groups to accept them.
Figure 17. Review Dynamic Groups
Tip: Clicking on any row in the table will allow you to view group members.
Groups that are not selected initially are categorized as Ignored. Ignored groups can be accepted during a subsequent review, provided that the review table is filtered to show All Statuses or Ignored, as shown below:
Figure 18. Review Dynamic Groups - Ignored
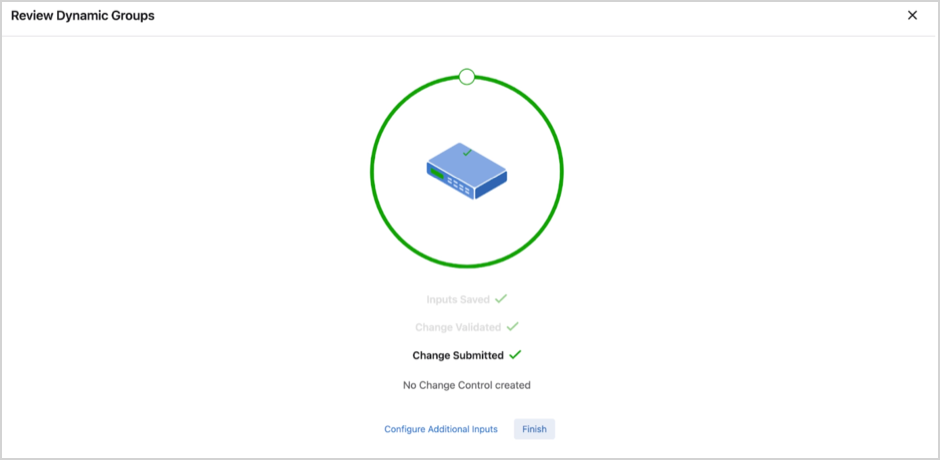
Click Submit Changes.
Once the changes have been validated, click Finish or Configure Additional Inputs to accept additional groups.
Figure 19. Review Dynamic Groups
If validation fails, you’ll have the option to manually review the changes.
Accepted groups will appear in the Groups table in Policy Manager and will be available for configuring rules in the MSS Studio.
Note: You can perform the same workflow of reviewing and accepting groups using the Review Dynamic Groups quick action in the MSS Studio.
Policy Monitor
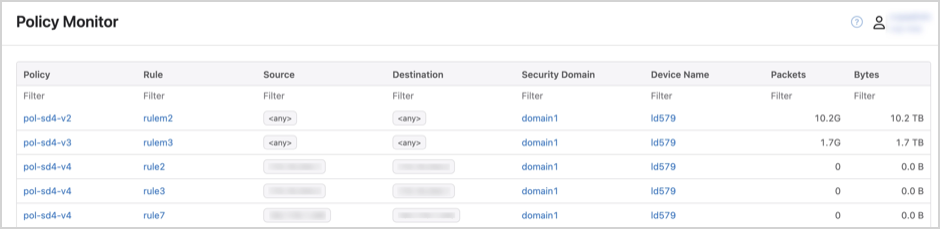
You’ll use Policy Monitor to view policy statistics, including packet and byte counts for security policies that have been pushed to devices.
Figure 20. Policy Monitor
Counters shown in the Policy Monitor are for traffic across all VRFs where the traffic policy has been applied.
Filter the table by device name, security domain, source, destination, rule, or by packet or byte count.
Clicking on a policy, rule, or security domain name takes you to the corresponding table in the Policy Manager. Clicking a device name brings you to the device’s page in Inventory.
Policy Builder
You’ll use the Policy Builder to generate and review security policy recommendations. After a monitoring rule is created for a security policy in the MSS Studio, the monitor node will conduct stateful traffic analysis. It sends session data back to CloudVision in order to map sessions to group-to-group communication. You’ll then be able to generate policy rules that can be reviewed, edited, deleted, submitted, or archived to be revisited at a later time. After you submit new policy rules, configuration changes will be pushed to all devices in the relevant security domain VRF.
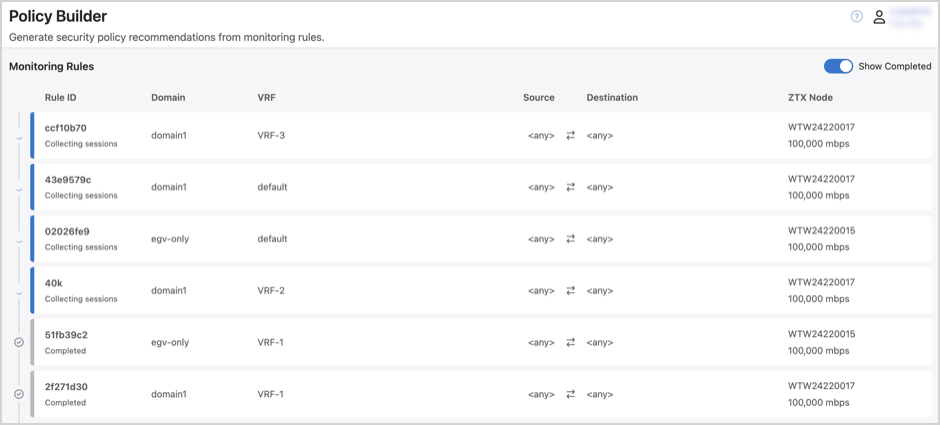
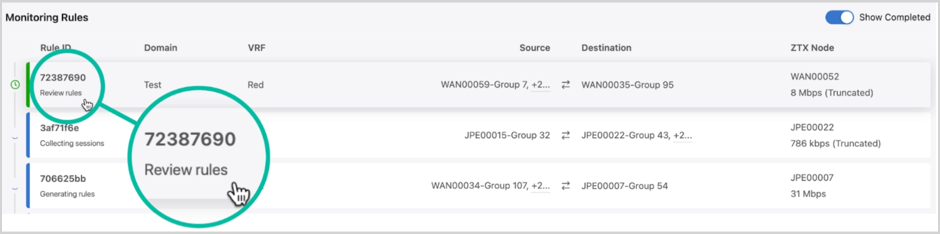
View Monitoring Rules
All monitoring rules that you have configured in the MSS Studio are available to view in Policy Builder.
Figure 21. View Monitoring Rules
Rules are categorized in the Monitoring Rules table according to their progress as follows:
Collecting Sessions: CloudVision is collecting sessions via the monitoring node
Generating Rules: In this temporary state, CloudVision is mapping sessions to group-to-group communication to generate security policy rule recommendations
Review Rules: Rule recommendations are ready for review and can be accepted, accepted with edits, or rejected
Completed: Policy recommendations have been reviewed and decisions made regarding implementation of the recommended rules
Tip: Monitoring rules marked as completed are hidden from the table by default but can be viewed by enabling the Show Completed toggle shown above.
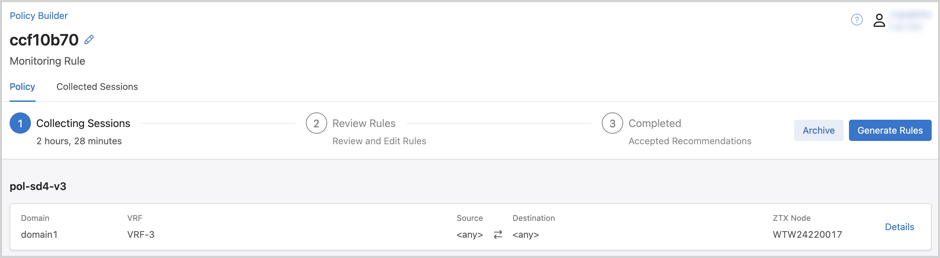
Click on any monitoring rule in the Policy Builder table to view monitoring rule details and progress.
Figure 22. Monitoring Rule
Optionally, click the Edit to rename the monitoring rule.
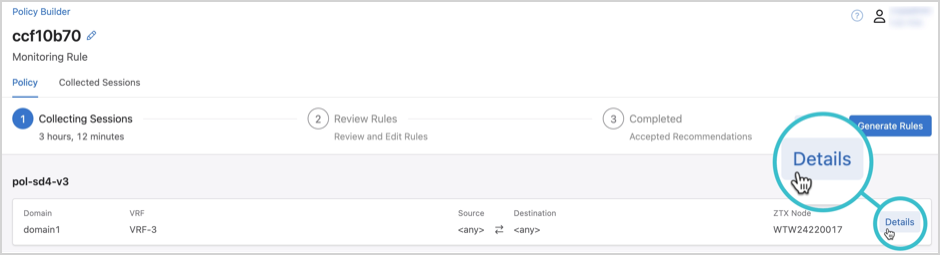
Monitoring Rule Details
Click Details under the Policy tab.
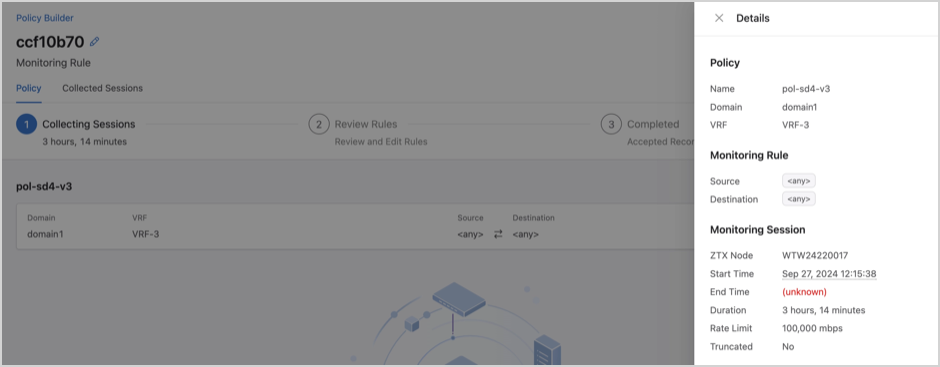
Figure 23. Monitoring Rule Details
This opens a drawer that includes the monitoring rule and monitoring session details.
Figure 24. Monitoring Rule Details
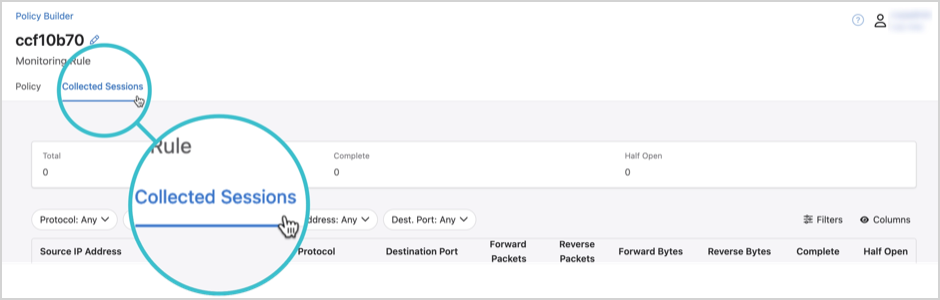
Monitoring Rule Progress
Monitoring rule progress is shown in the Policy tab, including the duration that the monitoring node has been collecting traffic sessions. In the image below, for example, the node has been collecting sessions for 13 hours and 46 minutes.
Click the Collected Session tab to view the sessions.
Figure 25. Collected Sessions
A summary of all collected sessions highlights the total number of sessions, as well as the number of sessions that are complete and half open. A half-open session indicates that only one-way communication has been observed and there has been no response yet from the destination IP address.
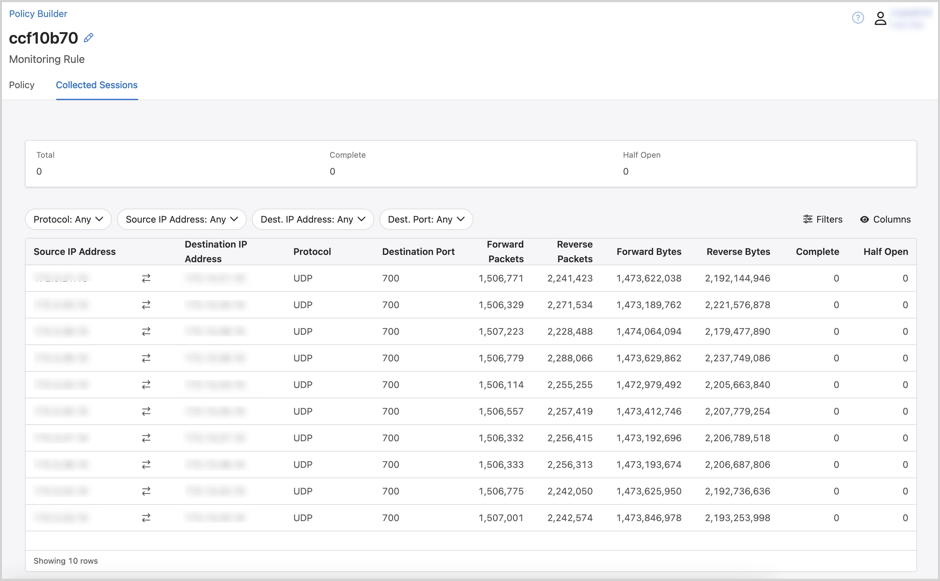
Individual sessions are listed in the table with forward and reverse pack and byte counts.
Figure 26. Individual Sessions
Generate Security Policy Rules
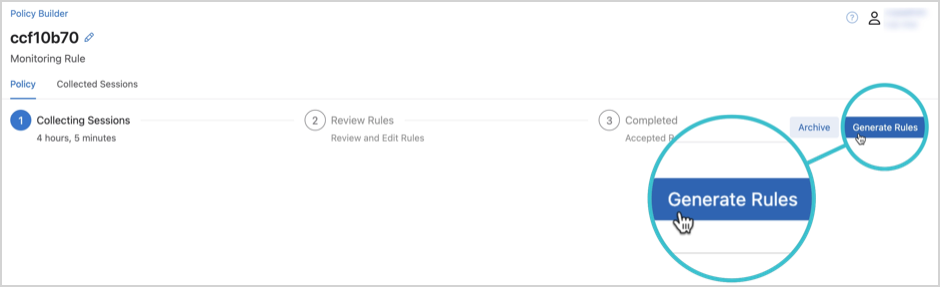
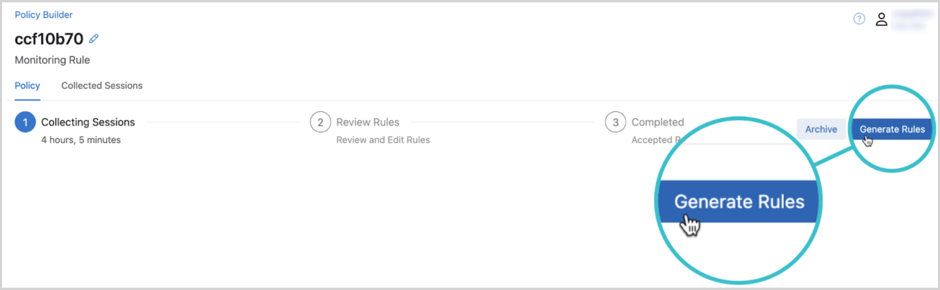
After a monitoring rule has collected sessions, you’ll be able to generate security policy rule recommendations.
Click on a monitoring rule that is collecting sessions.
Click Generate Rules.
Figure 27. Generate Rules
Note: The monitor node will continue to collect sessions for a configured monitoring rule until the rule has been deleted from the domain policy in the MSS Studio. The Generate Rules button is enabled once a single session has been collected. You can view the elapsed time for session collection under the Policy tab, shown above, and the sessions themselves under the Collected Sessions tab in order to determine when to generate rules.
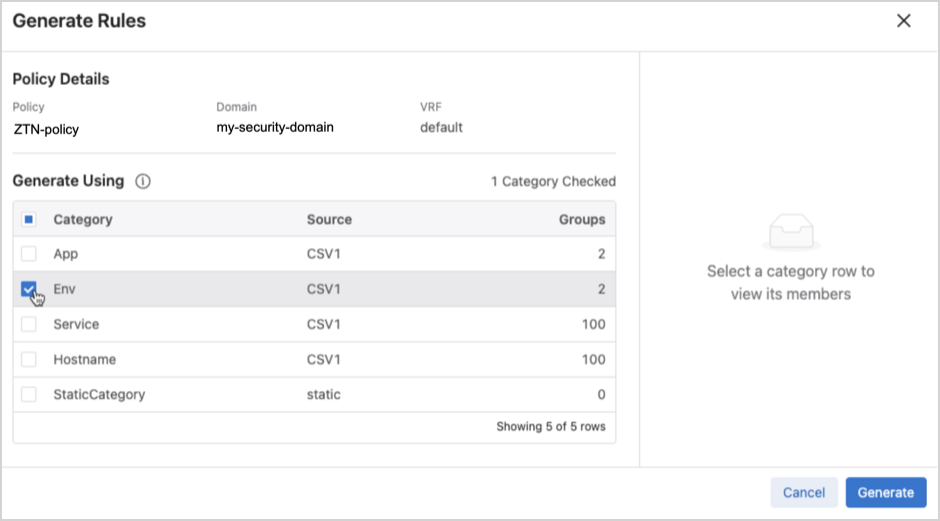
Select categories to generate security policy rules by enabling the relevant checkboxes in the modal.
Figure 28. Groups
Tip: Clicking on a row in the Generate Rules modal will enable you to view the address groups included in the category, as shown above.
Click Generate.
Note: On average it takes 5-10 minutes for CloudVision to generate security policy rules, but could take longer.
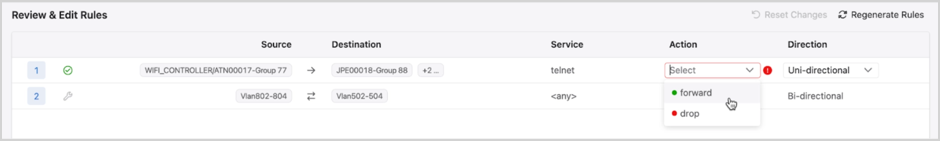
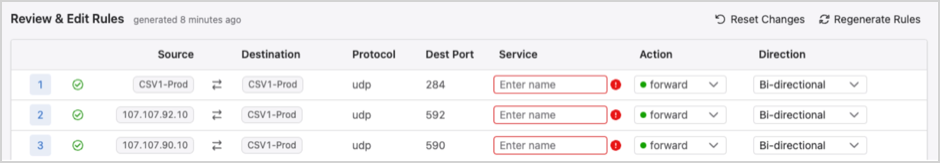
Review Security Policy Rules
After CloudVision has generated security policy recommendations for a monitoring rule, it will be reclassified in the Monitoring Rules table and “Review rules” will appear below the Rule ID.
You can click on any monitoring rule with this designation to review security rule recommendations.
Figure 29. Review Rules
Review security rule recommendations.
You’ll use the available drop-downs and icons to remove or edit rule recommendations. Drag and drop rules to reorder them in relation to each other and to existing security policy rules.
As shown below, some rules may require you to select an appropriate service, action, direction, or a combination of these in order to submit it.
Figure 30. Review Rule - Edit
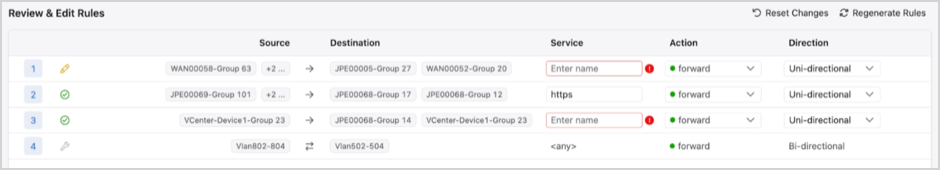
Icons that appear next to the rule order number indicate whether the rule was recommended, recommended and edited, or created in the MSS Studio.
Figure 31. Review Rule - Edit
Note: While editing rules you can also reset changes or regenerate rules. You’ll regenerate rules to change the categories you’re generating security rules for.
Click Submit Rules.
Figure 32. Submit Rules
Note: After submitting the rules, Policy Builder archives the session. View archived sessions using Show Completed Sessions.
This creates a change control that is auto-approved and auto-executed, pushing the new configuration to devices in the security domain VRF.
Optionally, click Archive to mark the rule as Completed and store it. Archived rules can be viewed but are not actionable.
Policy Logs
Policy Logs provides an at-a-glance view of recent changes to externally-configured MSS groups. Logs are generated when a group from an onboarded data source is added, deleted, or changed at the source. Changes include member prefixes being added or removed.
Figure 33. Policy Logs
Filter the table by Timestamp, Source Type, Source Name, Message, or Severity.
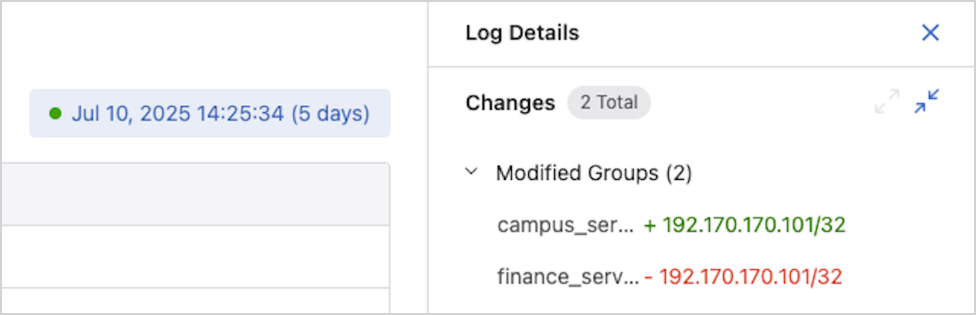
Selecting a table row opens a side panel with log details, including the relevant group or groups and the associated changes. View logs for a selected time period by using the Timepicker.
Figure 34. Log Details
Time Picker
Use the time picker UI element to adjust the time frame for viewing historical data. Use the predefined time interval or customize it to show broader or more granular information.
The time picker can be found at the bottom of pages that display metrics. Use it to view device information, dashboard metrics, or broader topology data.
Adjusting the Time
By default, the time picker shows you information in live time. Selecting Live returns the pointer to the current time.
MSS Studio
Use the MSS Studio to define static groups and policy rules for your security domain or domains and to configure traffic monitoring that allows CloudVision to generate security policy recommendations in the Policy Builder.
Create a Zero Trust Network with MSS
CloudVision’s Multi-Domain Segmentation Service (MSS) gives you the building blocks to easily implement a zero trust network. Zero trust networking minimizes lateral movement by segmenting the network into increasingly smaller perimeters. Within these, communication between endpoints is governed by custom forwarding rules and only approved connections are permitted.
Leverage MSS tools like the Policy Manager, Policy Builder, and MSS Studio to make the zero trust microsegmentation and enforcement process simple and effective. CloudVision MSS automates the management of microperimeters by connecting to external sources and dynamically identifying and tagging endpoints and workloads. The service maps all communications within the network, giving you complete visibility into existing traffic flows. The observed traffic map becomes the basis for security policy recommendations that permit only trusted communications. MSS pushes zero trust policies to EOS devices, which distribute enforcement themselves or redirect traffic to a third-party firewall. Once the zero trust policies are deployed, MSS can monitor for policy violations and new traffic to help you keep your network safe and traffic rules up-to-date.
In the workflow outlined here, you’ll use the Policy Builder to monitor traffic and incrementally build an allow list. Start by defining coarse security policy rules and move toward implementing more granular ones. Once the allow list is established, you will implement zero trust by creating a rule to monitor and drop all east-west traffic that is not explicitly permitted by the security policy rules.
The Policy Builder generates policy rule recommendations to help you build the allowlist for your zero trust network. Before you can review recommendations, you will need to complete some preliminary steps using MSS Studio and Policy Manager.
Note: If the End-to-End Provisioning toggle is enabled in General Settings > Features, newly-onboarded devices will automatically be available to be registered for use in Studios.
Onboard any data sources that you will use to define groups.
Supported data sources include Arista’s network identity service AGNI, VMware vCenter, configuration management databases (CMDBs) like ServiceNow, and CSV files.
Accept groups discovered from onboarded data sources in the Policy Manager.
Create a new or open an unsubmitted Studios workspace to configure a security domain, security policy, monitor object, and static groups in the MSS Studio.
Security Domain: Enter a relevant security domain name in Security Domains and assign devices to the domain.
Security Policy: Create a policy name and associate it with the relevant VRF in Security Domains. you will configure policy rules later.
Note: If you have multiple VRFs in your domain, you will need to create a security policy for each VRF.
Monitor Object: Enter relevant data about the onboarded ZTX Traffic Mapper appliance and connected TOR devices in order to open monitoring sessions between the monitoring node and EOS devices.
Note: MSS allows one monitor object per security domain. Therefore, multiple security domains require multiple monitor objects.
Static Groups: Configure groups by IP prefix. To start with, you must configure an “internal-networks” group that includes all internal subnets in the VRF.
You’re now ready to create the monitoring rule that will allow the Policy Builder to generate policy rule recommendations.
Configuring Monitoring Rules
Create a rule that forwards mirrored east-west traffic to the monitor node. The monitor node will then begin collecting session data to create a traffic map. The Policy Builder will use the map to recommend policy rules relevant to your network.
Note: If there are multiple VRFs in your security domain, you will configure a monitoring rule for each VRF.
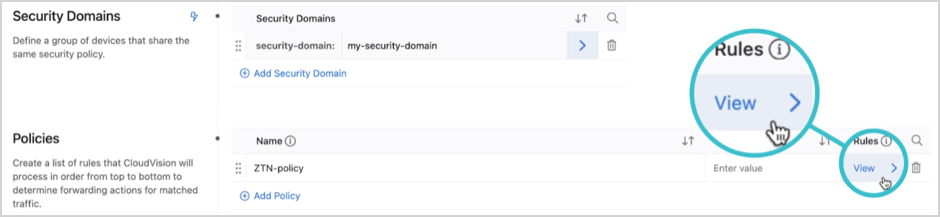
Click View to configure rules for the policy that you associated with the domain VRF.
Figure 35. Security Domains
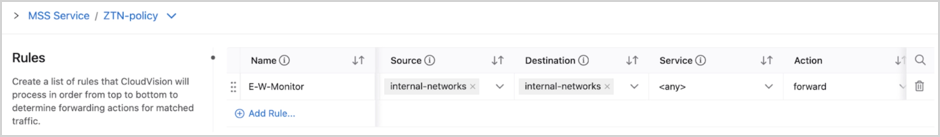
Click Add Rule to configure the monitoring rule for east-west traffic.
Note: As you continue to add rules, the east-west monitoring rule needs to remain the last rule in the policy rule list.
Figure 36. MSS Service ZTN Policy
Name: Create a name to identify the monitoring rule.
Description: Optionally, enter a rule description.
Source: Select the internal-networks group that you configured in Static Groups.
Destination: Select the internal-networks group that you configured in Static Groups.
Service: Select any.
Action: Select forward.
Direction: Select Unidirectional.
Monitor Name: Select the name of the monitor object that you configured in Monitor Objects.
Review and submit the workspace to push the configuration to all devices in the relevant security domain.
The ZTX Traffic Mapper monitor node will begin collecting session data from mirrored east-west traffic for you to review in the Policy Builder. North-south traffic not governed by the monitoring rule will be forwarded as normal.
Configuring Security Policy Rules
View sessions from traffic mirrored to the ZTX Traffic Mapper monitor node and begin to configure security policy rules for your zero trust network. You will begin by generating, reviewing, and editing coarse rules and proceed incrementally to more granular ones. This typically means starting with rules to govern forwarding among environments and moving toward rules that manage traffic among applications.
Tip: View Policy Builder documentation for details on how to view collected sessions and generate and review policy rule recommendations.
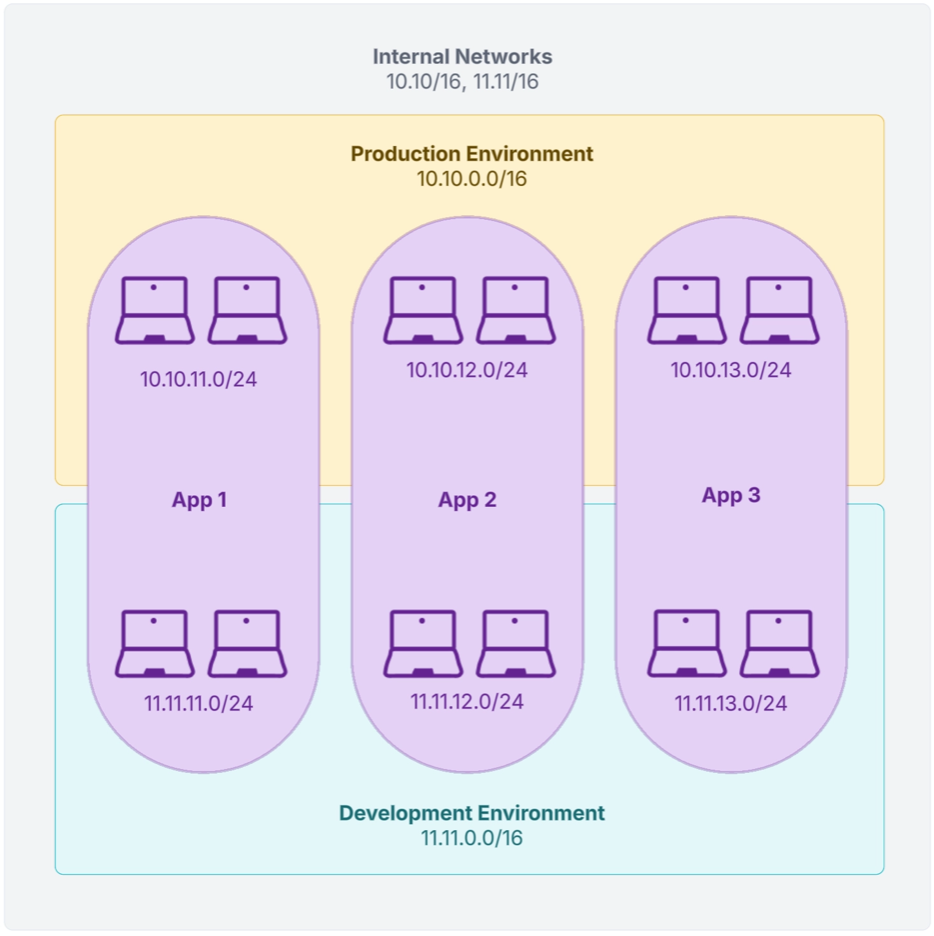
As an example, imagine you have a security domain whose internal networks are made up of two environments, production and development, and three applications. These might be email clients, web browsers, or other software applications.
Figure 37. Security Domain Example
In this case, you will have groups that represent the internal networks, the production environment, the development environment, and each of the three applications. More granularly, you will have groups that represent endpoints that may be part of the same application, but different environments. Examples include, App1-Prod, App1-Dev, etc.
These groups will have been statically-defined in the MSS Studio or dynamically discovered using onboarded data sources and accepted in the Policy Manager for use in configuring security policy rules.
Generating Coarse Rules
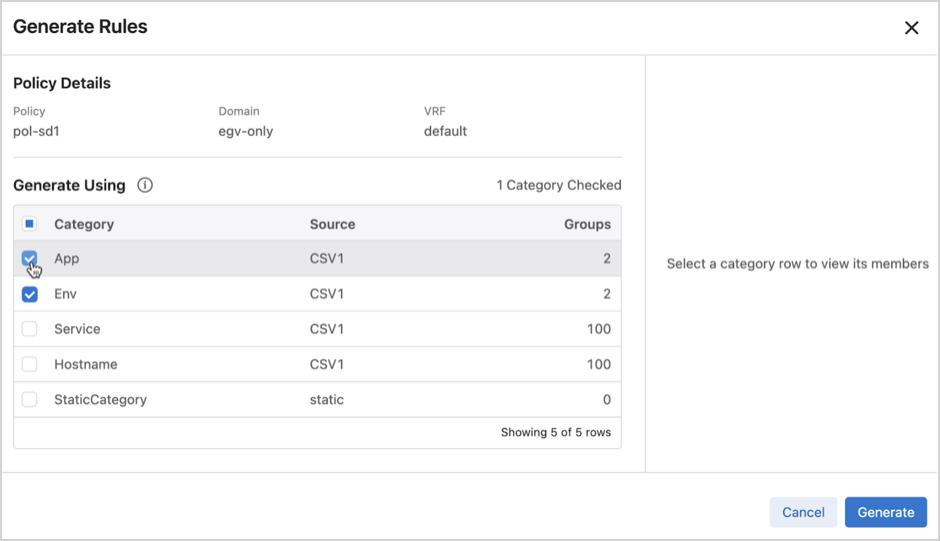
Once the monitoring rule has collected sessions, you can generate rules. Begin by generating rules that regulate traffic between environments.
Click on the monitoring rule in the Policy Builder.
Click Generate Rules.
Figure 38. Generate Rules
Select the category that represents internal network environments.
Figure 39. Generate Rules Internal Network
Click Generate.
The Policy Builder will generate policy rule recommendations.
Use the icons, drop-downs, and input fields provided to edit and accept or delete policy rule recommendations.
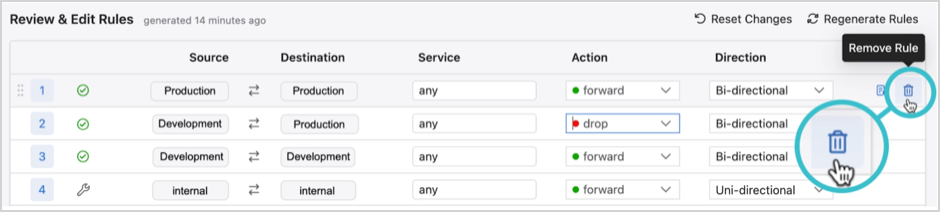
Figure 40. Review & Edit Rules
At this stage, edit and accept only broad environment rules.
Using the sample security domain, assume that you want to allow all endpoints in the development environment (11.11.0.0/16) to talk to one another, but you want to restrict traffic between development and production (10.10.0.0/16).
You can expect the Policy Builder to generate rules for production-production traffic, development-production traffic, and development-development traffic.
Tip: If the Policy Builder doesn’t generate appropriate rule recommendations, click Regenerate Rules in the Review & Edit Rules header for new recommendations.
Figure 41. Remove Rule
Production to Production: Delete the production-to-production rule recommendation.
Allow the default forwarding rule for east-west traffic to forward this traffic. Later, you will add additional granularity to production environment forwarding by configuring rules at the application level.
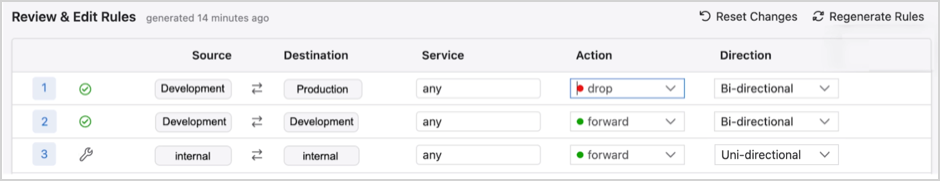
Development to Production: Edit and accept the development-to-production rule recommendation to restrict traffic between the two environments by selecting the following inputs.
Service: any
Action: drop
Direction: Bi-directional
Development to Development: Edit and accept the development-to-development rule recommendation to allow all endpoints to communicate freely with one another by selecting the following inputs.
Service: any
Action: forward
Direction: Bi-directional
Order rules appropriately.
New environment rules should precede the Internal (internal-networks) monitoring rule, as shown below.
Figure 42. Environment Rules
At this stage, only production-to-production traffic is mirrored to the ZTX Traffic Mapper monitor node in order to generate rules for the production environment with application-level granularity.
As rules are refined, traffic governed by rules with higher precedence than the monitoring rule is offloaded from the ZTX Traffic Mapper monitor node.
Generating Granular Rules
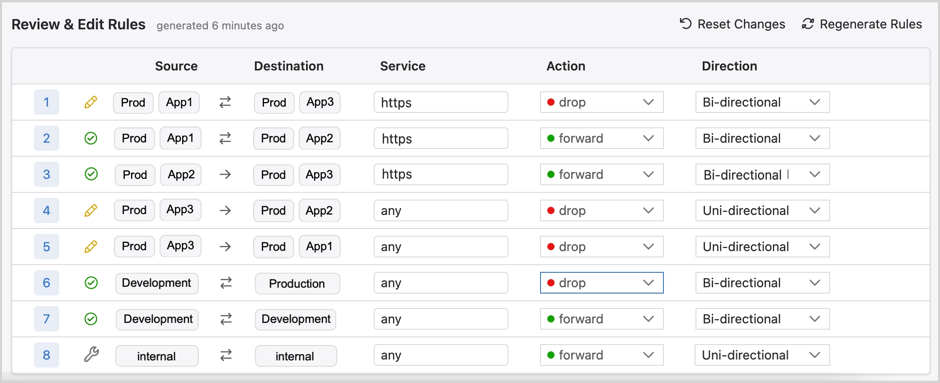
Once you’ve configured coarse, environment-level rules, you will begin generating and editing more granular policy rule recommendations to govern traffic between applications.
Follow steps 1- 4 of the workflow for generating coarse policy rule recommendations, but select the categories that correlate to internal network applications.
Figure 43. Granular Rules
Just like before, you will use the icons, drop-downs, and input fields provided to edit and accept or delete policy rule recommendations.
Using the sample security domain, assume that you want to govern production environment traffic to explicitly:
Restrict App 1 from communicating with App 3 using https.
Allow App 1 to communicate with App 2 using https.
Allow App 2 to communicate with App 3 using https.
Restrict App 3 from initiating communication with App 1 or App 2.
To do so, you will want to edit and accept policy rule recommendations as shown below:
Note: If you’ve configured a service in the MSS Studio by defining its protocol and port, the Policy Builder will identify the service accordingly in its recommended rules. If a protocol and port has no configured service name, then you can provide one directly in the recommended rule by entering a name in the Service field.
Figure 44. Regenerate Rules
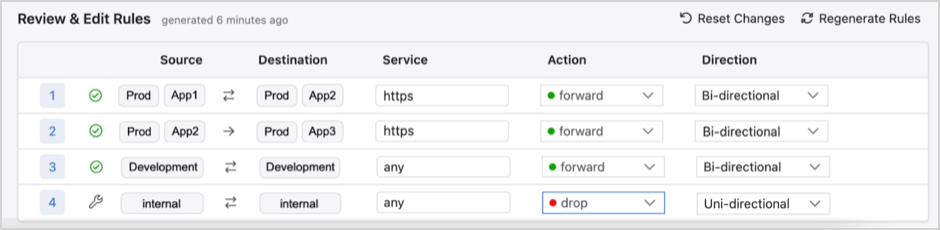
Production-App1 to Production-App3:
Service:https
Action:drop
Direction:Bi-directional
Production-App1 to Production-App2:
Service:https
Action:forward
Direction:Bi-directional
Production-App2 to Production-App3:
Service:https
Action:forward
Direction:Bi-directional
Production-App3 to Production-App2:
Service:any
Action:drop
Direction:Uni-directional
Production-App3 to Production-App1:
Service:any
Action:drop
Direction:Uni-directional
Order rules appropriately. CloudVision processes rules sequentially, so it’s important to consider rule order. The default east-west monitoring rule should remain in the last position.
Incrementally create more granular rules to govern forwarding of east-west network traffic. As rules are refined, traffic governed by rules with higher precedence than the monitoring rule is offloaded from the ZTX Traffic Mapper monitor node. Once all rules are in place, you can enable your zero trust network.
Implementing Zero Trust
Implementing zero trust is an optional step that can be taken once you are confident that you’ve explicitly allowed all trusted traffic. A zero trust network grants explicit permission only to known trusted traffic and mirrors only untrusted traffic to the ZTX Traffic Mapper monitor node, which should be assessed on an ongoing basis in the Policy Builder.
Edit the monitoring rule to implement zero trust.
Change the action in the Internal (internal-networks) monitoring rule. Replace forward with drop.
This drops, but continues to monitor, all traffic that isn’t governed by forwarding rules.
Optionally, eliminate drop rules, as the default behavior for the monitoring rule is to drop all traffic that isn’t explicitly allowed.
In this case, the final allow-list for the sample network would appear as follows:
Figure 45. Drop Rules
Note: Eliminating drop rules creates a simple allow-list for network traffic, but increases traffic mirrored to the monitor node.
Once the allowlist is in place, continue to monitor dropped traffic mirrored to the ZTX Traffic Mapper monitor node. As needed, generate new rule recommendations in the Policy Builder to explicitly permit new, trusted traffic.
 Tip: Clicking on any row in the table will allow you to view group members.Groups that are not selected initially are categorized as Ignored. Ignored groups can be accepted during a subsequent review, provided that the review table is filtered to show All Statuses or Ignored, as shown below:
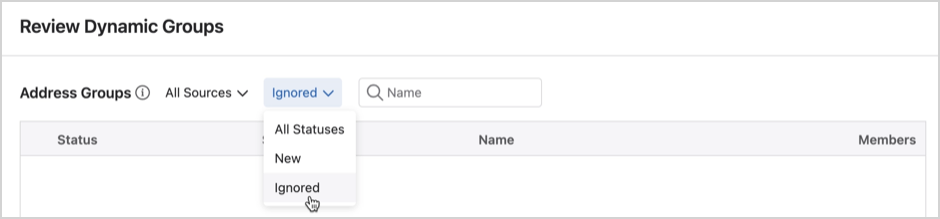
 Note: The monitor node will continue to collect sessions for a configured monitoring rule until the rule has been deleted from the domain policy in the MSS Studio. The Generate Rules button is enabled once a single session has been collected. You can view the elapsed time for session collection under the Policy tab, shown above, and the sessions themselves under the Collected Sessions tab in order to determine when to generate rules.
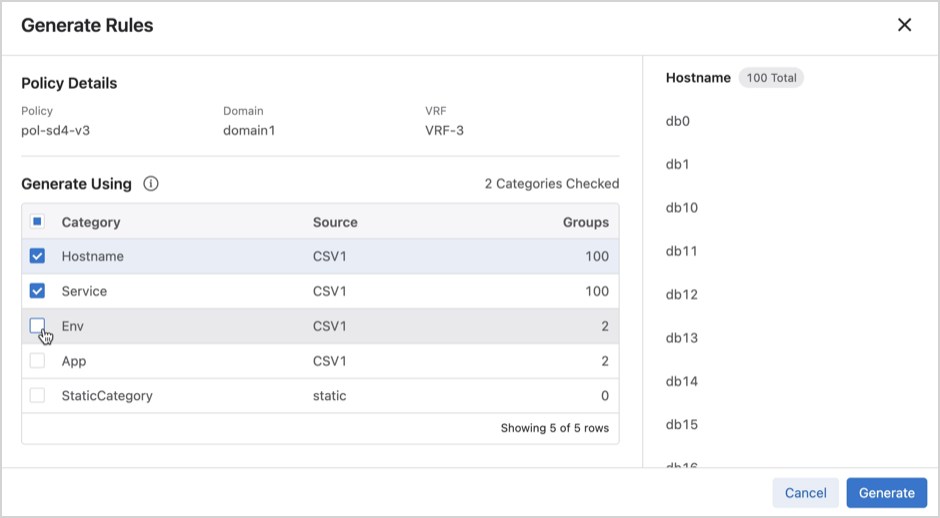
 Note: While editing rules you can also reset changes or regenerate rules. You’ll regenerate rules to change the categories you’re generating security rules for.
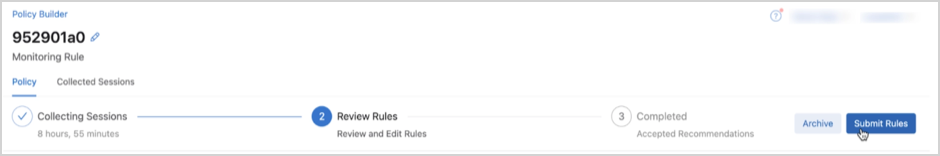 Note: After submitting the rules, Policy Builder archives the session. View archived sessions using Show Completed Sessions.
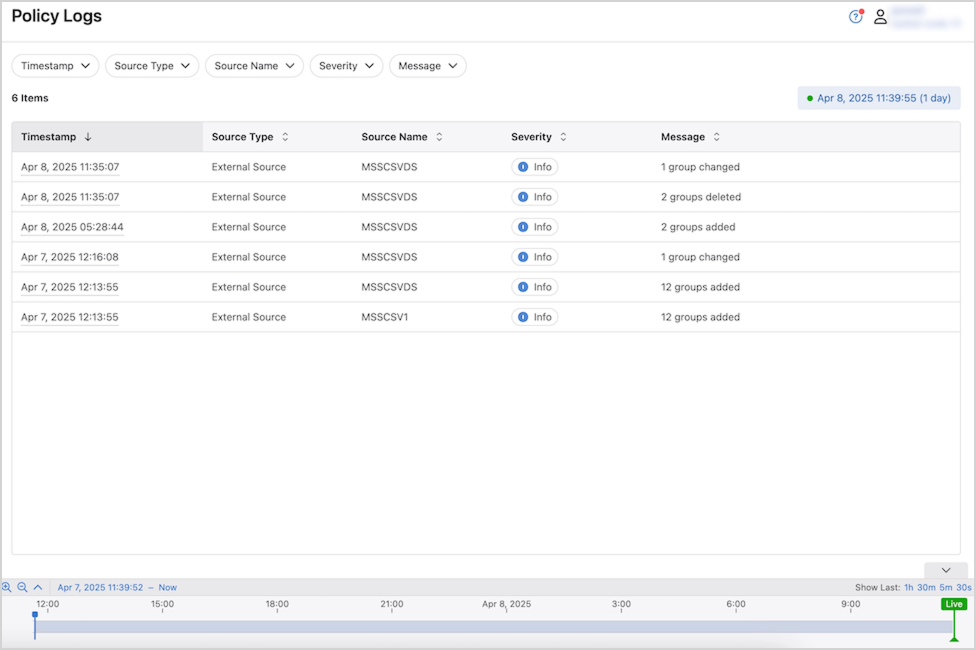
 Note: Eliminating drop rules creates a simple allow-list for network traffic, but increases traffic mirrored to the monitor node.