Pervasive, Context-driven Network Observability
DANZ Monitoring Fabric (DMF) is a next-generation network packet broker (NPB) architected for pervasive, organization-wide visibility and security, delivering multi-tenant monitoring-as-a-service. DMF enables IT operators to pervasively monitor all user, device/IOT and application traffic (north-south and east-west) by gaining complete visibility into physical, virtual and container environments. Deep hop-by-hop visibility, predictive analytics and scale-out packet capture — integrated through a single dashboard — enables simplified network performance monitoring (NPM) and SecMon workflows for real-time and historical context, delivering a one-stop visibility solution for on-premise data centers, enterprise campus/branch and 4G/5G mobile networks.
To learn more, download the DMF Datasheet or test drive online at DMF Labs.
Featured Video: DANZ Monitoring Fabric - Explained
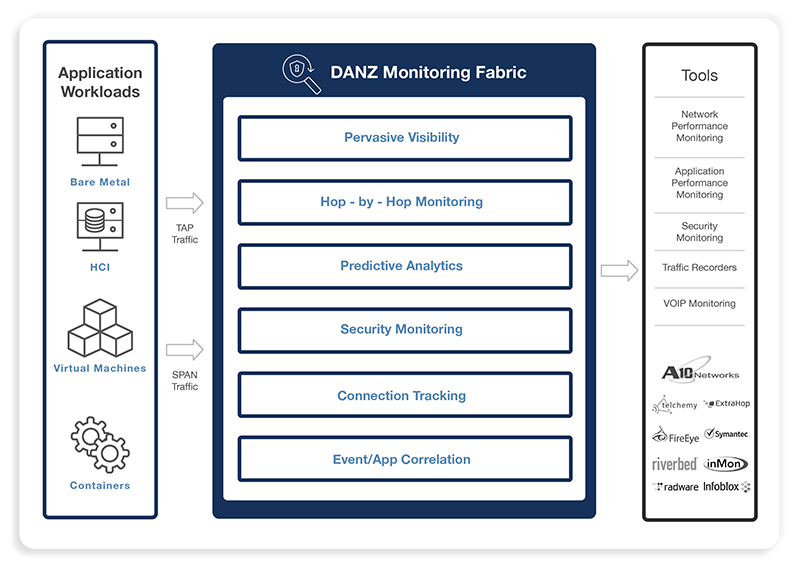
DMF Architecture - Modular, Flexible, Scalable Monitoring Fabric
DANZ Monitoring Fabric (DMF) is a next-generation network packet broker (NPB) architected for pervasive, organization-wide visibility and security, delivering multi-tenant monitoring-as-a-service. DMF enables IT operators to pervasively monitor all application traffic by gaining complete visibility into physical, virtual and cloud environments. Deep hop-by-hop visibility, predictive analytics and scale-out packet capture — integrated through a single dashboard — enables simplified network performance monitoring (NPM) and SecMon workflows for real-time and historical context, delivering a one-stop visibility solution for on-premise data centers, enterprise campus/branch and 4G/5G mobile networks.
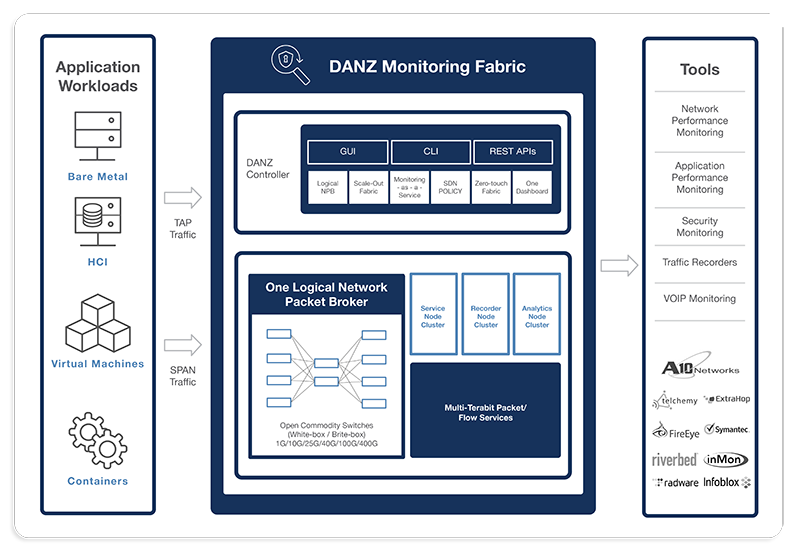
DMF leverages cloud principles to architect a new class of Network Packet Brokers (NPBs) for pervasive hybrid-cloud visibility. Powered by software defined networking (SDN) controls, DMF provides a scale-out fabric design based on merchant silicon hardware, with integrated analytics and packet recording intelligence. Advanced traffic processing functions, including regex filtering, deduplication, slicing, masking, flow data generation/collection and application recognition are provisioned through a single DMF fabric controller. Traffic can be aggregated and load-balanced to centrally located tools. Policies can be applied fabric-wide. And troubleshooting can be performed with a few clicks. DMF also provides role based access controls, event thresholds and alerts, application dependency mapping, and machine learning for comprehensive, predictive insights.
Traditional Network Packet Broker vs. DANZ Monitoring Fabric
Traditional Network Packet Broker
- Box-by-box operations.
- Scale-up, hardware-constrained design.
- Chassis refresh extremely complex.
- Limited functions, need 3rd-party tools.
- Proprietary, vendor lock-in.
- Expensive.
DMF - One Logical Network Packet Broker
- Zero-touch fabric operations via DMF controller.
- Scale-out, universal fabric design.
- Fabric modularity simplifies change management.
- Integrated analytics and recorder functions.
- Multi-vendor.
- Ethernet and x86 Economics.
DMF Experience - Modular, Automated, Insightful
App or Network Issue?
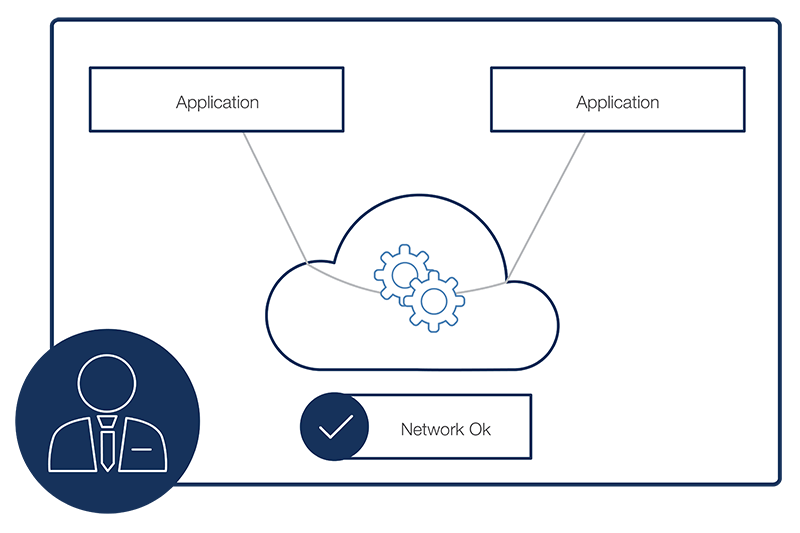
Rapid root cause analysis for maximum uptime
- Centralized hop-by-hop troubleshooting to dramatically reduce network “mean time to innocence”.
- Enables application-aware drill-down to pinpoint unexpected connectivity issues, due to increased latency or packet drops.
- Integrates real-time and historical analytics for contextual insights on application trends.
- Uncovers network hotspots with extensive dashboard views for rapid root-cause analysis.
Empower IT with Network Time Machine
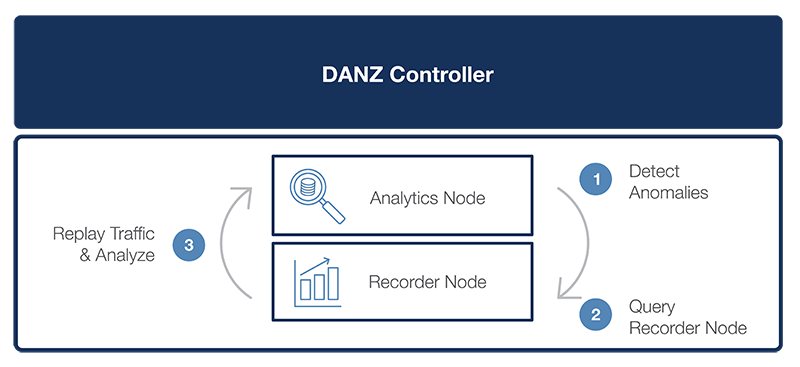
Record and replay for security and performance monitoring
- Integrates real-time analytics with record and replay of app/network traffic, for comprehensive security and performance monitoring.
- Empowers NetOps/SecOps with simplified end-to-end workflows driven by a single GUI dashboard.
- Modern, scale-out architecture delivers plug-and-play extensibility for increased capacity and performance.
- Presents richer and actionable insights by rapidly correlating real-time events with historical data.
Predictive Analytics for Autonomous IT
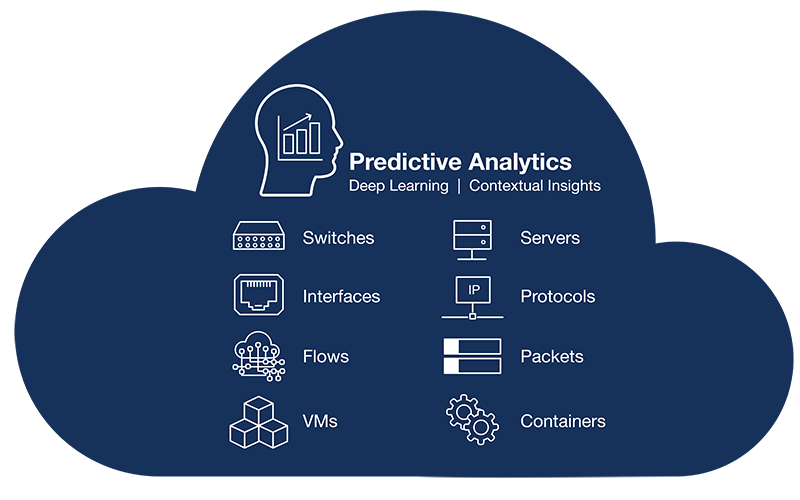
Deep learning for automated IT operations and insights
- Leverages Machine Learning and advanced statistical modeling for predictive network and application analytics.
- Telemetry through event-driven analytics and real-time network state enables automatic detection of security and performance anomalies.
- Intelligent alert and notification engine provides real-time issue tracking and dramatically improves “mean time to resolution”.
- Simplifies capacity planning by revealing hidden network data patterns via historical, real-time and predictive dashboards.
DMF Visibility - Application-Aware, Latency-Aware, Flow-Aware
Application Dependency Mapping for Enhanced Reachability Analysis
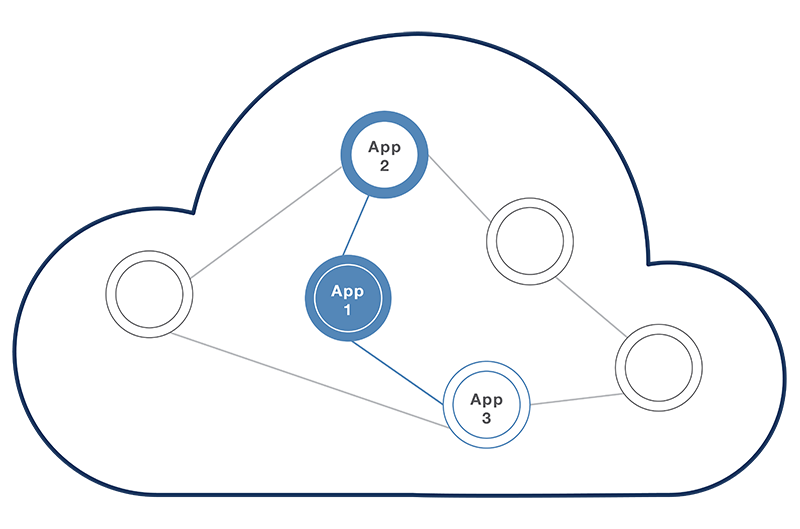
Visualizations for app-to-app communications
- Discovers, visualizes and optimizes critical business service dependency mapping to minimize adverse business impact.
- Drives troubleshooting agility by visualizing application dependency mapping to locate service performance issues.
- Streamlines application service capacity planning by identifying choke points leveraging ADM with historical data.
- Automatically detects and alerts application service.
Scale-Out Network Performance Monitoring
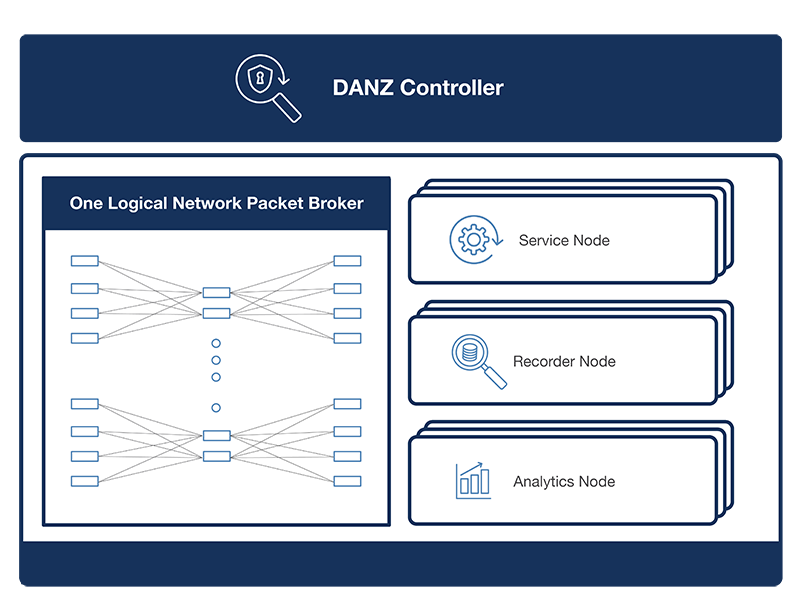
On-demand traffic visibility at any scale
- Scale-out network visibility with integrated deployment of analytics nodes, service nodes, and recorder nodes.
- Institutes a “Build as you grow” model leveraging horizontal scale-out fabric architecture using industry- standard switches and servers.
- Simplifies visibility and security with scale-out automation for workload monitoring.
- Eliminates tool silos by centralizing tool farms leveraging one logical network packet broker.
Comprehensive Flow Intelligence
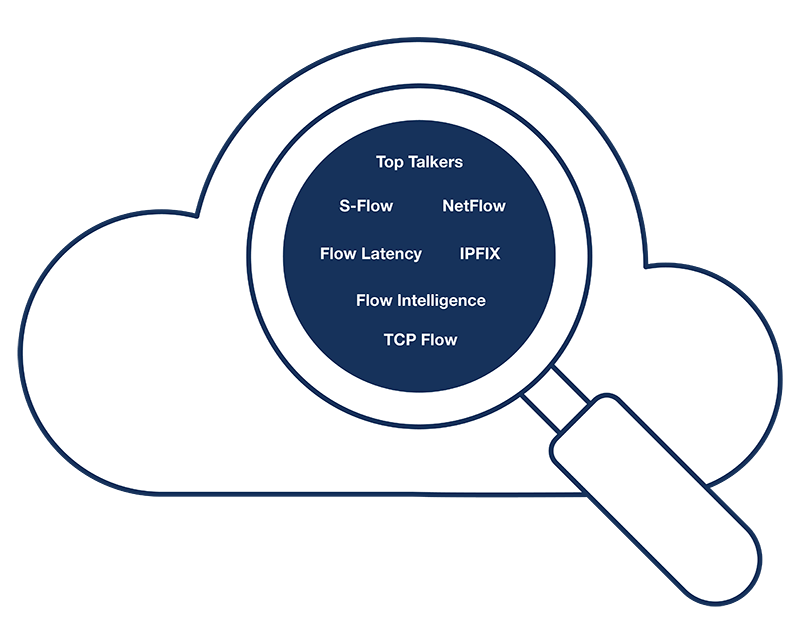
Flow data generation, analysis and visualization
- Presents enterprise-wide actionable insights, deep visibility, and security analytics via intuitive, flow- aware dashboards.
- Provides comprehensive hop-by-hop views of application flows across the network.
- Enables packet-level drill-down for fine-grained L4- L7 security and behavioral analytics.
- Accelerates forensic investigations and compliance initiatives by creating an audit trail of historical network events.
DMF Operations - Intent-Based, Zero-Touch, Multi-Tenant
Intent Based Monitoring
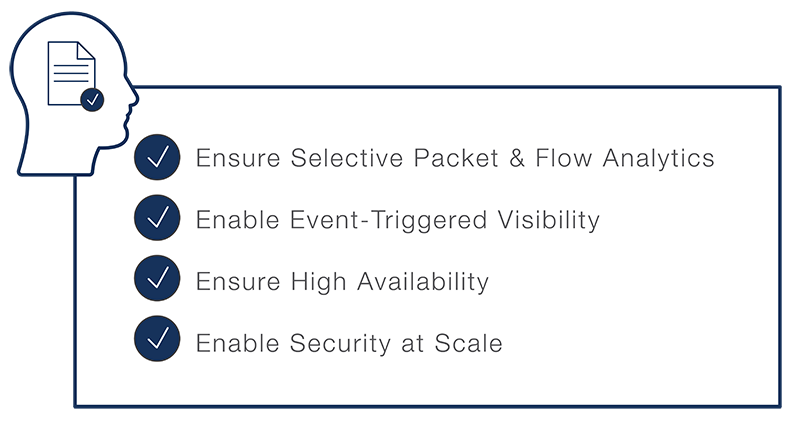
Declarative policy management
- Business intent translated to intuitive monitoring policies for rapid, fabric-wide provisioning at scale.
- Resilient design ensures policy intent in the event of device/link failure for continuous visibility.
- Expresses security intent through programmatic integration with security tools, for rapid threat detection and mitigation and capacity planning.
- Real-time intent verification and predictive analytics for health assessment, resource utilization and capacity planning.
Zero Touch Monitoring Fabric
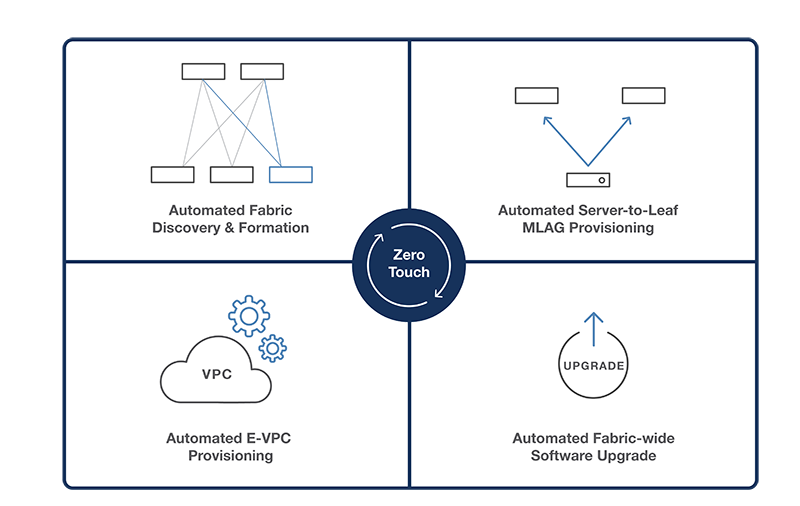
Built in workflows for Day 0/Day 1/Day 2 Operations
- Rapid Day 0 deployment through auto-discovery and auto-provisioning of switches and auto-formation of one logical packet broker fabric.
- Faster Day 1 change management for ongoing switch and cable replacements, and fabric-wide software upgrades.
- Speed-up Day 2 with intent-driven or API-triggered workflows enabling automated network-to-tool provisioning for packet and flow analysis.
- Comprehensive fabric life-cycle management from one dashboard — never touch a switch.
Monitoring-as-a-Service
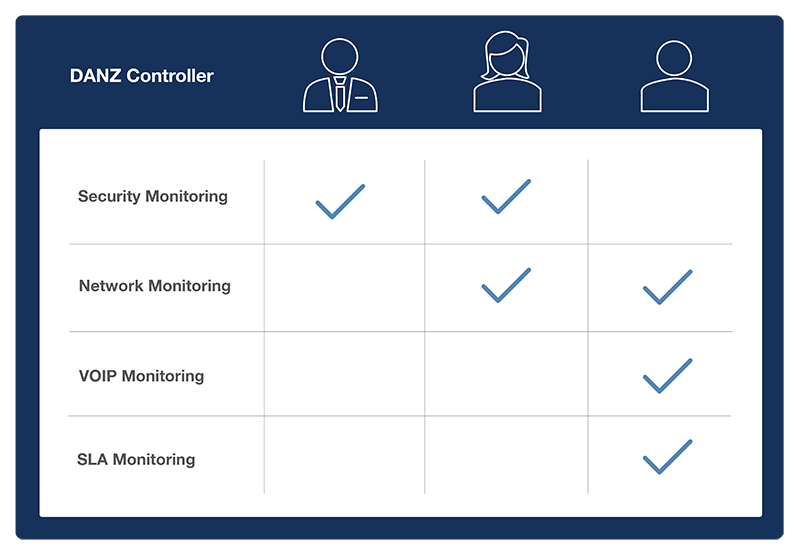
Centralized policy multi-tenancy and delegated administration
- Traffic isolation and administrative separation enables cloud style monitoring-as-a-service compliance and regulatory governance.
- Rapidly partition DMF into multiple logical NPB fabrics dedicated per tenant compliance and regulatory governance.
- Dramatically Reduce TCO by leveraging shared resources across multiple monitoring teams compliance and regulatory governance.
- Permits separation of duties between infrastructure teams and tool owners to meet compliance and regulatory governance.
Multi-Cloud Director (MCD): Enterprise-wide Multi-DMF Management
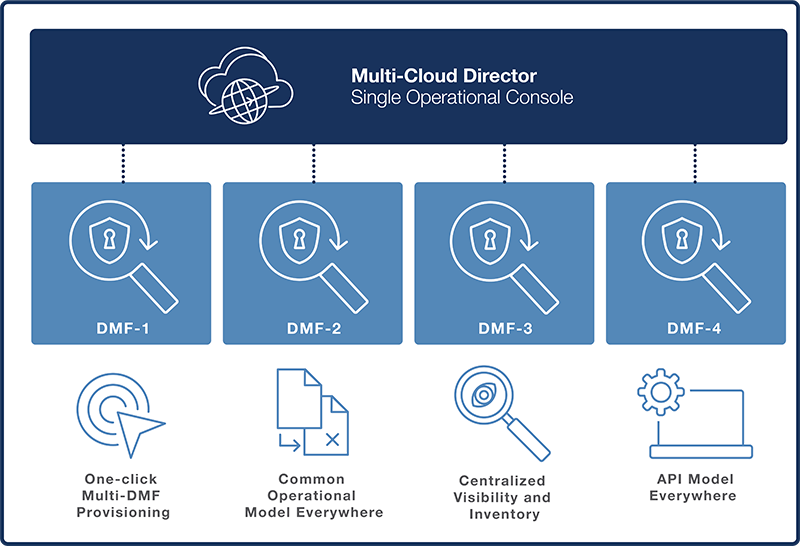
MCD provides a unified dashboard for global provisioning, operations and visibility of multiple DMF deployments
- Enables globally orchestrated workflows across multiple controllers, including provisioning, Day1/Day2 operations, upgrades and troubleshooting for faster service enablement, global security compliance and ensures consistent operations.
- Provides global inventory, real-time visibility, resource utilization, version consistency and operational health to streamline capacity planning and to ensure operational consistency across all controller deployments.
- Single sign-on and role-based access control enable multiple teams to manage different sets of controllers, meeting segregation of duties requirement as well as ensuring consistent enterprise-wide operational posture.
- Provides a single point of API integration to simplify programmatic access across multiple controllers for rapid automation in a global, multi-cloud organization.
Data Sheets
Literature
- .Next-generation Visibility and Security with DANZ Monitoring Fabric White Paper
- .Enabling Pervasive Network Observability with DANZ Monitoring Fabric (DMF) Solution Guide
- .DANZ Monitoring Fabric (DMF) Technical Solution Guide
- .451 Report: Arista is laying the foundation for integrated observability
- .Intelligent Observability and Security Operations with Arista DANZ Forensic Exchange Solution Guide
- .Network Appliances Visio Stencil
- .Siemon Lightverse TAP Module Specs
Customer Use Cases
Video
- .DMF Dynamic VM Monitoring
- .DMF: Zero-Touch Fabric Operations
- .DMF Service Node: Deduplication
- .DMF Service Node: IPFIX Generation
- .DMF Service Node: Header Stripping
- .DMF Service Node: Slicing
- .DMF Service Node: UDP Replication
- .DMF Service Node: Masking
- .Multi-Cloud Director(MCD) Single Operations Console for all CCF and DMF Instances
- .Analytics Node: Enterprise-wide Contextual Analytics
- .Analytics Node: Machine Learning

