Accessing Dashboards
The Dashboards application allows you to create customizable dashboards consisting of multiple metrics across various datasets in different views. You can quickly resize and drag widgets on the grid to accommodate various custom layouts views. Data gathered from devices configured for streaming telemetry data to CVP.
Dashboard Manager
Dashboards Manager is where you are presented with the list of available dashboards. This screen can be viewed in either a grid or table format.
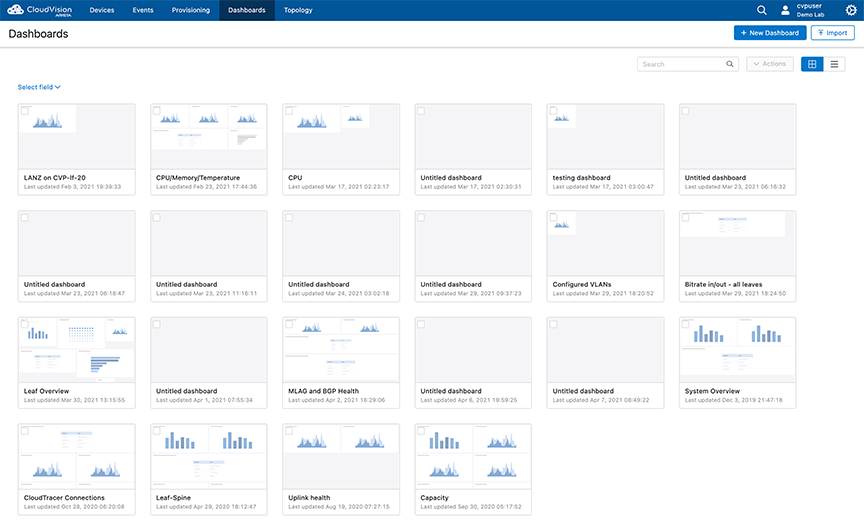
Each dashboard on the grid provides the dashboard name, description, and an approximate layout of the dashboard. To perform actions on any of the dashboards, select one or more dashboards by selecting the checkbox associated with each dashboard.
Editing and Creating Dashboards
Creating a Dashboard
Perform the following steps to create a dashboard.
- Select New Dashboard from the Dashboard Manager page.
- Select one or more widgets to display information.
Figure 3. Dashboard Widgets 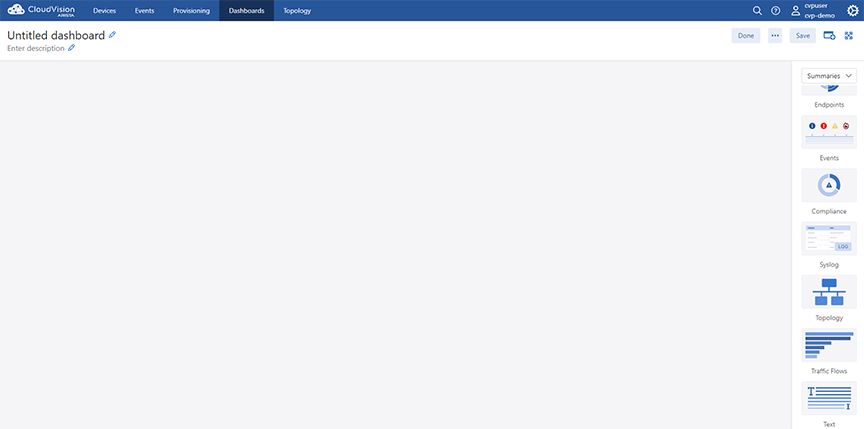
- Select the widget in the main screen to configure and label the widget.
- Enter a title and description of the new dashboard.
- Select Save Changes to save the new dashboard.
Editing a Dashboard
Perform the following steps to edit a dashboard. Dashboard widgets can be added, removed, or configured while in editing mode.
- Select a dashboard to display from the Dashboard Manager page.
- Select Edit Dashboard from the Dashboard Manager page.
Figure 4. Editing a Dashboard 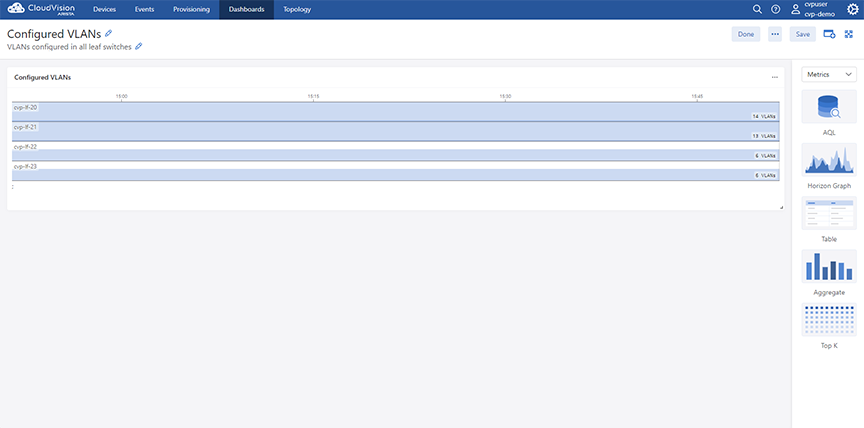
- Select a currently displayed widget in the main screen to edit or configure as needed.
- To add a new widget, select from widgets tab.
- To change the inputs, select the Inputs tab to configure as needed.
- Select the pencil icons to edit the dashboard title and description.
- Select Save Changes to save the changes.
Dashboard Panel Appearance Settings
- Show Title: Select whether to display the title or not.
- Title Size: Select a size for the title of the panel.
- Show Headline Divider: Hide the separator between the panel title and the panel contents.
- Show Panel Background Color: Enable or disable the panel background color.
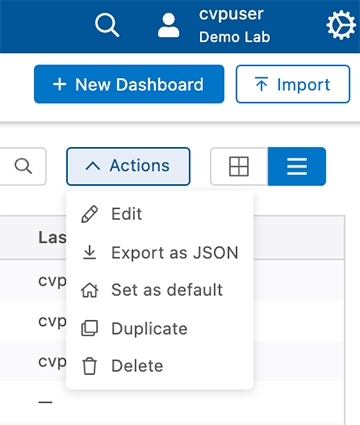
- Click the ellipse to the right of the dashboard title.
Figure 5. Accessing Edit Dashboard Appearance 
- Click Configure in the dashboard configuration menu.
Figure 6. Dashboard Configuration Menu 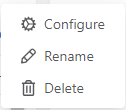
- Select the appearance settings for your dashboard.
Figure 7. Dashboard Appearance Menu 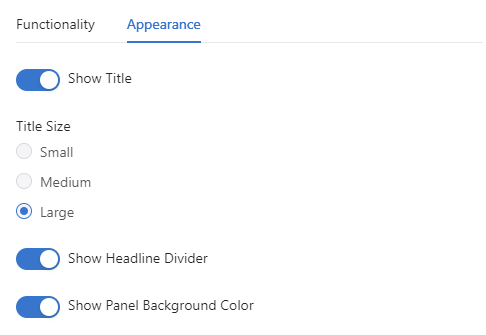
Syslog Panel
The Syslog panel is a dashboard element that allows to you view log messages for the devices both in real-time or a selected timeframe.
Creating a Syslog Panel
- Create a new dashboard or edit an existing dashboard.
- On the sidebar, select the Summaries category and select the Syslog panel .
Configuring a Syslog Panel
Follow this procedure to Filter log messages by tags (Optional).A single tag filter input is associated with one tag. This can be a single device, or it could include many devices that grouped within a single tag.
Dashboards with Custom Query Language widget
The AQL panel is a dashboard element that allows you to create custom data displays using the CloudVision Advanced Query Language (AQL). This gives you complete control over what data the panel displays and how it displays it. You define the inputs and write the AQL query that feeds data to the panel. Further customization is available through creating a color mapping for the panel’s display, defining units, and decimal places among other options. You can create custom dashboards with AQL panels that are acutely relevant to your organization.
- Inputs: These are used by the AQL query to feed data to the AQL panel AQL
- Panel: This is the display item within your dashboard and which uses the AQL query and any inputs to render a display AQL
- Panel Visualization: The AQL panel has five ways to display the data fed to it (Table, Single Value, Bar Graph, Line Graph, and Donut), which each requires that the AQL query be formatted in a particular way. Each visualization can be further customized to change how it displays its data
The AQL panel is currently in beta and needs to be enabled as a setting. To enable the AQL panel, go to General Settings and turn on the toggle Beta Widgets under Features.
The Arista Support page titled Dashboards with Custom Query Language widget provides detailed configuration instructions and a tutorial about CloudVision Advanced Query Language (AQL).
Dashboard Preview
You can preview dashboards from the main dashboards screen. A windowed version of the selected dashboard can be viewed.
Preview any dashboard by accessing Dashboards and hover over the preview symbol to see a preview of a dashboard. In the preview, you can hover over relevant information to obtain details. Select any part of the preview to close the preview and load that dashboard.