DMF
Policy
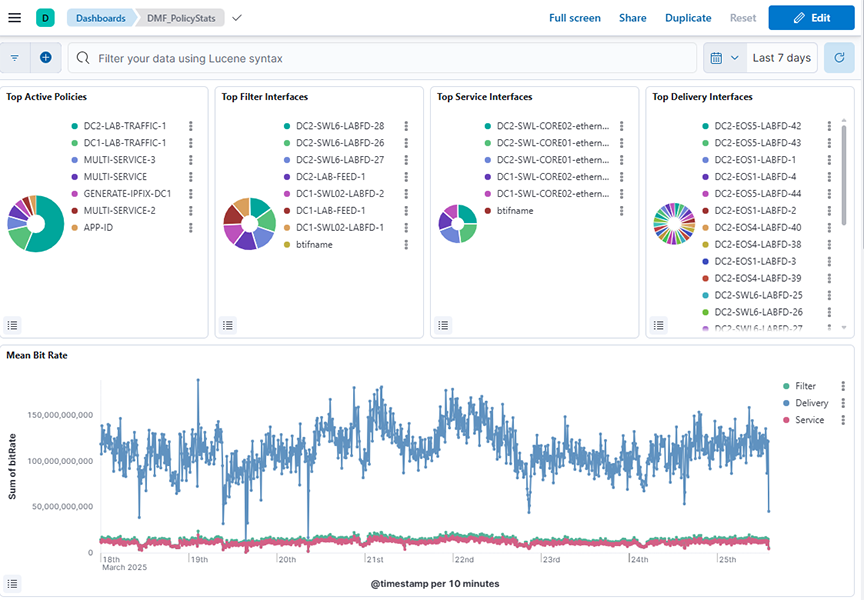
The DMF → Policy dashboard summarizes information about DANZ Monitoring Fabric policy activity and provides the following panels:
- Top Active Policies: Displays the top active policies based on the sum of bit rates over a selected time range, helping identify which policies contribute the most to traffic.
- Top Filter Interfaces: Displays the top filter interfaces based on the sum of bit rates over a selected time range, allowing identification of interfaces handling the most traffic.
- Top Service Interfaces: Displays the top service interfaces based on the sum of bit rates over a selected time range, highlighting which service interfaces handle the most traffic.
- Top Delivery Interfaces: Displays the top delivery interfaces based on the sum of bit rates over a selected time range, helping to identify which interfaces are handling the most traffic for policy delivery.
- Mean Bit Rate: Shows the mean bit rate over a selected time range by summing bit rates across different policy types (filter, delivery, and service) and plotting the values against time.
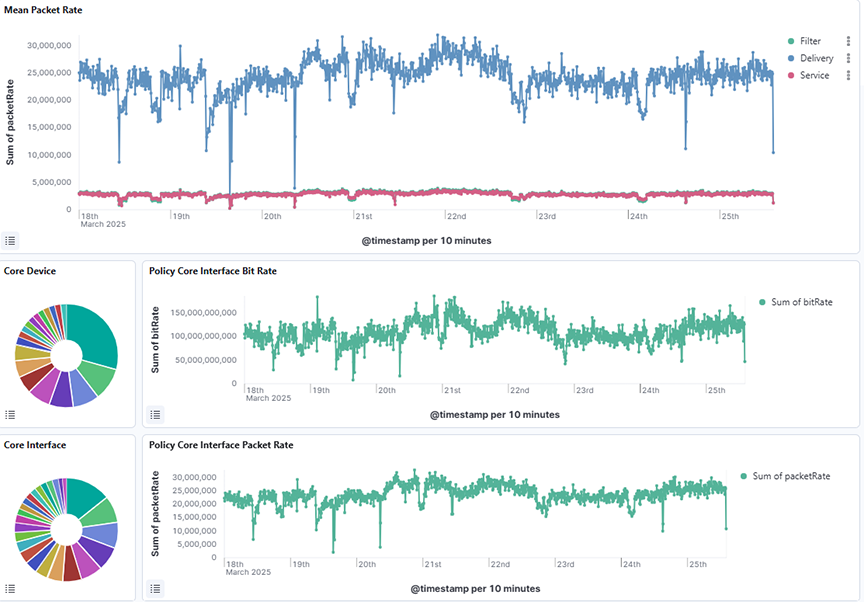
- Mean Packet Rate: Shows the mean packet rate over a selected time range by summing packet rates across different policy types (filter, delivery, and service) and plotting the values against time.
- Core Device: Shows the distribution of bit rate across core devices over a selected time range, with data aggregated by device alias names and ordered by the total sum of bit rate.
- Policy Core Interface Bit Rate: Shows the sum of bit rates over time for core interfaces related to policy traffic, aggregated by timestamp over a selected time range.
- Core Interface: Shows the distribution of bit rate across core interfaces over a selected time range, with data aggregated by interface names and ordered by the total sum of bit rate.
- Policy Core Interface Packet Rate: Shows the sum of packet rates over time for core interfaces associated with policy traffic, aggregated by timestamp over a selected time range.
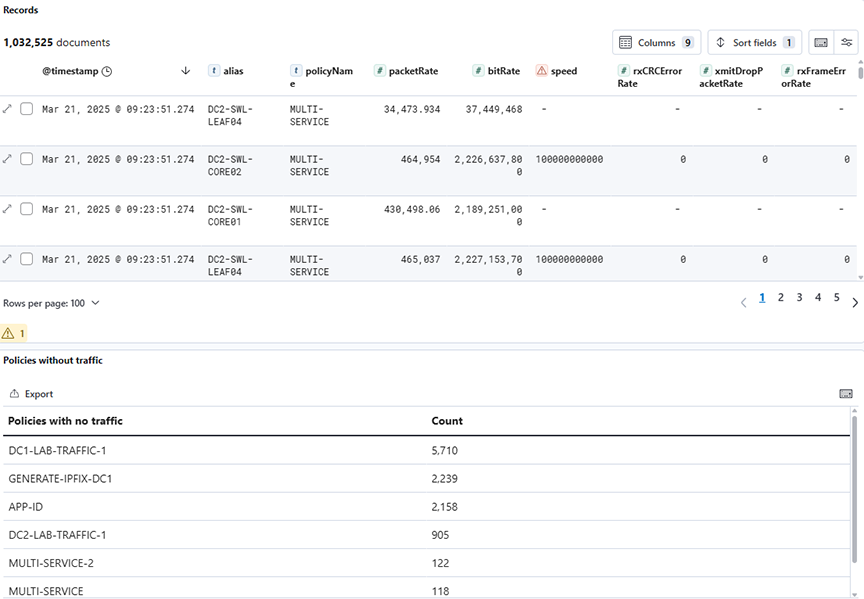
- Records: Displays detailed raw records of policy-related statistics across various types over a selected time range, including metadata fields such as timestamps, types, bit rates, and packet counts.
- Policies with no traffic: Lists policies with zero traffic by counting occurrences of policy names where the bit rate is zero, aggregated over a selected time range.
Use the Top Active Policies visualization to verify that your DANZ Monitoring Fabric policies are active and behaving as expected.
Use the Filter Interfaces visualization to balance the utilization of your filter interfaces and ensure that it doesn't drop any packets to analyze.
Interface
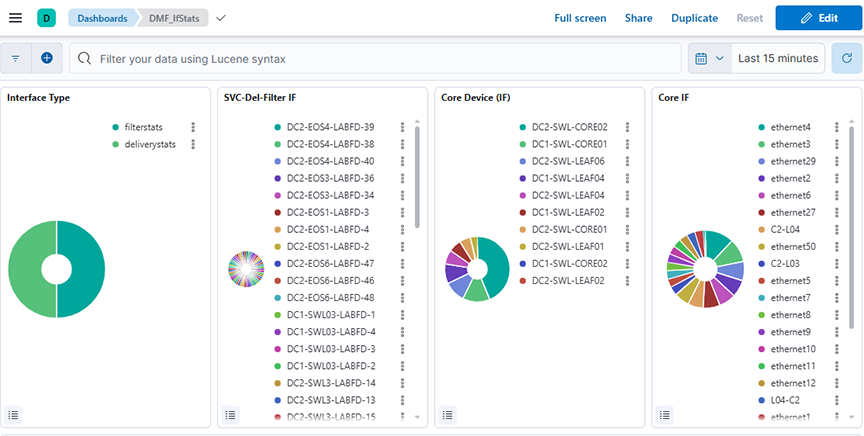
Click the DMF → Interface tab to display the following dashboard.
- Interface Type: Displays the distribution of interface types by summing the bit rate for each type over a selected time range.
- SVC-Del-Filter IF: Displays the distribution of traffic across different service, delivery, and filter interfaces by summing the bit rate for each interface over a selected time range.
- Core Service (IF): Displays the sum of transmitted bit rates (txBitRate) for different core device interfaces over a selected time range.
- Core IF: Displays the sum of transmitted bit rates (txBitRate) across core interfaces, grouped by interface name, over a selected time range.
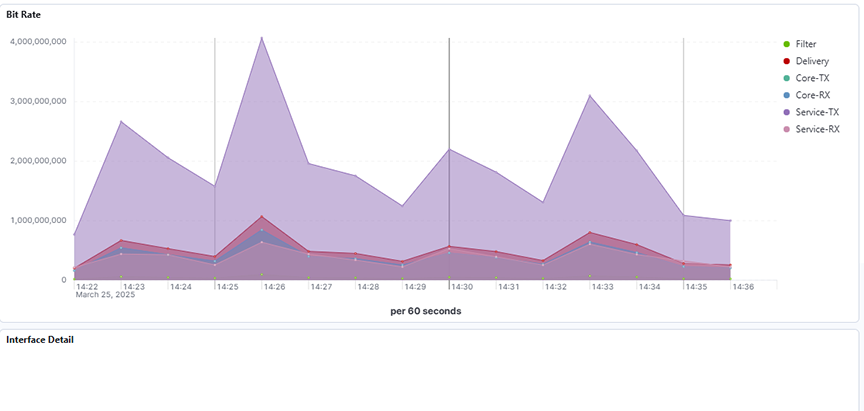
- Bit Rate: Displays the average bit rates for filter, delivery, core transmit (TX), core receive (RX), service transmit (TX), and service receive (RX) interfaces over a selected time range.
- Interface Detail: Displays detailed interface metrics, including bit rate, packet count, error rates, and other network statistics over a selected time range.
SN (Service Node)
Click the DMF → SN tab to display the following panels:
- Service Name: Displays the count of records grouped by service name over a selected time range.
- Service Node Transmitted Bit Rate: Displays service nodes' average transmitted bit rate per second over a selected time range.
- Service Node Received Bit Rate: Displays the average received and applied bit rates per second for service nodes over a selected time range.
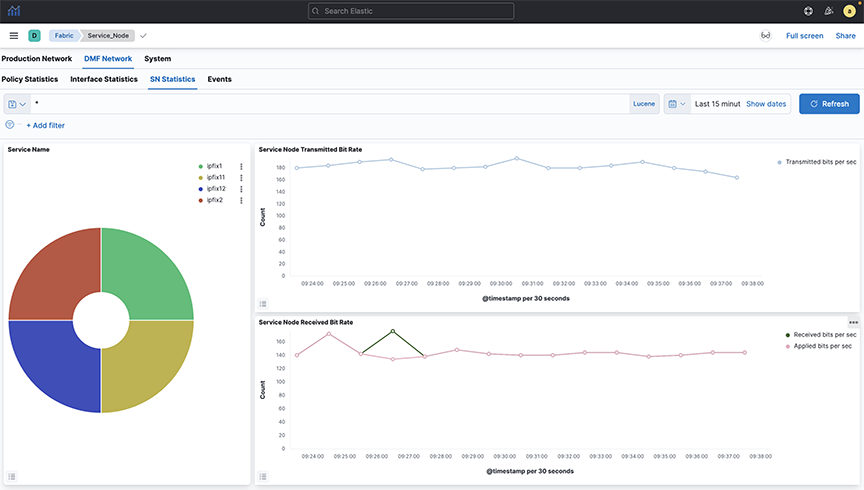
Select a service from the pie chart to see the statistics for a specific managed service. It will display statistics for the selected service.
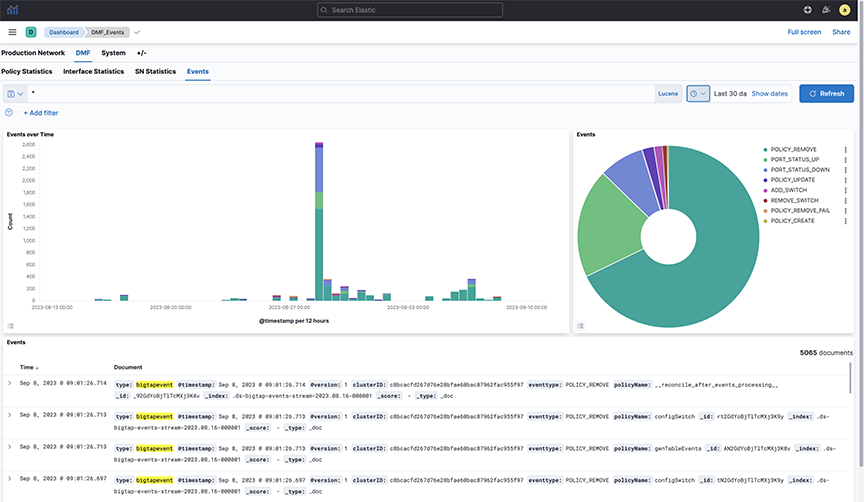
Events
The DMF → Events dashboard summarizes information about DANZ Monitoring Fabric management network events and provides the following panels:
- Events Over Time: Displays the count of different event types over a selected time range using a date histogram on the timestamp field.
- Events: Displays the count of different event types over a selected time range, based on the eventtype.keyword field.
- Events: Displays a timeline of bigTapevent records, showing the distribution of different event types and their details over a selected time range.