System
Configuration
- Configure Alerts
- Analytics Configuration
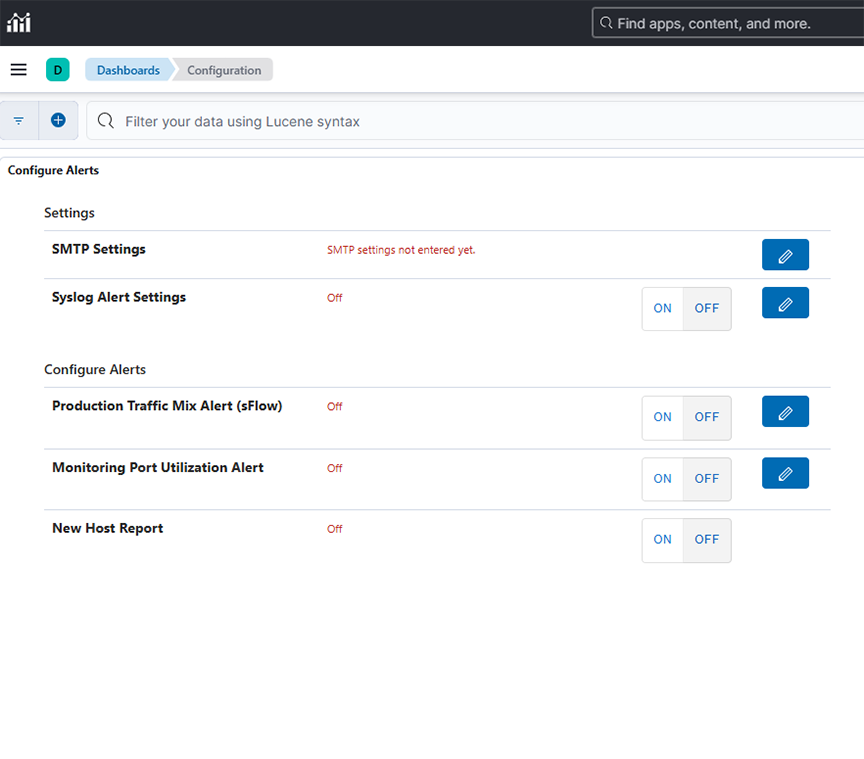
Configure Alerts
- SMTP Settings
- Syslog Alert Settings
- Production Traffic Mix Alert (sFlow)
- Monitoring Port Utilization Alert
- New Host Report
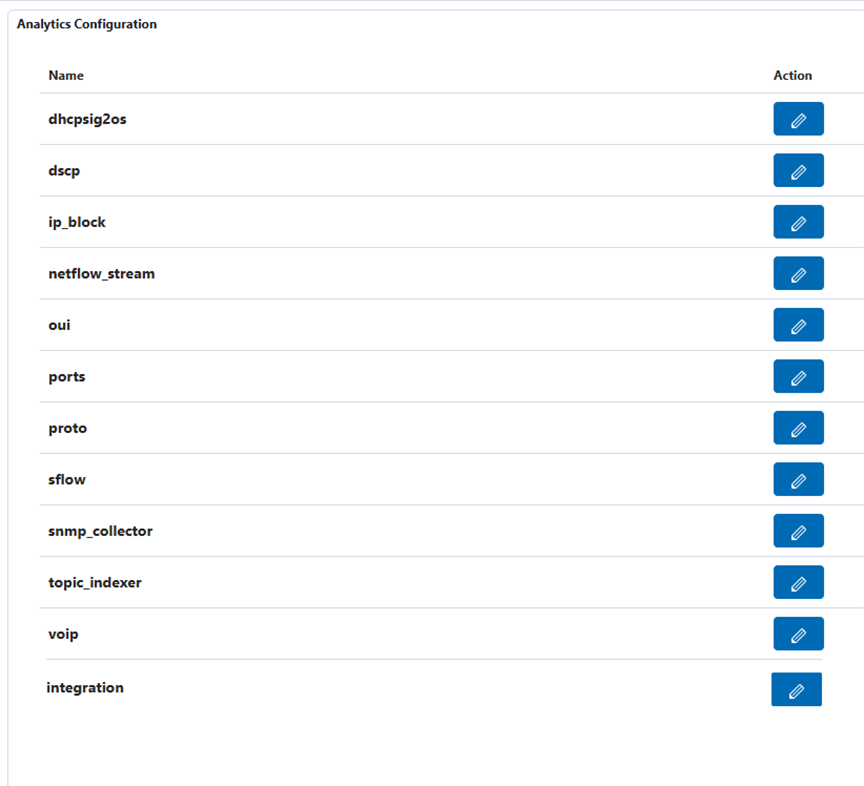
Analytics Configuration
- DHCP to OS
- IP Address Blocks
- NetFlow Stream
- OUI
- Ports
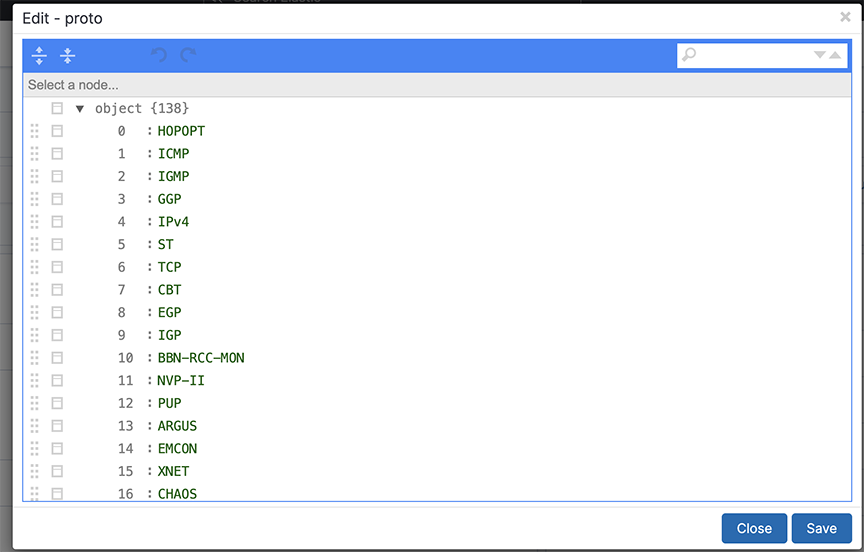
- Protocols
- SNMP Collector
- Topic Indexer
- Integration
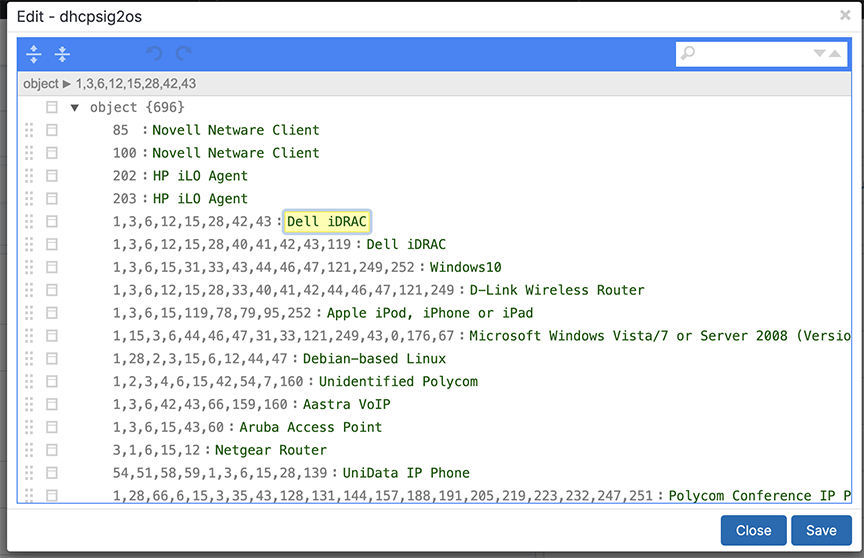
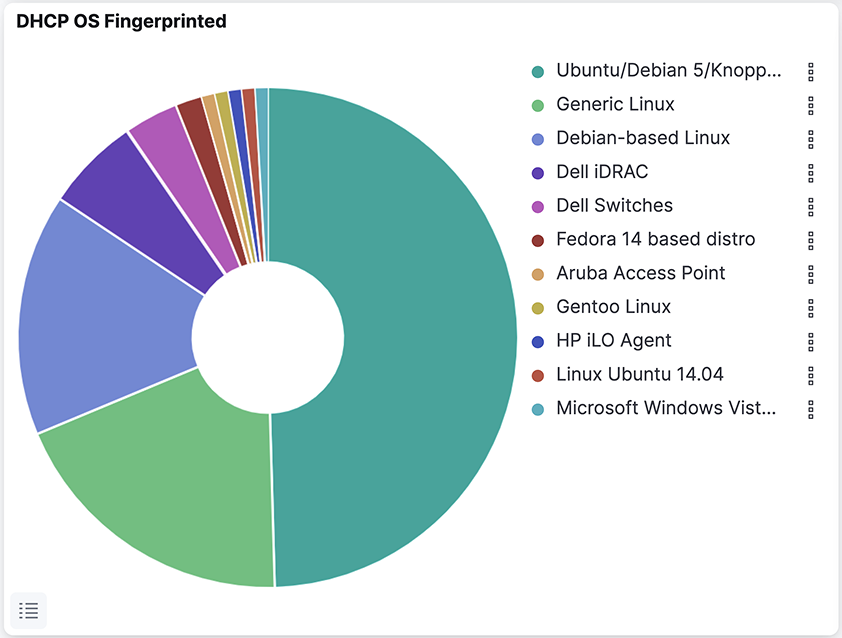
DHCP to OS
IP Address Blocks
Complete the following steps to assign a single IP address or a block of IP addresses to a tool, group, or organization.
- Select and click the Edit control to the left of the IP Block section.
Figure 5. Edit IP Blocks 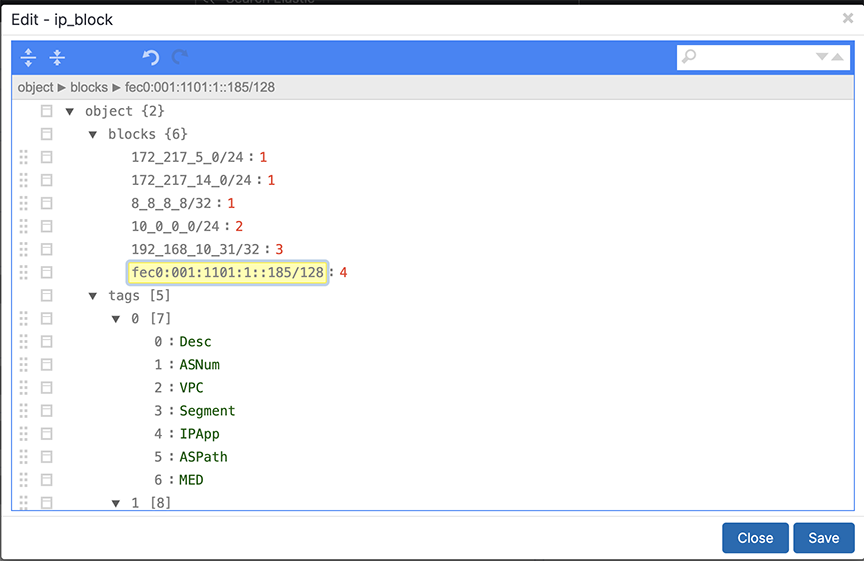
- Scroll down to the end of the tags section to the numerical identifier assigned to the new block.
Figure 6. Key Value Pairs 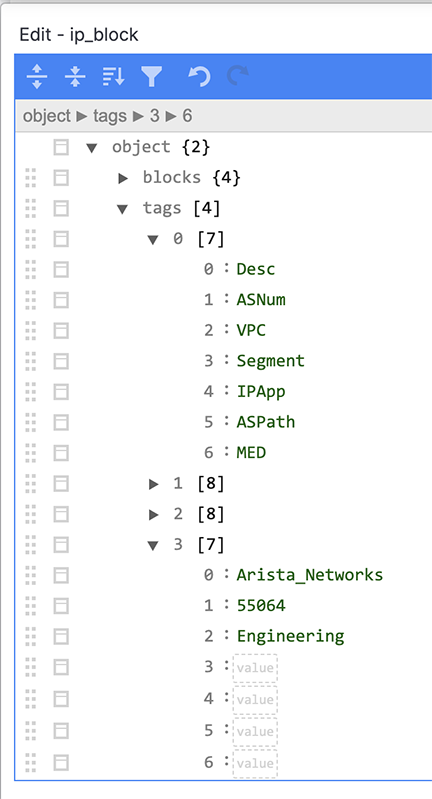 It automatically copies the first four keys. The purpose of each of these default keys is as follows.
- Desc: A short descriptive text entry.
- ASNum: Automatically populated with the BGP Autonomous Systems (AS) numbers for well-known networks.
- VPC: Virtual Private Cloud (tenant), automatically populated with the VPCs used in an integrated Converged Cloud Fabric network.
- Segment: Network segment within a Converged Cloud Fabric VPC.
To identify a user, application, tool, group, or organization, use the Desc key. You can leave the other fields blank.
NetFlow Stream
Arista Analytics may consolidate NetFlow records to improve performance.
The Analytics server/cluster consolidates flows received within two seconds into a single flow when the source and destination IP addresses are the same, or the source or destination L4 protocol port is the same.
For example, ten flows received by the Analytics server within 30 seconds are consolidated into a single flow if the source and destination IP addresses and destination port are the same for all the flows and only the source ports are different or if the source and destination IP addresses and source port are the same for all the flows and only the destination ports are different. This consolidated flow displays as a single row.
By default, the NetFlow Optimization is enabled for Netflow v5 and disabled for Netflow v9 and IPFIX. To allow the Netflow Optimization for Netflow v9 and IPFIX, refer to the Netflow v9/IPFIX Records section.
This consolidation improves Analytics NetFlow performance, allowing more efficient indexing and searching of NetFlow information.
NetFlow Traffic from Third-party Devices
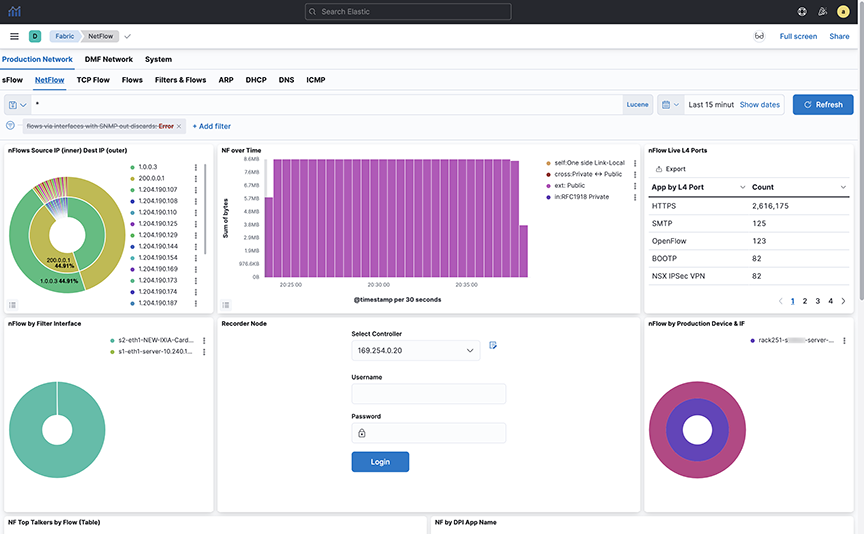
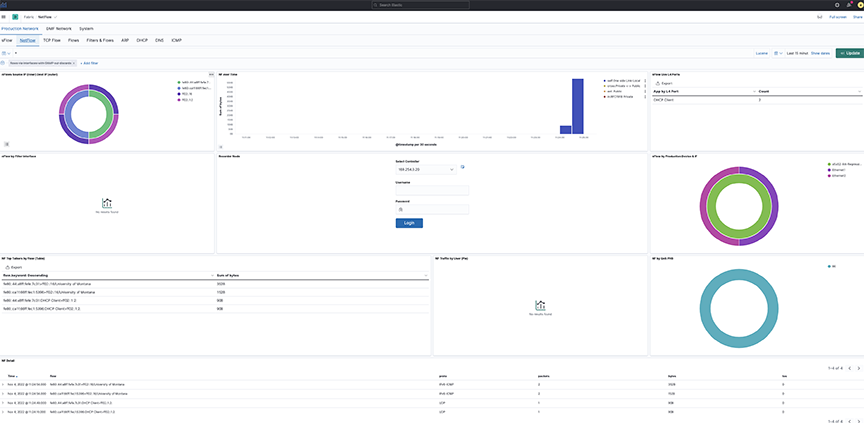
Arista Analytics can act as a NetFlow collector for third-party devices. In this case, Arista Analytics displays third-party device management IP addresses and the interface index (iFindex) of the interface for each NetFlow-enabled third-party device.
For example, the nFlow by Production Device & IF window shows that 10.8.39.198 is the third-party device that forwards NetFlow traffic. The iFindex of the interface on that device where NetFlow is enabled is 0, 2, 3, 4.
Arista Analytics then performs SNMP polling and displays the third-party device name and the actual interface name in the nFlow by Production Device & IF window.
To perform the SNMP configuration, complete the following steps:
- On the screen shown later, click .
Figure 8. Analytic snmp_collector config 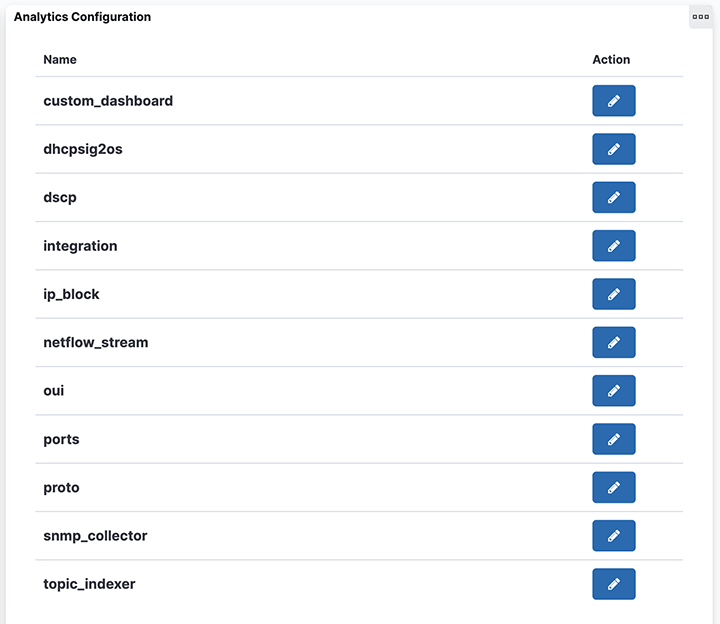 The system displays the following edit dialog.
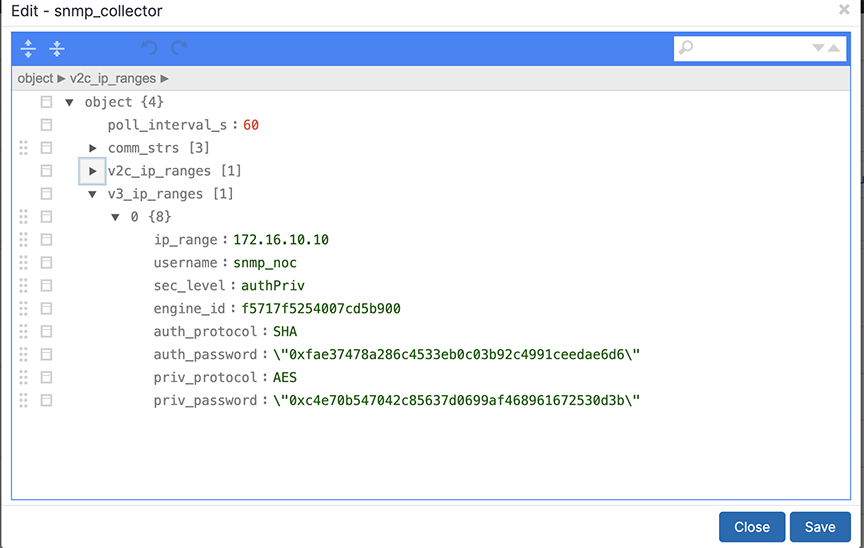
Figure 9. Analytic Configuration > snmp_collector > Edit Dialog (SNMPv2 Configuration) 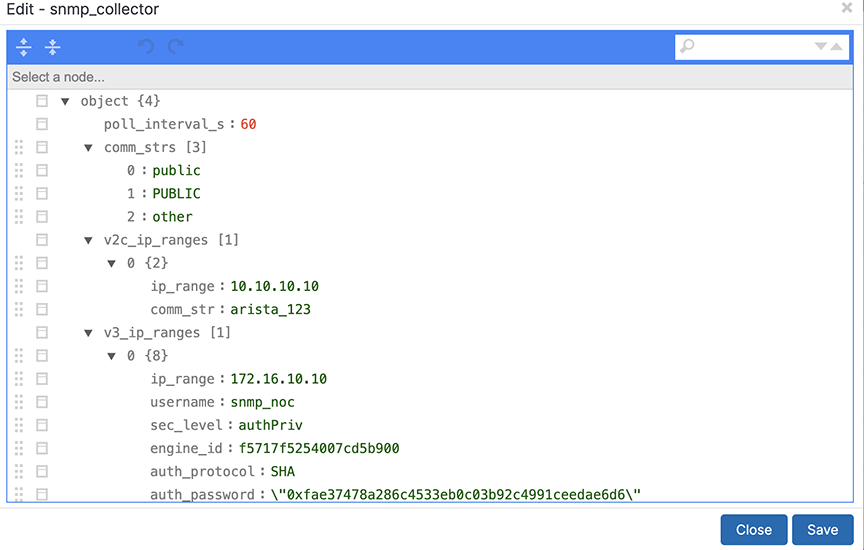
Figure 10. Analytic Configuration > snmp_collector > Edit Dialog (SNMPv3 Configuration) 
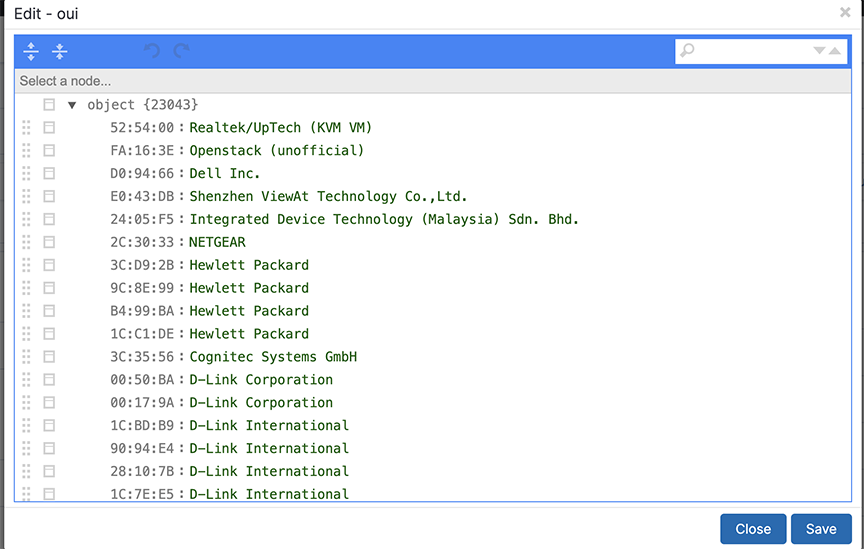
OUI
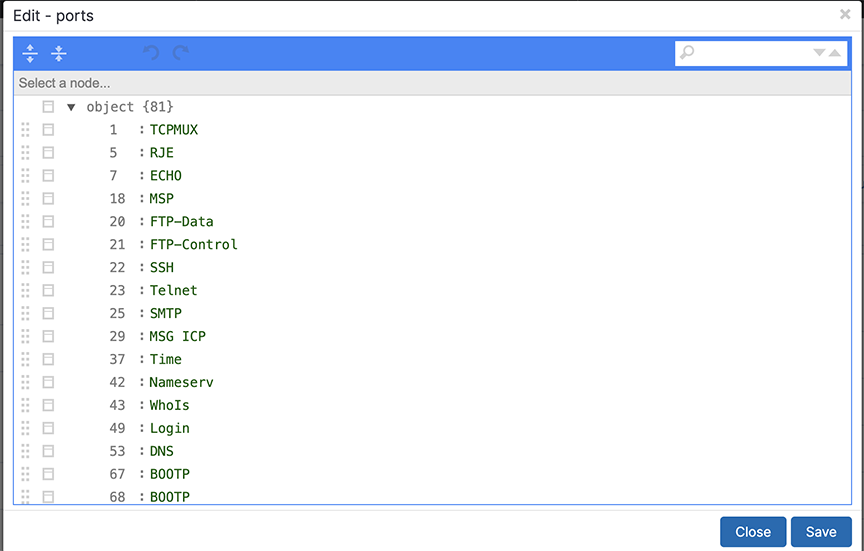
Ports
Protocols
SNMP Collector
Topic Indexer
Description
The Analytics Node (AN) incorporates a feature known as topic_indexer, designed to facilitate data ingestion from customer Kafka topics and its subsequent storage into Elasticsearch indices.
This process involves modifying field names and specifying the supported timestamp field during the ingestion phase. The renaming of field names enables the creation of dashboards used to visualize data across multiple streams, including DNS and Netflow.
The resulting indices can then be leveraged as searchable indices within the Kibana user interface, providing customers with enhanced search capabilities.
- Configure a stream job using topic_indexer. Access the setting via the Kibana dashboard in the analytics node.
- Locate the topic_indexer configuration on the Fabric Dashboard: , as shown in the following screenshots.
-
Figure 16. Analytics > Fabric 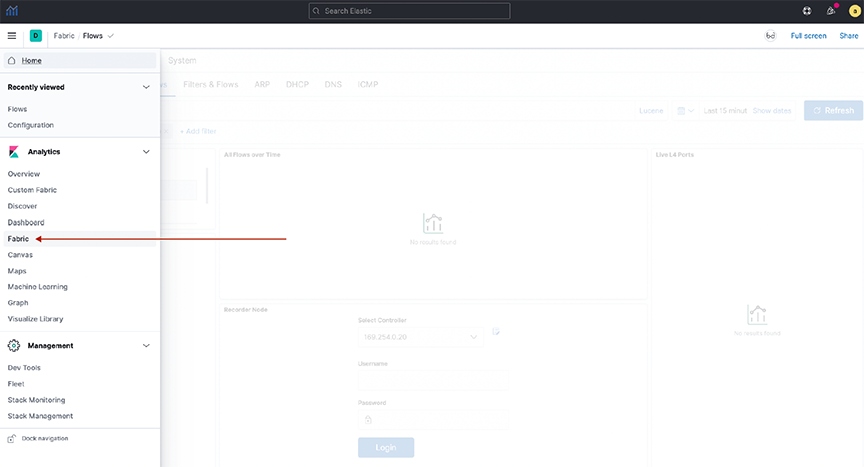
- Another view:
Figure 17. System > Analytics Configuration 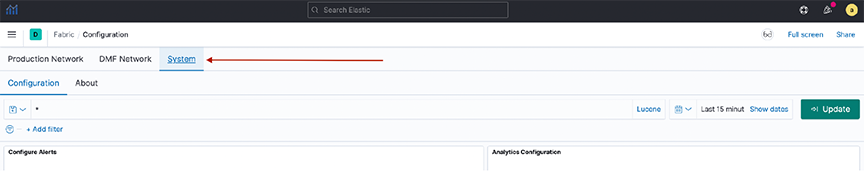
- The design section shows the configuration for a topic.
-
Figure 18. Node selection 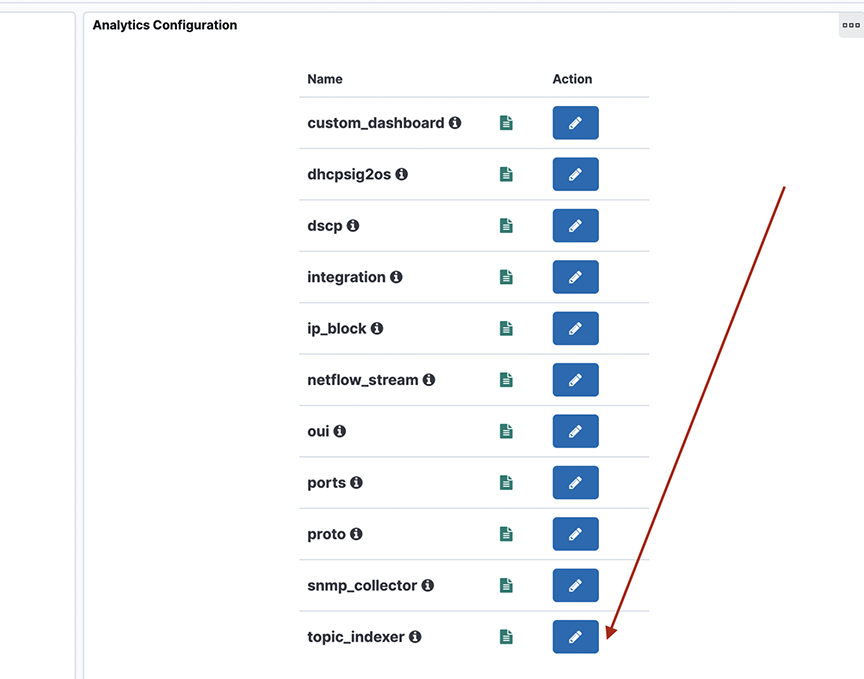
- To perform the topic_indexer configuration, select the page and open the Analytics Configuration panel:
Figure 19. System > Configuration 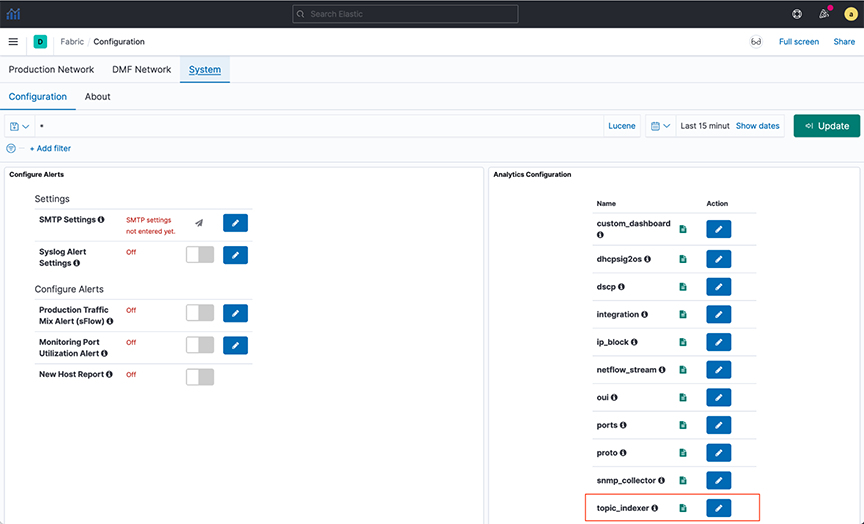
-
Figure 20. Topic_indexer configuration 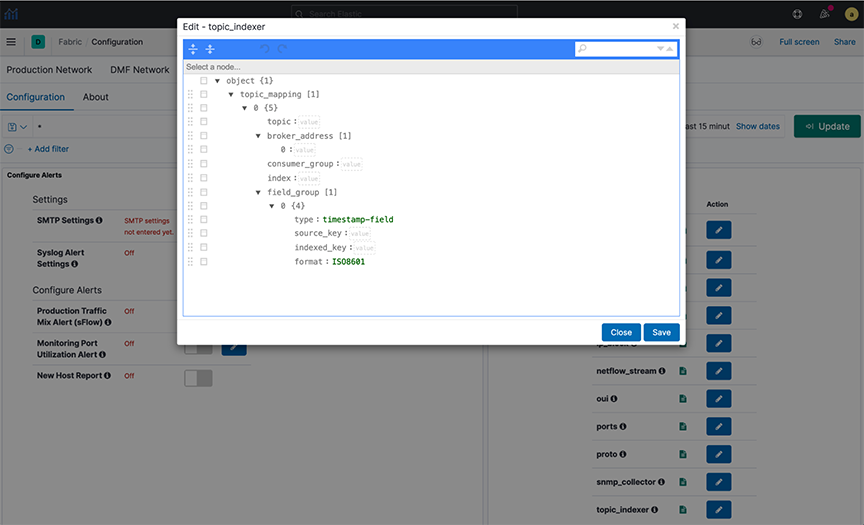
Field Details
- topic: Kafka topic name; type string and is a mandatory field.
- broker_address: Broker address(es), this is of type array; this will be of format [IPv4|hostname:Port number] and is a mandatory field.
- consumer_group: This is an optional field; however, there is always a consumer group if not specified explicitly in the configuration. It is topic_name + index_name. Setting this field is particularly useful when ingesting multi-partitioned topics from the client's end.
- index: A dedicated index name for the topic; type string. In Elastic Search (ES), it is created as topic_indexer_<index_name> and is a mandatory field.
- field_group: An optional JSON field mapping to specify any column rename/format transformations. It specifies the format for modifications to incoming data.
- type: To set the timestamp field as the type.
- source_key: The source field name in the incoming data.
- indexed_key: The destination field name inserted in the outgoing ES index.
The indexed_key may be a @timestamp field of an ES index. If you do not specify a @timestamp field, topic_indexer automatically picks the received time of the message as the @timestamp of that message.
- format: Data format for the field (ISO8601).
Standards and Requirements
Input fields naming convention:
- Kafka allows all ASCII Alphanumeric characters, periods, underscores, and hyphens to name the topic. Intopic_indexer, legal characters include: a-z0-9\\._\\-
- Note that the only restriction topic_indexer has is on capitalizing topic names. topic_indexer does not support case-sensitive names. By default, topic_indexer treats the name as a lowercase topic. Hence, topic names should be lowercase only.
- All numeric names are also invalid field text.
Examples of names:
- my-topic-name
- my_topic_name
- itlabs.mytopic.name
- topic123
- 123topic
- my-index-name
- myTopicName
- ITLabs-Website-Tracker
- 12435
- MY-Index-name
- A broker address in Kafka comprises two values: IPv4 address and Port Number.
- When entering the broker address, select the format IPv4:PORT.
Application Scenario
Querying Across DataStream using runtime-fields
POST <stream-name>/_rollover - Cross-index visualization - two data streams that need cross-querying:
-
Figure 21. Cross index visualization 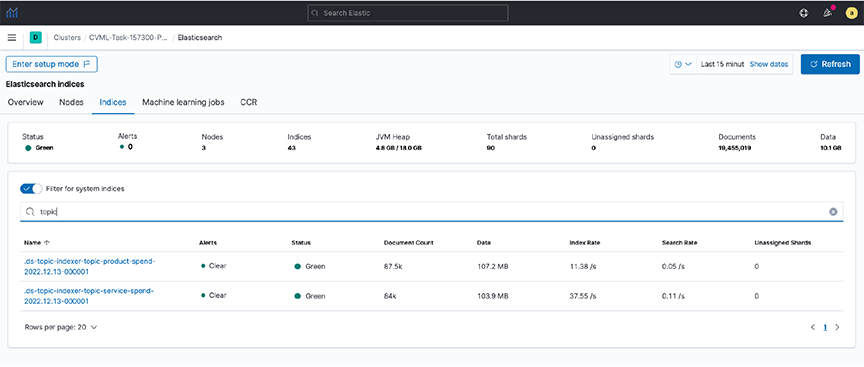
- Step 1. To view the documents in these indexes, create an index pattern (e.g., topic*spend) in Kibana.
- Step 2. View the data in the Discover dashboard.
Figure 22. Discover dashboard 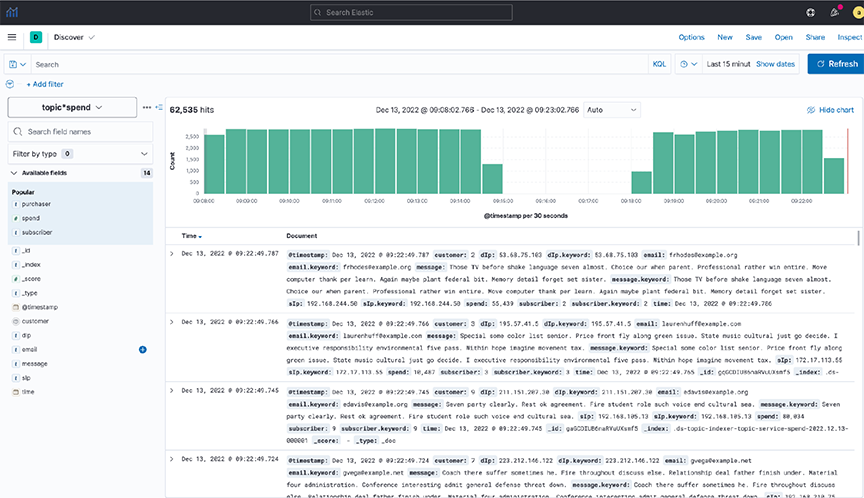
- Step 3. Create a common field (runtime field) between the two data streams by applying an API in Dev Tools.
Figure 23. Dev Tools 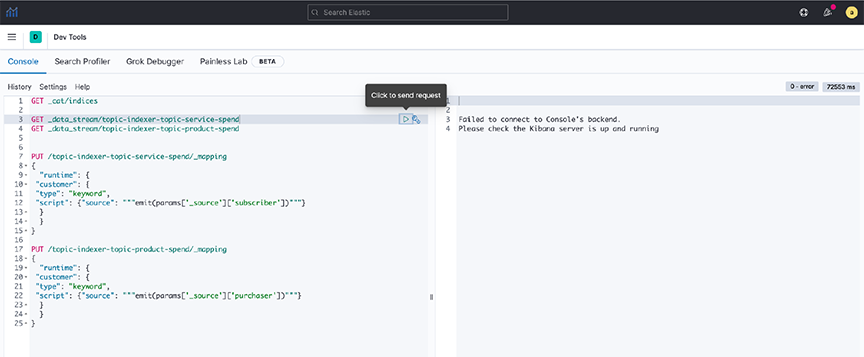 Note: Setting rollover policy on runtime fields can also be done in Dev Tools, as shown in the following examples:
POST /topic-indexer-service-spend/_rollover
POST /topic-indexer-product-spend/_rollover
Note: These changes are not persistent. Reapply is a must after any restart of AN. - Step 4. Finally, create a visualization using this common field, for example, Customer. The following illustration shows the Top 5 customers with the highest spending across products and services.
Figure 24. Visualization 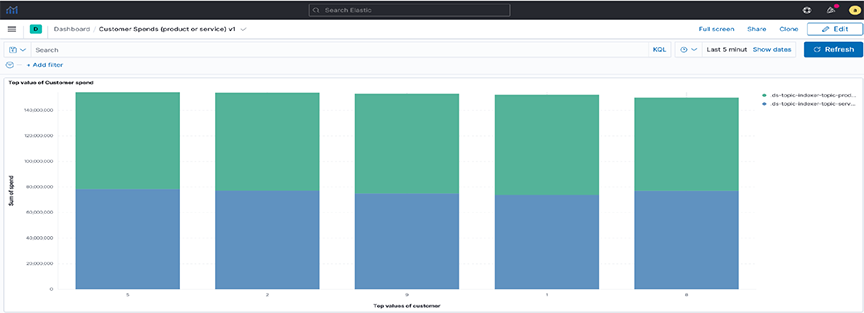
Syslog Messages
an> debug bash
admin@an$ cd /var/log/analytics/
admin@an:/var/log/analytics$
admin@an:/var/log/analytics$ ls -ls topic_indexer.log
67832 -rw-rwxr-- 1 remoteuser root 69453632 Apr 27 11:05 topic_indexer.log
Troubleshooting
- The Save button in the topic_indexer config is disabled.
When editing the configurations of topic_indexer in the Kibana User interface, default validations appear to ensure the correctness of the values entered in the fields. Specific standards and requirements are associated with filling in the configuration for topic_indexer, as stated in the earlier section. It may encounter validation errors when entering an invalid value in the configuration field as follows.
Figure 25. Validation errors 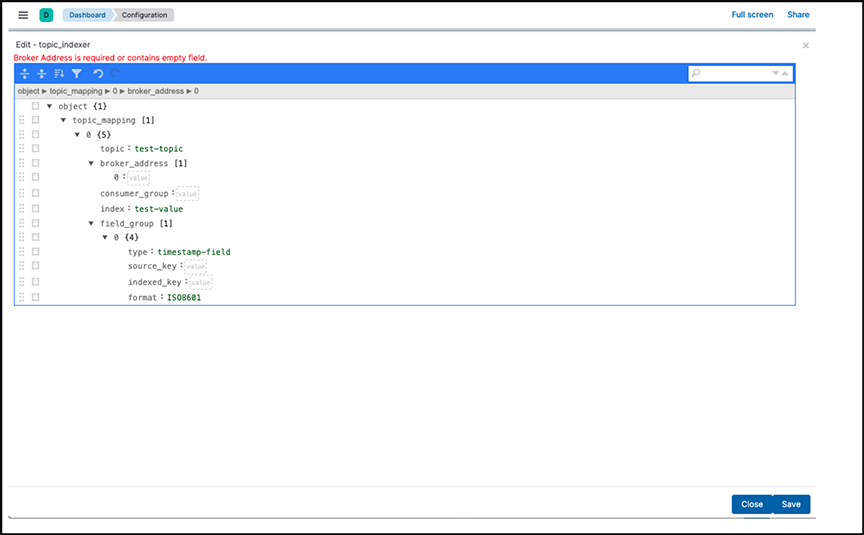
In such an event, the edited configuration will not save. Therefore, before saving the configuration, validate the fields and ensure there is no visible validation error in the topic_indexer configuration editor.
- The index for the topic_indexer has not been created.
After entering the correct fields in the topic_indexer configuration, the topic_indexer service will start to read the Kafka topic as documented in the configuration and load its data into the ElasticSearch index entered by the index field. The topic_indexer_ prefixes the name of the index.
There is a wait time of several minutes before the index is created and loaded with the data from the Kafka topic. In the event the index is not created, or there is no index shown with the name topic_indexer_<index_name> value, Arista Networks recommends using the following troubleshooting steps:- Check the configurations entered in the topic_indexer editor again to see whether the spellings of the topic name, broker address configuration, and index name are correct.
- Verify the broker address and the port for the Kafka topic are open on the firewall. Kafka has a concept of listeners and advertised.listeners . Validate if the advertised.listeners are entered correctly into the configuration. Review the following links for more details:
- If all the earlier steps are correct, check now for the logs in the Analytics Node for the topic_indexer.
Steps to reach the topic_indexer.log file in the AN node:
- Secure remote access into the AN using the command line: ssh <user>@<an-ip>
- Enter the password for the designated user.
- Enter the command debug bash to enter into debug mode.
- Use the sudo user role when entering the AN node, hence the sudo su command.
- topic_indexer logs reside in the following path: /var/log/analytics/topic_indexer.log
- Since this log file can be more extensive, you should use the tail command.
- Validate if the log file shows any visible errors related to the index not being created.
- Report any unknown issues.
- Data is not indexed as per the configuration.
- Data ingestion is paused.
When experiencing issues 3 or 4 (described earlier), use the topic_indexer log file to validate the problem.
- The index pattern for the topic_indexer is missing.
In the Kibana UI, it creates a default topic_indexer_* index pattern. If this pattern or a pattern to fetch the dedicated index for a topic is missing, create it using the Kibana UI as described in the following link:
Integration
This section identifies specific applications or operating systems running on network hosts.
Integrating Analytics with Infoblox
Infoblox provides DNS and IPAM services that integrate with Arista Analytics. To use, associate a range of IP addresses in Infoblox with extensible attributes, then configure Analytics to map these attributes for the associated IP addresses. The attributes assigned in Infoblox appear in place of the IP addresses in Analytics visualizations.
Configuring Infoblox for Integration
- Use the Edit icon to Add, Modify, or Delete the Integration configuration.
Figure 26. Integration Configuration 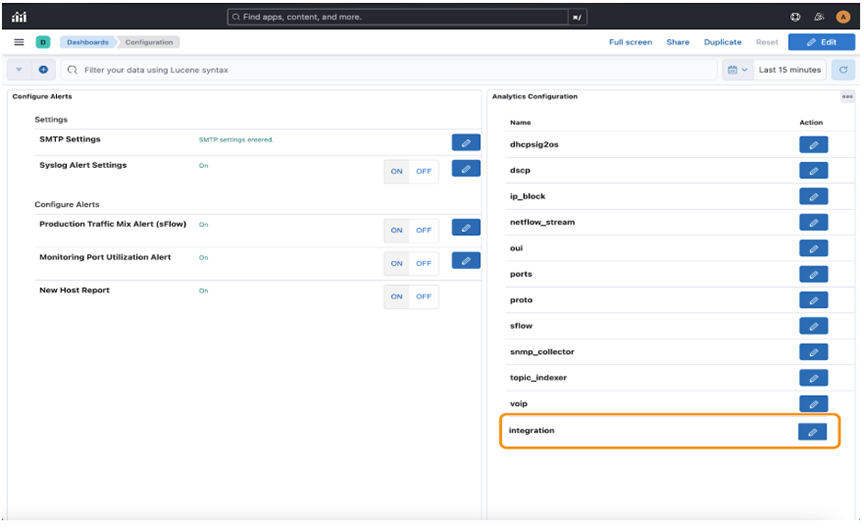 Enter the required information in the Integration input fields:
- Host: Must be a DNS-resolvable hostname or IPv4 address.
- Username: Enter the username of the Infoblox integration.
- Password: Enter the password of the Infoblox integration. When entering the password, it masks the password.
- Keys Fetched: Accepts a list of field names and field values:
- Field name
- Field value
Note: The configuration has data as a JSON object in earlier releases.Figure 27. Integration 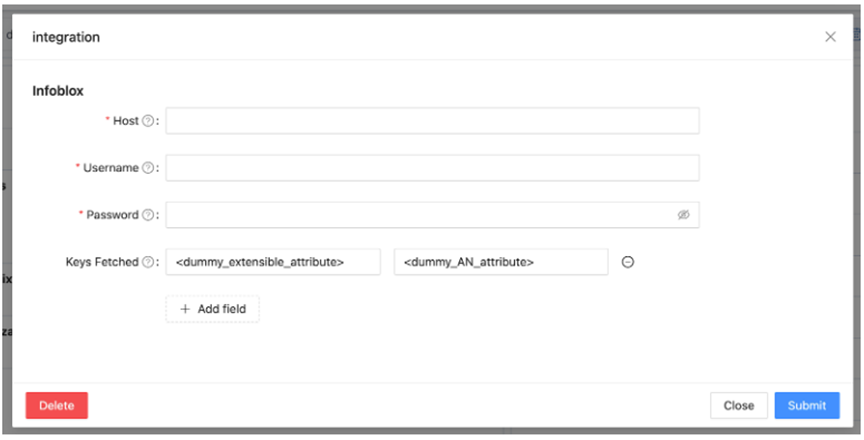
- Select +Add Field to add fields for Keys Fetched input or use to remove the corresponding field. Hovering over displays the requirements for the input field.
Figure 28. Add Field Requirement 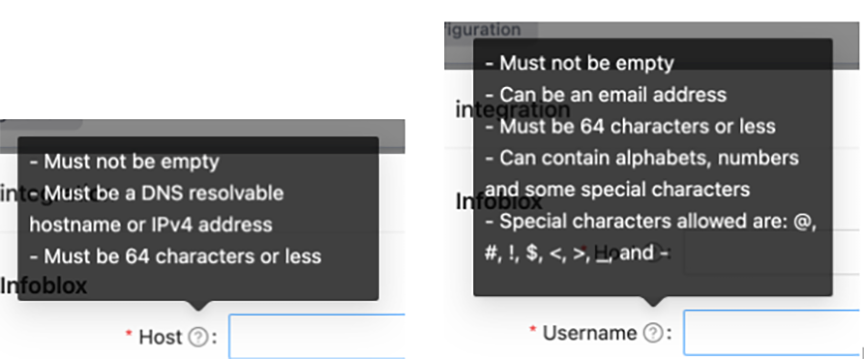 There are also validation checks when entering configuration values.
Figure 29. Validation Checks 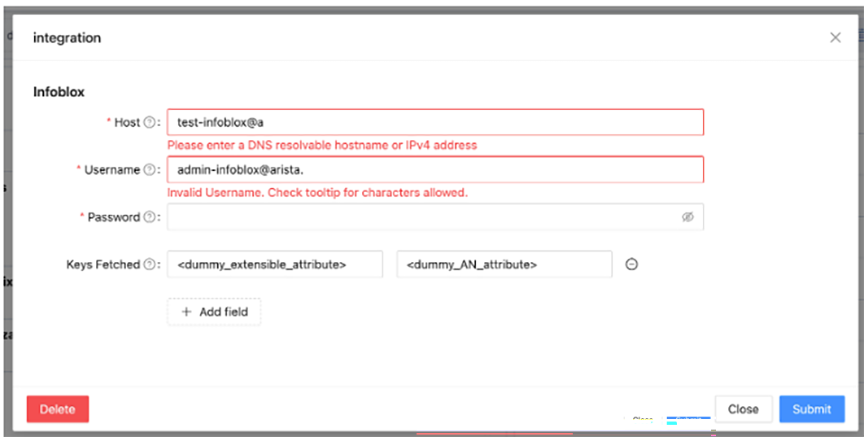
- Select Delete to delete the integration configuration; the page will refresh.
Figure 30. Delete Integration 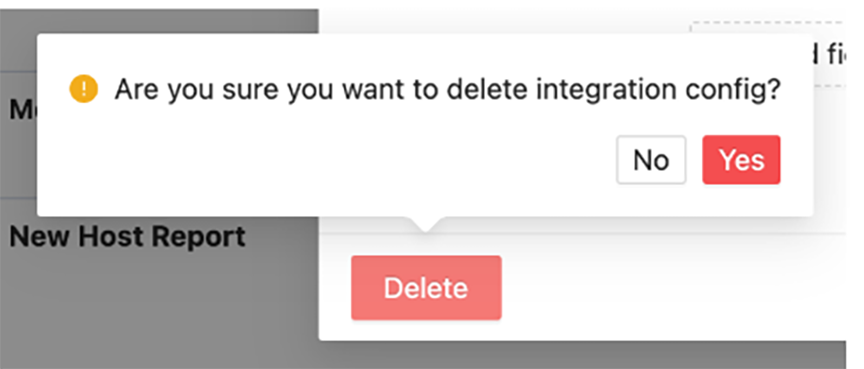
- To set the extensible attributes in Infoblox, click the Administration Extensible Attributes tab.
Figure 31. Extensible Attributes Tab 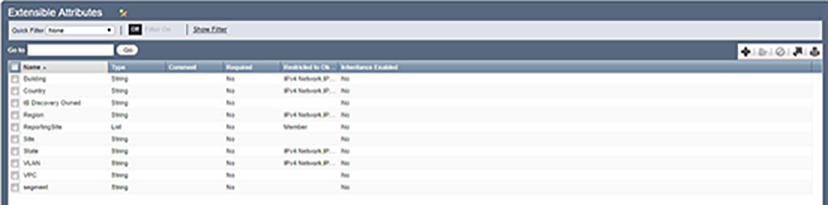 This tab defines the attributes applied to a block of IP addresses. The extensible attributes you define for integrating Infoblox with Arista Analytics are as follows:
- EVPC: Identifies the Enterprise Virtual Private Cloud (EVPC) assigned to a block of IP addresses in Infoblox.
- Segment: Identifies the specific subnet interface for an assigned IP address.
- Save the configuration.
As a result of these configuration changes, view the following enhancements to the flow records in the tab and move to the Flows by Time chart.
Figure 32. Dashboard - sFlow 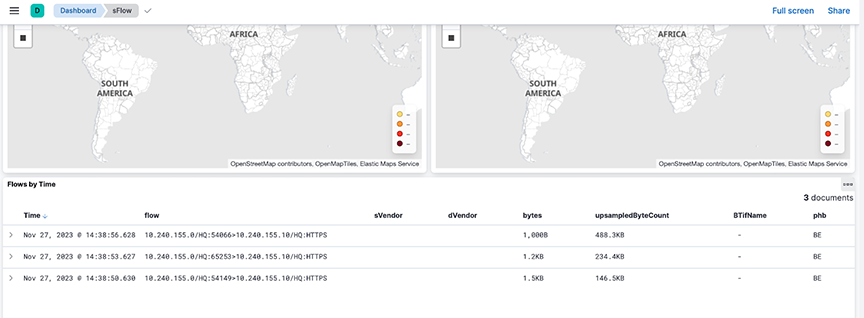
Suppose the sFlow packet source and/or destination IP addresses fall within the IP subnets in the Infoblox IPAM dashboard. In that case, their flow records will be augmented with the extensible attributes from Infoblox as specified in the integration configuration.
For example, the source and destination IP addresses of the 10.240.155.0/HQ:54149 > 10.240.155.10/HQ/HTTPS flow fall within the 10.240.155.0/24 subnet in the Infoblox IPAM dashboard.
When expanding this flow in the Flows by Time chart, since VPC is in the integration keys_fetched, the sVPC value is VPC155.
Site is in the integration keys_aliased values, and a sSite value of HQ appears. Since Desc is aliased to Site (an extensible attribute), sDesc takes on the Site's value. Segment is in the keys_aliased values; hence, sSegment with S155 appears.
Observe similar attributes for the destination IP address in the flow record. All these values come from the Infoblox IPAM dashboard shown earlier. ASNUM does not appear as a field in the flow record despite being in the integration keys_aliased values because it is not configured or associated as an extensible attribute to the subnets in the Infoblox IPAM dashboard.
Figure 33. Flow by Time 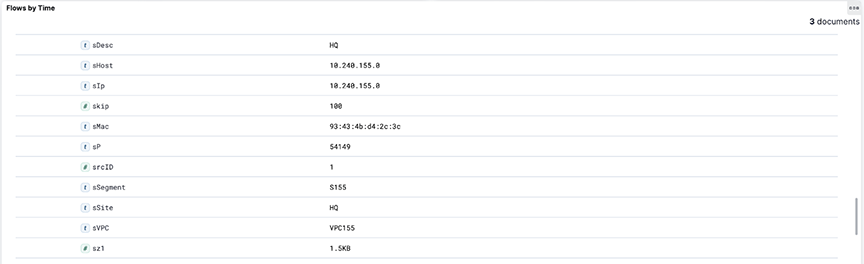 Known Issue:
- When removing a tag in the middle of the ip_block tags list and saving the configuration, the relevant flow records may have incorrect values in their attributes during the minute following this change. After this brief period, the flow records will have the correct attributes and corresponding values.
Troubleshooting
When the flow records augmented with Infoblox extensible attributes are missing these attributes, verify that the Infoblox credentials you provided in the integration configuration are correct. After confirming the credentials and the relevant flow records are still missing the Infoblox extensible attributes, generate a support bundle and contact Arista Networks TAC.
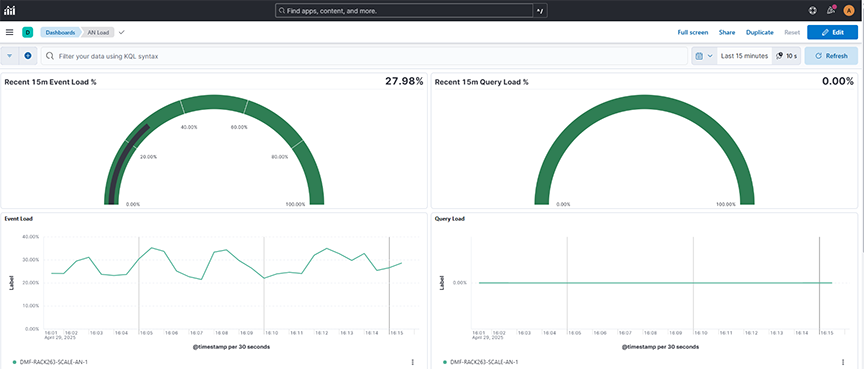
Status
Selecting System → Status displays the status of the data transmitted on the Analytic Node.
- Recent 15m Event Load %: Displays the analytics node's recent event processing load percentage over a selected time range, helping monitor system performance.
- Recent 15m Query Load%: Displays the analytics node's recent query processing load percentage over a selected time range, helping monitor system performance
- Event Load: Displays the event processing load across analytics nodes over a selected time range, helping monitor node performance and traffic handling capacity.
- Query Load: Displays the query processing load across analytics nodes over a selected time range, helping monitor query activity and node utilization.
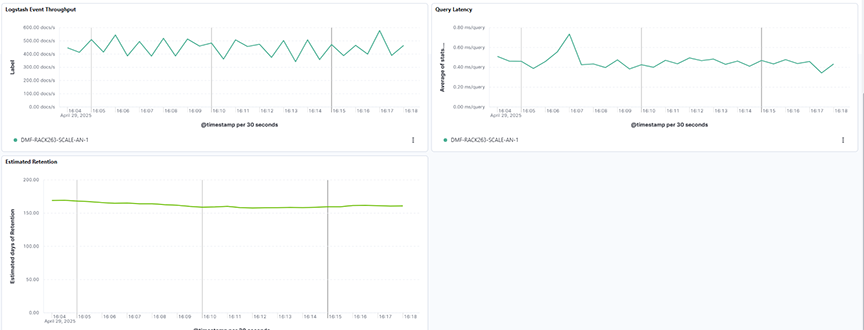
- Logstash Event Throughput: Displays the volume of events processed by Logstash nodes over a selected time range, helping monitor analytics node ingestion performance.
- Query Latency: Displays the average query response time across analytics nodes over a selected time range, helping monitor query performance and system responsiveness.
- Estimated Retention: Displays the estimated retention capacity of the analytics nodes over a selected time range, helping monitor storage trends and plan for data management.
About
Selecting System → About displays the information about the Analytic Node.
