Backup and Restore
Elasticsearch Snapshot and Restore
Elasticsearch provides a mechanism to snapshot data to a network-attached storage device and to restore from it.
Import and Export of Saved Objects
The Saved Objects UI helps keep track of and manage saved objects. These objects store data for later use, including dashboards, visualization, searches, and more. This section explains the procedures for backing up and restoring saved objects in Arista Analytics.
Exporting Saved Objects
- The system displays the following notification if the download is successful.
Figure 1. Verifying a Saved/Downloaded Object 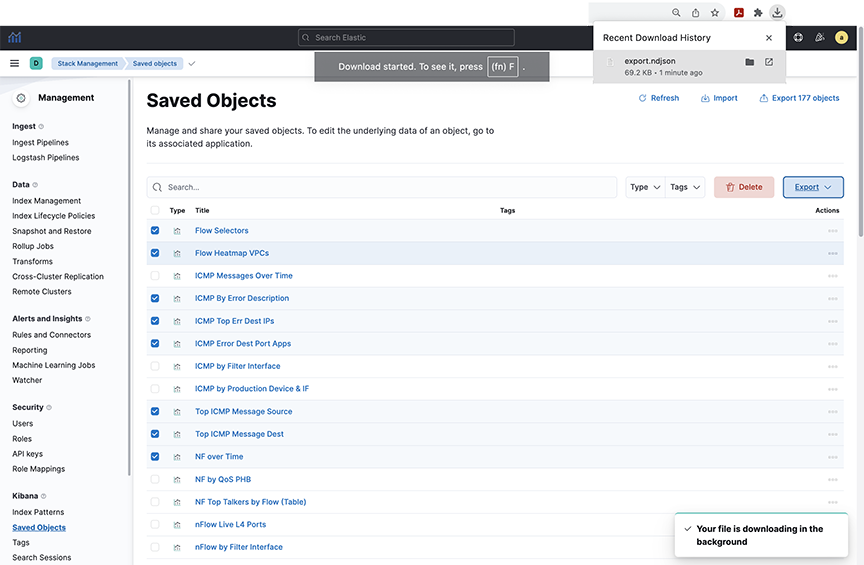 Note: Recommended Best Practices
- While creating saved objects, Arista Networks recommends naming conventions that suit your environment. For instance, in the example earlier, a naming pattern has been used, prefixed with “ARISTA” and specifying Type: dashboard, which allows a manageable set of items to click individually or to select all. Furthermore, exporting individual dashboards based on their Type is a more appropriate option, as tracking modifications to a dashboard improves using this method. Dashboards should select only custom visualizations and searches (i.e., do not depend on default objects that might change during a software upgrade).
- Do not edit any default objects. Arista Networks suggests saving the new version with a different (custom) name if default objects require editing.
- The files exported should be treated as code and reserved in a source control system, so dissimilarities and rollbacks are possible under standard DevOps approaches.
Importing Saved Objects
- To import one or a group of custom-created objects, navigate to .
Figure 2. Importing a Group of Saved Objects 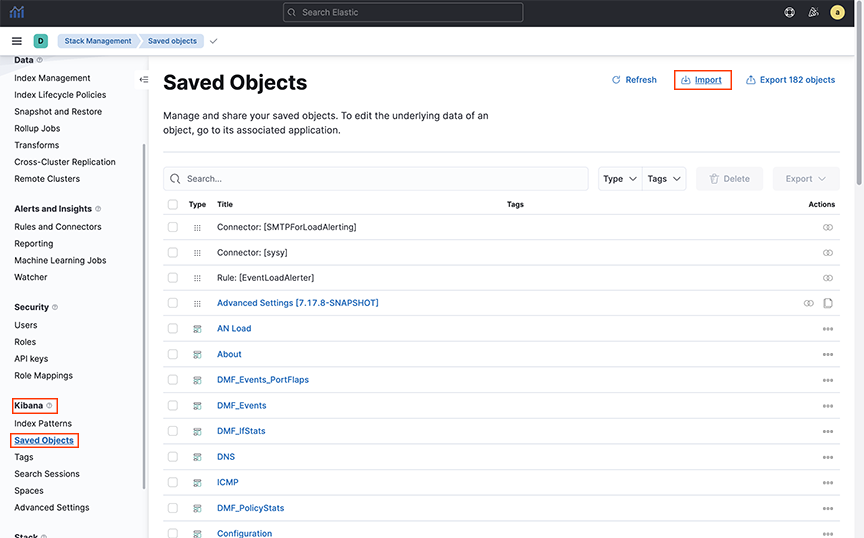
- Click Import and navigate to the NDJSON file that represents the objects to import. By default, saved objects already in Kibana are overwritten by the imported object. The system should display the following screen.
Figure 3. NDJSON File Import Mechanism 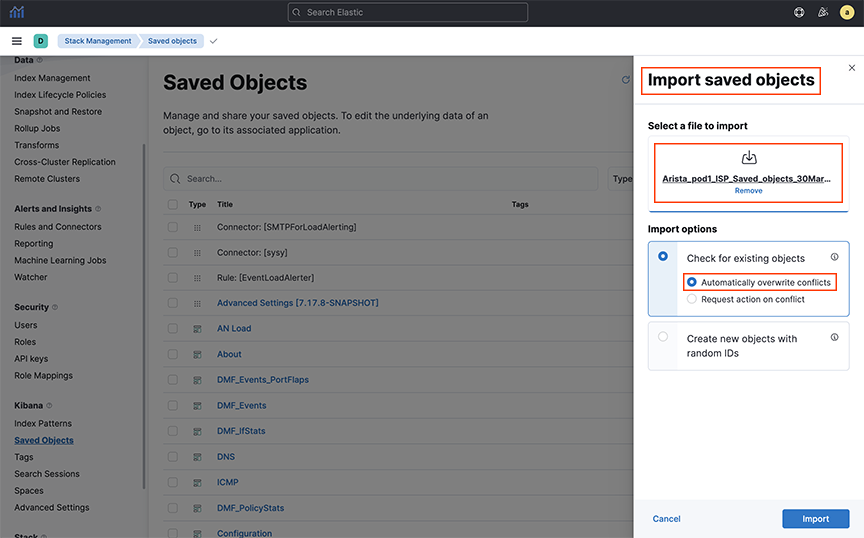
- Verify the number of successfully imported objects. Also verify the list of objects, selecting .
Figure 4. Import Successful Dialog Box 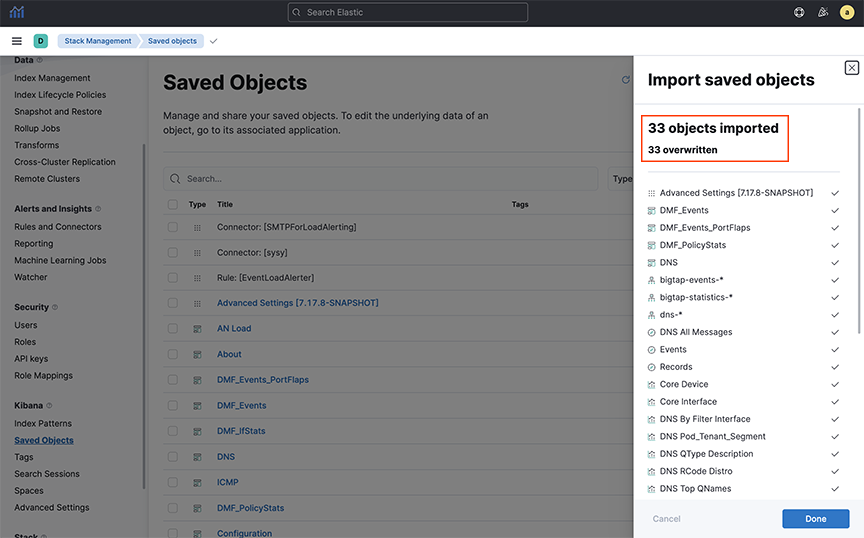
Import and Export of Watchers
Select the Watcher feature to create actions and alerts based on certain conditions and periodically evaluate them using queries on the data. This section explains how to back up and restore the Watchers in Arista Analytics.
Exporting Watchers
- The path parameter required to back up the Watcher configuration is watcher_id. To obtain the watcher_id, go to .
Figure 5. Find Watcher_ID 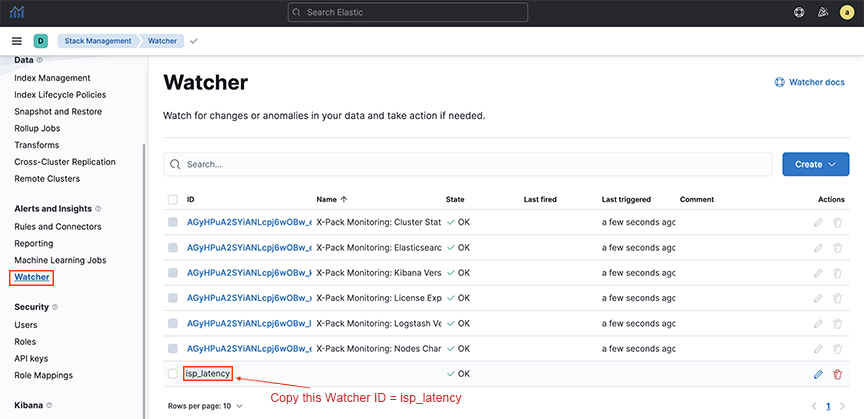
- Open the main menu, then select . Issue the GET API mentioned later with the watcher_id. The response appears in the output terminal.
Run the following API call:
GET _watcher/watch/<watcher_id>Replace Watcher_ID with the watcher_id name copied in Step 1.Figure 6. GET API 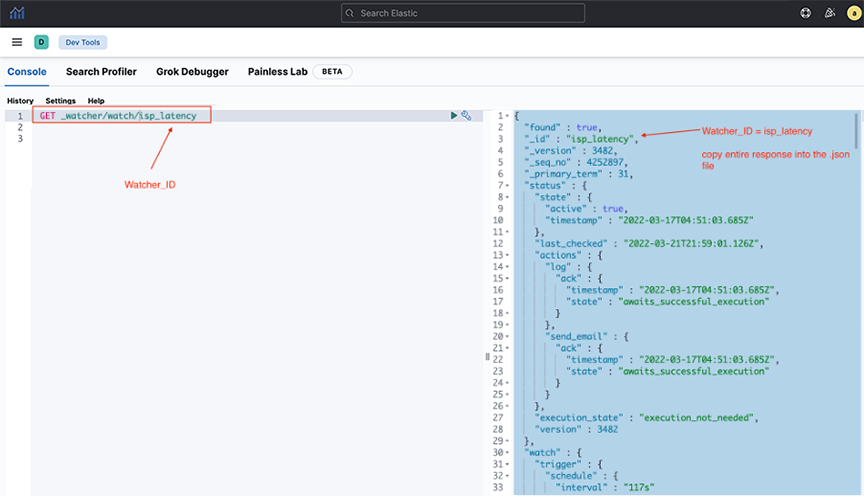
Importing Watchers
- Not all exported fields are needed when importing a Watcher. To filter out the unwanted fields from the exported file, select the jq utility. Select jq .watch <exported_watcher.json>and import the output.
Figure 7. jq Command Output 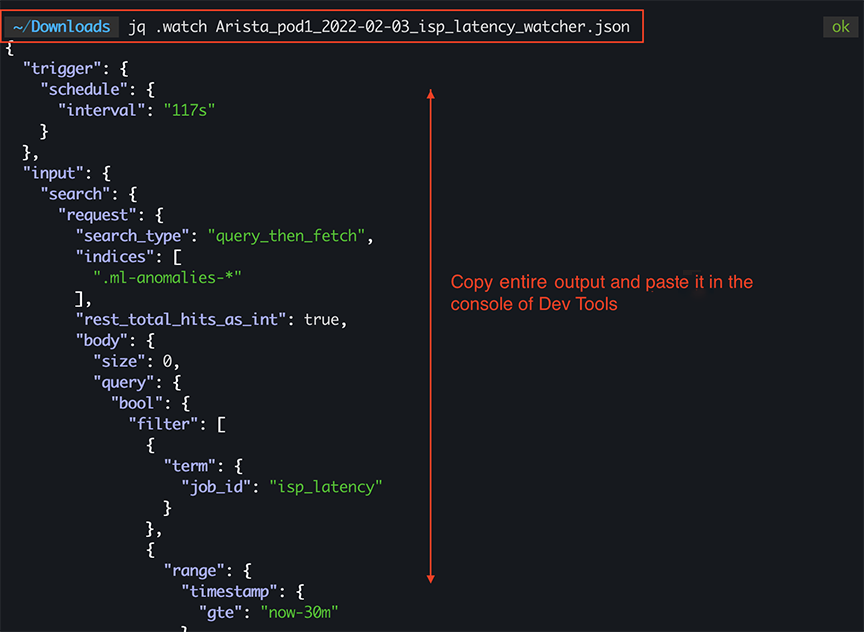
- Click , enter the API PUT_watcher/watch/<watcher_id>, and copy the Step 1 output into the following screen. Replace Watcher_ID with the desired Watcher name. The output terminal will confirm the creation of the Watcher.
Figure 8. PUT API in Dev Tools Console 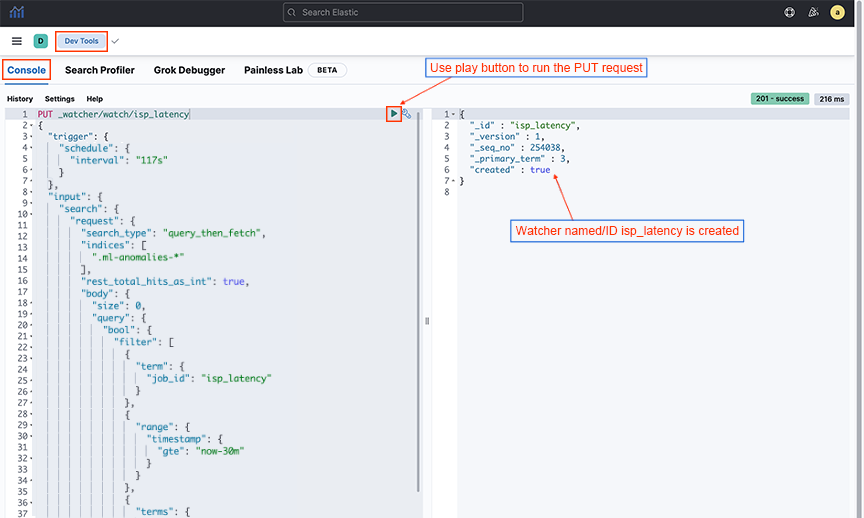
- Locate the newly created Watcher in the .
Figure 9. Watcher 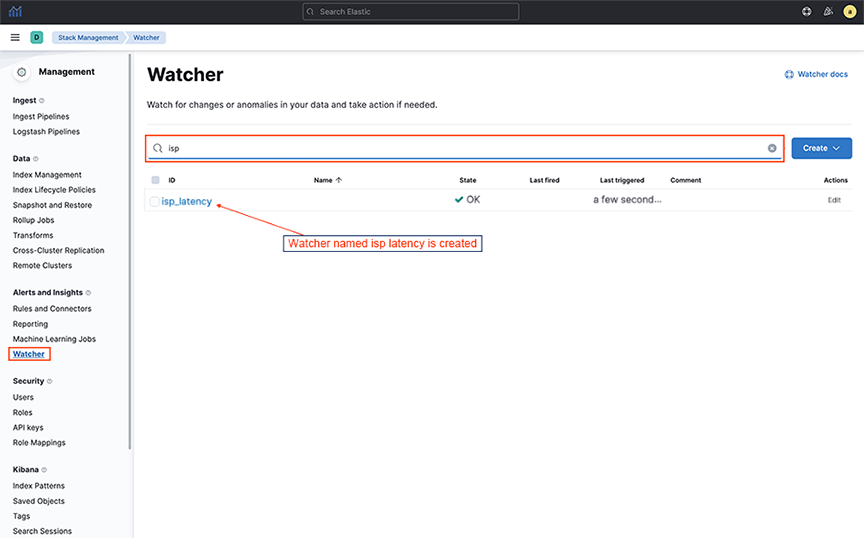
Import and Export of Machine Learning Jobs
Machine Learning (ML) automates time series data analysis by creating accurate baselines of normal behavior and identifying anomalous patterns. This section explains ways to back up and restore the Machine Learning jobs in Arista Analytics.
Exporting Machine Learning Jobs
- Open the main menu, then select . Send a GET _ml/anomaly_detectors/<Job-id> request to Elasticsearch and view the response of all the Machine Learning anomaly jobs. Replace Job_id with the ML job name. The system displays the following output when executing the GET request.
Figure 10. Main Menu > Dev Tools > Console 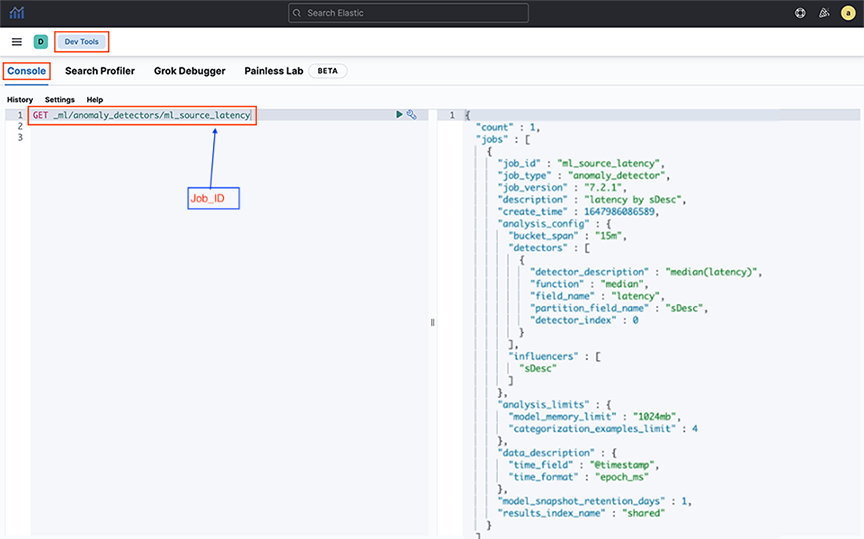
Importing Machine Learning Jobs
- It is optional to import all the exported fields. Only description, analysis_config, and data_description fields may be needed. Running jq '.jobs[] |{description, analysis_config, data_description}'<json-filename> copies the output into the Dev tools console. Replace json-filename with the filename of the JSON file previously exported.
Run the following API call:
jq '.jobs[] |{description, analysis_config, data_description}' Arista_pod1_
2022-02-03_ML_Source_Latency_ML_job.json
Figure 11. jq Required Fields 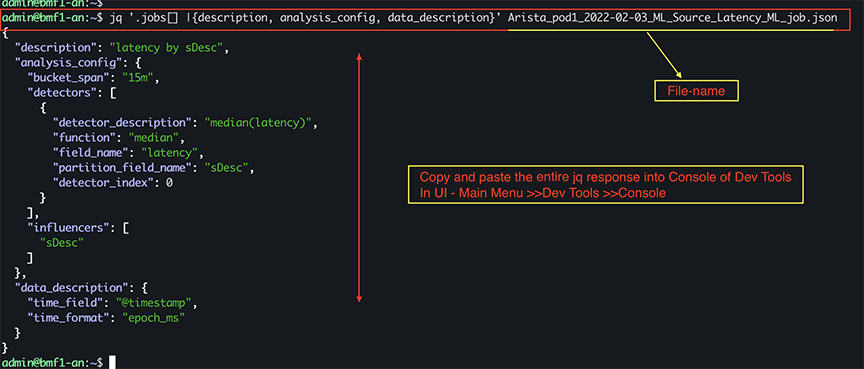
- Select and copy the Step 1 output into the following screen and the PUT request.
Run the following API call:
PUT _ml/anomaly_detectors/<ml_job_name>Replace ml_job_name with the specific string of the ML Job name.Figure 12. PUT ML Jobs API 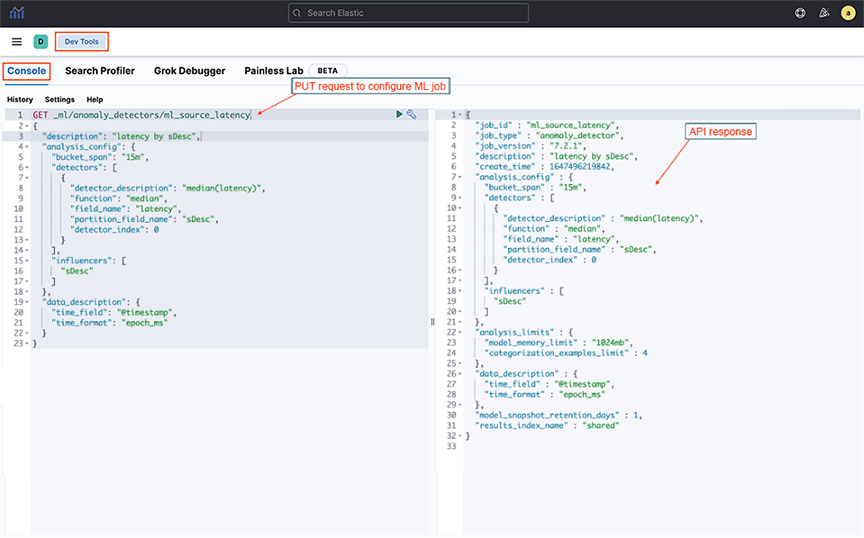
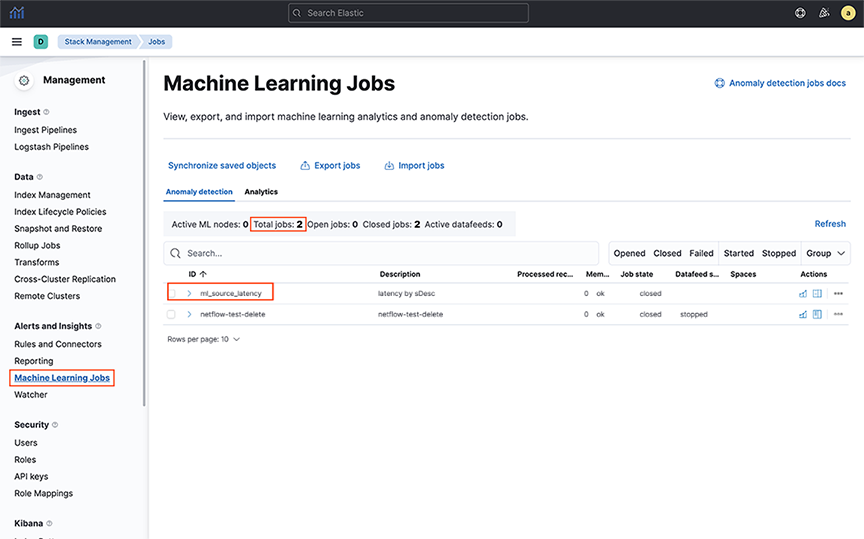
- The successful response to the PUT request confirms the creation of the ML Job. Further, verify imported ML jobs by selecting .
Figure 13. ML Job Verification