Monitoring Network Performance and Events
Interfaces Sending or Receiving Traffic
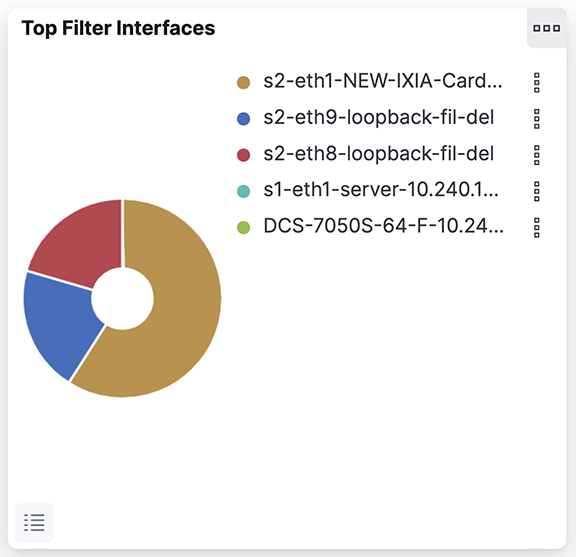
- DMF Top Filter interfaces
- Production interfaces

This information derives from the LLDP/CDP exchange between the production and DANZ Monitoring Fabric switches.
Anomalies
- Comparing dashboards and visualization over time
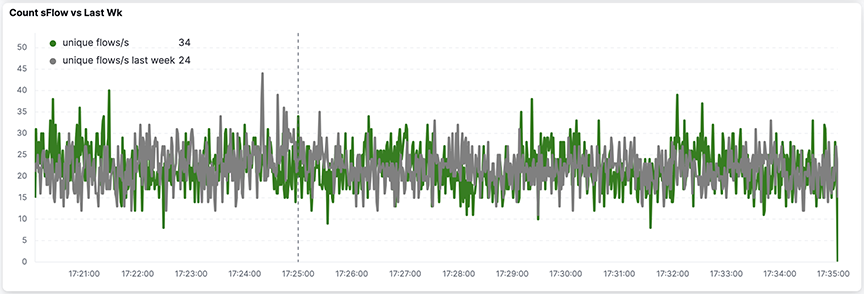
- sFlow®* > Count sFlow vs Last Wk
- New Flows & New Hosts
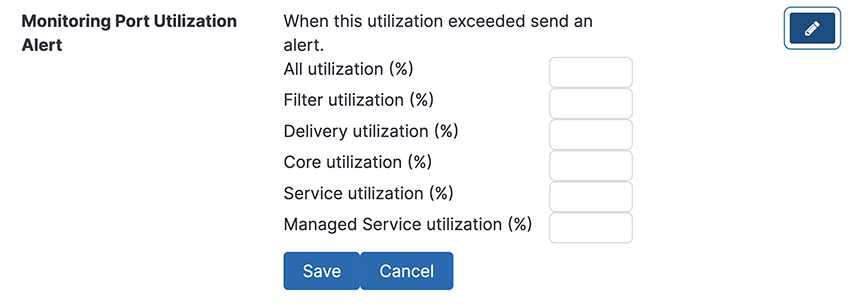
- Utilization alerts
- Machine Learning
Identify any unusual activity by comparing the same dashboard over the past 1 hour to the same time last week's data. For example, the bar visualization of traffic over time shows changing ratios of internal to external traffic, which can highlight an abnormality.
- Filter
- Delivery
- Core
- Services
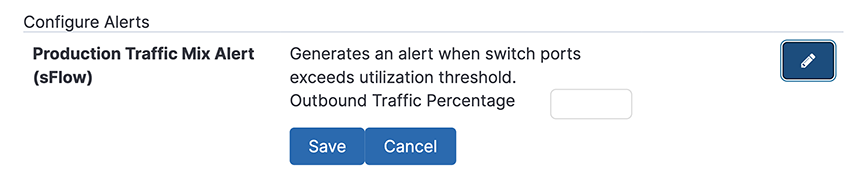
- The percentage of outbound traffic exceeds the usual thresholds.
- New hosts appear on the network every 24 hours.

Application Data Management
Application Data Management (ADM) helps users govern and manage data in business applications like SAP ERP. To use Arista Analytics for ADM, perform the following steps:
- Pick a service IP address or block of IP addresses.
- Identify the main body of expected communication with adjacent application servers.
- Filter down to ports that need to be communicating.
- Expand the time horizon to characterize necessary communication completely.
- Save as CSV.
- Convert the CSV to ACL rules to enforce in the network.
WAN Link Optimization
To identify a WAN link or device that is approaching full utilization, complete the following steps:
- Refer to the Flow by Filter Interface visualization.
Figure 8. Flow by Filter Interface 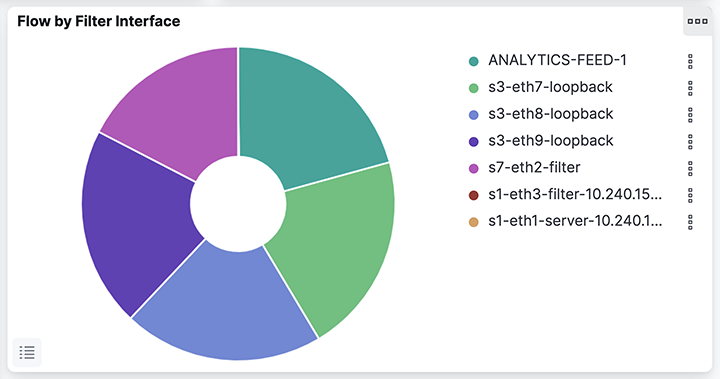
This visualization displays the utilization for each DMF filter interface. To compare this to the traffic from the production interfaces (SPAN or Tap), use the Flow by Production Device & IF visualization.
Figure 9. Flow by Production Device & IF - Select the Filter Interfaces corresponding to the WAN link.
Refer to the Count sFlow vs Last Wk visualization to determine if any significant change in utilization has occurred.
Figure 10. Count sFlow vs Last Wk Use the Traffic over Time visualization to focus on peak and non-peak utilization periods. Drag the cursor horizontally over a peak utilization period, and the display is updated to zoom in on those events.Figure 11. Traffic Over Time 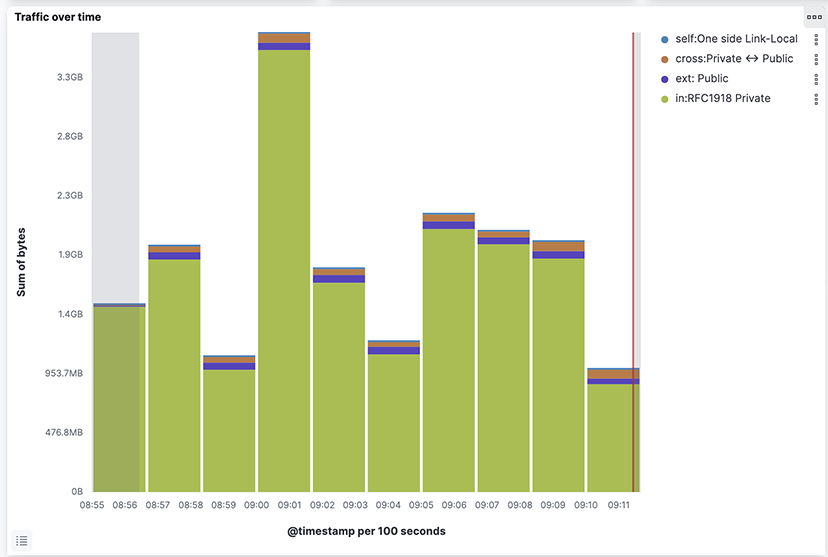
- Use the Time Range configuration to analyze traffic over a month for a more complete characterization.
Figure 12. Expanding Time Period Using the Time Range 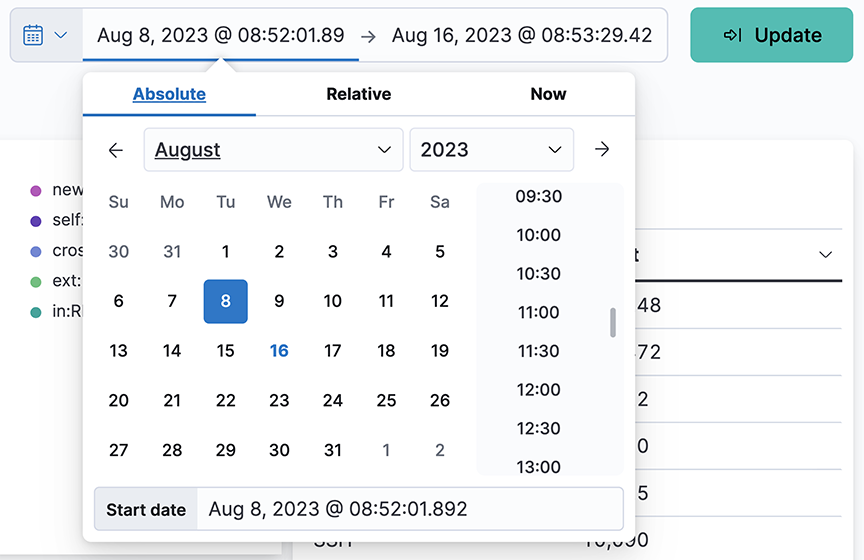
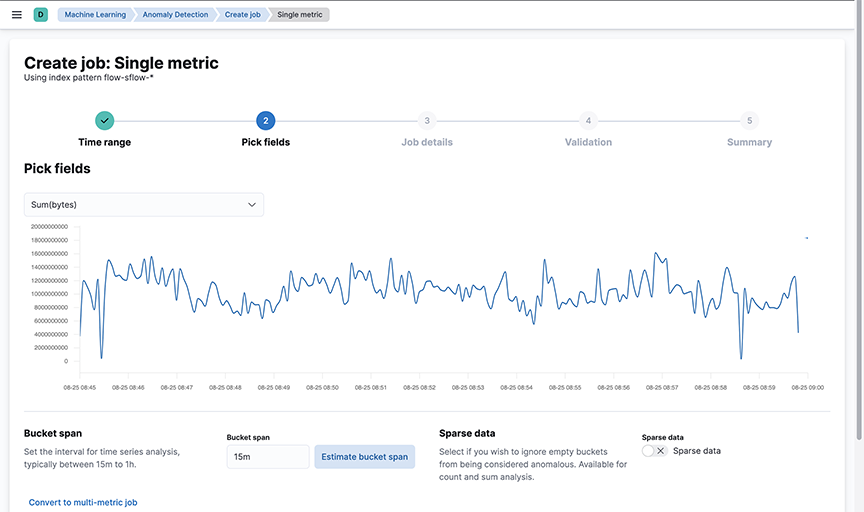
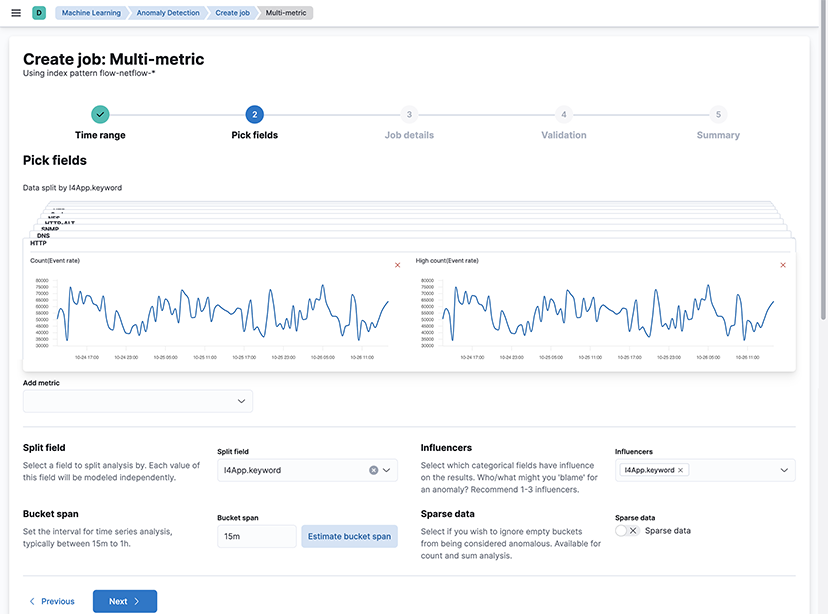
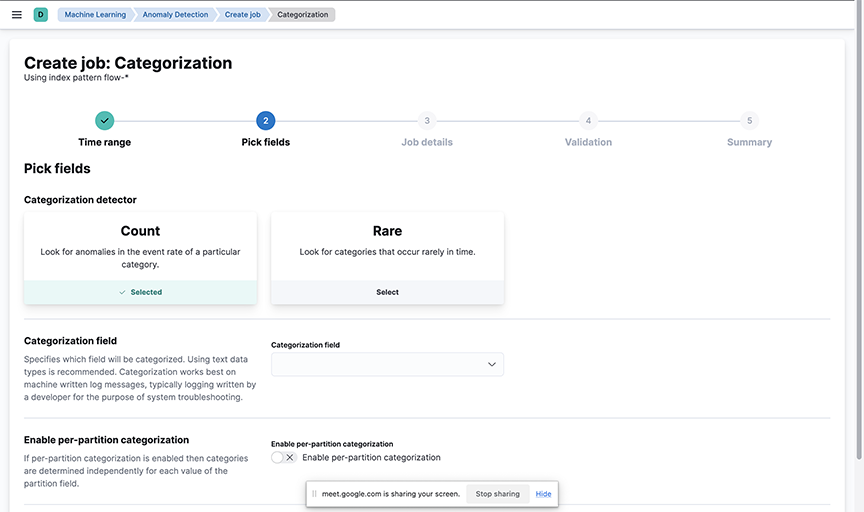
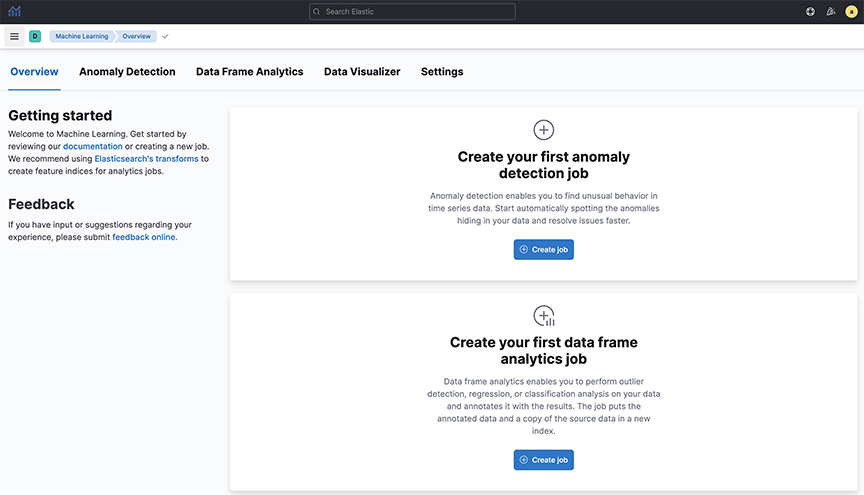
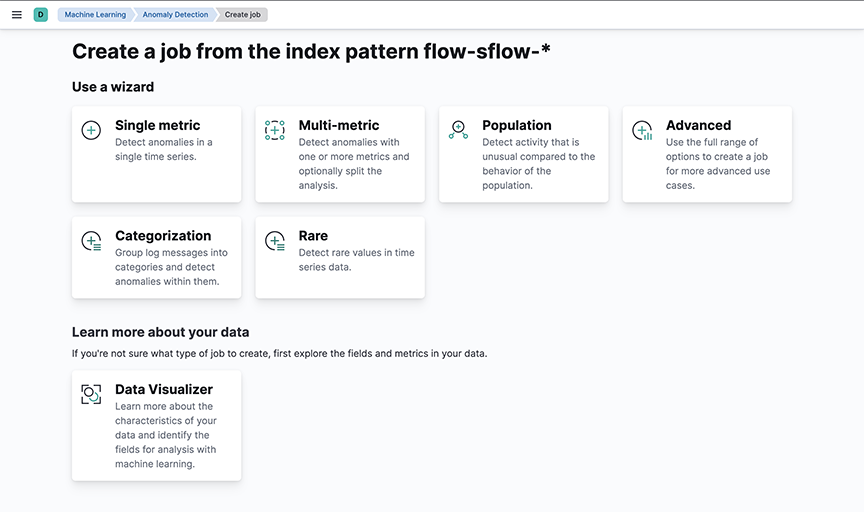
Machine Learning
- Single-metric anomaly detection
- Multimetric anomaly detection
- Population
- Advanced
- Categorization
- Select the time range
- Select the appropriate metric
- Enter details: job ID, description, custom URLs, and calendars to exclude planned outages from the job
Single-metric anomaly detection uses machine learning on only one metric or field.