This chapter describes uses the dashboards on the DMF Network tab to monitor activity on the DANZ Monitoring Fabric. It includes the following sections.
The DMF Network tab includes dashboards that display the following information visible to the DMF controller:
Policy Statistics
Interface Statistics
SN Statistics
Incline Statistics
Events
Note: Information displayed on these dashboards requires configuring an ACL for Redis and replicated Redis using the Analytics CLI after first boot configuration.
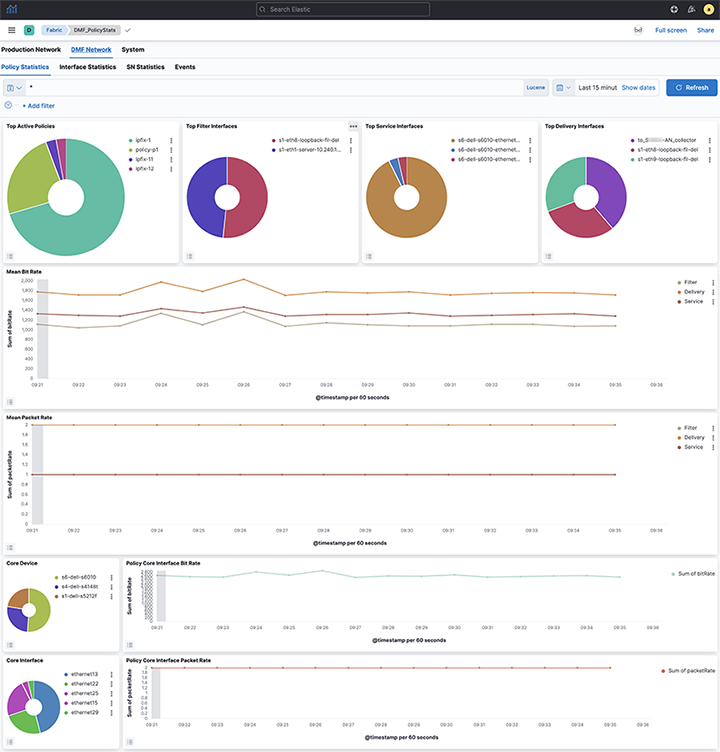
Policy Statistics Dashboard
Click the Policy Statistics tab to display the following dashboard:
Figure 1. DMF Network > Policy Statistics Dashboard
The Policy Statistics dashboard summarizes information about DANZ Monitoring Fabric policy activity and provides the following panels:
Top Active Policies
Top Filter Interfaces
Top Service Interfaces
Top Delivery Interfaces
Mean Bit Rate
Mean Packet Rate
Core Switch
Policy Core Interface Bit Rate
Core Interface
Policy Core Interface Packet Rate
Records
Policies with no traffic
Use the Top Active Policies visualization to verify that your DANZ Monitoring Fabric policies are active and behaving as expected.
Use the Filter Interfaces visualization to balance the utilization of your filter interfaces and ensure that it doesn't drop any packets to analyze.
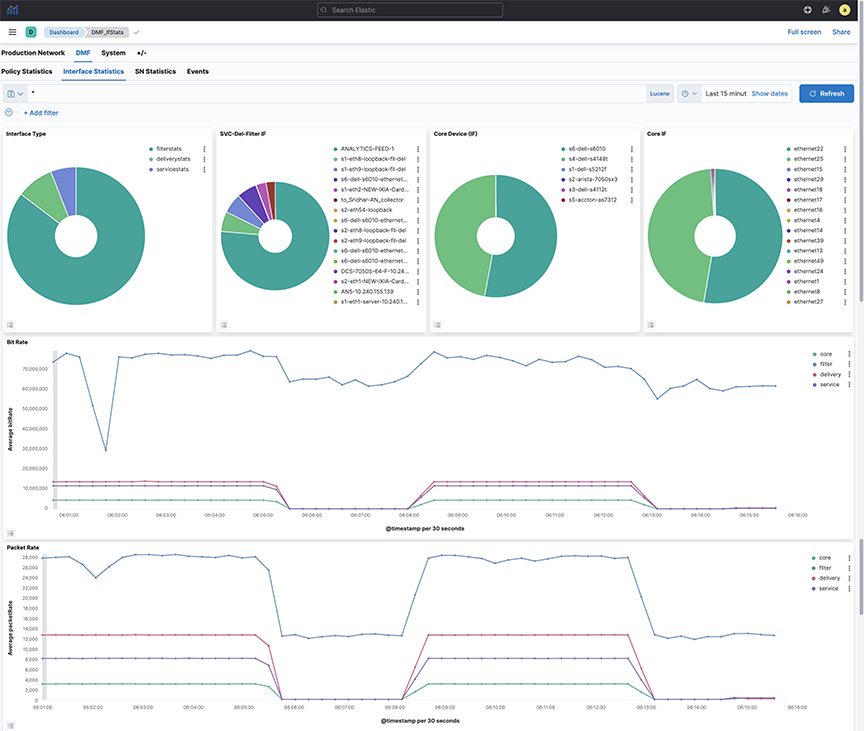
Interface Statistics
Click the Interface Statistics tab to display the following dashboard.
Figure 2. DMF Network > Interface Statistics
The Interface Statistics dashboard summarizes information about DANZ Monitoring Fabric switch interface activity and provides the following panels:
Interface Type
SVC-Del-Filter IF
Core Switch (IF)
Core IF
Bit Rate
Packet Rate
Interface Detail
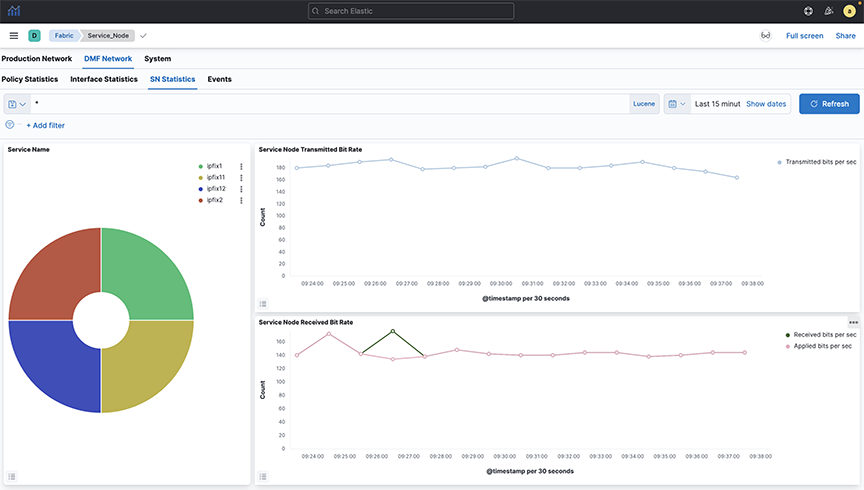
SN (Service Node) Statistics
Click the SN Statistics tab to display the following dashboard.
Figure 3. DMF Network > SN Statistics
Select a service from the pie chart to see the statistics for a specific managed service. It will display statistics for the selected service.
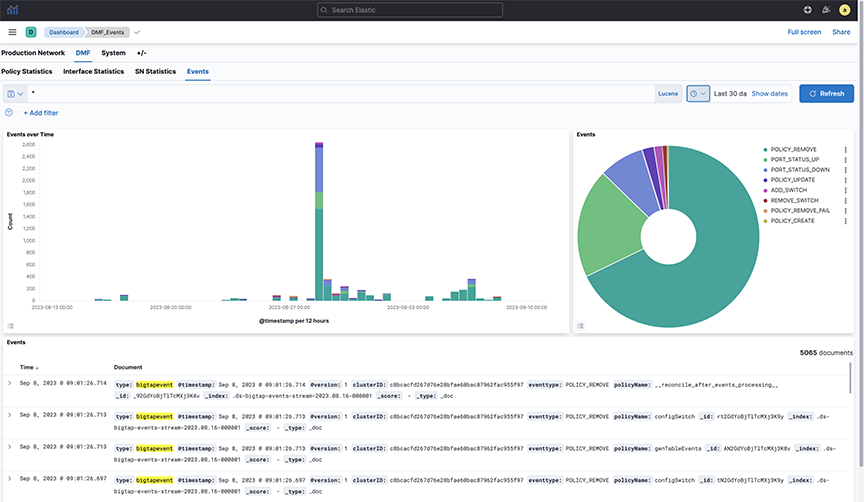
Events
Click the Events tab to display the following dashboard.
Figure 4. DMF Network > Events
The Events dashboard summarizes information about DANZ Monitoring Fabric management network events and provides the following panels: