Network
Rates
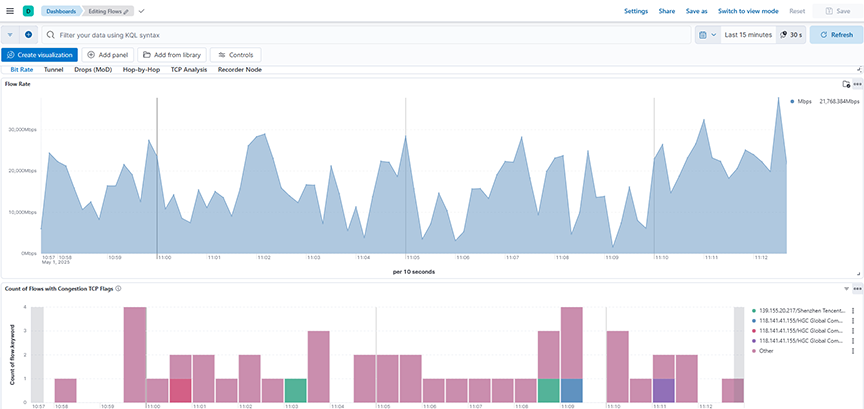
The Network → Rates dashboard summarizes information aboutthe analysis of the rates, congestion, and packets in Wireshark and provides the following panels:
- Flow Rate: Calculates and displays the flow rate in Mbps over a selected time range by summing the upsampledByteCount field and applying a mathematical transformation to derive the bit rate per second.
- Count of Flows with Congestion TCP Flags: Displays the count of flows with congestion TCP flags over a selected time range, grouping and stacking the results based on the top flow identifiers.
Tunnel
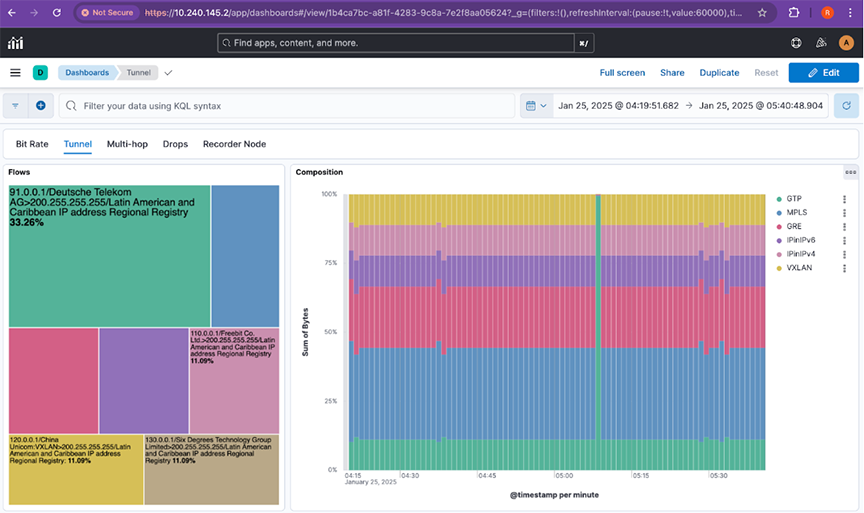
The Network → Tunnel dashboard summarizes information about flows and its composition for the bytes and data and provides the following panels:
- Flows: Displays the distribution of flows based on the sum of bytes across the top flow types over a selected time range, using a treemap for easy comparison.
- Composition: Displays the percentage composition of different Tunnel flow types based on the sum of bytes over a selected time range, using a vertically stacked bar chart for comparison.
Troubleshooting
- Verify records are arriving for sFlow® on the home page of the Analytical Node.
- In Kibana Discover, select data-view flow-sflow-* to determine if any records are arriving.
- Check the agt field to see if the switch sends sFlow, and the AN parses and shows records.
- Verify the records contain fields proto, eType, dP, sP. These are the fields required by this feature to categorize tType to MPLS, GRE, GTP, IPinIPv4, IPinIPv6, and VXLAN.
Drop (MoD)
The Network → Drop (MoD) dashboard provides reasons by analyzing overall drops and drops by flow for dropped packets as a Mirror on Drop (MoD) Flow sFlow collector.
- Top Dropping Flows: Displays the top flows experiencing the highest packet drops, grouped by flow name and based on the sum of drops over a selected time range.
- Drops by Time: Displays the trend of packet drops over a selected time range, plotting the sum of drops against time to highlight when network congestion or loss events occurred.
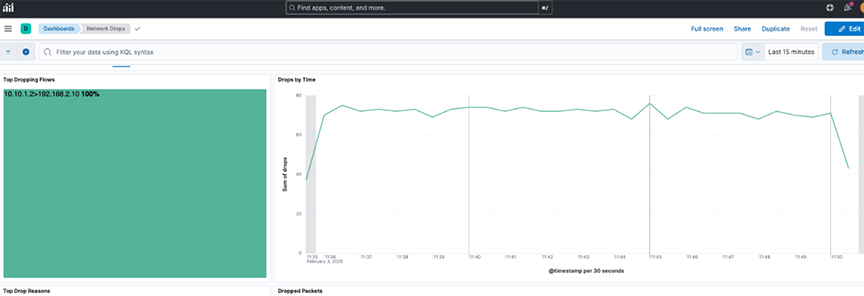
- Top Drop Reasons: Displays the top reasons for packet drops over a selected time range by counting the occurrences of different discard reasons.
- Dropped Packets: Displays the detailed records of dropped packets over a selected time range, including fields like flow information, drop count, and discard reason.

Troubleshooting
- Verify records are arriving for sFlow® on the home page of the Analytical Node.
- In Kibana Discover, select data-view flow-sflow-* to determine if any records are arriving.
- Check the agt field to see if the switch sends sFlow, and the AN parses and shows records.
- Verify the records contain field drops & discard_reason.
Hop-by-Hop
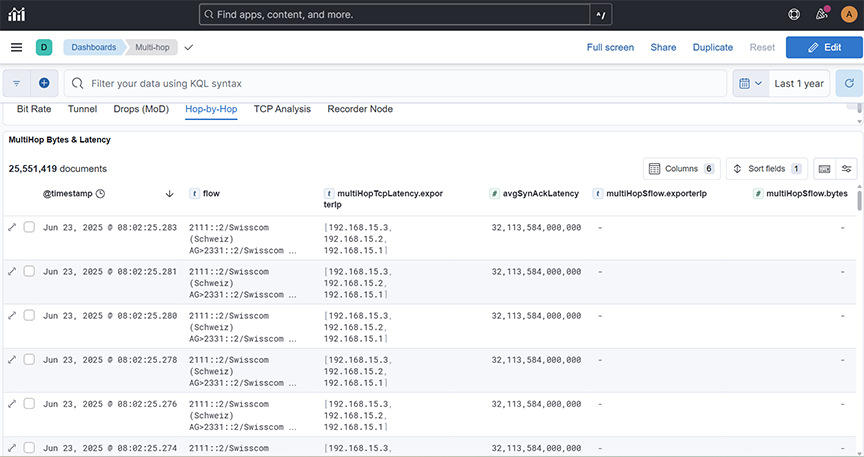
The Network → Hop-by-Hop dashboard provides information about multihop bytes and data.
- MultiHop Bytes & Latency: Displays the distribution of flows based on the multiple hopping of the bytes across the top flow types.
TCP Analysis
The TCP Analysis dashboard provides information about multihop bytes and data.
- TCP Health Flows: Displays the count of TCP health flows observed through Dapper for different flow types over a selected time range, helping monitor network performance and detect anomalies.
- TCP Window LineChart: Displays the average TCP window size and flight size metrics over a selected time range to monitor flow control behavior and congestion trends as part of TCP Analysis (Dapper).
- Incidence TCP Network Loss: Displays the number of TCP retransmissions over a selected time range to monitor packet loss and network reliability as part of TCP Analysis (Dapper).
- Incidence of Zero TCP Window: Displays the number of Zero TCP Window events over a selected time range to monitor periods when receivers are unable to accept more data, helping assess congestion and flow control issues as part of TCP Analysis (Dapper).
- Timings LineChart: Plots the average Round-Trip Time (RTT) and Sender Reaction Time across a selected time range to help monitor network latency and transmission responsiveness as part of TCP Analysis (Dapper).
DMF Recorder Node
This section describes Arista Analytics to use with the DANZ Monitoring Fabric Recorder Node. It includes the following sub-sections.
Overview
- Querying packets across multiple recorders.
- Viewing recorder status, statistics, errors, and warnings.
DANZ Monitoring Fabric Policy determines matching packets to one or more recorder interfaces. The DMF Recorder Node interface defines the switch and port where the recorder connects to the fabric. A DANZ Monitoring Fabric policy treats these as delivery interfaces.
The recorder node visualization is present in both NetFlow and TCPflow dashboards.
General Operation
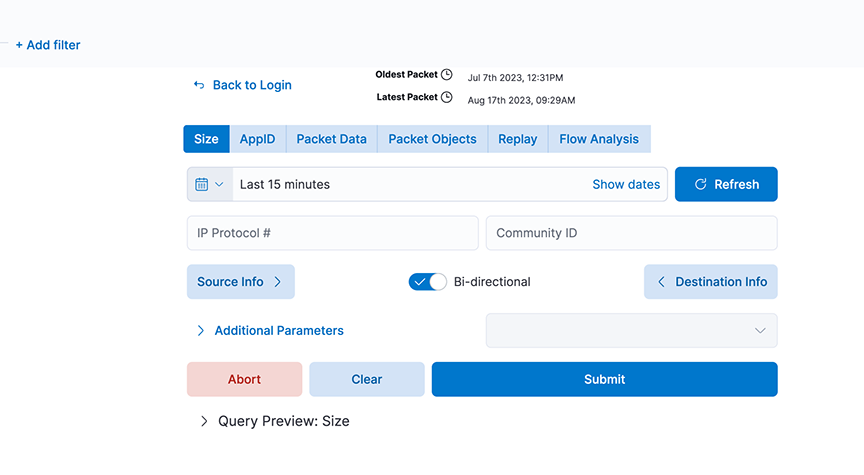
The Recorder Node window can compose and submit a query to the DMF Recorder Node. Select any of the fields shown to create a query and click Submit. The Switch Controller link at the bottom of the dialog can log in to a different DMF Recorder Node.
Select the Recorder Summary query to determine the number of packets in the recorder database. Then, apply filters to retrieve a reasonable number of packets with the most interesting information.
You can modify the filters in the recorder query until a Size query returns the most beneficial number of packets.
Query Parameters
- Query Type
- Size: Retrieve a summary of the matching packets based on the contents and search criteria stored in the recorder node. Here, Size refers to the total frame size of the packet.
- AppID: Retrieve details about the matching packets based on the contents and search query in the recorder node datastore, where the packets are stored. Use this query to see what applications are in encrypted packets.
- Packet Data: Retrieve the raw packets that match the query. At the end of a search query, it generates a URL pointing to the location of the pcap if the search query is successful.
- Packet Objects: Retrieve the packet objects that match the query. At the end of a search query, it generates a URL pointing to the location of the objects (images) if the search query is successful.
- Replay: Identify the Delivery interface in the field that appears, where the replayed packets are forwarded.
- FlowAnalysis: Select the flow analysis type (HTTP, HTTP Request, DNS, Hosts, IPv4, IPv6, TCP, TCP Flow Health, UDP, RTP Streams, SIP Correlate, SIP Health).
- Time/Date Format: Identify the matching packets' time range as an absolute value or relative to a specific time, including the present.
- Source Info: Match a specific source IP address/MAC Address/CIDR address.
- Bi-directional: Enabling this will query bi-directional traffic.
- Destination Info: Match a specific destination IP address/MAC Address/CIDR address.
- IP Protocol: Match the selected IP protocol.
- Community ID: Flow hashing.
- VLAN: Match the VLAN ID.
- Outer VLAN: Match the outer VLAN ID when multiple VLAN IDs exist.
- Inner/Middle VLAN: Match the inner VLAN ID of two VLAN IDs or the middle VLAN ID of three VLAN IDs.
- Innermost VLAN: Match innermost VLAN ID of three VLAN IDs.
- Filter Interfaces: Match packets received at the specified DANZ Monitoring Fabric filter interfaces.
- Policy Names: Match packets selected by the specified DANZ Monitoring Fabric policies.
- Max Size: Set the maximum size of the query results in bytes.
- Max Packets: Limits the number of packets the query returns to this set value.
- MetaWatch Device ID: Matches on device ID/serial number found in the trailer of the packet stamped by the MetaWatch Switch.
- MetaWatch Port ID: Matches on application port ID found in the trailer of the packet stamped by the MetaWatch Switch.
- Packet Recorders: Query a particular DMF Recorder Node. Default is none or not selected; all packet recorders configured on the DANZ Monitoring Fabric receive the query.
- Dedup: Enable/Disable Dedup.
- Query Preview: After expanding, this section provides the Stenographer syntax used in the selected query. You can cut and paste the Stenographer query and include it in a REST API request to the DMF Recorder Node.
Using Recorder Node with Analytics
For interactive analysis, any set of packets exceeding 1 GB becomes unwieldy. To reduce the number of packets to a manageable size, complete the following steps: