Production
sFlow®
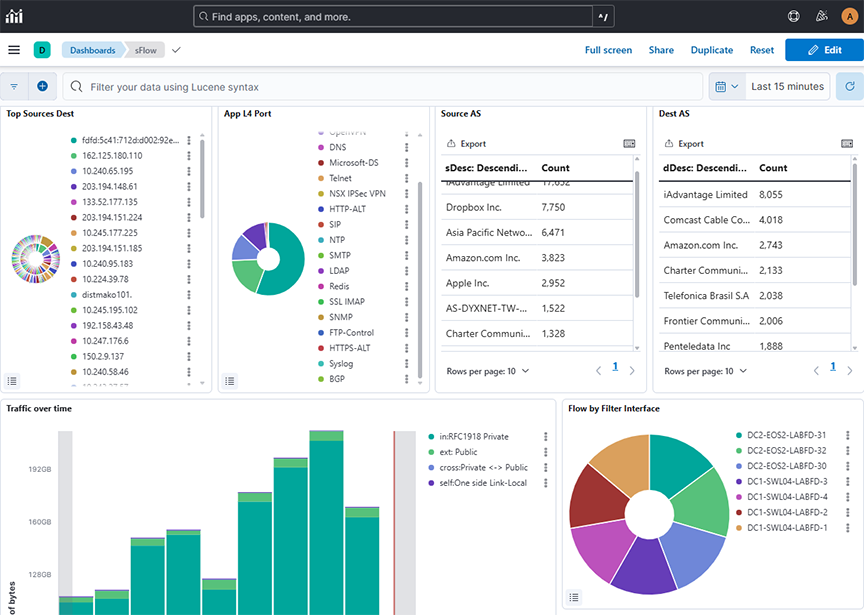
- Top Sources Dest: Configures a real-time network traffic monitoring dashboard using sFlow data, displaying flows over a selected time range grouped by source (sHost.keyword) and destination (dHost.keyword) IPs/hosts, sorted descendingly to highlight top talkers and recipients for rapid traffic pattern analysis.
- App L4 Port: Configures a real-time sFlow traffic dashboard displaying flows over a selected time range grouped by L4 application protocols (l4App.keyword) and sorted descendingly to highlight the most active applications for quick protocol-level traffic analysis.
- Source AS: Displays a real-time tabular view of sFlow traffic data, showing the top source descriptions (sDesc) by flow count in descending order to highlight the most active network entities over a selected time range.
- Dest AS: Displays a real-time tabular view of sFlow traffic data, showing the top source descriptions (dDesc) by flow count in descending order to highlight the most active network entities over a selected time range.
- Traffic over Time: Configures a time-based stacked bar chart using sFlow data, showing the sum of upsampled byte counts over a selected time range, categorized by traffic type filters to analyze traffic distribution across private, public, and link-local networks.
- Flow by Filter Interface: Displays a donut chart using sFlow data to show the count of flow records over a selected time range, grouped by BT interface name (BTifName) in descending order to highlight the most active interfaces.
- Flow by Production Device & IF: Displays a nested donut chart using sFlow data over a selected time range, grouping flow record counts by device and device port in descending order to identify the most active devices and their respective ports in the network.
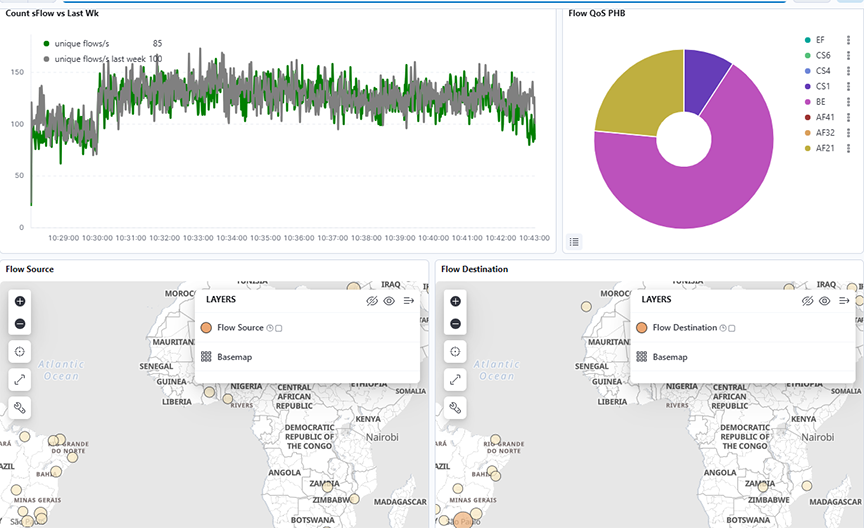
- Count sFlow vs. Last Wk: Tracks the rate of unique network flows per second using sFlow data over a selected time range. It compares it with the same metric from the previous week for anomaly detection and traffic trend analysis.
- Flow QoS PHB: Configures a real-time traffic classification dashboard using sFlow data, displaying the count of flows over a selected time range grouped by Differentiated Services Code Point (DSCP) values (phb.keyword), helping identify traffic prioritization and QoS usage patterns.
- Flow Source: Displays global network traffic sources using sFlow data over a selected time range, mapped geographically to highlight the density and distribution of flow sources across regions.
- Flow Destination: Displays global network traffic destinations using sFlow data over a selected time range, mapped geographically to highlight the density and distribution of flow destinations across regions.
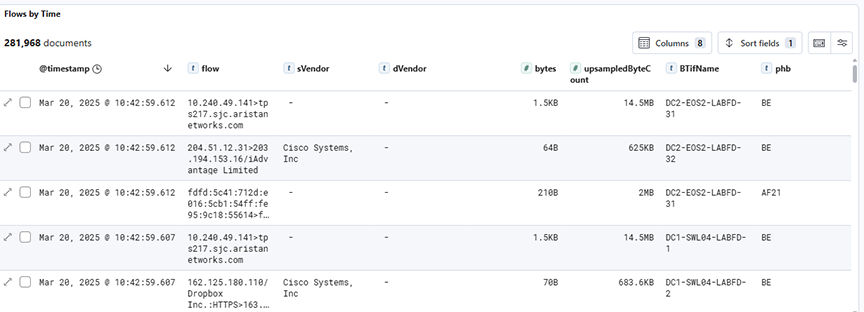
- Flows by Time: Displays detailed raw sFlow traffic records over a selected time range, showing individual flow entries along with associated metadata such as source/destination vendors, byte counts, interface names, and PHB values for in-depth traffic inspection.
sFlow® Monitoring of MPLS and GRE Tunnels
- IPv4 and IPv6 packets encapsulated in one or more MPLS headers.
- IPv4 and IPv6 packets encapsulated in one or more GRE headers.
- Combination of (1) and (2).
- VXLAN encapsulated in one or more GRE headers
The following table shows the supported combinations of headers.
| 1 | Ethernet |
MPLS(one or more) |
IPv4/IPv6 | TCP/UDP | |||||
| 2 | Ethernet | IPv4/IPv6 |
GRE + IPv4/IPv6(one or more) |
TCP/UDP | |||||
| 3 | Ethernet |
MPLS(one or more) |
IPv4/IPv6 |
GRE + IPv4/IPv6(one or more) |
TCP/UDP | ||||
| 4 | Ethernet | IPv4/IPv6 |
GRE + IPv4/IPv6(one or more) |
UDP | VxLAN | Ethernet |
VLAN(optional) |
IPv4/IPv6 | TCP/UDP |
This feature enhances the visibility of tunnelled traffic by documenting the content of packet headers in Analytics' Elasticsearch database. It does not affect the current formatting of Elasticsearch documents containing VXLAN headers not encapsulated by any other tunnel header.
Elasticsearch Documents
It displays each encapsulated header in a JSON object whose name has an ‘e’ prefix followed by an integer corresponding to the position of the header in the packet, 1 being the outermost tunnel header. It displays the innermost header in a JSON object named innerPkt. The following is an example of such a JSON object:
"e1": {
		"encapType": "MPLS",
		"label": 90,
		"ttl": 10
	},
	"e2": {
		"encapType": "MPLS",
		"label": 91,
		"ttl": 9
	},
	"e3": {
		"encapType": "IPv4",
		"sIp": "10.99.230.30",
		"dIp": "10.51.49.227",
		"proto": 47
	},
	"e4": {
		"encapType": "GRE",
		"proto": 34525
	},{
	"sMac": "e2:d8:dd:e3:6a:57",
	"dMac": "84:3d:9c:be:a7:1a",

	"e5": {
		"encapType": "IPv6",
		"sIp": "4cdd:2cde:2ead:248e:1e9b:c3dc:9e3f:3d2b",
		"dIp": "9f0a:a91a:7e79:31e:78c8:e47b:1cd2:e783",
		"proto": 47
	}.
	"e6": {
		"encapType": "GRE",
		"proto": 2048
	},
	"e7": {
		"encapType": "IPv4",
		"sIp": "10.218.163.106",
		"dIp": "10.79.78.163",
		"proto": 17
	},
	"e8" {
		"encapType": "UDP",
		"sP": 9999,
		"dP": 4739
	},
	"e9": {
		"encapType": "VXLAN",
		"vni": 8888
	},
	"innerPkt": {
		"sMac": "16:af:16:2e:83:0c",
		"dMac": "e6:32:ff:5e:50:3f",
		"sIp": "10.44.66.146",
		"dIp": "10.218.200.227",
		"proto": 6,
		"sP": 7777,
		"dP": 443
	}
}
Each header displays a different set of information.
- encapType: Always set to MPLS
- label: MPLS label number
- ttl: MPLS TTL
- encapType: Always set to GRE
- proto: Ethernet type
- key: GRE key, if present
- seqNum: GRE sequence number, if present
- encapType: Always set to VXLAN
- vni: VNI number
- encapType: IPv4 or IPv6
- sIp: Source IP address
- dIp: Destination IP address
- proto: IP protocol number
- encapType: UDP
- sP: Source port
- dP: Destination port
Troubleshooting
If sFlow documents do not appear in ElasticSearch, Arista Networks recommends creating a support bundle and contacting Arista TAC.
Limitations
- Since MPLS headers do not include any information about the encapsulated packets, processing of MPLS encapsulating any header other than IPv4 or IPv6 will result in undefined behaviour.
- It displays the IP addresses of headers that are outer-tunnelled the sFlow dashboard, but nothing beyond (e.g., UDP/TCP port number in inner headers).
- This feature does not support the PseudoWire control word.
- This feature supports up to 4 MPLS labels displayed on the dashboard. Packets with 5 or more MPLS labels will not appear on the dashboard, but they are present in Elasticsearch.
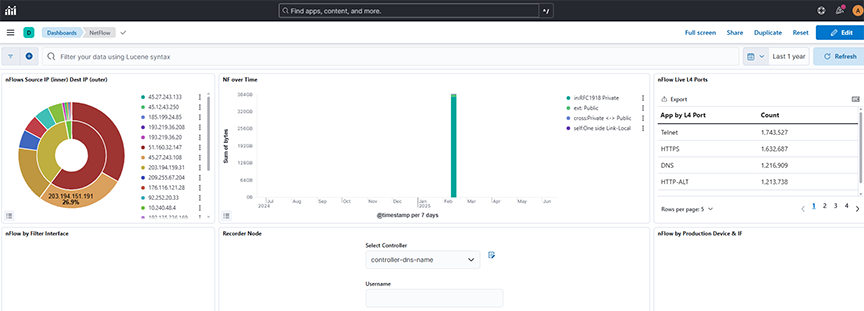
NetFlow
Selecting Production → NetFlow displays data transmitted on the Analytic Node.
- nFlows Source IP (inner) Dest IP (outer): Displays NetFlow data over a selected time range, showing the count of flows grouped by source (slp) and destination (dlp) IP addresses in descending order to identify the most active endpoints.
- NF over Time: Displays the sum of bytes over a selected time range, with time-based aggregation on the X-axis and filtered series split by traffic direction tags (for example, internal, external, cross, self) for comparative flow analysis.
- nFlow Live L4 Ports: Displays the count of NetFlow records over a selected time range, grouped by the l4App.keyword field using a row-based split to categorize traffic based on Layer 4 application types.
- nFlow by Filter Interface: Displays NetFlow data as a pie chart over a selected time range, counting flow records grouped by BTifName (interface name) in descending order to highlight the top 50 interfaces by activity.
- Recorder Node
- nFlow by Production Device & IF: Displays NetFlow data as a nested pie chart over a selected time range, showing the count of flow records grouped first by device name and then by device port, sorted in descending order to highlight the most active sources and interfaces.
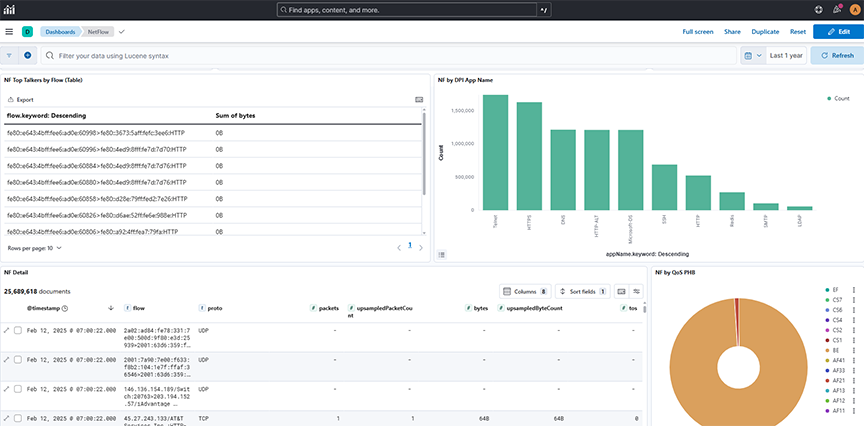
- NF Top Talkers by Flow (Table): Displays NetFlow records in a table format over a selected time range, showing flow identifiers sorted in descending order to highlight the top talkers by flows.
- NF by DPI App Name: Displays a count of NetFlow records over a selected time range, grouped by application name (appName.keyword) to identify the most active applications in the network traffic in descending order.
- NF Detail: Displays detailed NetFlow records over a selected time range, showing individual flow entries and associated metadata such as source/destination IPs, protocol, packet, and byte counts, enabling granular network traffic inspection.
- NF by Qos PHB: Displays a count of NetFlow records over a selected time range, grouped by Per-Hop Behavior (phb.keyword) in descending alphabetical order to analyze differentiated services traffic classification.
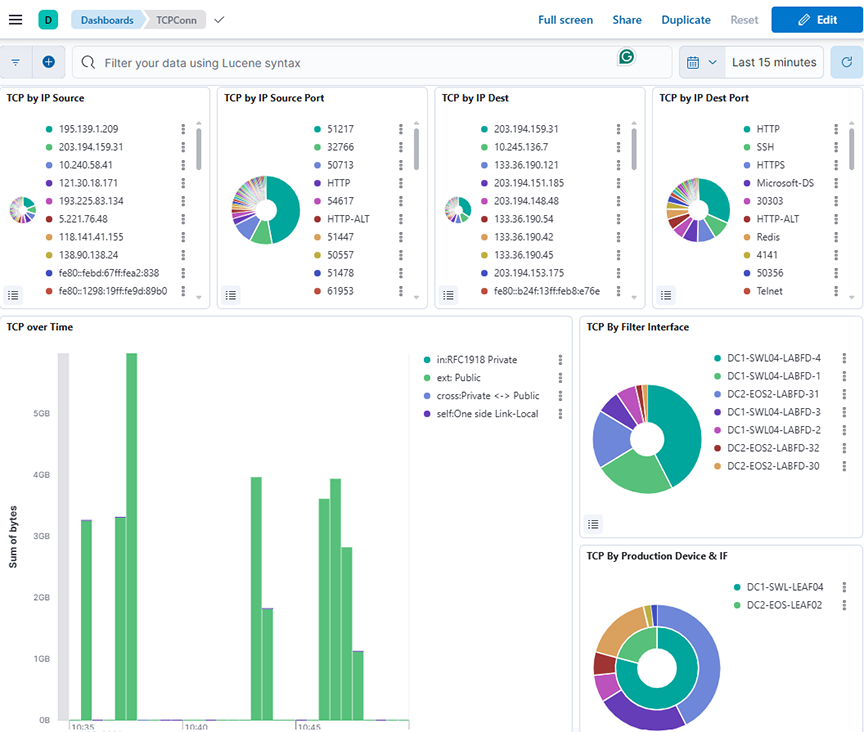
TCP Flow
Selecting Production → TCPFlow displays data transmitted on the Analytic Node.
The information on the TCP Flow dashboard depends on TCP handshake signals and deduplicates. The switch description is specified in the Description attribute of each switch, configured on the DANZ Monitoring Fabric Controller.
- TCP by IP Source: Displays the distribution of TCP connections over a selected time range, grouped by Source IP address (sip) and ordered by count in descending order.
- TCP by IP Source Port: Displays the distribution of TCP connections over a selected time range, grouped by source port (sP.keyword) and sorted by connection count in descending order.
- TCP by IP Dest: Displays the distribution of TCP connections over a selected time range, grouped by destination IP address (dlp) and ordered by count in descending order.
- TCP by IP Dest Port: Displays the distribution of TCP connections over a selected time range, grouped by destination port (dP.keyword) and sorted by connection count in descending order.
- TCP over Time: Displays the total bytes of TCP traffic over a selected time range, grouped by timestamp and categorized by traffic direction using tag-based filters (for example, private, public, and cross-zone flows).
- TCP by Filter Interface: Displays the distribution of TCP connection counts over a selected time range, categorized by BT interface name using descending order of occurrence.
- TCP By Production Device & IF: Displays the count of TCP connections over a selected time range, grouped first by device name and then by device port, using a nested pie chart.
- SYN SYNACK Connection Latency(e2e) in msec: Displays the maximum end-to-end SYN-SYNACK connection latency in milliseconds over a selected time range using a time-based line graph.
- SYN SYNACK Connection Latency(e2e) percentiles: Displays the SYN-SYNACK end-to-end connection latency across multiple percentiles (1st, 5th, 25th, 50th, 75th, and 95th) over a selected time range using a time-series line graph.
- TCP Top Latency Table: Displays the top TCP flows sorted by their maximum observed latency over a selected time range.
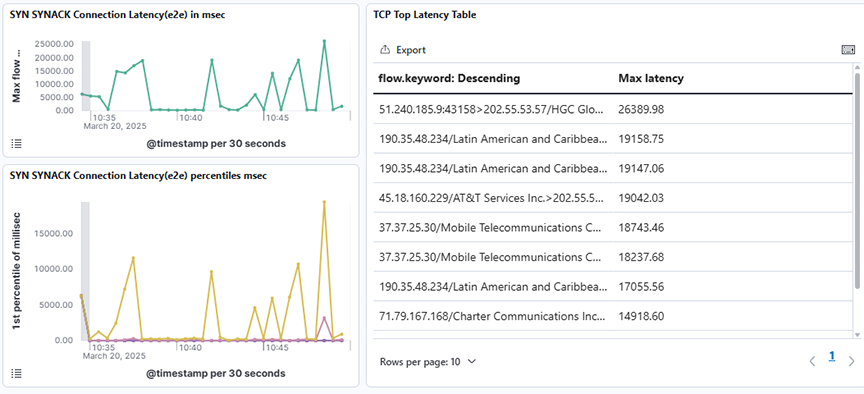
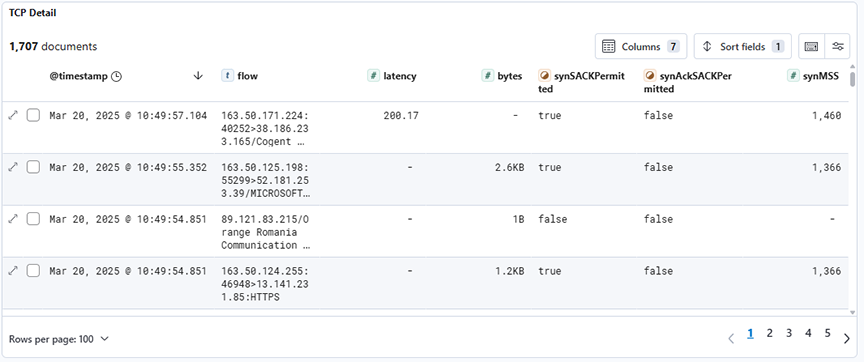
- TCP Detail: Displays detailed TCP connection records filtered by type:tcpconnection, showing attributes such as latency, byte count, and SYN/SYNACK flags for each flow over a selected time range.
Flows
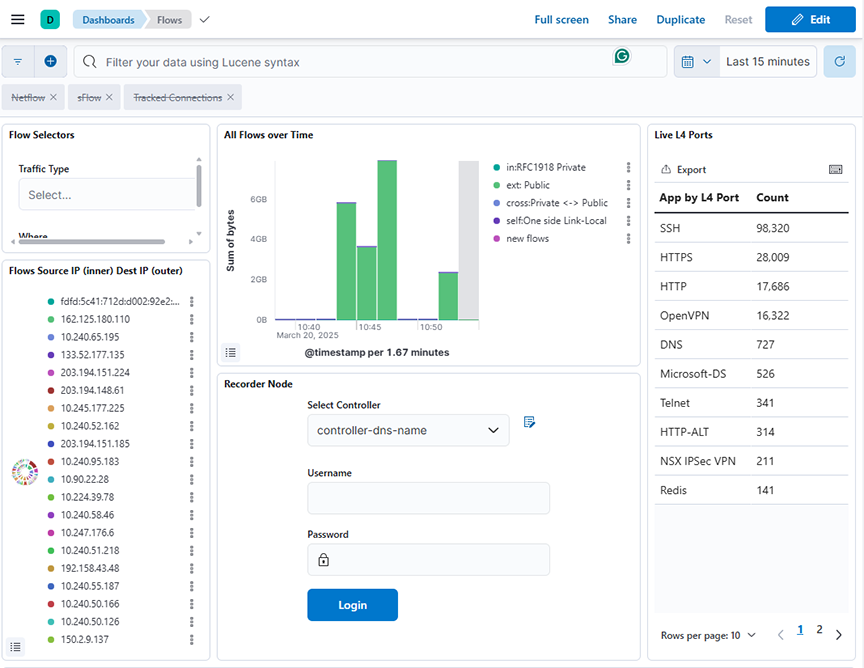
Selecting Production → Flows displays the network's data efficiency, high traffic monitoring and scalability on the Analytic Node.
- Flow Selector: Allows network traffic data to be filtered using dynamic dropdowns for Traffic Type based on tags.keyword field, enabling users to interactively refine insights over a selected time range.
- All Flows over Time: Displays the sum of bytes for different traffic categories (for example, private, public, cross-zone, link-local, and new flows) over a selected time range, using a date histogram with 100-second intervals.
- Live L4 Port: Displays the count of flow records grouped by L4 application port over a selected time range using the l4App.keyword field for aggregation.
- Flows Source IP (inner) Dest IP (outer): Displays the count of flows grouped first by source IP (sip) and then by destination IP (dip) over a selected time range.
- Recorder Node: Refer to DMF Recorder Node.
- Flow Heatmap VPCs: Displays a heatmap of the total bytes transferred between source VPCs and destination VPCs over a selected time range.
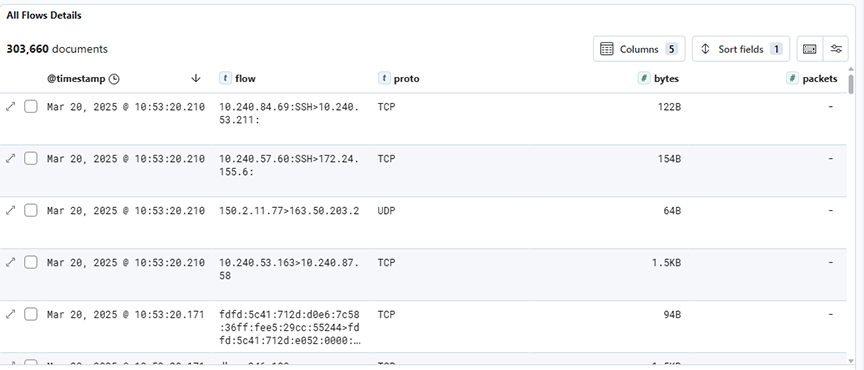
- All Flows Details: Displays detailed flow records filtered by flow type, including protocol, byte count, and packet count, over a selected time range.
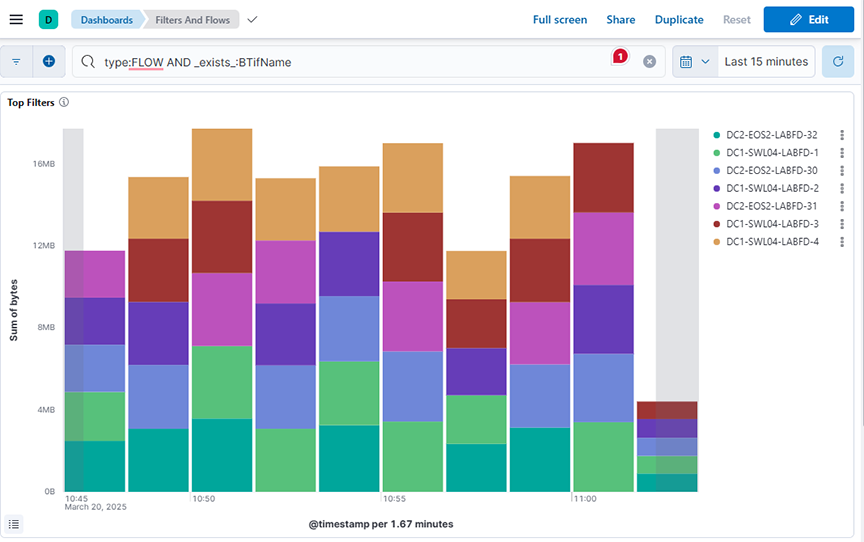
Filters & Flows
Selecting Production → Filters & Flows displays the selected MAC Address to access the Analytic Node.
- Top Filters: Displays the sum of bytes over time, grouped by top BTIfName values, over a selected time range.
- Filter Top Flows: Displays the sum of bytes sent as flow traffic over time, split by BTIfName, and each segment further splits by flow1.keyword (descending)., over a selected time range.
- Filter Bottom Flows: Displays the sum of bytes sent as flow traffic over time, split by BTIfName, and each segment further splits by flow1.keyword (ascending)., over a selected time range.

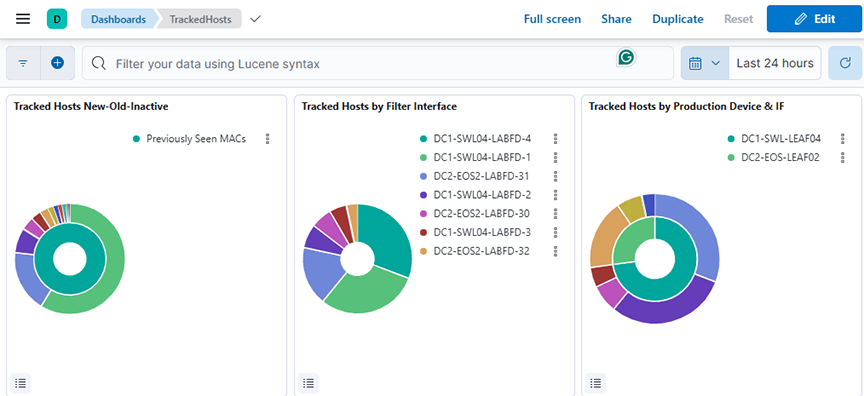
ARP
This data correlates with the tracked host feature on the DANZ Monitoring Fabric Controller. It shows all ARP data when you switch interface and production devices over time.
- Tracked Hosts New-Old-Inactive: Displays the count of tracked hosts categorized as newly seen, previously seen, or inactive, grouped by OUI vendor over a selected time range.
- Tracked Hosts by Filter Interface: Displays the unique count of tracked MAC addresses grouped by filter interface over a selected time range.
- Tracked Hosts by Production Device & IF: Displays the unique count of tracked MAC addresses grouped by production device and interface over a selected time range.
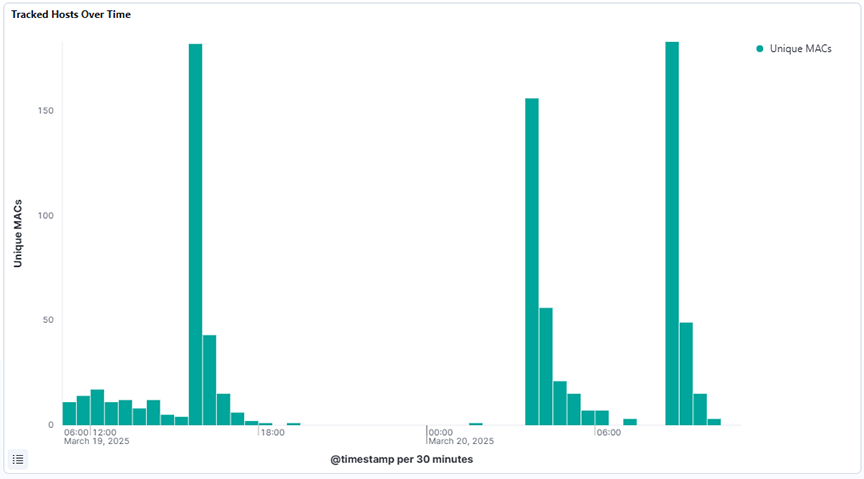
- Tracked Hosts Over Time: Displays the unique count of MAC addresses over a selected time range using a date histogram to track the number of distinct tracked hosts seen over time.
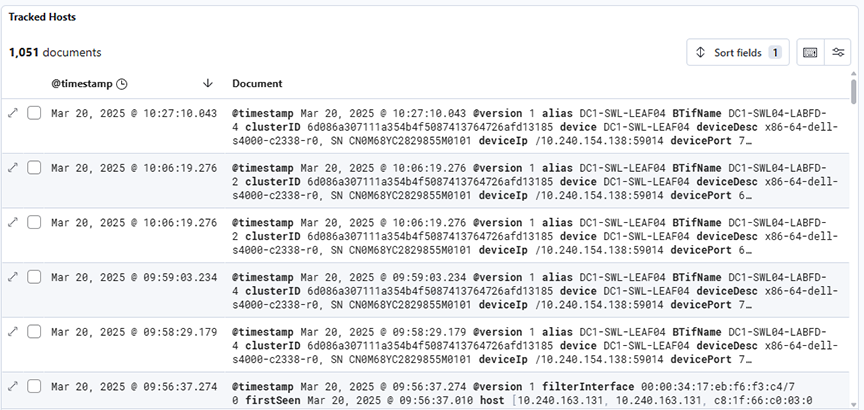
- Tracked Hosts: Displays raw tracked host events over a selected time range, showing detailed logs with metadata such as timestamp, device, port, hostname, interface, and activity status.
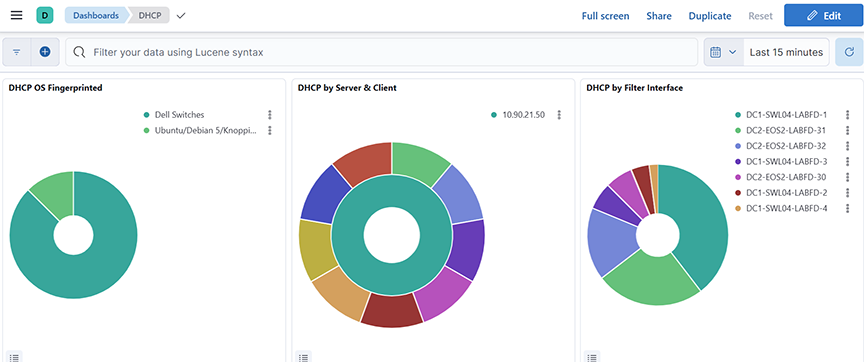
DHCP
Selecting Production → DHCP analyzes DHCP activity on the Analytic Node.
- DHCP OS Fingerprinted: Displays the distribution of fingerprinted operating systems based on the unique count of host MAC addresses over a selected time range
- DHCP by Server & Client: Displays the top server names and associated CNAMEs based on count over a selected time range.
- DHCP by Filter Interface: Displays the distribution of DHCP message activity by filter interface, based on count, over a selected time range.
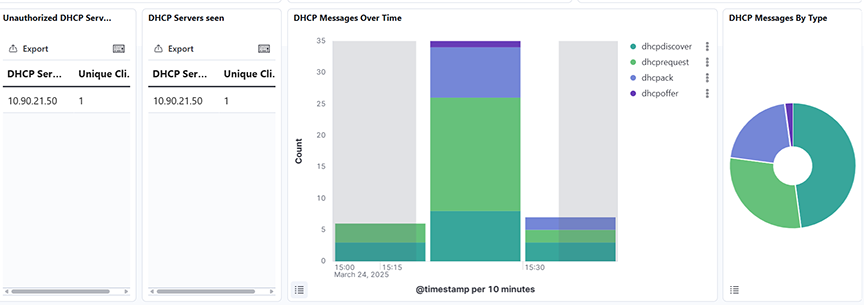
- Unauthorized DHCP Server: Identifies unauthorized DHCP servers by displaying the unique number of clients they responded to with DHCP offers, excluding known valid servers, over a selected time range.
- DHCP Server seen: Displays all DHCP servers that sent offers and the count of unique clients they responded to, excluding 0.0.0.0 addresses, over a selected time range.
- DHCP Messages Over Time: Displays the distribution of DHCP message types (for example, discover, offer, request, ack) over a selected time range, using a date histogram split by message type.
- DHCP Messages by Type: Displays the distribution of DHCP message types by count over a selected time range, using a pie chart segmented by the type.keyword field.
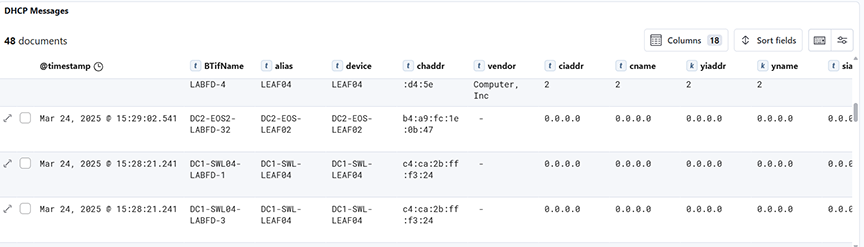
- DHCP Messages: Displays a time-series histogram and detailed document table of DHCP messages filtered by type over a selected time range.
DNS
Selecting Production → DNS analyzes DNS activity on the Analytic Node.
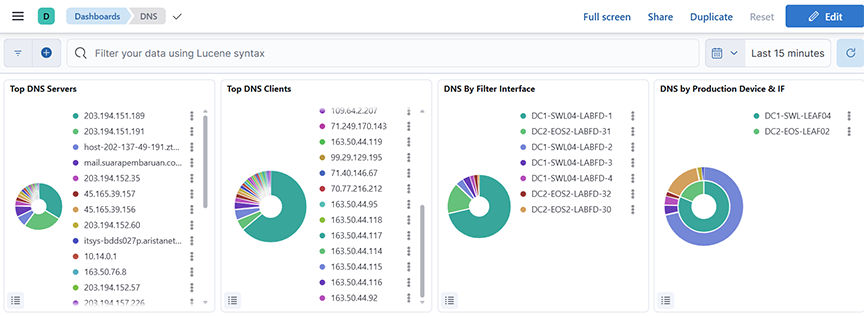
- Top DNS Server: Displays the top 25 DNS servers by request count over a selected time range, using a pie chart segmented by server name.
- Top DNS Clients: Displays the top 25 DNS clients based on query count over a selected time range, represented as pie chart segments grouped by client name.
- DNS by Filter Interface: Displays the top 60 DNS query sources based on the BTIfName field, counted and ordered by frequency over a selected time range.
- DNS by Production Device & IF: Displays DNS query counts grouped by production device and interface, using a nested split on device and devicePort fields over a selected time range.
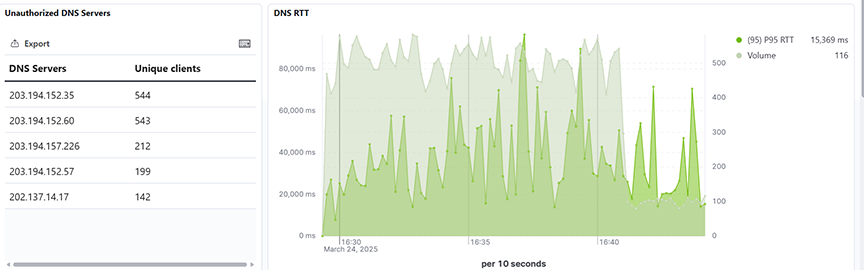
- Unauthorized DNS Server: Displays the top unauthorized DNS server, excluding a defined list of approved IP ranked by their unique client count over a selected time range.
- DNS RTT: Displays the 95th percentile of DNS Round-Trip Time (RTT) and the query volume, aggregated over time, for all sources over a selected time range.
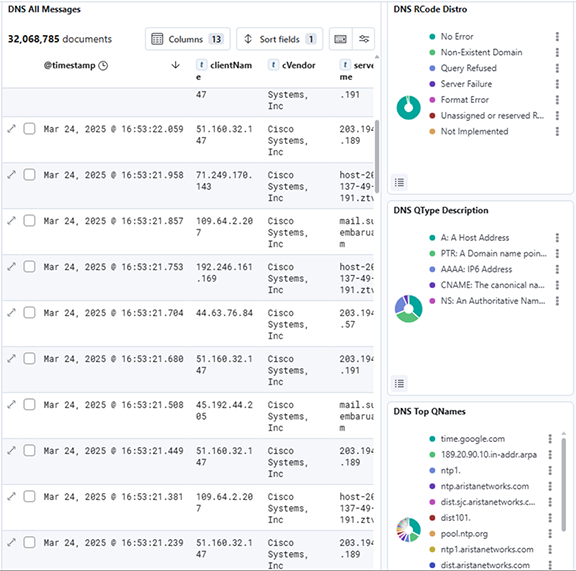
- DNS All Messages: Displays all DNS-related log messages along with key fields like client IP, server name, RTT, and query types over a selected time range.
- DNS Rcode Distro: Shows the distribution of DNS Response Codes (RCode) based on their frequency over a selected time range.
- DNS QType Description: Shows the distribution of DNS Query Types (QTypes) based on their frequency over a selected time range.
- DNS Top QNames: Shows the top Queried domain Names (QNames) in DNS traffic, ranked by count over a selected time range.
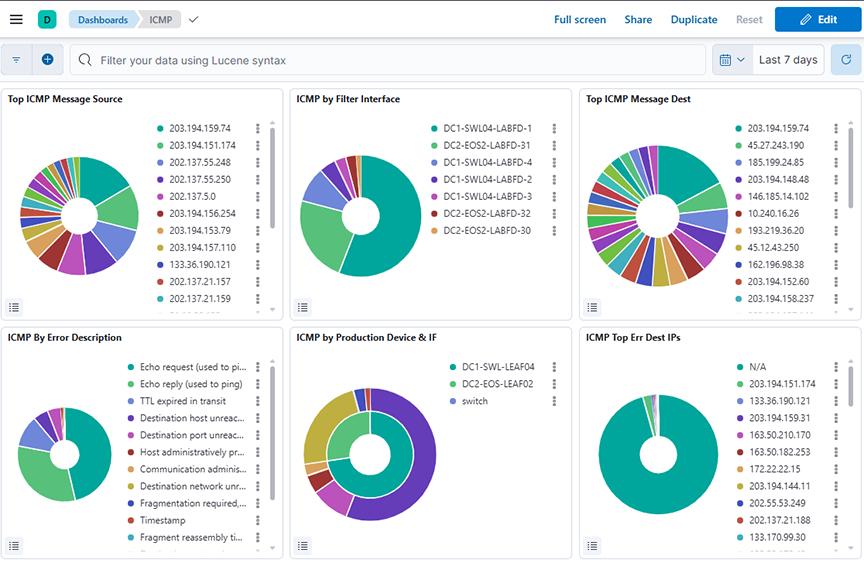
ICMP
The ICMP Dashboard summarizes information from analyzing ICMP activity and provides the following panels.
- Top ICMP Message Source: Displays the top source IPs sending ICMP messages, ranked by count over a selected time range.
- ICMP by Filter Interface: Displays the distribution of ICMP messages by filter interface (BTIName) over a selected time range.
- Top ICM Message Dest: Displays the top destination IP addresses for ICMP messages over a selected time range.
- ICMP by Error Description: Displays the distribution of ICMP messages categorized by error description over a selected time range.
- ICMP by Production Device & IF: Displays ICMP message distribution grouped by production device and interface over a selected time range.
- ICMP Top Err Dest IPs: Displays the top destination IPs associated with ICMP error messages over a selected time range.
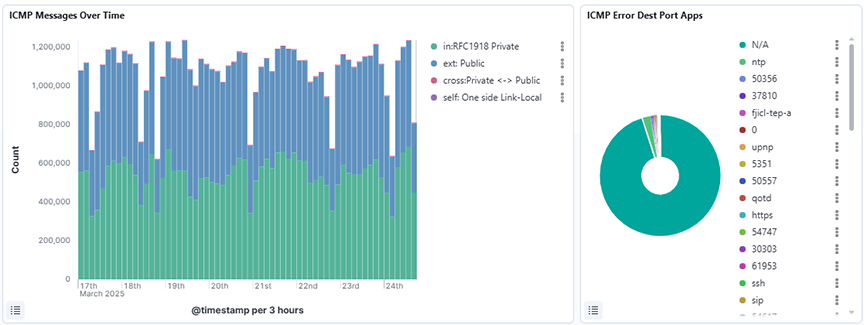
- ICMP Messages Over Time: Displays the count of ICMP messages over a selected time range, broken down by traffic tags such as private, public, cross, and self, using a date histogram on the timestamp field.
- ICMP Error Dest Port Apps: Displays the distribution of destination port applications that triggered ICMP errors over a selected time range, using a pie chart grouped by the errPortApp.keyword field and sorted by descending count.
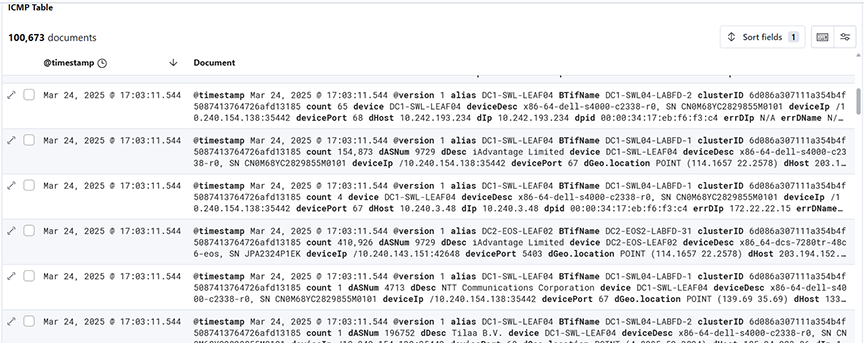
- ICMP Table: Displays a detailed table of ICMP packet metadata over a selected time range, including fields such as timestamp, source and destination IPs, device info, error descriptions, and message types for in-depth analysis.