White Paper
Arista EOS® Precision Data Analysis with DANZ
Table of Contents
– Introduction
– Flying Blindfolded
– Solution Overview
– Advanced Monitoring
– Precision Instrumentation
– Event-Driven Programmability
– Advanced Monitoring
– Multi-Destination Mirroring
– Packet Filtering and Manipulation
– Mirroring Traffic Directly to EOS
– Analytic and Diagnostics Tools
– TAP Aggregation
– Intelligent Load Balancing
– LANZ Monitoring and Capture
– Transaction Latency Management
– Precision Time Stamping
– Precision Time Based Services
– Event-Driven Programmability
– Software Defined Control Plane
– Programmable Data Plane
– Data Analysis with CloudVision
– Alternative Approaches
– Summary
Introduction
Traffic volumes are exploding in the datacenter due to the increasing efficiency and density of highly-virtualized cloud computing infrastructures. A single application or storage server, now connecting at speeds of 10Gbps, 25Gbps and even 50Gbps, can now generate bi-directional flow rates in excess of tens of billions of packets per day with aggregate daily traffic in many cloud data centers measurable in petabytes and beyond. To handle these loads, deployments of multi-path 100Gbps Ethernet spine and leaf architectures are becoming the norm. Owing to the large volumes of traffic, traditional methods of capturing and analyzing traffic flows require a dramatic rethink in density and performance for data aggregation and visibility.The challenge remains in that IT organizations have requirements to perform the following functions with increasingly higher data volumes and higher network bandwidths, while controlling or reducing costs:
- Maintain security, compliance and reporting for all types of traffic
- Troubleshoot applications and performance problems
- Perform traffic interception when required such as for Lawful Intercept
- Manage overall customer satisfaction and response times
- Automate configuration and management of the monitoring infrastructure
With the introduction of the Arista 7280R and 7500R-series switches, Arista has now extended the Universal Leaf and Spine use cases to monitoring with the DANZ feature set on EOS.
The Challenges of Flying Blindfolded
The challenges of examining and analyzing massive amounts of data to diagnose network problems, troubleshoot applications, assure performance and secure the modern datacenter are becoming insurmountable with traditional technology. In effect, many IT organizations have conceded that they are “flying blindfolded” to the actual traffic patterns in their datacenter.Lack of visibility facing IT operations teams continues to grow with the addition of high-density server virtualization, multi-tenant cloud environments and big data applications like Hadoop. Never before have the challenges of maintaining visibility into the inner workings of the datacenter network been as great as they are today.
Here are some examples of the untenable problems facing network administrators:
- Existing in-place management tools and methodologies that were designed for 100Mbps/1Gbps networks do not meet the needs of today’s server/storage interconnects. Precision selection and identification of the important traffic for detailed, fine grain analysis has failed to scale with the increasing volume of traffic.
- The increasing variety in terms of number of types of data requiring monitoring (transactions, databases, files, voice, video, images, telemetry, dynamic virtual machine mobility, etc.) cannot be addressed in a cost-effective model with any existing tools.
- Monitoring large amounts of traffic traversing the network from integrated and dedicated access/monitoring ports or passive Test Access Points (TAPs) requires a huge investment in probes and aggregation switches to scale to current speeds. Costs of these can exceed the cost of production networks by a factor of 2-4x and require introducing yet another operating system and user interface into the datacenter.
- Virtualization, mobility and the dynamic reconfiguration of the datacenter environments to address these needs are making it even more difficult to secure, trace and troubleshoot traffic and applications.
Solution Overview
Arista’s Precision Data Analysis with DANZ is the first and only solution to deliver scalable end-to-end monitoring. Utilizing Arista EOS’s extremely flexible and programmable Software Defined Cloud Networking capabilities. DANZ can leverage both the ultra-low latency and deep buffer switching capabilities of Arista switches to provide single-hop packet processing and data capture with exceptional flexibility and precision for administrators to tailor. Captured data can be delivered with highly accurate timestamps, fine-grained filtering, internal congestion detection and correlation provided by Latency ANalyZer (LANZ), in-switch advanced filtering and capture, MPLS header removal with traffic steering, mirroring to GRE tunnels, and advanced load balancing in hardware — all at line-rate and without additional hardware.The DANZ software features give IT operations and planning departments the following capabilities:
- Aggregate, replicate and capture traffic for processing without affecting production
- Apply advanced filtering, traffic steering and precision time stamping to traffic at wire rate in hardware
- Monitor, capture and correlate congestion and microburst events in real time (LANZ)
- Deliver application layer feedback directly to applications and tools for further analysis
- Header removal from traffic and packet truncation to ease the bandwidth and processing load on tools attached at 10Gbps
- Integrate with any standard 3rd party API and Application/Network management tools
- Achieve all of these features in Arista’s 7150, 7280SE, 7500E, 7280R and 7500R series switches without any additional hardware
- CloudVision as a central point of provisioning, management and telemetry for both the network as well as monitoring infrastructure
Advanced Monitoring
Advanced Monitoring provides a unique set of integrated functionality that operates as an adjunct to the Arista’s EOS features. This capability provides filtered multi-port mirroring of selected production network traffic, where unique filters can be defined for traffic mirrored to a destination tool for further analysis at line rate. Furthermore, for traffic flows that are either bursty in nature or when monitoring intensive data applications like IP storage, the deep buffer capability of the 7280R and 7500R series switches has the ability to queue this traffic to avoid gaps in analysis. This feature also leverages advanced load-sharing functionality, provided by Arista hardware to assure each flow is consistently redirected to the same destination tool with perfect symmetry and reliability.Advanced monitoring delivers integrated TAP and mirror source aggregation for any mirrored or captured traffic arriving from passive capture devices, such as passive optical TAPs or existing switch mirror ports. With the capability to filter, modify and timestamp each individual packet at line rate in hardware at nanosecond accuracy, it provides the extreme precision required for network analysis at multi-gigabit speeds.
Advanced monitoring also provides features like line-rate packet truncation, to allow IT departments to leverage their currently installed analysis tools and to enable detailed forensic analysis of recorded traffic at any location.
TAP Aggregation also enables header removal for tunnelled traffic like MPLS headers towards analytic tools to reduce the processing overload on tools. In combination, advanced monitoring can dramatically reduce the complexity, cost of positioning network and application analysis and security tools at every location, while conforming to the dynamic cloud network requirements and scale of modern infrastructures.
Precision Instrumentation
Precision Instrumentation delivers enhancements to the current Latency ANalyZer (LANZ) feature in Arista switches and adds precision timing services for both LANZ and port mirroring, with the addition of deeper inspection of congestion events and precision time correlation of events with advanced monitoring. These services allow microbursts and other congestion-related events to be captured and recorded in real time.LANZ provides early warning and fine grain reporting of transient congestion events and microbursts that occur under bursty or heavily loaded conditions, even when traffic loads are not saturating links. It achieves this functionality through the use of hardware triggered events that report real time queue depths at peak loads, along with start and end points of the congestion event, any resulting packet loss and identification of devices and applications affected by the congestion. These results can be redirected to external analysis tools for further mapping of peak times and loss events.
With absolute precision and accurate system clocking, LANZ provides the ability to export this information utilizing an open streaming protocol for real-time external capture of data. Captured network load data can be correlated with mirrored and monitored traffic with simple post-processing in any capture platform or monitoring tool to identify which applications are causing congestion. Network operators can see exactly what was happening in the network when monitored traffic traversed through each individual switch and can pinpoint hotspots that are causing problems with greater precision than ever before.
Arista’s timing services work with these features to assure reliability of timestamps to within 10ns through a high precision internal clock and optional external time sources that use the PTPv2 standard. With external GPS-based time sources, the precision of Arista capture and analysis capabilities can be maintained, even for multi-datacenter networks and hybrid cloud infrastructures that span hundreds of thousands of miles.
Another unique feature of the LANZ functionality is the ability to detect congestion on the outgoing tool ports for switches that are aggregating mirrored or TAP traffic to analysis tools, thus identifying when analysis tools are losing visibility. It allows operators to perform appropriate actions based upon tool congestion, ensuring that 100% of captured traffic reaches the analysis tools and assuring the fidelity of information that the tools provide. Leveraging the Precision Timing capability of LANZ allows IT operators to proactively profile their network and applications, looking for network hot spots before critical business applications are impacted.
Event-Driven Programmability
Event-Driven Programmability in Arista EOS enhances the ability to sense, diagnose, react to and solve problems within the network through custom-generated programming of the network infrastructure before the end user or application is negatively impacted. Arista EOS was designed for integration with these kinds of SDN services through its implementation around a stable, open source Linux core with a central state-oriented database that makes EOS inherently selfhealing, programmable, in-service upgradeable and extremely robust.Embedded event-based functionality provided by Advanced Event Management (AEM) enables the network operator to detect system events and perform pre-defined software actions whenever that event occurs. Leveraging the programmability of Arista EOS open APIs and the extensibility of its standard standard Linux environment gives any IT operations team a tremendous advantage in their ability to orchestrate and react to problems quickly without any human intervention. One example is by default, all Arista switches come with a default job that performs a show tech-support once every hour for proactive troubleshooting. This is just one of the many use cases for AEM.
Benefits of Precision Data Analysis with DANZ
Together, DANZ advanced capabilities allow Arista customers to analyze, troubleshoot, manage and maintain their datacenter networks securely and reliably. Arista allows technology alliance partners to integrate with the most efficient and scalable network monitoring platform available. Some of the key benefits of this solution to customers are listed below:- Performance: to offload compute-intensive processing from monitoring tools and to allow them to scale to 10/25/40/50/100Gbps and beyond, with zero impact on performance and scalability of the production network.
- Efficiency: provide end-to-end visibility and uninterrupted access to network traffic without the need to invest in new equipment, training and methodologies. DANZ uses the same Arista EOS and universal leaf and spine switching hardware which has proven itself in the majority of the world’s largest cloud datacenters. DANZ-enabled switches may also be added to Arista CloudVision for a central view and management of DANZ-enabled devices.
- Precision: providing seamless integration of reporting and traffic capture with wire-rate inline packet time-stamping and clock synchronization between network infrastructure and management tools and precise data filtering criteria for examination and recording of targeted traffic.
- Extensibility: unified and extensible architecture fully meshed with the operating network, cloud and virtualization infrastructure, and designed to allow monitoring and analysis tools to scale to multi-terabit speeds and beyond.
Applying Advanced Monitoring for Network Traffic
In many IT networks there is a need to copy traffic to a number of different tools for either real-time or forensic analysis. Multiple monitoring applications or tools may be necessary to deliver functions such as intrusion detection, traffic recording, auditing, compliance, troubleshooting, lawful intercept and data security.As the modern datacenter network grows, it becomes cost prohibitive to scale-out the number of analysis tools to match the volume and number of sources. However, the same analysis tools must often be scaled-up, or stacked, to match the capacity requirements of higher speed networks. To economically address the critical monitoring requirements of modern datacenter networks, traffic must be selectively analyzed with minimal overhead and minimum cost before delivery to analysis tools. Important actions, such as steering traffic reliably to the appropriate analysis tool, granular filtering of traffic, detecting and correlating events, packet truncation or slicing and distribution or load balancing to multiple tool types, is required.
Multi-destination Mirroring
Arista’s multi-destination mirroring feature allows traffic from a single source to be replicated to multiple output ports with symmetrical load balancing, reducing the number of capture devices and probes needed. As a result of intelligent filtering, timestamping and load sharing, traffic arriving at multiple ports can be reduced and aggregated to a single tool for detailed analysis and correlation of important events, without the addition of proprietary backhaul fabrics and active monitoring TAPs.Unlike older SPAN or port-mirroring technology, multi-destination mirroring in Arista’s switches can scale to any dimension required in the datacenter network. It is not limited to the number of ports designated for exclusive use as mirroring outputs on a switch, resulting in flexible software defined monitoring capabilities, subsequently reducing monitoring cost and increasing capabilities throughout the network.
Packet Filtering and Manipulation
Wire-rate packet filtering and manipulation in hardware allows DANZ enabled Arista switches to redirect traffic to any destination with precision granularity based on L2-4 information. This information includes MAC Source/Destination Address, VLAN ID, Ethertype, IP Protocol, DSCP/TOS traffic class or priority, IP Source/Destination Address, UDP/TCP Port, Multicast Address and arbitrary offset byte values within the packet. Packets can be re-written at line rate appended with new timestamp and checksum information, tagged for identification of source by analysis tools and forwarded to physical or virtual network appliances over any network media.Packet-filtering and manipulation in hardware enables very granular selection of mirrored traffic at line rate without addition of new hardware or loss of performance for production traffic. This enables the use of the existing tooling infrastructure by restricting the tool visibility to only interesting traffic at appropriate rates for the individual tool. Should the IT operations team wish to further enhance the scalability of the analysis tools, packet manipulation provides the ability to truncate packets to deliver just the limited information necessary to diagnose a problem. Reducing the amount of data that is passed to the analysis tools enables even greater scale.
Mirroring Traffic Directly to EOS
Given that the reach of analysis tools is never 100%, there are instances where local analysis needs to take place on the network without ready access to any tools. There are also situations internal to a network switch where visualization into the control plane traffic is useful in troubleshooting an issue. The Mirror Direct to EOS feature in multi-destination mirroring provides a solution for both of these instances.Local storage of mirrored data could include a local flash or SSD drive in the Arista switch or a remote mount point. The resulting local control and data plane visibility can act as an actionable trigger for taking a programmed action through AEM or other mechanisms. When a condition requiring action is detected, the event manager can execute an EOS command or script to perform an action, prior to degradation taking place and potentially impacting the user experience. Alternatively, an application can notify the administrator through a variety of mechanisms.
Integration of Analytic and Diagnostics Tools within EOS
Integrating applications directly with EOS allows customers the ability to run common cloud infrastructure automation applications such as Chef, Puppet, Ansible, CFEngine or CloudVision for enhanced traffic analysis and visibility. Some tools that Arista customers currently use in EOS include Splunk connectors, sFlow analyzers, WireShark, Nagios, Ganglia, Ostinato, Cacti and Tcpdump, among others.Local processing of mirrored traffic in the switch CPU can perform a valuable function and will not degrade the performance or operation of the switch, in part due to the robust nature of the EOS architecture. Utilizing standard Linux analysis tools integral to EOS such as Tcpdump or other open source monitoring services, a customer can select control plane or data plane traffic to mirror to the local memory on the Arista device for local analysis.
TAP Aggregation
The Arista 7150-series and E/R-series platforms deliver additional advanced visibility capabilities through the delivery of TAP and mirror-source (SPAN) aggregation functionality. DANZ TAP aggregation capability provides a familiar industry-standard CLI interface, flexible on-switch web management console and EOS API with a distributed switching architecture for aggregating any-to-any mirroring of traffic captured at passive and embedded network interfaces at line rate. The traffic is captured with precision hardware time stamping accuracy at the capture point, at current interface speeds up to 100Gbps. Where large numbers of mirrored ports need to be aggregated to tools farms or traffic needs to be monitored from network equipment unable to provide precision time stamping or filtering natively, Arista TAP aggregation provides the same high degree of precision and advanced features as multi-destination mirroring at a fraction of the cost of currently available proprietary TAP aggregation fabrics.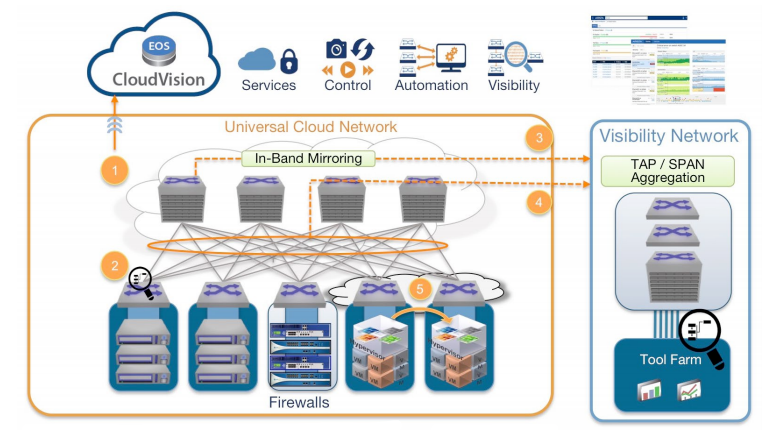
Figure 1: Arista’s End-to-end Telemetry Solution
TAP aggregation can also fan-out traffic from single monitored sources to multiple recording tools, to allow existing tools that were designed for 1Gbps sources to scale to 10-100Gbps network needs and to extend the port reach of individual tools to many potential capture points across a dynamic network infrastructure.
CloudVision’s real-time streaming telemetry complements the DANZ feature set to provide network wide visibility into the network state, including real-time updates on congestion hot spots, changes in protocol state and other device metrics.
Intelligent Load Balancing
Most IT organizations have an installed base of 1Gbps or 10Gbps tools for network analysis. With the increase in interconnect speeds approaching 100Gbps, these slower tools are greatly impaired from performing deep analysis without significant filtering of data. The complexity of this data filtering and steering can lead to missed vulnerabilities, inaccurate compliance findings and elongated troubleshooting efforts.In order to perform comprehensive analysis, both sides of the host-to-host conversation are necessary. Whereas the ability to hash information from a higher-speed port to lower speed ports is useful in the case of a single analyzer with multiple ports, having both sides of the conversation going to one tool is essential when hashing traffic across multiple tools. To overcome this challenge the destination load balancing feature provides the capability for symmetrical hashing where the send and receive traffic in a single conversation will always be placed on the same mirror destination port on the Arista switch. This capability greatly reduces the need to spend significant dollars on larger tools with more ports in a single tool and extends the reach of tools to the entire datacenter network. In essence, this provides for massive scale in the monitoring environment without compromising visibility of the traffic or increasing expense.
Applying Precision Instrumentation for Detecting Network Conditions
In alignment with the features introduced in Advanced Monitoring, Arista has extended precision timing and filtering to deliver better precision for latency, congestion and packet loss event detection and reporting with less variability and no increase in complexity or introduction of new equipment.LANZ Monitoring and Capture
While often overlooked, all networks experience internal congestion, regardless of levels of oversubscription and utilization. LANZ is Arista’s Latency ANalyZer feature for monitoring congestion and microburst conditions within the network. LANZ captures information necessary to understand the effect of internal congestion in the network, while time stamping for LANZ data enables precision alignment and correlation of internal congestion events with traffic captured for analysis and performance management. LANZ provides logging and notification of start, end and peak congestion events, even when events exist for only a few nanoseconds. When building multiple tiers of LANZ enabled switches, the deep buffer capability of many of the Arista platforms supplement the aggregation of multiple TAPs and tool ports, as well as allow for a larger threshold of LANZ data.LANZ provides reliable nanosecond-accurate reporting for flows by source, destination, traffic-class or duration, and it can either log precision timing information of those flows or stream data to a remote application for correlation with other information, such as captured traffic. Traffic experiencing congestion can be sampled and forwarded for further analysis by an analysis tool to enable precision fine-grained identification of impacted applications and users.
In addition, LANZ provides accurate drop counts for correlation of potential buffer overruns, and LANZ events can be integrated with syslog, AEM triggers and CLI for ultra-precise high fidelity visibility into how applications are performing ‘inside the network’. The real-time streaming capability in CloudVision allows for a network wide view of congestion hot spots, as LANZ data is also streamed in real-time for monitoring.
LANZ for Transaction Latency Management
Fine grain congestion measurement and microburst detection are important to understand in order to determine how interaction of application flows and network capacity are impacting transaction-oriented service delivery. LANZ provides ultra-high resolution fine grain notification of internal network latency, congestion and packet loss events to external analyzers for microburst detection, latency analysis and mitigation of performance issues. LANZ also provides information needed to derive queue drain times, which identifies potential influence of various queue configurations on latency sensitive applications.LANZ enables architects, engineers and operators of ultra low latency datacenter, financial, and cloud infrastructures to analyze, evaluate, manage and tune their environment for latency sensitive transactions. Such analysis enables IT organizations to pinpoint and eliminate causes of communications delays, resulting in faster and more accurate transaction cycles.
Hardware Precision Time Stamping
Time stamping is the act of adding fields to a packet to indicate the time at which the packet was received at the device. Traditionally, network analyzers add time-stamps as they receive copies of traffic from SPAN or mirror ports on networks devices. This mechanism is inherently inaccurate because there may be tiers of devices between the analyzer and the traffic source. The analyzer has no way of understanding how much additional delay these intermediate devices and infrastructure have introduced. Adding a timestamp at the source is the only way of ensuring every packet is accurately marked and the analyzer itself has an entirely accurate view of when the traffic was captured.With DANZ, ingress hardware timestamps can be created on every packet and event, providing recording accuracy to within a few nanoseconds instead of on egress. Network analysis tools used to assist with troubleshooting performance or security issues can then utilize these timestamps for out-of-band analysis and post processing or for correlating important events.
Precision time recording and timestamping enables correlation of traffic capture and microburst events for end-to-end identification of network and application performance issues. Traditional monitoring platforms require in-line packet rewrite and insertion of time correlation bits to indicate when traffic traversed sample points in the network. Arista’s efficient precision time recording algorithm inserts minimal required timing information in exported packets, which allows precision time correlation using simple analytical tools.
Integrated Precision Time-based Services - PTP 1588 Precision Timing
Supporting the industry leading PTPv2 timing standard (i.e., IEEE 1588 version 2), DANZ enabled Arista switches precisely synchronize time for services running within the switch and for services and applications outside the switch that depend upon nanosecond time resolution. The Arista 7150 series switches deliver robust PTP functionality in a datacenter class Ethernet switching platform and offer complete hardware support for PTP boundary and transparent clock functions.Arista’s time-base services assure reliability and alignment of timestamps through a highly stable internal clock and external time sources that use the PTPv2 standard. With external GPS-based time sources, the precision of Arista capture and analysis capabilities can be maintained, even for multi-datacenter networks that span hundreds or thousands of miles.
These capabilities unlock the limits on the scale and precision of PTP implementations that no longer require dedicated PTP hardware at every point and provide a common infrastructure for both data forwarding and time synchronization. Equally important, the boundary and transparent clock functions allow densely virtualized, cloud and multi-tenant infrastructures to scale precision timing services consistently at a tremendous cost savings.
Arista’s precision timing service enables out-of-band network analysis to occur in any location, away from the switch that is supporting the production requirements. Timing Precision is the key to correlation of end-to-end network events that occur at multi-gigabit speeds. This allows dramatic improvements in operational efficiency and the ability to monitor complex network and application conditions, including congestion, packet loss, latency and jitter, with little or no additional investment in equipment, training or services. Furthermore, by providing these services natively in the Arista platform, the addition of time synchronization servers may be avoided.
Applying Event-Driven Programmability in EOS
In the highly dynamic datacenter environment, conditions can change in a microsecond. Resources are remapped, virtual machines move to new hardware and tenant configurations are changed without considering the impact on other users or on business critical applications. Reacting to events through the course of normal human intervention is impossible where changes happen at increasing speeds and with greater frequency. Once an issue is known, troubleshooting and the associated reaction times can lead to hours of delay before services are restored, resulting in lost revenue, substantial damage to a company’s reputation, staff morale downturn and loss of customer loyalty and trust. These losses can be substantial and are completely unnecessary.Through the ability to integrate event-driven programmability with its programmable control and data plane architectures, Arista EOS enables proactive resolution of network issues before they impact applications and provides the ability to couple analysis applications and tools with the rich internal visibility and monitoring capabilities of DANZ.
Advanced Event Management (AEM) allows pre-programmed actions to execute in response to various triggers. For example, detection of vMotion events allows monitoring and analysis applications to track dynamic changes in a cloud or virtualized network infrastructure. Virtualized resources can be monitored based on resource names, instead of network addresses, and changes can be fully automated between the monitoring infrastructure and the network.
Software Defined Control Plane
The decoupling of data-plane forwarding from control-plane topology control in Arista’s EOS architecture provides the ability to integrate with a variety of software-defined cloud network scenarios. EOS’s software friendly control plane provides the basis for DANZ to form part of an automated feedback loop for advanced analytical and network control applications, allowing operations requirements to be met in extremely dynamic and virtualized datacenter infrastructures.The Arista EOS naturally open, standards-based control plane architecture provides the ability to integrate with a variety of software defined network control scenarios. These include control-plane mechanisms such as OpenFlow and other SDN programming models (ex. EOS RESTful API’s, Cloudvision, VMware vCenter APIs, OpenStack APIs, and other virtualization frameworks).
Arista’s software defined control plane provides the basis for highly automated workflows that coordinate multiple infrastructure elements, for example:
- Coupling dynamic reconfiguration of proactive network monitoring with precision instrumentation and analysis for automated collection of forensic data pertaining to congestion or service outages.
- Providing network-wide intrusion detection via sFlow analysis with dynamic application of remediation policy, traffic steering and data capture through EOS APIs and programmatic manipulation of the control plane.
Programmable Hardware Data Plane
Hardware data-path programmability is critical for fine-grain manipulation and forwarding of packets without impacting network performance or reliability. Based upon the advanced hardware programmability of Arista’s 10/25/40/50/100 Gbps switches this flexible packet processing can eliminate the need to build expensive and proprietary network monitoring fabrics.The unique ability to deploy soft-logic directly into switching ASICs provides major benefits in terms of:- Deployment of new low-level protocols in hardware without requiring a forklift upgrade
- Updates to emerging technology implementations to support network virtualization (e.g. VXLAN)
- Application of complex packet processing logic (e.g. Address Translation, Advanced Mirroring, Time-stamping)
Advanced Event Management Services with AEM AEM events, triggers and actions help to bring simplicity to network operations, enabling a transition to an event-driven service model for IT operations. AEM allows operators to fully utilize the intelligence within EOS to respond to real-time events, automate routine tasks and take local automated actions based on real-time network conditions for improved network performance.
New features in AEM linked to DANZ include more triggers and actions that can be performed, such as initiating tool targeting and capture in combination with virtualization services that detect, for example, when a Virtual Machine is moved, added or changed in a dense virtualization cluster.
AEM’s Event Monitor service is a unique feature that takes this capability further, by collecting and storing critical information about the state of the network (e.g., ARP, MAC and route tables) to allow network operators to determine precisely what state the network was in at the exact time of the problem, and what led to that condition, instead of waiting for the problem to re-occur so that it can be examined after the fact.
AEM provides a significant advantage to NOC engineers monitoring the health of the multilayer network infrastructure and its attached application servers, moving them away from a static view of network conditions and enabling them to automate responses to changing conditions that require immediate attention. AEM works in concert with other EOS features and capabilities to enable event-driven automation across the entire network.
Precision Data Analysis with Arista CloudVision Platform
For the ability to have a single pane of glass to view all DANZ-related information, administrators can leverage the Arista CloudVision Portal. CloudVision can be accessed either using a web browser or by using RESTful API calls. The same benefits that DANZ brings to datacenter networks, the CloudVision platform can take a step further including:- Configuration Management and Image Management
- Built-in Zero Touch Provisioning (ZTP) and Replacement for new and existing switches
- Change Management and compliance features
- Integration with third party vendors like Palo Alto, ServiceNow, OpenStack, and VMware
- Automatic Bug Scrubs for all Arista devices
- List of all DANZ-enabled Arista devices
CloudVision can also stream device state of the TAP Aggregation devices in real-time to provide analytics and telemetry for networkwide visibility into traffic flows, congestion and switch environmentals, among other features. Unlike traditional networking management technologies (ex. SNMP) that collect data based on a polling interval, EOS devices can stream data in real-time to CloudVision for fine grained visibility into network state.
Comparing Alternative Approaches
While Arista’s solution takes a significant leap forward from the proprietary monitoring fabrics and static network probe offerings it enhances, it remains fully compatible with elements from each of these approaches. For example, a modern implementation of the Arista DANZ solution may significantly reduce the deployment cost for multi-vendor network probe infrastructures and improve the ability of these solutions to scale up to multi-terabit capacities. Arista DANZ can work in concert with:- Traditional SPAN ports without advanced filtering (including SPAN ports on other vendors equipment)
- Proprietary port extender “fabrics” using encapsulations like VN-TAG and 802.1BR
- Dedicated parallel or backhaul monitoring fabrics (such as GTP and MPLS)
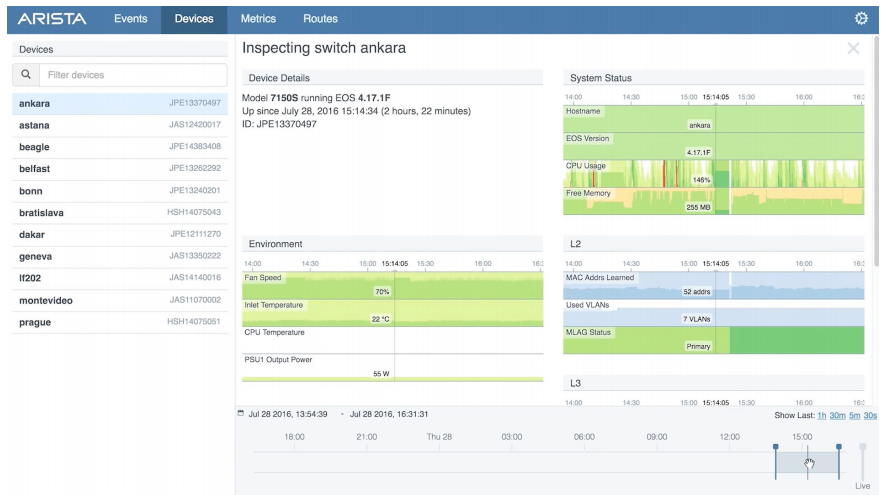
Figure 2: Arista CloudVision Telemetry Streaming
Summary
Arista Networks believes that the key to visibility within high performance environments is fully realized with Precision Data Analysis with DANZ. This solution provides powerful network analysis without the need for costly hardware upgrades or proprietary network analysis modules and external monitoring fabrics.Arista’s DANZ features key business benefits including:
- Better visibility into network and application performance, security and compliance
- Dramatic CAPEX savings due to consolidation of production and monitoring networks
- Significant OPEX savings due to cloud automation and event-driven programmability
- Streaming real-time device state towards third party analytics tools and/or Arista’s CloudVision
Arista EOS and CloudVision provide innovative solutions to gain visibility into network traffic, as well as network state for scalable data and network monitoring, analysis and reporting, without the expense of complex and proprietary monitoring fabrics.
Copyright © 2017 Arista Networks, Inc. All rights reserved. CloudVision, and EOS are registered trademarks and Arista Networks is a trademark of Arista Networks, Inc. All other company names are trademarks of their respective holders. Information in this document is subject to change without notice. Certain features may not yet be available. Arista Networks, Inc. assumes no responsibility for any errors that may appear in this document. Ver: 02-0072-02