Monitor Gateways on VeloCloud Edge Cloud Orchestrator
Operator and Partners can have a high-level view on the status of the Gateway from the Orchestrator.
Monitor Gateways
You can monitor the status and network usage data of Gateways available in the Operator and the Partner portal.
To monitor the Gateways:
In the Operator portal, select Gateway Management > Gateways.
The Gateways page displays the list of available Gateways.
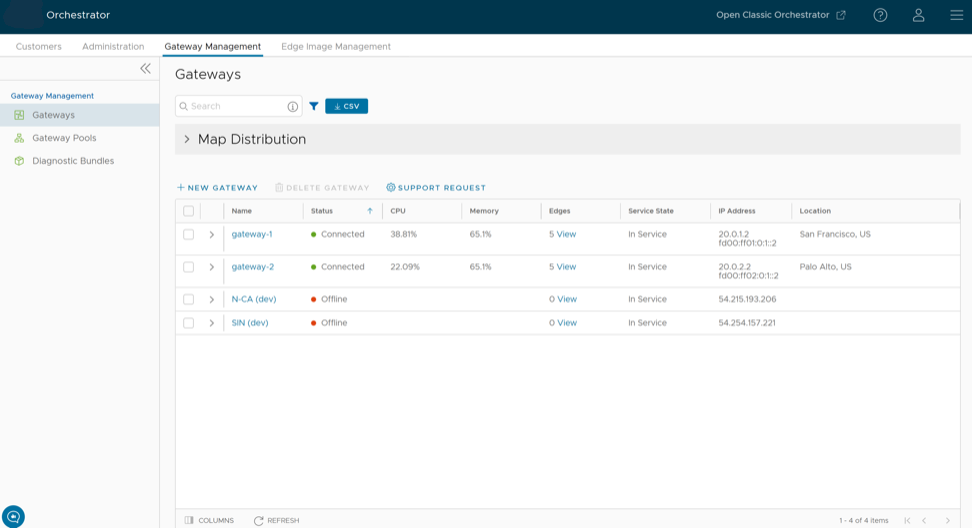
Figure 1. Gateways Page
Select Map Distribution to expand and view the locations of the Gateways in the Map. By default, this view is collapsed.
You can also select the arrows prior to each Gateways name to view more details. The page displays the following details:
Name – Name of the Gateways.
Status – Current status of the Gateways. The status may be one of the following: Connected, Degraded, Never Activated, Not in Use, Offline, Out of Service, or Quiesced.
CPU – Percentage of CPU utilization by the Gateways.
Memory – Percentage of memory utilization by the Gateways.
Edges – Number of Edges connected to the Gateways.
Service State – Service state of the Gateways. The state may be one of the following: Historical, In Service, Out of Service, Pending Service, or Quiesced.
IP Address – The IP Address of the Gateways.
Location – Location of the Gateways.
In the Search field, enter a term to search for specific details. Select the Filter icon to filter the view by a specific criterion.
Select the CSV option to download a report of the Gateways in the CSV format.
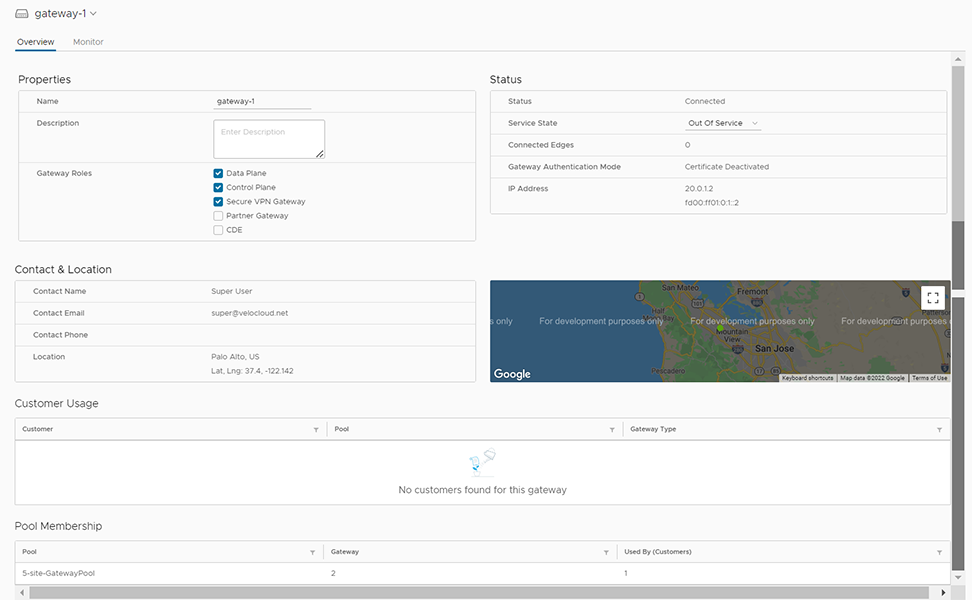
Select the link to a Gateway to view the details of the selected Gateway.
Figure 2. Selected Gateway Details
The Overview tab displays the properties, status, location, customer usage, and Gateway Pool of the selected Gateway.
Select the Monitor tab to view the usage details of the selected Gateways.
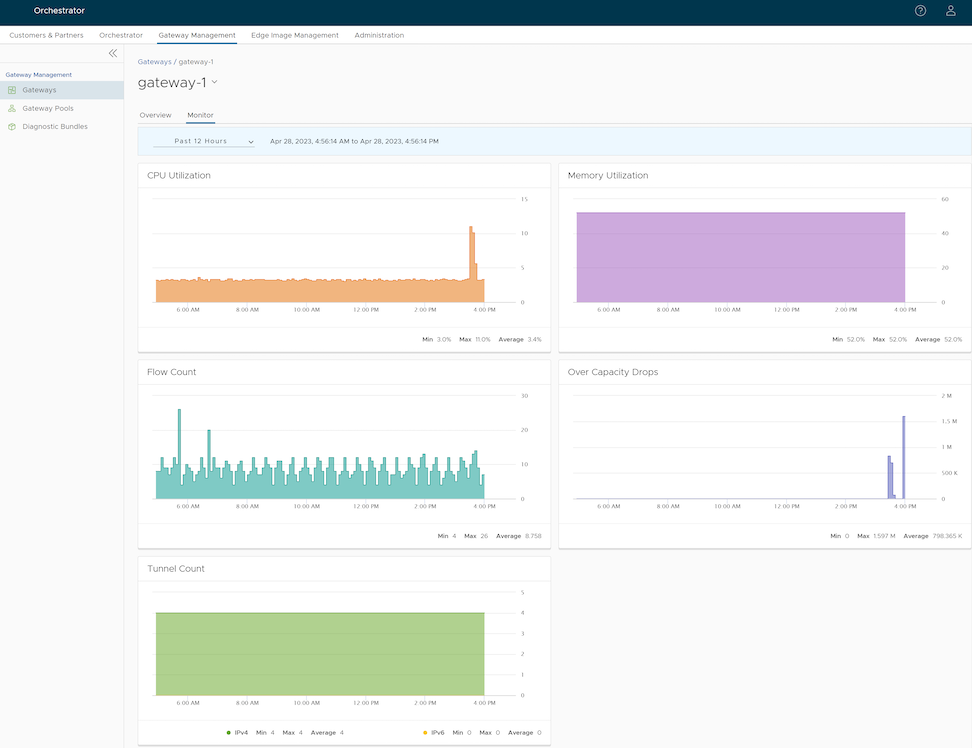
Figure 3. Usage Details of Selected Gateway
At the top of the page, you can choose a specific time period to view the details of the Gateway for the selected duration. The page displays graphical representation of usage details of the following parameters for the period of selected time duration, along with the minimum, maximum, and average values.
CPU Percentage – Percentage of usage of CPU.
Memory Usage – Percentage of usage of memory.
Flow Counts – Count of traffic flow.
Over Capacity Drops – Total number of packets dropped due to over capacity since the last sync interval. Occasional drops are expected, usually caused by a large burst of traffic. However, a consistent increase in drops usually indicates a Gateway capacity issue.
Tunnel Count – Count of tunnel sessions for both the IPv4 and IPv6 addresses.
Hover over the graphs to view more details.
Note: If you are a Partner user, follow the above instructions in the Partner portal to view the details of the Partner Gateways.