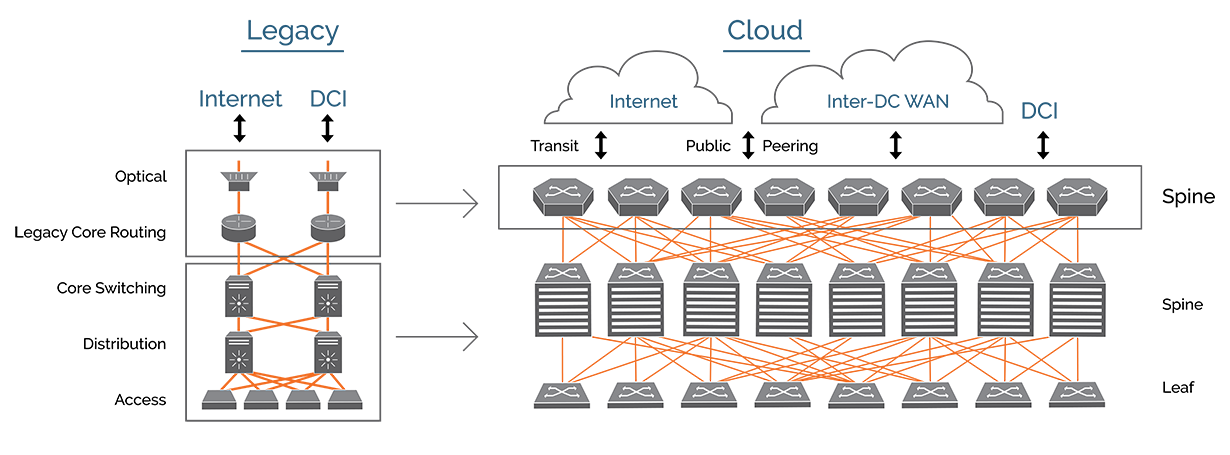
Cloud Network Design Choices
The Universal Spine: DC Spine and Core Convergence
The Best Data Center Portfolio

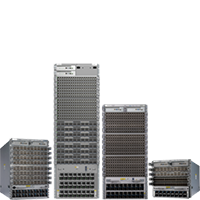
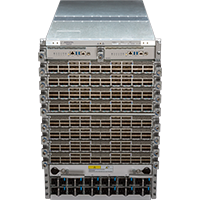
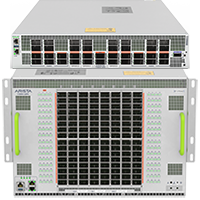
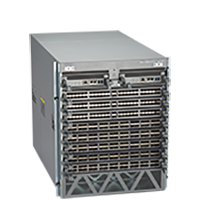
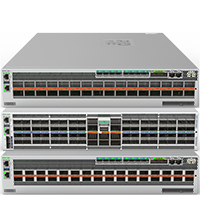
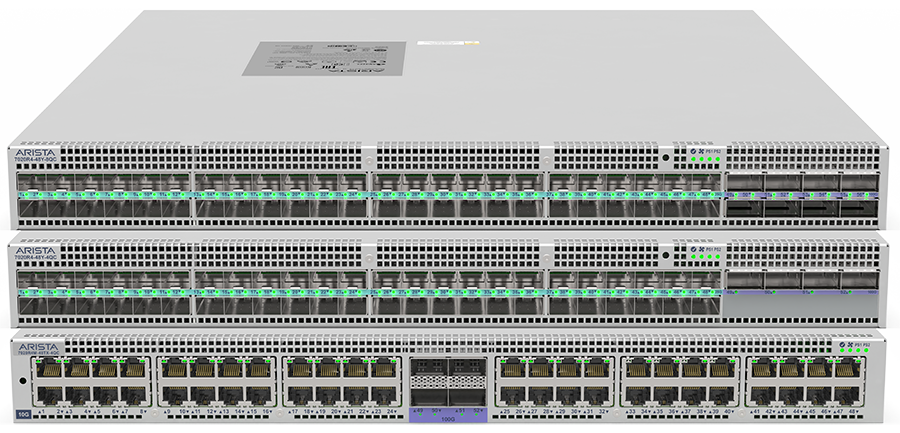
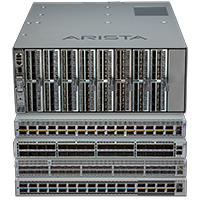
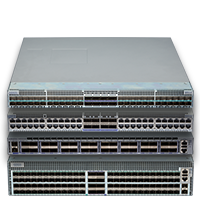
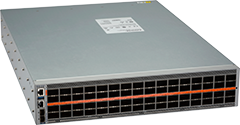
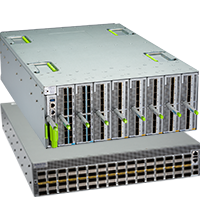
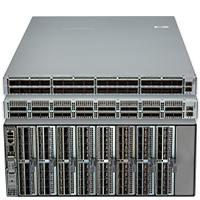
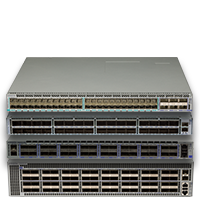
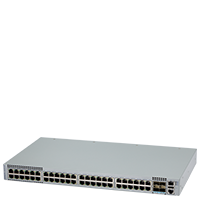
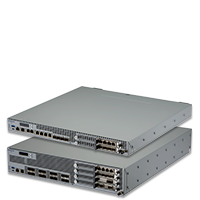
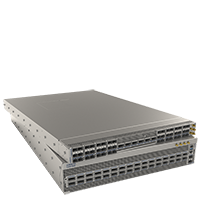
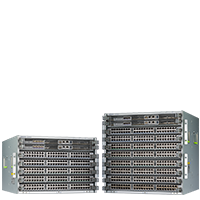
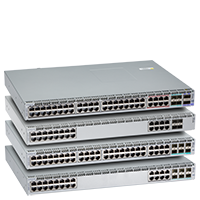
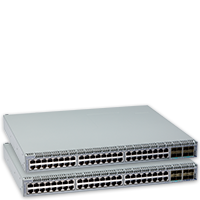
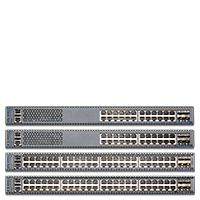
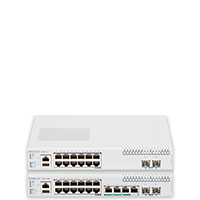
For the full Arista 7000 Family Portfolio, click here.
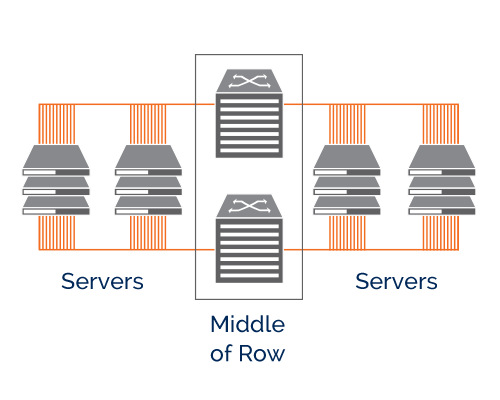
SplineTM
The Arista Spline architecture attaches hosts directly to a pair of switches connected in an MLAG. This architecture can scale to more than 2000 hosts connected in a non-blocking manner. This large single tier enables densely deployed applications such as: IP and Ethernet storage, next generation file systems, distributed compute, and virtualization.
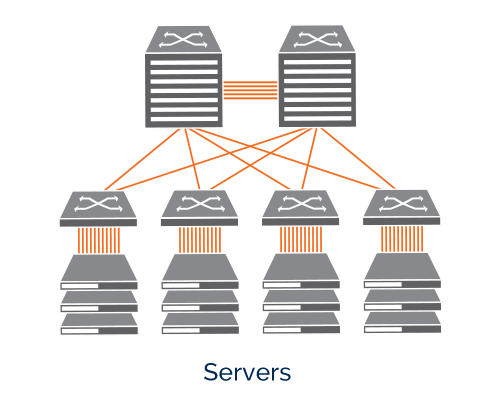
Layer2 / MLAG
The L2LS network design is a two-tier architecture comprising of two spine switches and one or more Top-of-Rack (ToR) leaf switches. Leaf switches provide connectivity to storage, compute, service, and data center edge network elements. Leaf switches may be deployed by themselves or in a pairs for high availability. Spine switches aggregate and provide a fast backbone for the leaf switches.
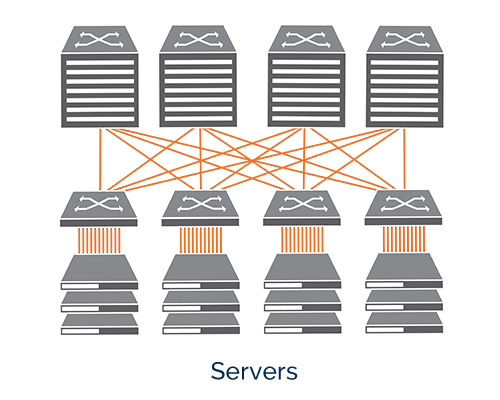
Layer3 / ECMP
The L3LS network design is a two-tier architecture comprising of 2-128 spine switches and one or more Top-of-Rack (ToR) leaf switches. Leaf switches provide connectivity to storage, compute, service, and data center edge network elements. Leaf switches may be deployed by themselves or in a pairs for high availability. Spine switches aggregate and provide a fast backbone for the leaf switches.
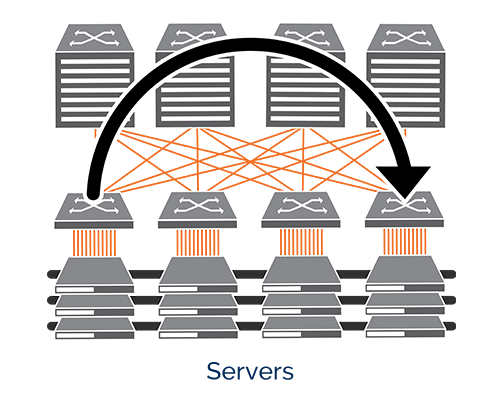
L2 over Layer 3 VXLAN
Leveraging the same two-tier architecture of the L3LS design, the Arista Networks L3LS-V Solution also incorporates Virtual eXtensible Local Area Network (VXLAN), an open IETF specification designed to standardize an overlay encapsulation protocol, capable of relaying Layer 2 traffic over IP networks.