
Link Insights
Release 7.0.0 introduces the Link Insights feature, which provides comprehensive visibility into the health and performance of WAN links across VeloCloud SD-WAN. By continuously monitoring link-level Quality of Experience (QoE) metrics, including latency, jitter, and packet loss, Link Insights identifies degraded connections and quantifies the effectiveness of SD-WAN optimization. This feature provides insights into Edges across an Enterprise, helping optimize network performance, troubleshoot, manage costs, and improve the user experience.
- Real-time degradation detection: Automatically classifies link quality events as Critical (Red) or Fair (Yellow) based on configurable thresholds for Voice, Video, and Transactional traffic types.
- Before vs. After SD-WAN comparison: Compares link performance before and after applying SD-WAN corrective actions to quantify the overlay's mitigation impact.
- Multi-dimensional analysis: Groups degradation data by individual Link, Edge, or ISP to isolate problem areas across the network.
- Top-N ranking: Surfaces the worst-performing Links, Edges, and ISPs to focus troubleshooting on the most impactful issues.
- Detailed drill-down: Provides a paginated detail grid with per-link metrics, sorting, filtering, and CSV export for offline analysis and reporting.
Link Quality Classification:
| State | Color | Severity | Description |
|---|---|---|---|
| Critical | Red | High | Link metrics exceed the critical threshold, causing the link to degrade severely, resulting in a noticeable impact on end users. This state requires immediate investigation. |
| Fair | Yellow | Moderate | Link metrics exceed the fair threshold but remain below the critical threshold, causing the link to experience moderate degradation that may affect sensitive applications. |
| Normal | Green | None | Link metrics are within acceptable thresholds. The Orchestrator does not detect any degradation. |
Enabling Link Insights:
The Link Insights feature is available to Operators, Partners, and Customers. However, Operators must enable this feature for Partners and Enterprise users through system properties. For more information, see the topic List of System Properties in the Arista VeloCloud Orchestrator Deployment and Monitoring Guide.
Accessing Link Insights
Executive Summary
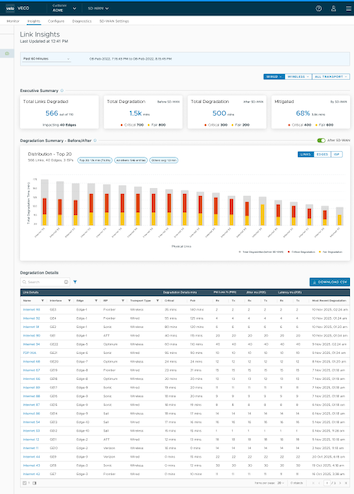
The Executive Summary section appears at the top of the Link Insights dashboard. It displays Enterprise-wide degradation overview and SD-WAN mitigation impact.

Transport Type Selection:
These buttons allow users to isolate performance data based on the physical medium of the network links:
- Wired: Displays metrics only for fixed-line connections. This is the default selection.
- Wireless: Displays metrics only for cellular or satellite connections.
- All Transport: Consolidates both Wired and Wireless data into a single unified view.
| Data | Description |
|---|---|
| Total Links Degraded | Number of links experiencing any degradation out of total links in the Enterprise (e.g., "200 out of 2k"). |
| Total Degradation Before SD-WAN | Cumulative degradation time (in minutes) across all links before SD-WAN optimization. |
| Total Degradation After SD-WAN | Cumulative degradation time (in minutes) across all links after SD-WAN optimization. |
| Mitigated | Percentage of degradation time that the SD-WAN successfully eliminates.
Note: A higher mitigation percentage indicates greater effectiveness of the SD-WAN optimization for the affected links.
|
Degradation Summary
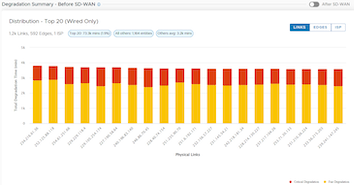
- Before SD-WAN: Displays the raw underlay link quality measured before applying any SD-WAN corrective actions.
- After SD-WAN: Displays the effective link quality after applying SD-WAN corrective actions. Shows residual degradation after SD-WAN optimization. Bars that fully disappear indicate 100% mitigation.
-
Red segments represent Critical (RED) degradation time
-
Yellow segments represent Fair (YELLOW) degradation time
| Tab | Description |
|---|---|
| Links | This is the default selection. Ranks individual physical links by total degradation time. Useful for identifying specific underperforming WAN connections. |
| Edges | Ranks Edge devices by grouping degradation across all their links. Useful for identifying sites with systemic connectivity issues. |
| ISPs | Ranks Internet Service Providers by grouping degradation across all links they serve. Useful for evaluating carrier performance. |
Select any item from the Top 20 Links, Edges, or ISPs to view the respective degradation details in the next section.
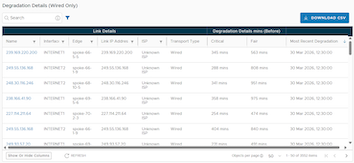
Degradation Details
| Column Name | Description |
|---|---|
| Name | Name of the WAN link. |
| Interface | Network interface associated with the link. |
| Edge | Name of the Edge device. |
| Link IP Address | IP address assigned to the link. |
| ISP | Internet Service Provider for the link. |
| Transport Type | Type of transport (Wired or Wireless). |
| Critical (Before) | Total Critical (Red) degradation time before SD-WAN optimization, in minutes. |
| Fair (Before) | Total Fair (Yellow) degradation time before SD-WAN optimization, in minutes. |
| Most Recent Degradation | Timestamp of the most recent degradation event on this link. |
| Column Group | Column Names | Description |
|---|---|---|
| Critical Degradation (After) | Critical, Fair | Degradation time after SD-WAN optimization, in minutes. |
| Packet Loss - P95 (RX | TX) | Rx, Tx | 95th percentile packet loss in each direction (%). |
| Jitter - P95 (RX | TX) | Rx, Tx | 95th percentile jitter in each direction (ms). |
| Latency - P95 (RX | TX) | Rx, Tx | 95th percentile latency in each direction (ms). |
Click any column header to sort the table by that column. Click again to reverse the sort direction. Sortable columns include all degradation metrics, network metrics, transport type, and last updated timestamp.
The Degradation Details section includes a Quick Search field that performs a case-insensitive substring search across all fields simultaneously. It also supports advanced column-level filtering.
Link Insights supports exporting Degradation data to CSV format for offline analysis, reporting, or integration with third-party tools. The export action takes into account all currently applied filters and sort orders.