Login
Wi-Fi Launchpad
Community Central
日本語
  • English
  • 日本語
  • 中文
  • 한국어
Arista
  • ソリューション
    • AI Networking
    • クラウド・ネットワーキング
    • クラウドグレードルーティング
    • Cognitive Campus Workspaces
    • 高頻度トレーディング
    • SD-WAN & Edge Routing
    • Federal Government
    • ハイブリッドクラウド
    • IPストレージとビッグ・データ
    • メディアとエンターテイメント
    • Network Observability
    • セキュリティ
    • テレメトリと分析
  • 製品
    • 製品の概要
    • EOS
    • CloudVision
    • Featured Products
    • Featured Platforms
    • Security
    • DANZ Monitoring Fabric
    • Cognitive Wi-Fi
    • トランシーバー&ケーブル
    • Product Families
    • 製品の概要
    • EOS 概要
    • CloudVision 概要
    • CloudVision Universal Network Observability (CV UNO)
    • プラットフォーム 概要
    • 7800R シリーズ
    • 7700R シリーズ
    • 7500R シリーズ
    • 7300X シリーズ
    • 7280R シリーズ
    • 7200R シリーズ
    • 7130 シリーズ
    • 7060X シリーズ
    • 7050X シリーズ
    • 7020R シリーズ
    • 7010X シリーズ
    • 700 シリーズ
    • Cognitive Wi-Fi
    • SD-WAN & Edge Routing
    • Universal Cloud Networking
    • Hyperscale Data Center
    • Cloud Grade Routing
    • SD-WAN & Edge Routing
    • Cognitive Campus
    • R-Series Spine & Leaf
    • X-Series Spine & Leaf
    • Programmable
    • 800G Solutions
    • 400G Solutions
    • Flexible 10G & 1G Leaf
    • Network Observability
    • Detection and Response
    • Network Access Control
    • Multi-Domain Segmentation (MSS)
    • Arista NDR
    • Wireless Intrusion Prevention System
    • Edge Threat Management
    • Security Services
    • DMF Overview
    • Multi-Cloud Director Data Sheet
    • 7800R4 シリーズ
    • 7800R3 シリーズ
    • 7700R4 シリーズ 概要
    • 7700R4 のデータシート
    • 7500R3 シリーズ
    • 7500R シリーズ
    • 7388X5 シリーズ
    • 7368X4 シリーズ
    • 7358X4 シリーズ
    • 7300X3 シリーズ
    • 7280R4 シリーズ
    • 7280R3 シリーズ
    • 7280R3 Modular シリーズ
    • AWE 7200R シリーズ 概要
    • AWE 7200R のデータシート
    • 7130 シリーズ 概要
    • 7130 Hardware
    • 7130 Applications
    • 7130 Developer
    • 7060XE7 シリーズ
    • 7060X6 シリーズ
    • 7060X5 シリーズ
    • 7060X シリーズ
    • 7050X4 シリーズ
    • 7050X3 シリーズ
    • 7050X シリーズ
    • 7020R4 シリーズ 概要
    • 7020R4 のデータシート
    • 7010X シリーズ 概要
    • 7010X のデータシート
    • 7010X クイック ルック
    • 750 シリーズ
    • 722XPM シリーズ
    • 720XPM シリーズ
    • 720XP シリーズ
    • 720D シリーズ
    • 710HXP シリーズ
    • 710XP シリーズ
    • 710P シリーズ
    • Wi-Fi 7 シリーズ
    • Wi-Fi 6E シリーズ
    • Wi-Fi 6 シリーズ
    • 7x0 シリーズ Virtual Edge
    • 4100 & 5100 シリーズ
    • Leaf & Spine
    • Spine & Routing
    • Leaf & Routing
    • Hyperscale Data Center
    • 7700R4 シリーズ
    • 7368X4 & 7060X4 シリーズ
    • 7260X3 シリーズ
    • 7060X6 シリーズ
    • 7060X5 シリーズ
    • 7060X2 & 7060X シリーズ
    • Cloud Grade Routing
    • 7800R4 シリーズ
    • 7800R3 シリーズ
    • 7500R3 シリーズ
    • 7280R4 シリーズ
    • 7280R3 シリーズ
    • 7020R4 シリーズ
    • Spine & Edge Routing
    • Wired
    • Wireless
    • Network Access Control
    • R-Series Spine & Leaf
    • 7800R シリーズ
    • 7700R シリーズ
    • 7500R シリーズ
    • 7280R シリーズ
    • 7020R シリーズ
    • X-Series Spine & Leaf
    • 7300X シリーズ
    • 7060X シリーズ
    • 7050X シリーズ
    • Programmable
    • 7130 シリーズ
    • 800G Solutions
    • 7800R4 シリーズ
    • 7700R4 シリーズ
    • 7280R4 シリーズ
    • 7060X6 シリーズ
    • 400G Solutions
    • 7800R4 シリーズ
    • 7800R3 シリーズ
    • 7700R4 シリーズ
    • 7500R3 シリーズ
    • 7388X5 シリーズ
    • 7368X4 シリーズ
    • 7358X4 シリーズ
    • 7280R3 シリーズ
    • 7060X6 シリーズ
    • 7060X5 シリーズ
    • 7060X4 シリーズ
    • 7050X4 シリーズ
    • Flexible 10G & 1G Leaf
    • 7020R4 シリーズ
    • 7010X シリーズ
    • 720XP シリーズ
    • Observability Overview
    • DANZ Monitoring Fabric
    • Detection and Response Overview
    • Security Services
    • 7800R4 シリーズ 概要
    • 7800R4 AI Spine
    • 7800R4 Universal Spine
    • 7800R3 シリーズ 概要
    • 7800R3 クイック ルック
    • 7800R3 のデータシート
    • 7500R3 シリーズ 概要
    • 7500R3 クイック ルック
    • 7500R3 のデータシート
    • 7500R シリーズ 概要
    • 7500R クイック ルック
    • 7500R のデータシート
    • 7388X5 シリーズ 概要
    • 7388X5 クイック ルック
    • 7388X5 のデータシート
    • 7368X4 シリーズ 概要
    • 7368X4 クイック ルック
    • 7368X4 のデータシート
    • 7358X4 シリーズ 概要
    • 7358X4 クイック ルック
    • 7358X4 のデータシート
    • 7300X3 シリーズ 概要
    • 7300X3 クイック ルック
    • 7300X3 のデータシート
    • 7280R4 シリーズ 概要
    • 7280R4 のデータシート
    • 7280R3 シリーズ 概要
    • 7280R3 のデータシート
    • 7280R3 クイック ルック
    • 7280R3A のデータシート
    • 7280R3A クイック ルック
    • 7280R3 Modular のデータシート
    • 7280R3 Modular クイック ルック
    • 7130 Hardware Overview
    • 7130 Connect シリーズ
    • 7130E シリーズ
    • 7130L シリーズ
    • 7130LBR シリーズ
    • 7132LB シリーズ
    • 7135LB シリーズ
    • 7135V シリーズ
    • 7130 Applications Overview
    • MetaWatch App
    • MetaMux App
    • MultiAccess App
    • MetaProtect App
    • Exchange App
    • Switch App
    • 7130 Developer Overview
    • IP Cores
    • Development Kits
    • 7060XE7 シリーズ 概要
    • 7060XE7 クイック ルック
    • 7060XE7 のデータシート
    • 7060X6 シリーズ 概要
    • 7060X6 クイック ルック
    • 7060X6 のデータシート
    • 7060X5 シリーズ 概要
    • 7060X5 クイック ルック
    • 7060X5 のデータシート
    • 7060X シリーズ 概要
    • 7060X & 7260X クイック ルック
    • 7060X & 7260X のデータシート
    • 7050X4 シリーズ 概要
    • 7050X4 クイック ルック
    • 7050X4 のデータシート
    • 7050X3 シリーズ 概要
    • 7050X3 クイック ルック
    • 7050X3 のデータシート
    • 7050X シリーズ 概要
    • 7050X クイック ルック
    • 7050X のデータシート
    • 750 シリーズ 概要
    • 750 Data Sheet
    • 722XPM シリーズ 概要
    • 722XPM のデータシート
    • 720XPM シリーズ 概要
    • 720XPM のデータシート
    • 720XP シリーズ 概要
    • 720XP のデータシート
    • 720D シリーズ 概要
    • 720D のデータシート
    • 710HXP シリーズ 概要
    • 710HXP のデータシート
    • 710XP シリーズ 概要
    • 710XP のデータシート
    • 710P シリーズ 概要
    • 710P のデータシート
    • 7x0 シリーズ Virtual Edge 概要
    • 7x0 シリーズ Virtual Edge のデータシート
    • 4100 & 5100 シリーズ 概要
    • 4100 & 5100 シリーズ のデータシート
    • Leaf & Spine
    • R シリーズ
    • X シリーズ
    • Spine & Routing
    • 7800R4 シリーズ
    • 7800R3 シリーズ
    • 7500R3 シリーズ
    • 7368X4 シリーズ
    • 7300X3 シリーズ
    • 7300X シリーズ
    • 7280R4 シリーズ
    • 7280R3 Modular シリーズ
    • Leaf & Routing
    • 7280R4 シリーズ
    • 7280R3 シリーズ
    • 7280R3 Modular シリーズ
    • 7260X3 シリーズ
    • 7060X4 シリーズ
    • 7060X2 & 7060X シリーズ
    • 7050X3 シリーズ
    • 7050X シリーズ
    • 7020R4 シリーズ
    • 7368X4 シリーズ
    • 7060X4 シリーズ
    • 7280R3 シリーズ
    • 7280R3 Modular シリーズ
    • Spine & Edge Routing
    • 7300X シリーズ
    • 7280R4 シリーズ
    • 7280R3 シリーズ
    • 7050X シリーズ
    • 7020R4 シリーズ
    • Wired & Wireless
    • 7300X シリーズ
    • 7050X シリーズ
    • 750 シリーズ
    • 720XP シリーズ
    • 722XPM シリーズ
    • 720D シリーズ
    • 710P シリーズ
    • Cognitive Wi-Fi
    • Wi-Fi 6 シリーズ
    • Wi-Fi 6E シリーズ
    • 7800R シリーズ
    • 7800R4 シリーズ
    • 7800R3 シリーズ
    • 7700R シリーズ
    • 7700R4 シリーズ
    • 7500R シリーズ
    • 7500R3 シリーズ
    • 7500R シリーズ
    • 7280R シリーズ
    • 7280R4 シリーズ
    • 7280R3 シリーズ
    • 7280R3 Modular シリーズ
    • 7020R4 シリーズ 概要
    • 7020R4 のデータシート
    • 7300X Series Spine
    • 7388X5 シリーズ
    • 7368X4 シリーズ
    • 7358X4 シリーズ
    • 7300X シリーズ
    • 7060X シリーズ
    • 7060XE7 シリーズ
    • 7060X6 シリーズ
    • 7060X5 シリーズ
    • 7060X4 シリーズ
    • 7060X2 and 7060X
    • 7050X シリーズ
    • 7050X4 シリーズ
    • 7050X3 シリーズ
    • 7050X シリーズ
    • 7130 Series Overview
    • 7130 Hardware
    • 7130 Applications
    • 7130 Developer
  • パートナー
    • パートナー・プログラム
    • パートナー登録
    • Partner Code of Ethics and Business Conduct
    • チャネル・パートナー・ポータル
    • 技術パートナー
  • サポート
    • サポートの概要
    • お客さまサポート
    • 製品資料
    • Product Certifications
    • 報告とお知らせ
    • Product Lifecycle
    • ソフトウェア・ダウンロー
    • Transfer of Information
    • Support Portal
    • Training
    • ソフトウェア・バグ・ポータル
    • CVP Upgrade Path
    • MLAG ISSU Check
    • Tech Library Portal
  • 会社
    • 会社 概要
    • Corporate Responsibility
    • 経営チーム
    • ブログ
    • 投資家向け広報
    • Events Calendar
    • Webinars
    • 動画ライブラリー
    • 実績
    • 採用情報
    • ニュース
    • お問い合わせ
  • VeloCloud SD-WAN 7.0 - Operator Guide


  • Whats New
  • About VeloCloud SD-WAN Operator Guide
  • Overview of VeloCloud Edge Cloud Orchestrator
  • Supported Browsers
  • Log into the Orchestrator Using SSO for an Operator User
  • Configure Advisory Notice and Consent Warning Message for Orchestrator
  • Monitor Customers
  • Manage Customers
  • Manage Partners
  • Partner Settings
  • Manage Operators
  • Link Insights
  • User Management-Operator
  • Orchestrator Branding for Operator
  • Manage User Agreements
  • Manage Gateway Pools and Gateways
  • Platform and Modem Firmware and Factory Images
  • Software Images
  • Edge Licensing
  • Application Maps
  • Edge Management
  • Access SD-WAN Edges Using Key-Based Authentication
  • Configure User Account Details
  • Orchestrator Diagnostics
  • Orchestrator Upgrade
  • Replication
  • System Properties
  • External Certificate Authority
  • Appendix
  • References
Version
印刷
.
.
◄
►

Link Insights

Release 7.0.0 introduces the Link Insights feature, which provides comprehensive visibility into the health and performance of WAN links across VeloCloud SD-WAN. By continuously monitoring link-level Quality of Experience (QoE) metrics, including latency, jitter, and packet loss, Link Insights identifies degraded connections and quantifies the effectiveness of SD-WAN optimization. This feature provides insights into Edges across an Enterprise, helping optimize network performance, troubleshoot, manage costs, and improve the user experience.

Key Capabilities:
  • Real-time degradation detection: Automatically classifies link quality events as Critical (Red) or Fair (Yellow) based on configurable thresholds for Voice, Video, and Transactional traffic types.
  • Before vs. After SD-WAN comparison: Compares link performance before and after applying SD-WAN corrective actions to quantify the overlay's mitigation impact.
  • Multi-dimensional analysis: Groups degradation data by individual Link, Edge, or ISP to isolate problem areas across the network.
  • Top-N ranking: Surfaces the worst-performing Links, Edges, and ISPs to focus troubleshooting on the most impactful issues.
  • Detailed drill-down: Provides a paginated detail grid with per-link metrics, sorting, filtering, and CSV export for offline analysis and reporting.

Link Quality Classification:

Link Insights classifies link quality into three states based on QoE threshold violations:
Table 1. Link Quality Classification
State Color Severity Description
Critical Red High Link metrics exceed the critical threshold, causing the link to degrade severely, resulting in a noticeable impact on end users. This state requires immediate investigation.
Fair Yellow Moderate Link metrics exceed the fair threshold but remain below the critical threshold, causing the link to experience moderate degradation that may affect sensitive applications.
Normal Green None Link metrics are within acceptable thresholds. The Orchestrator does not detect any degradation.

Enabling Link Insights:

The Link Insights feature is available to Operators, Partners, and Customers. However, Operators must enable this feature for Partners and Enterprise users through system properties. For more information, see the topic List of System Properties in the Arista VeloCloud Orchestrator Deployment and Monitoring Guide.

Additionally, users must activate this feature by navigating to Global Settings > Customer Configuration > Feature Access . For more information, see the topic Customer Configuration in the Arista VeloCloud Global Settings Guide.
Note: The Link Insights tab appears in Orchestrator only after completing these settings.

Accessing Link Insights

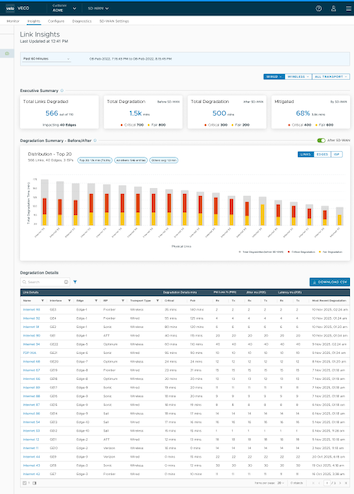
Select the Insights tab from the top menu of the Orchestrator. Select Link Performance located on the left pane. The following Link Insights Dashboard appears:
Figure 1. Link Insights Dashboard
The dashboard features three sections that offer progressively deeper levels of analysis. Click each of these links for more details.
  • Executive Summary
  • Degradation Summary
  • Degradation Details
Note: The system retains data for up to 365 days. The filter option allows users to view data based on the selected time period. Performance limitations restrict the data selection range to a maximum of 31 days. The default filter value is Past 12 Hours.

Executive Summary

The Executive Summary section appears at the top of the Link Insights dashboard. It displays Enterprise-wide degradation overview and SD-WAN mitigation impact.

Figure 2. Executive Summary

Transport Type Selection:

These buttons allow users to isolate performance data based on the physical medium of the network links:

  • Wired: Displays metrics only for fixed-line connections. This is the default selection.
  • Wireless: Displays metrics only for cellular or satellite connections.
  • All Transport: Consolidates both Wired and Wireless data into a single unified view.
Note: For each transport type, users can also filter by Voice, Video, and Transactional.
The Executive Summary section displays the following data:
Table 2. Executive Summary - Data
Data Description
Total Links Degraded Number of links experiencing any degradation out of total links in the Enterprise (e.g., "200 out of 2k").
Total Degradation Before SD-WAN Cumulative degradation time (in minutes) across all links before SD-WAN optimization.
Total Degradation After SD-WAN Cumulative degradation time (in minutes) across all links after SD-WAN optimization.
Mitigated Percentage of degradation time that the SD-WAN successfully eliminates.
Note: A higher mitigation percentage indicates greater effectiveness of the SD-WAN optimization for the affected links.

Degradation Summary

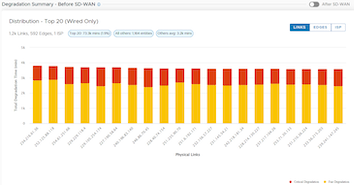
The Degradation Summary section displays the cumulative degradation time, in minutes, for the selected time range. The Orchestrator measures degradation at 30-second intervals. Users can compare the link performance before and after applying the SD-WAN corrective actions. This comparison quantifies the value of the SD-WAN overlay.
Figure 3. Degradation Summary
Select the toggle button to switch between the Before SD-WAN and After-SD-WAN degradation summary.
  • Before SD-WAN: Displays the raw underlay link quality measured before applying any SD-WAN corrective actions.
  • After SD-WAN: Displays the effective link quality after applying SD-WAN corrective actions. Shows residual degradation after SD-WAN optimization. Bars that fully disappear indicate 100% mitigation.
The Degradation Summary section provides a stacked bar chart ranking the top 20 worst-performing items by total degradation time. Each bar is segmented by severity:
  • Red segments represent Critical (RED) degradation time

  • Yellow segments represent Fair (YELLOW) degradation time

Select one of the following tabs to filter the degradation data by Links, Edges, or ISPs:
Table 3. Degradation Filters
Tab Description
Links This is the default selection. Ranks individual physical links by total degradation time. Useful for identifying specific underperforming WAN connections.
Edges Ranks Edge devices by grouping degradation across all their links. Useful for identifying sites with systemic connectivity issues.
ISPs Ranks Internet Service Providers by grouping degradation across all links they serve. Useful for evaluating carrier performance.
Note: At the bottom of the Degradation Summary section, three dots indicate the link statuses. The After SD-WAN view displays a light blue dot, which signifies that the SD-WAN overlay successfully resolved all link degradation.

Select any item from the Top 20 Links, Edges, or ISPs to view the respective degradation details in the next section.

Degradation Details
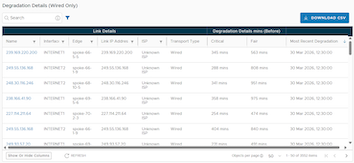
The Degradation Details section provides a paginated table with per-link performance data. It supports sorting, filtering, column selection, and CSV export for detailed analysis. Users can also refresh the data.
Figure 4. Degradation Details
The following columns are visible by default:
Table 4. Default Columns
Column Name Description
Name Name of the WAN link.
Interface Network interface associated with the link.
Edge Name of the Edge device.
Link IP Address IP address assigned to the link.
ISP Internet Service Provider for the link.
Transport Type Type of transport (Wired or Wireless).
Critical (Before) Total Critical (Red) degradation time before SD-WAN optimization, in minutes.
Fair (Before) Total Fair (Yellow) degradation time before SD-WAN optimization, in minutes.
Most Recent Degradation Timestamp of the most recent degradation event on this link.
Enable the following columns through the Show or Hide Columns drop-down menu:
Table 5. Additional Column Groups
Column Group Column Names Description
Critical Degradation (After) Critical, Fair Degradation time after SD-WAN optimization, in minutes.
Packet Loss - P95 (RX | TX) Rx, Tx 95th percentile packet loss in each direction (%).
Jitter - P95 (RX | TX) Rx, Tx 95th percentile jitter in each direction (ms).
Latency - P95 (RX | TX) Rx, Tx 95th percentile latency in each direction (ms).
Note: Toggling a metric column group simultaneously shows or hides both the Rx and Tx columns.

Click any column header to sort the table by that column. Click again to reverse the sort direction. Sortable columns include all degradation metrics, network metrics, transport type, and last updated timestamp.

The Degradation Details section includes a Quick Search field that performs a case-insensitive substring search across all fields simultaneously. It also supports advanced column-level filtering.

Link Insights supports exporting Degradation data to CSV format for offline analysis, reporting, or integration with third-party tools. The export action takes into account all currently applied filters and sort orders.

..
Contact Us
Arista
Facebook Twitter LinkedInYouTube
  • Support
    • Support & Services
    • Training
    • Product Documentation
    • Software Downloads
  • Contacts & Help
    • Contact Arista
    • Contact Technical Support
    • Order Status
  • News
    • News Room
    • Events Calendar
    • Blogs
  • About Arista
    • Company
    • Management Team
    • Careers
    • Investor Relations
    • Reports
  • Terms of Use
  • Privacy Policy
  • Fraud Alert
  • Trust Center
  • Sitemap