Managing DMF Policies
This chapter describes the policies to work and configure in the DANZ Monitoring Fabric (DMF).
Overview
A policy selects the traffic to be copied from a production network to one or more tools for analysis. To define a policy, identify the traffic source(s) (filter interfaces), the match rules to select the type of traffic, and the destination tool(s) (delivery interfaces). The DANZ Monitoring Fabric (DMF) Controller automatically forwards the selected traffic based on the fabric topology. Define match rules to select interesting traffic for forwarding to the tools connected to the specified delivery interfaces. Users can also send traffic to be processed by a managed service, such as time stamping, slicing, or deduplication, on a DMF service node. Forward the output from the service node to the appropriate tool for analysis.
While policies can be simple, they can also be more complicated when optimizing hardware resources, such as switching TCAM space. Also, DMF provides different switching modes to optimize policies based on use cases and switch capabilities. Arista Networks recommends planning the switching mode before configuring policies in a production deployment.
For further information, refer to the chapter Advanced Policy Configuration.
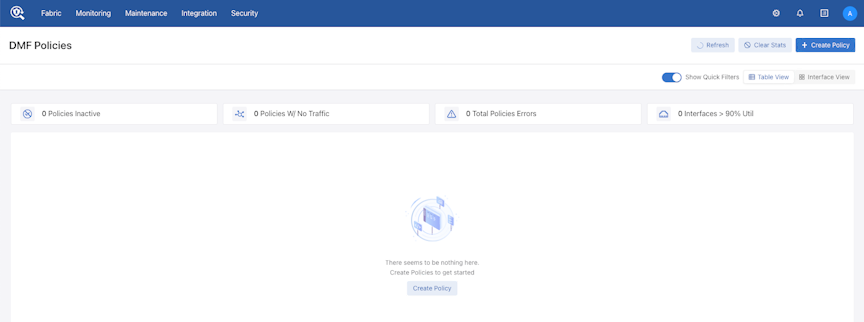
DMF Policies Page
Overview
While retaining all information from the previous version, the new policy page features a new layout and design and offers additional functionality for easier viewing, monitoring, and troubleshooting of policies.
Header Action Items
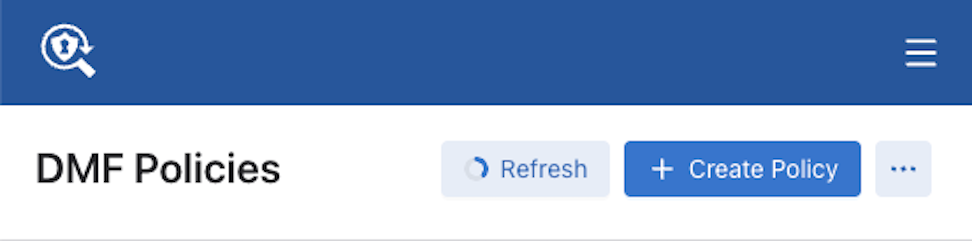
- Refresh Button

The page refreshes every 60 seconds automatically. Select Refresh to manually refresh the page.
- Create Policy Button

Select + Create Policy to open the policy creation page.
- Clear Stats Button
Select Clear Stats to clear all DMF interface's runtime stats.
Quick Filters
- Show Quick Filters Button

By default, the feature is toggled on and displays four quick filter options. When toggled off, the four quick filters are no longer displayed.

Four quick filter cards display the policy counts that meet the filter criteria and the filter name. The quick filter cards support multi-select.
- Radio Buttons
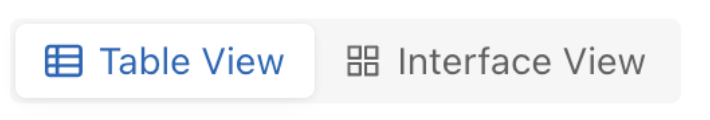
Switch page views between Table View and Interface View. Refer to the Table View and Interface View sections below for more information.
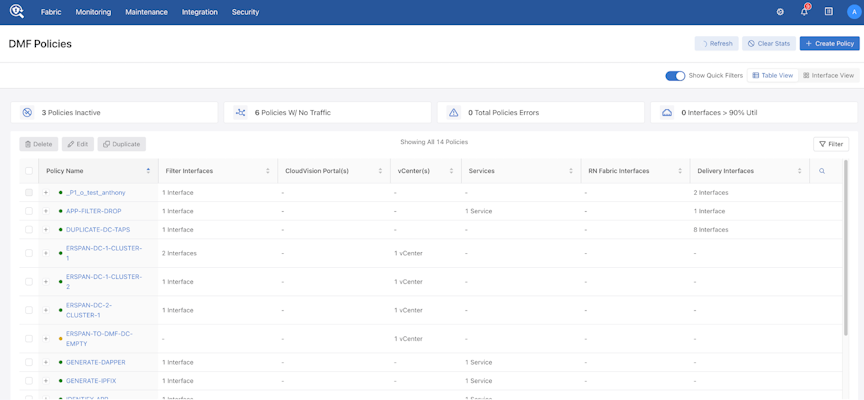
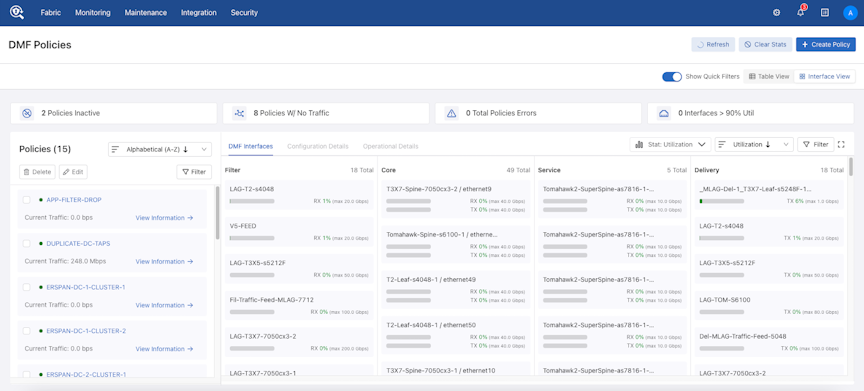
Table View
The table view is the default landing view of the Policies Page.
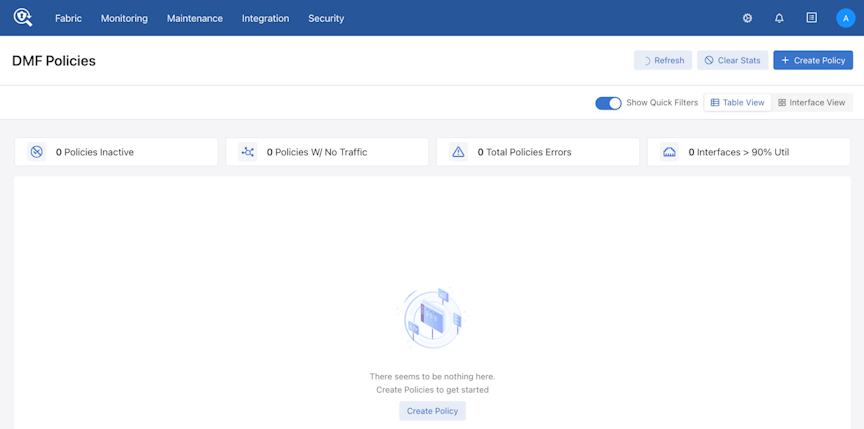
The page displays an empty table with the Create Policy control when no configured policies exist.
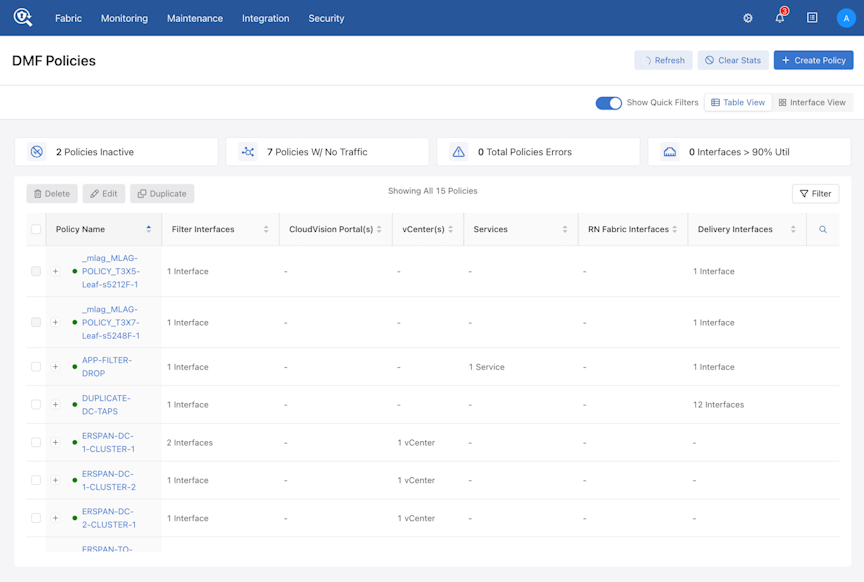
Conversely, when configured policies exist, the table view displays the list of policies.
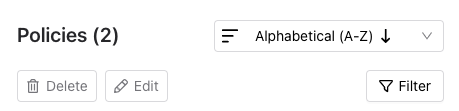
Action Buttons
Several buttons in the policy table provide quick access to corresponding functionality. These are:
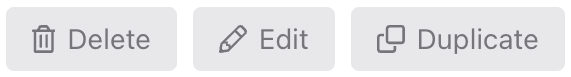
Delete
- Disabled by default (when no policies are selected).
- Enabled when one or more policies are selected.
- Used to delete selected policies.
Edit
- Disabled by default (when no policies are selected).
- Enabled only when a policy is selected.
- Navigate to the editing workflow (the new policy edit workflow).
Duplicate
- Disabled by default (when no policy is elected).
- Enabled only when one policy is selected.
- Navigate to the create policy workflow (the new policy create workflow) with an empty name input field while retaining the same settings from the selected policy.
Table View Filters
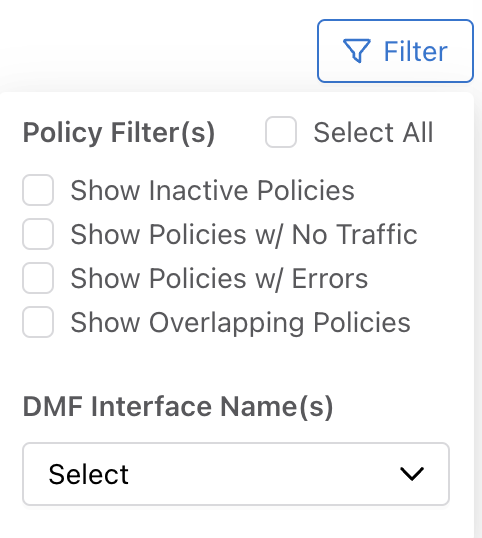
Select Filter to open the filter menu.
Policy Filter(s)
- There are four quick policy filters. The first three filters overlap with the quick filters; thus, enabling or disabling them will trigger changes to the quick filter control.
DMF Interface Name(s)
- Filters out policies by DMF interfaces that are selected from the drop-down list.
- Searchable
- Allows multiple selections applying OR logic.
Policies Table
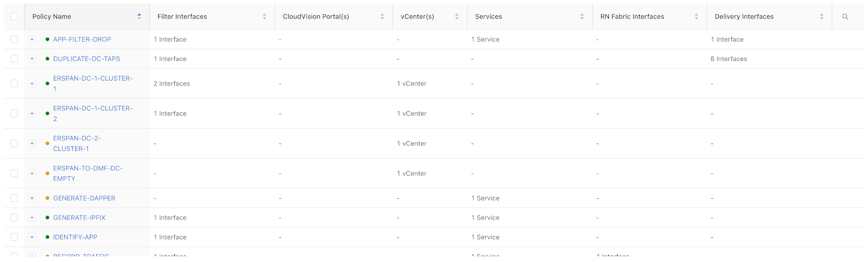
The Policy table displays all policies; each column shows the number of interfaces and services corresponding to that policy.
Table Search
The Policy table supports search functionality. Select the magnifying glass icon in the last column to activate the search input fields and search the results by the context of each column.
Table Search: The Policy table supports search functionality. Select the magnifying glass icon in the last column to activate the search input fields. Search results by the context of each column.

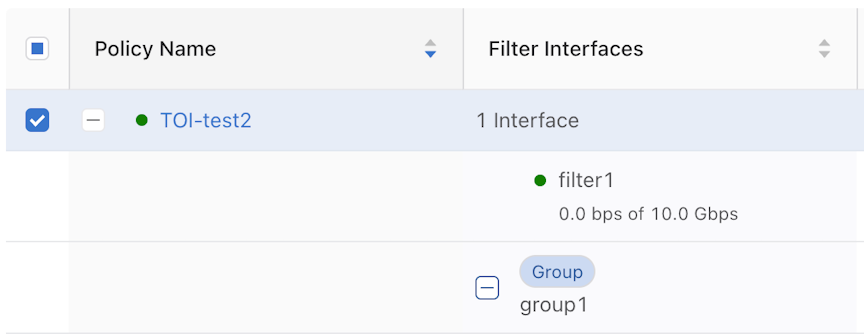
Expand Policy + Icon
Hidden for an unconfigured policy. Select the expand + icon to view the policy's interfaces and services information.

Interfaces Group Expand + Icon
For policies configured with an interface group, an expand + icon with group displays by default. Select the group expand + icon to view the detailed information on the interfaces belonging to that group.
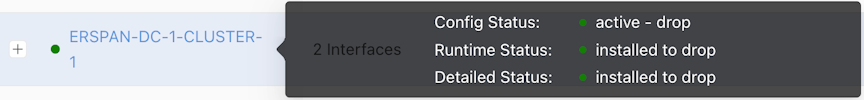
Policy Name Tooltip
Hovering over policy names displays the tooltips for the policy, including Configuration / Runtime / Details state.
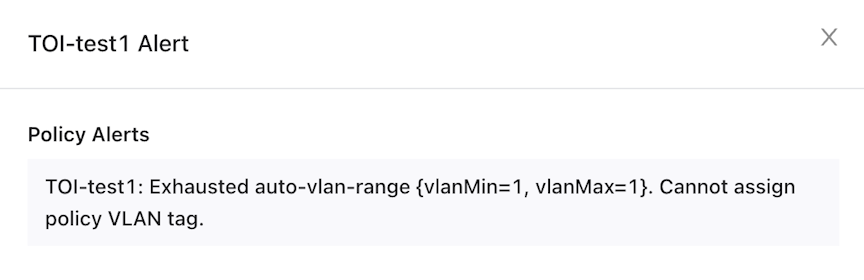
Policy Error Icon
Policies with errors will display this icon after the policy name.

Selecting the error icon will display an error window with detailed information.
Checkbox
Disabled for unconfigured policies. Use the checkbox to select a policy and the applicable function buttons (described above) as required.
Table Interaction
- All columns support sorting.
- Selecting a policy name opens the policy table split view. The table on the left displays the policy names. The table on the right provides two tabs showing Configuration and Operational Details.
- Use the
 icon to view the information in full-screen mode or the X icon to close the split view and return to the table view.
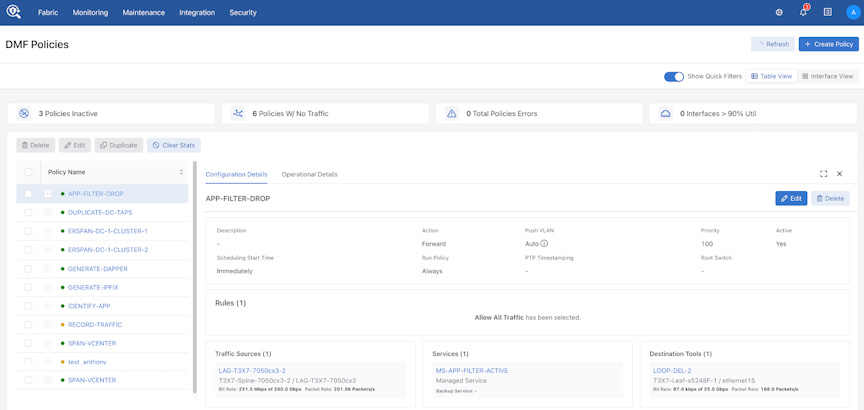
Configuration Details
Access the Configuration Details tab by selecting a policy in either Table View or Interface View. This tab displays all of the configured settings for the selected policy.
The top row of the Configuration Details tab displays the selected policy name and an Edit and Delete control. Edit opens the Edit Policy configuration page with policy information prefilled, and Delete opens a confirmation dialog window before deleting a policy. The default Table View opens after deleting a policy.
The second component of the Configuration Details is the Quick Facts box. This component displays the Description, Action, Push VLAN, Priority, Active, Scheduling Start Time, Policy Run Duration, PTP Timestamping, and Root Switch values.
- Description: An info icon shows the entire description in a tooltip.
- Action: Forward, Drop, Capture, or None.
- Active: Policy active status, Yes or No.
Scheduling Start Time: Either Automatically or the DateTime it is scheduled to start, in terms of the current Time Zone configured on the DMF. When setting DateTime to Now during policy creation, the time of creation will be the Scheduling start time.
- Automatic: The policy will always run. There's no expiration.
- Now: The policy starts from now, and duration and packet expiration may apply. The policy runs from now with no expiration.
Figure 26. Start Time 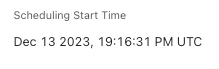
- Run Policy: The duration the policy should run. The default value is Always. Set a time limit (i.e., 4 hours) or a packet limit (i.e., 1,000 packets) The tooltip explains that the policy will stop running when reaching either of the limits.
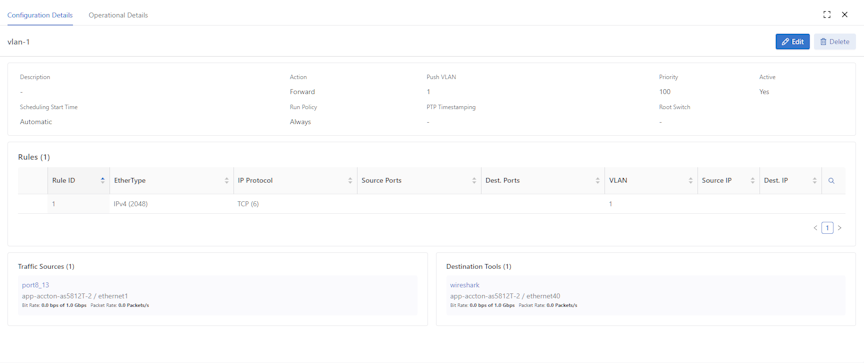
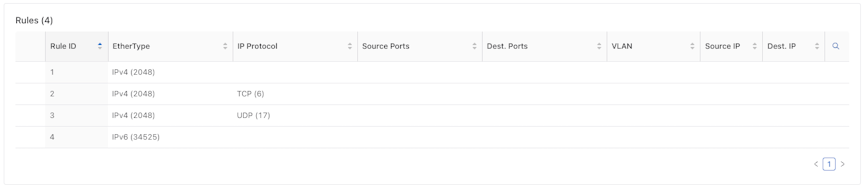
The third component is the Rules Table, which displays all Match Traffic rules configured for the policy. The default value is Allow All Traffic. Optionally, configure Deny All Traffic.


When configuring custom rules, the Rules Table is displayed. The table is horizontally scrollable, and each column is searchable and sortable. The Edit Policy feature provides rule management, including Edit, Add, and Delete functionality.
The next component is the Interface Info Columns.
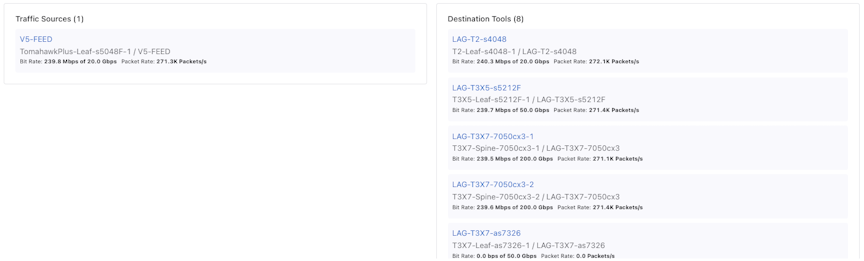
There are three primary columns: Traffic Sources, Services, and Destination Tools.
- The Traffic Sources column includes Filter Interfaces, vCenters, and CloudVision Portal associated with the policy.
- The Services column includes Managed Services and Services associated with the policy.
- The Destination Tools column includes Delivery interfaces and RN Fabric Interfaces associated with the policy.
These columns display the DMF Interface name in the interface card, and the name includes a link to the Interfaces page. The switch name and physical interface name appear in this format: SWITCH-NAME / INTERFACE-NAME under the DMF interface name. The bit rate and packet rate operational state data appear for each interface. Each column is only displayed if the policy has one or more interfaces of that type.

The services column renders for all policies that have at least one service. The service name appears for each card, which contains a link to either the Services or Managed Services page. Under the service name, the service type (Managed Service or Service) appears if the service has a backup name that also appears.
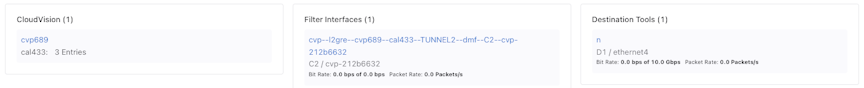
There is a special case for policies that have CloudVision port mirroring sessions. To differentiate the CloudVision source interfaces from the auto-generated DMF filter interfaces, DMF creates two columns: CloudVision and Filter Interfaces.
The cards in the CloudVision column show the connected CloudVision portal and the number of port mirroring sessions for each device in the CloudVision portal. Filter Interfaces and vCenters are now in the Filter Interfaces column. There are no differences between the Services and Destination Tools columns.
The last component only displays for policies with CloudVision port mirroring sessions.
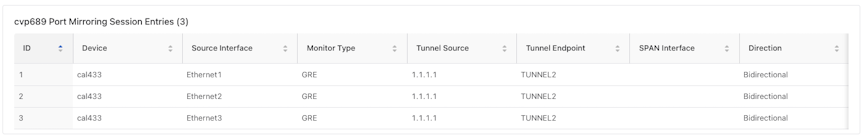
The Port Mirroring Session Entries table shows all configured Port Mirroring Sessions for a CloudVision portal. The Device, Source Interface, Monitor Type, Tunnel Source, Tunnel Endpoint, SPAN Interface, and Direction columns display the same values configured in the Port Mirroring Table in the Add Traffic Sources component in the Create Policy flow. Each column is sortable.
For more information on the configuration flow for CloudVision port mirroring, please refer to the documentation in the Create Policy section.
Operational Details
Selecting the Operational Details Tab navigates to the Operational Details view.
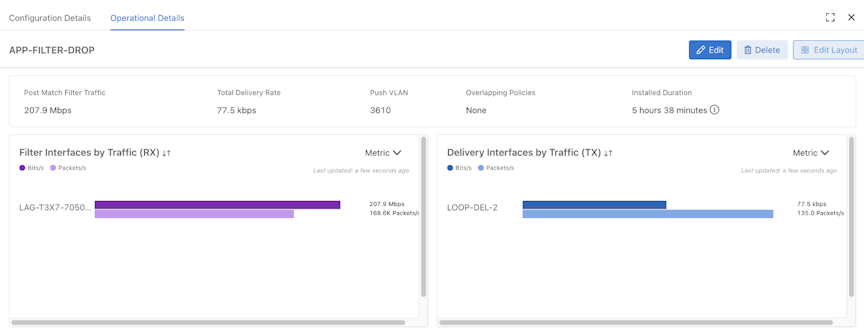

- Edit: Selecting Edit opens the Editing Policy window for making changes to the policy.
- Delete: Selecting Delete deletes the policy.
- Edit Layout: Selecting Edit Layout opens the editing layout window. Move the widgets by dragging the components in order of user preference. Select Save to save the changes. DMF preserves the order of the widgets when the same user logs back in.
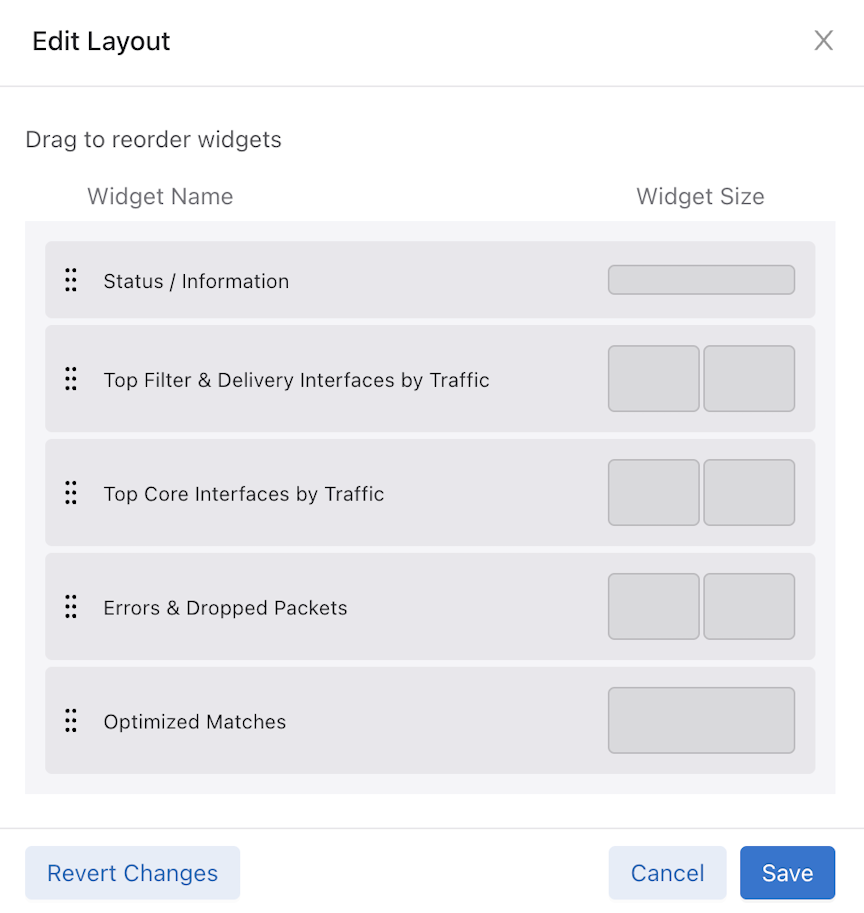
Widgets
Status / Information
Status and information include basic operational information about the policy.

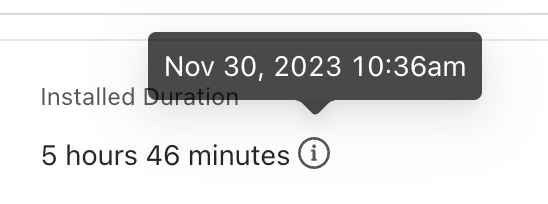
Installed Duration
Hover over the info icon to see the installed time in the UTC time zone.
Top Filter and Delivery Interfaces by Traffic
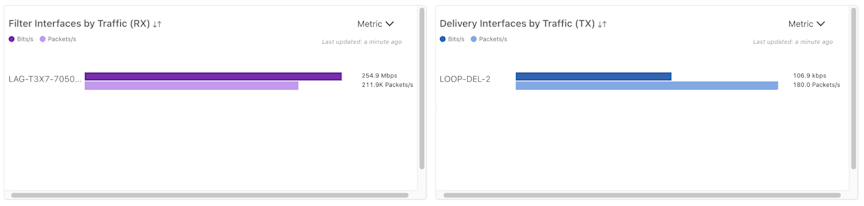
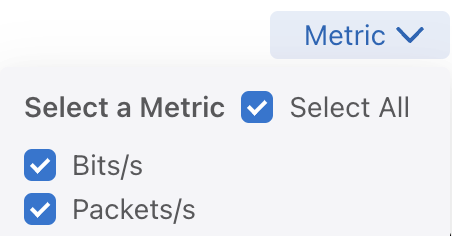
Select the Metric Drop-down menu and choose the metrics to display in the chart. Only the selected metrics appear in the Badge, Labels, and Bar Chart.
- Badge: Colored dots and text indicate the content represented by different bars in the bar chart.
- Interface Name
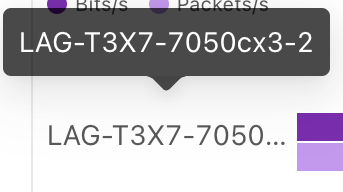
Hover over the interface name to see the full name in the tooltips.
- Labels: Display the number and unit corresponding to the bar.
- Bar Chart: Displays the numerical value of traffic.
- Empty State
- Display title, last updated time, and disabled metric drop-down.
- Edit Policy opens the edit policy window.
Top Core Interfaces by Traffic
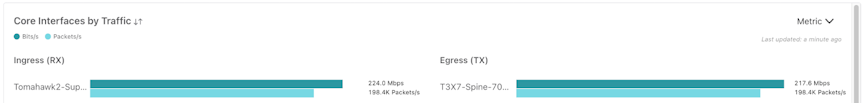
The Core Interfaces by Traffic chart is similar to Filter Interfaces / Delivery Interfaces by Traffic charts, which have Metric Drop-down, Badge, Interface Name, Labels, and Bar Charts with similar functionality.
Errors & Dropped Packets
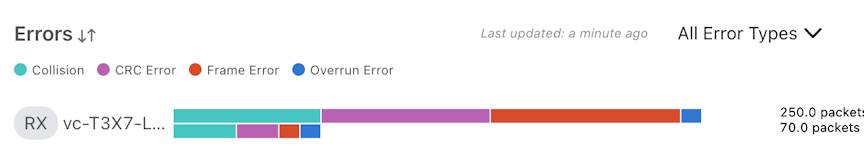
The Errors chart is similar to Filter Interfaces / Delivery Interfaces by Traffic charts, which have Metric Drop-down, Badge, Interface Name, Labels, and Bar Charts with similar functionality. Hovering over the bar displays all error counts and rate information.
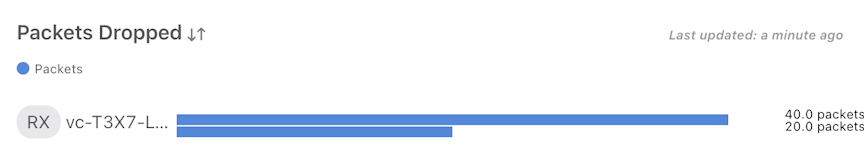
The Dropped Packets chart is similar to Filter Interfaces / Delivery Interfaces by Traffic charts, which have Badge, Interface Name, Labels, and Bar Charts with similar functionality. Hovering over the bar displays all packet dropped counts and rate information.
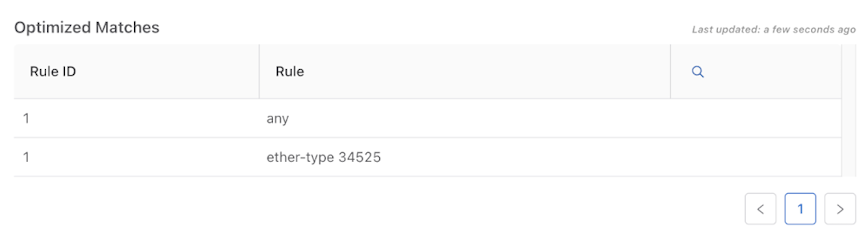
Optimized Matches
Displays optimized match rules.
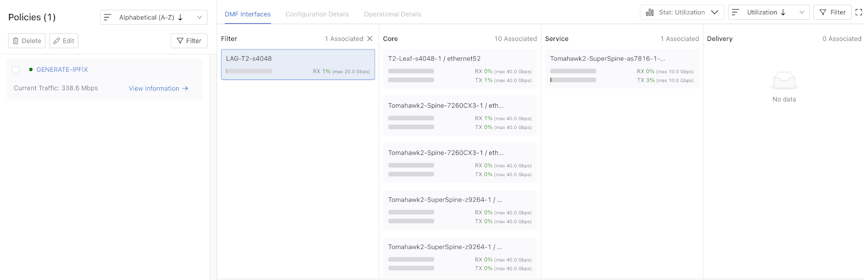
Interface View
As a new feature of the DMF Policies page, the Interface view offers an alternative way to view policies, allowing for an intuitive visualization of all policies-related interfaces.
Policies Column
- A Policies header displaying count. The column shows the total count when no filters are applied, or the filtered policies count in the format of x Associated.
- The drop-down menu enables data sorting using multiple attributes.
- Delete deletes the selected policies.
- Edit opens the selected policy in edit mode.
- The Filter drop-down is similar to the table view filters but without an interface filtering option.
Figure 48. Filter 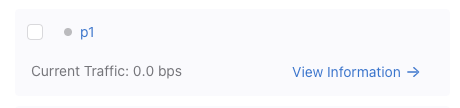
- A list of policies with quick facts and user interactions.
- The checkbox enables policy selection for deletion and editing.
- Badges with different colors indicate policy run time status.
- Policy name with tooltip on hover displaying configuration, runtime, and detailed status.
- Current Traffic display in bps.
- Selecting View Information highlights the policy:
- Only shows the interfaces associated with the selected policy in the DMF Interfaces tab.
- Enable Configuration Details and Operational Details.
- Selecting an active policy card deselects the previously selected policy:
- Deemphasizes the policy and resets card styles and tabs accessibility.
- Reveals all the interfaces in DMF Interfaces.
- Interface card highlights in the DMF Interfaces tab can co-exist, leading to a more granular search.
DMF Interfaces
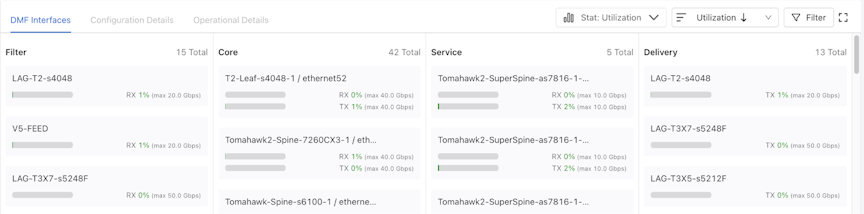
- Active tab by default
- Header Row
- Stat selector: Choose between Utilization, Bit Rate, and Packet Rate to display in the subsequent interface info cards.
- Sorter selector: Choose between Utilization and interface name to sort the interfaces in ascending or descending order.
- Filter drop-down:
- Utilization range filter
- Switch name selector
- DMF interface name selector
- Interface Column
- Header: Specifies interface category and count, showing X Associated when filters apply and X Total otherwise.
- Interface Information Card
- Interface name
- Stat
- Utilization
- Bit Rate
- Packet Rate
- Text: Display detailed information about the selected stat of the current interface.
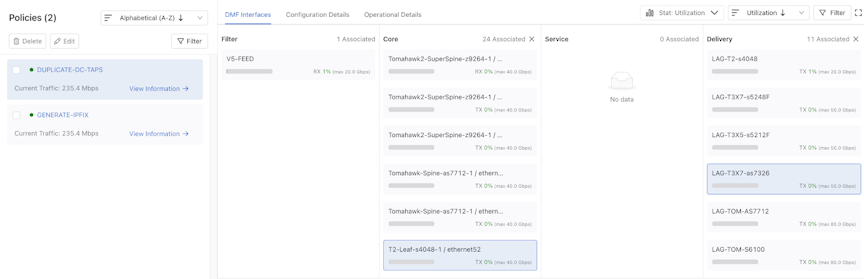
Interaction
- Selecting one policy card:
The selected policy card highlights and filters interfaces to only those configured to the policy and hides interfaces not configured in the selected policy.
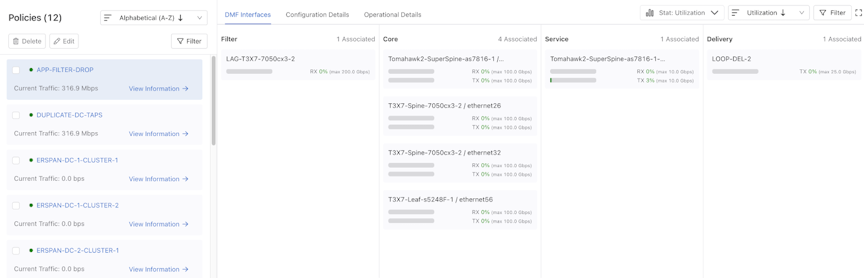
- Selecting one interface card:
The selected interface card highlights and filters policies to only those configured to the interface and hides interfaces not configured in the filtered policies mentioned above.
- Selecting multiple interface cards (any columns):
The selected interface cards highlight and filter policies to only those configured on the selected interfaces and hide interfaces not configured in the filtered policies mentioned above.
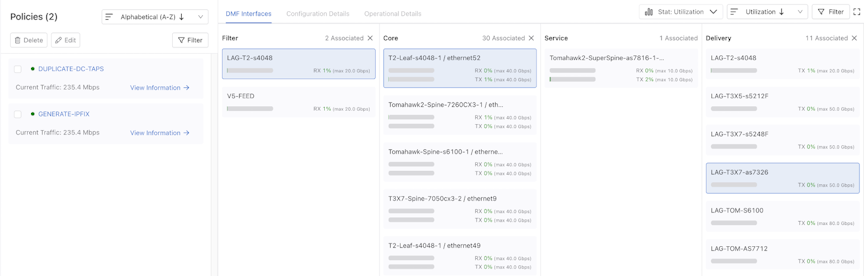
Highlighted policy and interface cards can co-exist, leading to a more granular search.
Configuration Details
The GUI is similar to . Please refer to the Configuration Details section.Operational Details
The GUI is similar to . Please refer to theOperational Details section.Policy Elements
- Filter interfaces: these identify the ingress ports for analyzing the traffic for this policy. Choose individual filter interfaces or one or more filter interface groups. Select the Select All Filter Interfaces option, intended for small-scale deployments.
- Delivery interfaces: these identify the egress ports for analyzing the traffic as part of this policy. Choose individual delivery interfaces or one or more delivery interface groups. Like filter interfaces, a Select All Delivery Interfaces option is available for small deployments.
- Action: identifies the policy action applied to the inbound traffic. The following actions are available:
- Forward: forwards matching traffic at filter ports to the delivery ports defined in a given policy. Select at least one or more filter and delivery interfaces.
- Drop: drops matched traffic at the Filter ports. A policy with a drop action is often used in combination with another lower-priority policy to forward all traffic except the dropped traffic to tools. Use Drop to measure the bandwidth of matching traffic without forwarding it to a tool. Select at least one or more filter interfaces.
- Capture: sends the selected traffic to a physical interface on the controller to be saved in a PCAP file. This option works only on a hardware Controller appliance. Select at least one or more filter interfaces. A policy with a capture action can only run for a short period. For continuous packet capture, use the DANZ Monitoring Fabric (DMF) recorder node. Refer to the chapter DMF Recorder Node for details.
Note:The policy will not be installed if an action is not selected.
- Match rules: used to select traffic. The selected traffic is treated based on the action, with the most common action being Forward, i.e., forward-matched traffic to delivery interfaces. If a match rule is not specified or the match rule is Deny All Traffic, the policy is not installed. One policy can specify multiple match rules, differentiating each rule by its rule number.
Note: The rule numbers do not define the order in which the rules will be installed or processed. The numbering allows a user to list them in order.
- Managed services (optional): identifies additional operations to perform, such as packet slicing, time stamping, packet deduplication, packet obfuscation, etc., before sending the traffic to the selected delivery interfaces.
- Status (optional): enables or disables the policy using the active or inactive sub-command from the config-policy sub-model. By default, a policy is active when initially configured.
- Priority (optional): unless a user specifies, all policies have a priority of 100. When sharing filter/ingress ports across policies, a policy with a higher priority will get access to matching traffic first. Traffic not matched by the policies with the higher priority then gets processed according to policies with lower priority. Overlapping policies are also not created when two policies have different priorities defined.
- Push VLAN (optional): when a user configures the Auto VLAN Mode push as push-per-policy (i.e., to Push Unique VLAN on Policies, every policy configured on DMF gets a unique VLAN ID. Typically, this VLAN ID is in the range of 1-4094 and auto-increments by 1. However, to specific policy with a specific VLAN ID, first define a smaller VLAN range using the command auto-vlan-range and then pick a VLAN outside that range to attach to a specific policy. This attachment of a specific VLAN to a specific policy can be done in the CLI using the CLI command push-vlan or in the GUI by selecting Push VLAN from the Advanced Options drop-down and then specifying the VLAN ID.
- Root switch (optional): when a core switch (or core link) goes down, existing policies using that switch are rerouted using other core switches. When that switch comes back, the policy does not move back. In some cases, this causes traffic overload. One way to overcome this problem is to specify a root switch in each policy. The policy is rerouted through other switches when the root switch goes down. When the root switch comes back, DMF reroutes the policy through the root switch again.
Policies can include multiple filter and delivery interfaces, and services are optional. Traffic that matches the rules in any policy affiliated with a filter interface forwards to all the delivery interfaces defined in the policy.
- Create and configure all interfaces and service definitions before creating a policy that uses them.
- Use only existing interfaces and service definitions when creating a policy. When creating a policy with interfaces or service definitions that do not exist, the policy may enter an inconsistent state.
- If this happens, delete the policy, create the interfaces and service definitions, and then recreate the policy.
Configure a Policy
There are two possible entry points for creating a policy. The first is via Create Policy, continuously displayed on the top-right corner of the DMF Policies page, or the second is via Create Policy, which appears on the central panel of the same page when no configured policies exist.
Selecting Create Policy opens the new Policy Creation configuration page, which supports moving, minimizing, expanding, collapsing, and closing the window using the respective icons in the menu bar.

Move: Select (and hold) any part of the title section of the window or the ![]() icon to drag and reposition as required. Moving the window in full-size mode is not possible.
icon to drag and reposition as required. Moving the window in full-size mode is not possible.
Expand: Use the ![]() icon to enlarge the window.
icon to enlarge the window.
Minimize: Use the ![]() icon to minimize the window and the
icon to minimize the window and the ![]() icon to return to the standard view.
icon to return to the standard view.
Proceed to the following sections for create and manage policies.
Create a New Policy
Create a New Policy
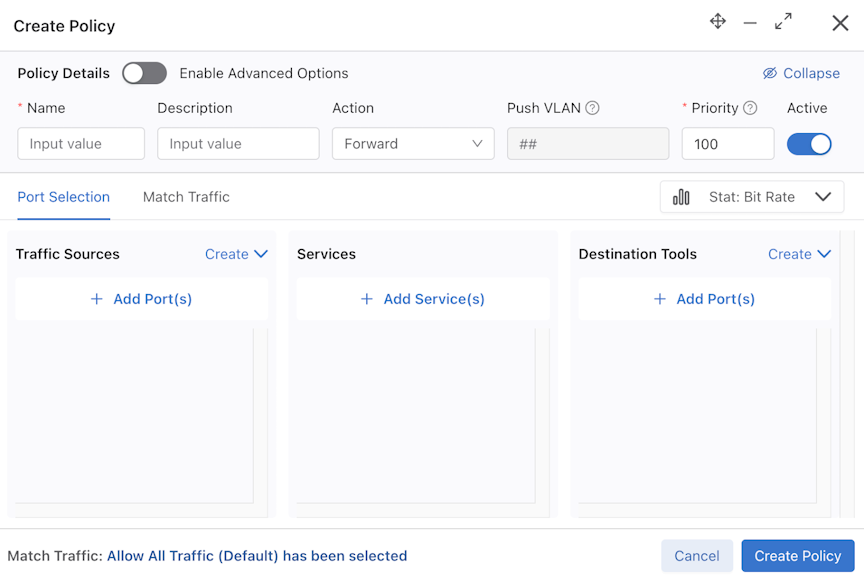
To create a new Policy, complete the required fields in the Policy Details section and configure settings under the Port Selection tab (optional) and the Match Traffic tab (optional). Please refer to the Policy Details, Port Selection Tab, and Match Traffic Tab sections for more detailed information on configuring settings.
Once configured, select Create Policy to save the changes and finish the policy creation.

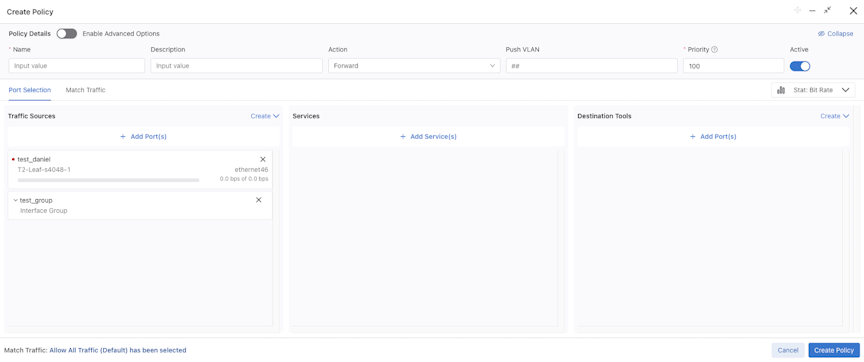
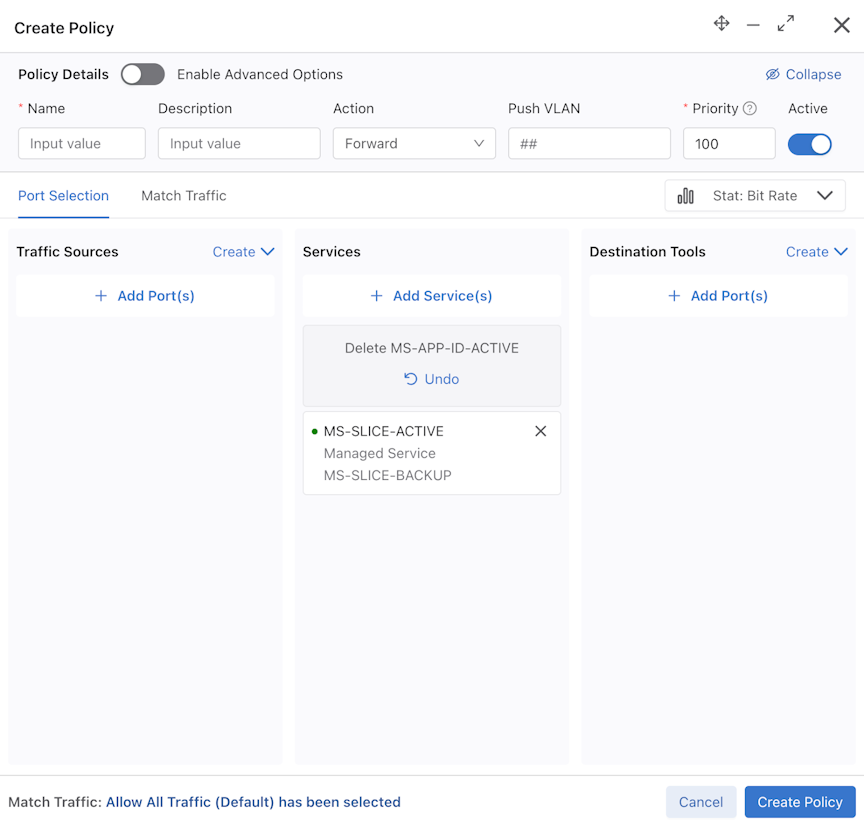
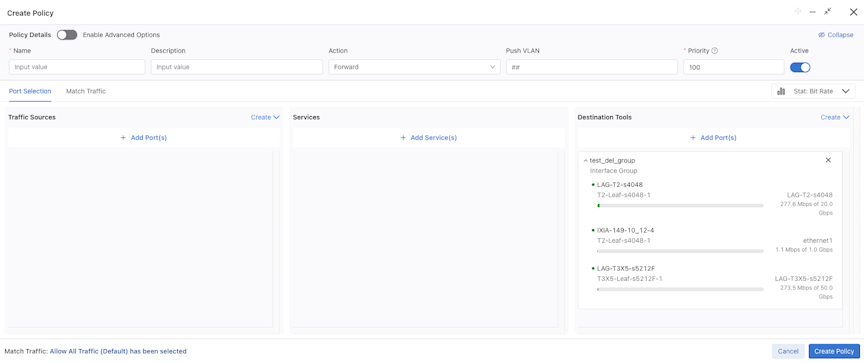
Policy Details
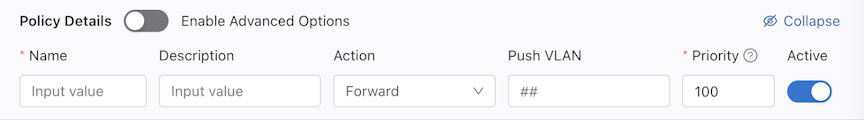
Enter the primary information for the policy:
- Policy Name (must be unique)
- Description
- Policy Action: Capture, Drop, Forward (default)
Note: The Destination Tools column is not available when Drop and Capture actions are selected.
- Push VLAN
- Priority: By default, set to 100 if no value is specified.
- Active: By default, set to enabled.
- Advanced Options: By default, disabled.
When Advanced Options is enabled, the following configuration settings are available:

- Scheduling: There are four options:
- Automatic: The policy runs indefinitely.
- Now: The policy starts running immediately; use Run Time to determine when the policy should stop.
- Set Time: Set a specific date and time to start the policy.
Figure 60. Scheduling 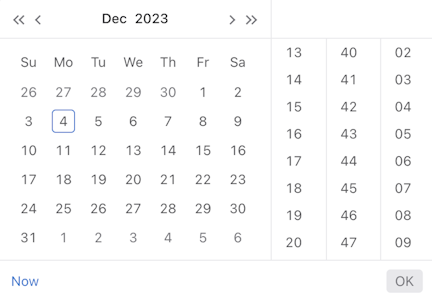
- Set Delay: Start the policy using relative time options.
Figure 61. Set Delay 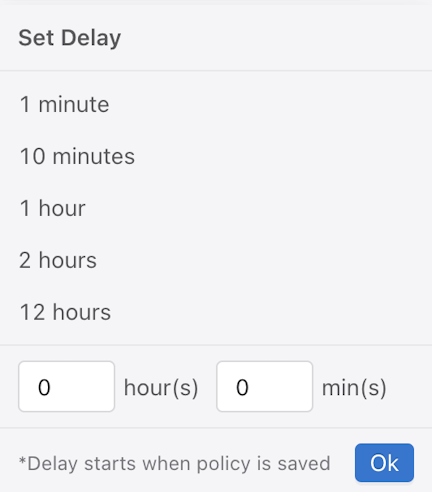
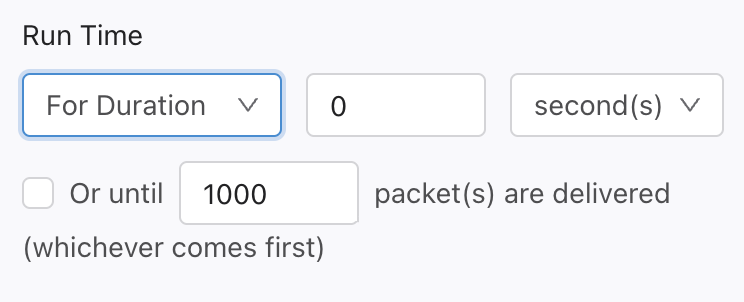
- Run Time: There are two options:
- Always: (default).
- For Duration: Selecting For Duration allows using Time Input to set the time number and the Unit selector to set the time unit. Select the checkbox to use Packet Input and enter the required packet number (1000, by default).
- PTP Timestamping: Disabled by default.
- Root Switch: By default, set to a locked state. Select the lock icon to unlock and select a root switch.
Additional Controls

- Collapse and Show: Visually hide or unhide the basic policy configurations to manage the view of the other configuration fields.
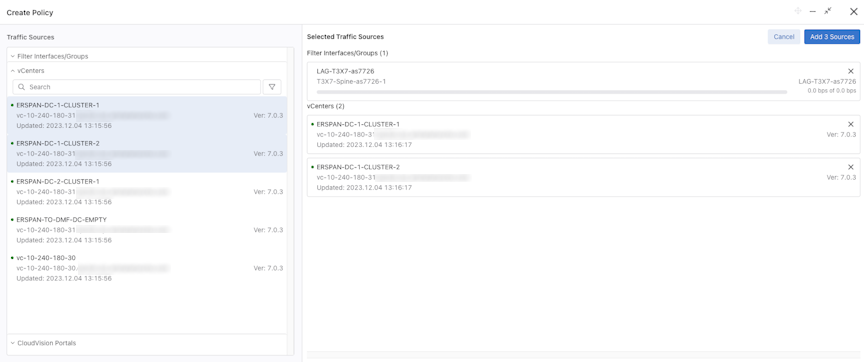
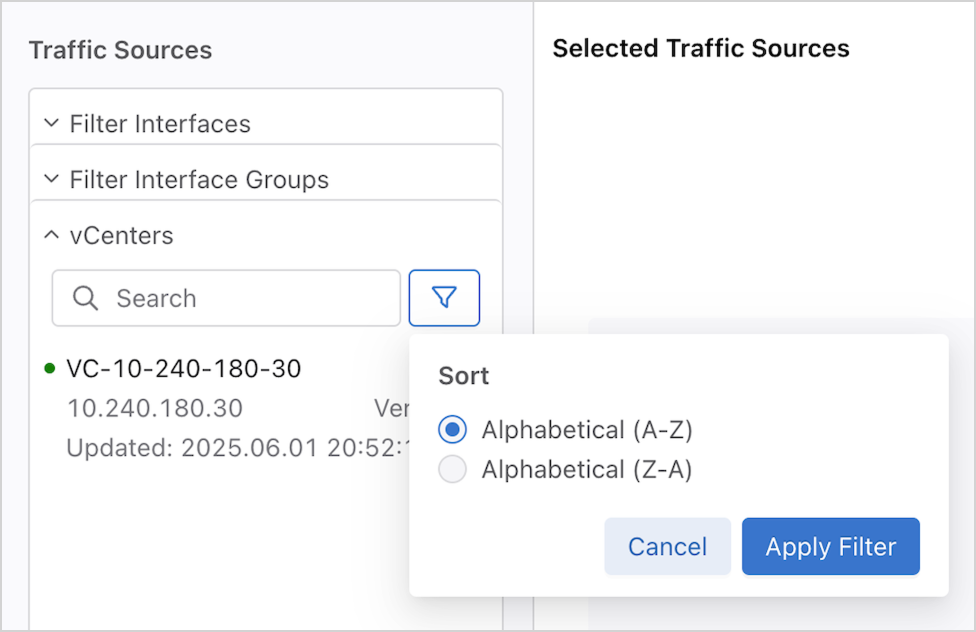
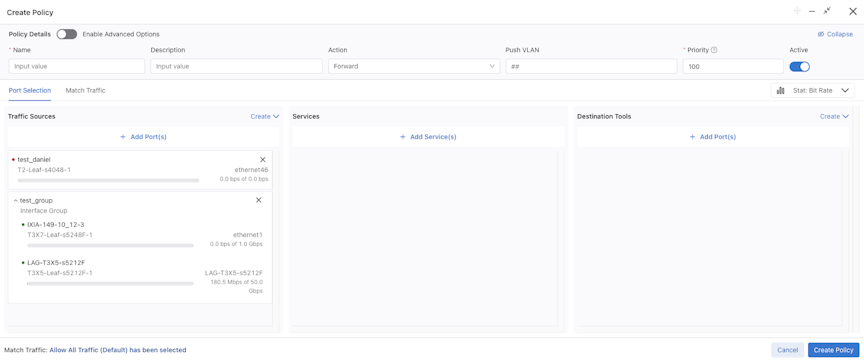
Traffic Sources
The Traffic Sources column displays the associated traffic sources in the policy.

Search for interfaces using the search bar and the available information in the interface tiles. Selecting the ![]() icon reveals sorting and filtering options using Display Data, which includes:
icon reveals sorting and filtering options using Display Data, which includes:
- Sort - By default, DMF sorts the data in descending Bit Rate order. Optionally, sort the data by ascending Bit Rate order or alphabetically.
- Bit Rate (default), Utilization percentage, or Packet Rate
- Switch Name
- Interface Name(s)
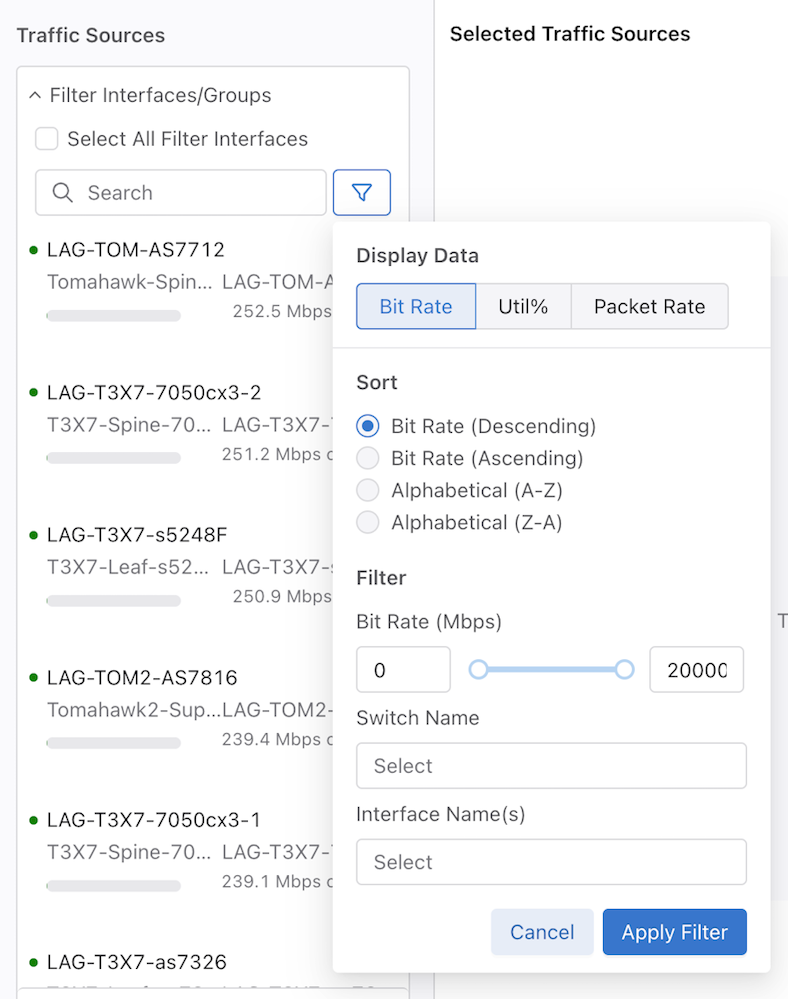
DMF sorts Interface Groups, vCenters, NSX, and CloudVision Portals alphabetically (A-Z, by default).
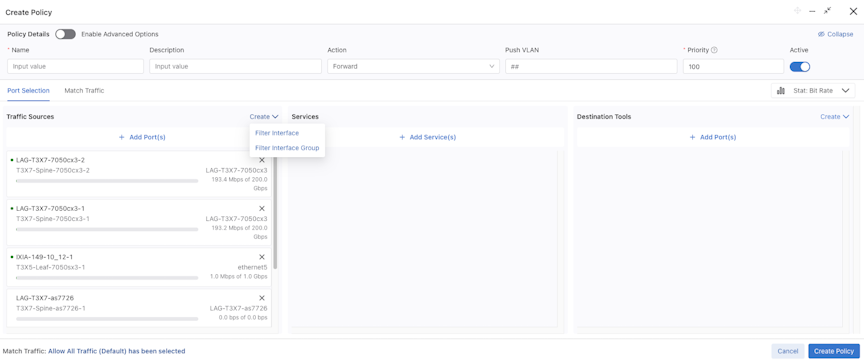
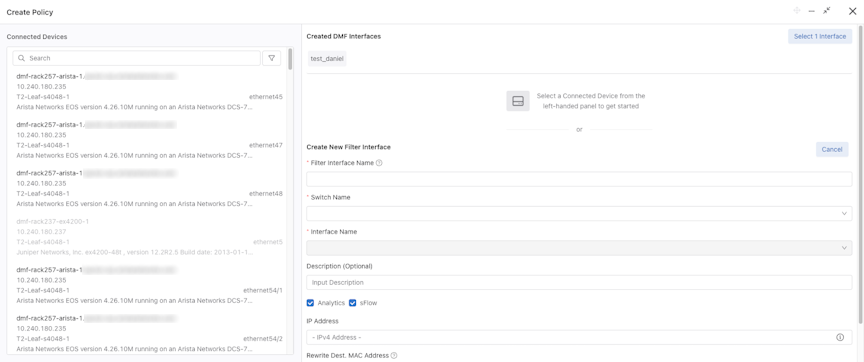
When a Filter Interface has not been created yet, Create has two selections: Create Filter Interfaces and Filter Interface Groups.
Selecting Create Filter Interface opens a form to configure a Filter Interface. Enter the required settings to configure the new Filter Interface.
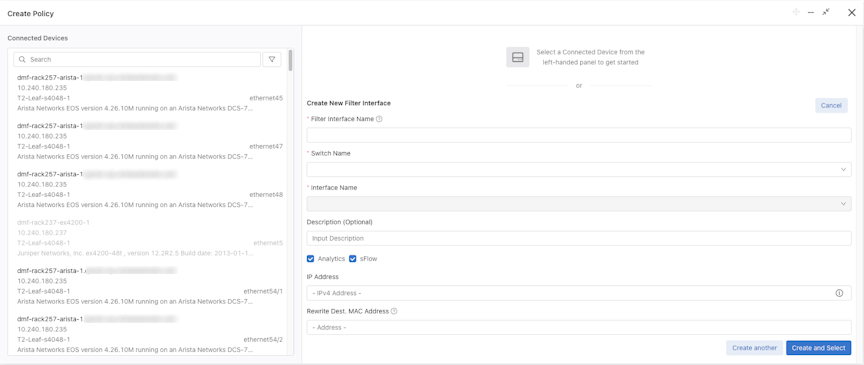
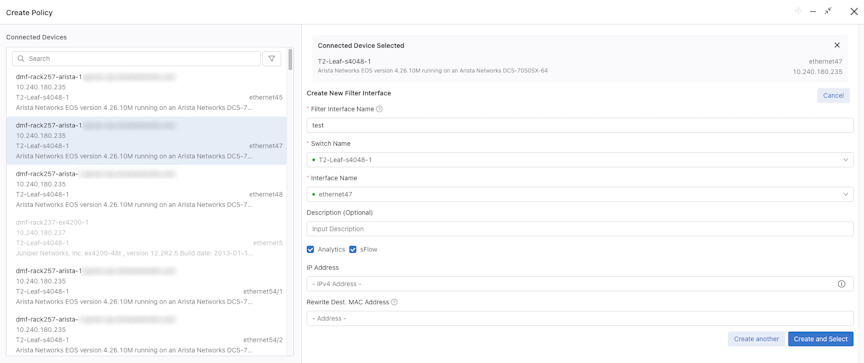
Alternatively, the left column allows the selection of an existing connected device to pre-populate the Switch Name and Interface Name fields and to configure a Filter Interface based on a connected device. Select Create and Select to create the Filter Interface and associate it with the current policy.
To create multiple Filter Interface(s), select Create another to create an interface using the current configuration. This action clears the form to allow the creation of an additional Filter Interface.
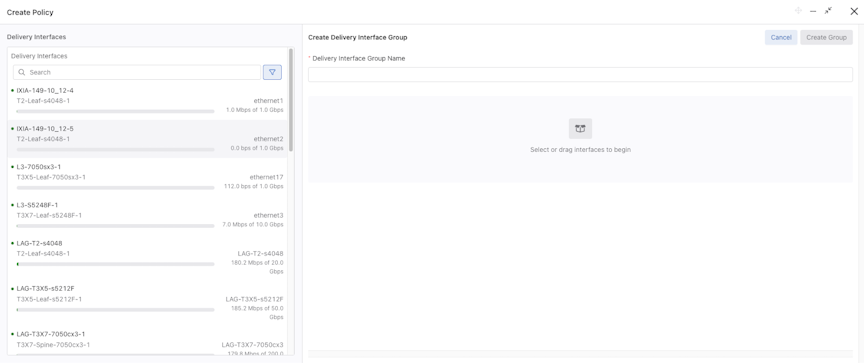
Select Create Filter Interface Group to create a group of filter interfaces.
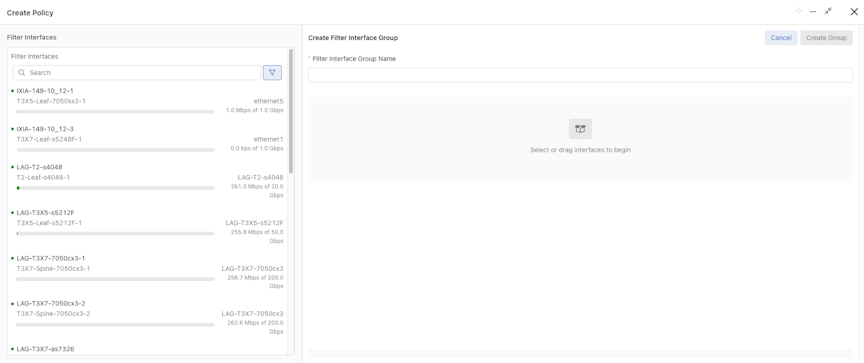
Select one or more filter interfaces to create a Filter Interface Group.
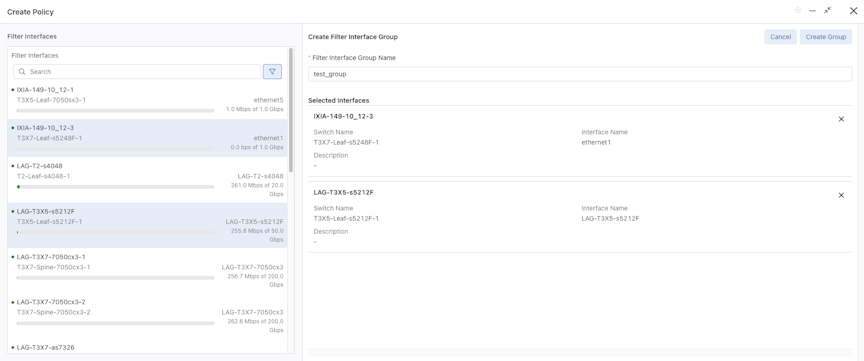
Select Create Group to create the Filter Interface Group and associate the group with the current policy.
Expand the group tile to view interfaces within an Interface Group.
CloudVision Portals
The Create Policy window lists CloudVision Portals connected to DMF and includes the CloudVision Portal name, the portal hostname, and the current software version. Select a card to add a CloudVision Port Mirroring Table. The card displays similar information and the default Tunnel Endpoint.
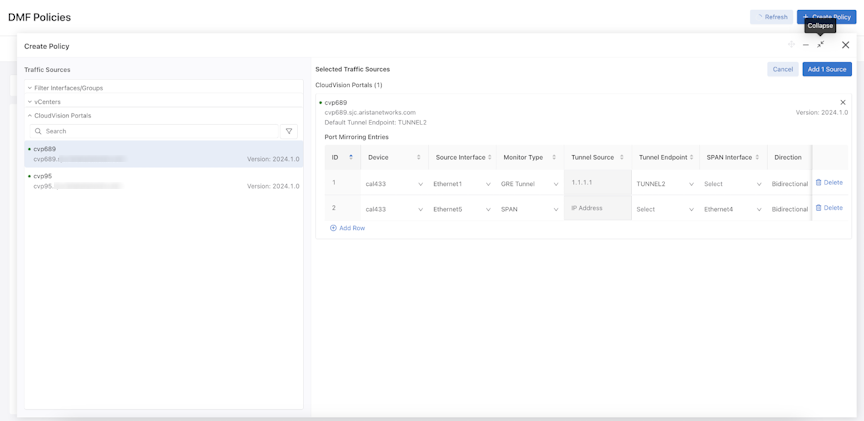
An empty port mirroring table initializes to add rows to the table for configuring port mirroring sessions.
Use the following guidelines to configure a port mirroring session:
- Each row must contain a Device and Source Interface. This interface in the CloudVision production network will mirror traffic to DMF.
- Each interface must select a Monitor Type: GRE Tunnel or SPAN.
Note: SPAN requires a physical connection from the CloudVision Portal to DMF. The default value for Tunnel Endpoint is the CloudVision Portal’s Default Tunnel Endpoint.
- Each device must have the same Tunnel Endpoint and Tunnel Source values across the policies. Each interface on a device must have an identical destination configuration (GRE Tunnel, GRE Tunnel Source, and SPAN Interface) across the policies.
- The default traffic direction is Bidirectional but configurable to Ingress or Egress.
- After configuring the Port Mirroring Table, select Add Sources to return to the Main Page of the Create Policy configuration page.
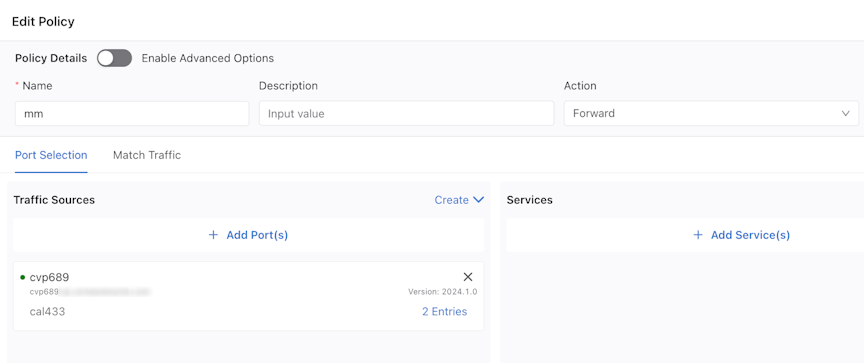
After configuring Port Mirroring, the card appears in the Traffic Sources section. To edit the Port Mirroring Table, select the X Entries link.
Services
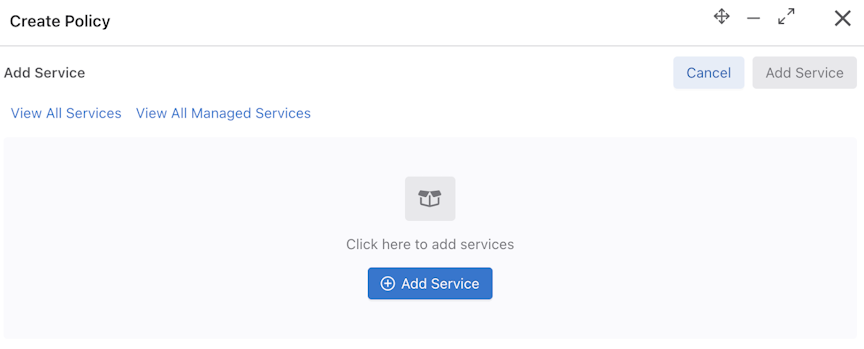
The Services column displays the Services and Managed Services associated with the policy. Add Service(s) opens a new page to specify additional services.
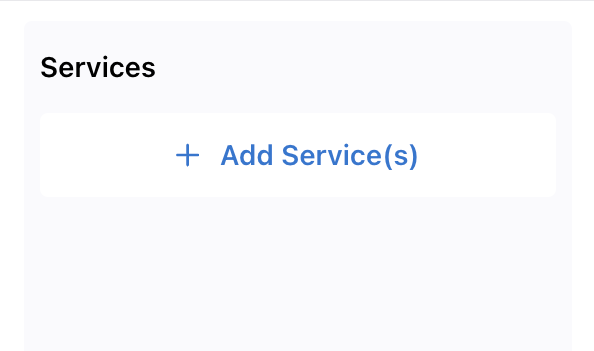
View All Services and View All Managed Services open the DMF Services and Managed Services pages, respectively. Add Service opens a configuration panel to specify Service information. If there are Services associated with this policy, they are listed and available to edit.
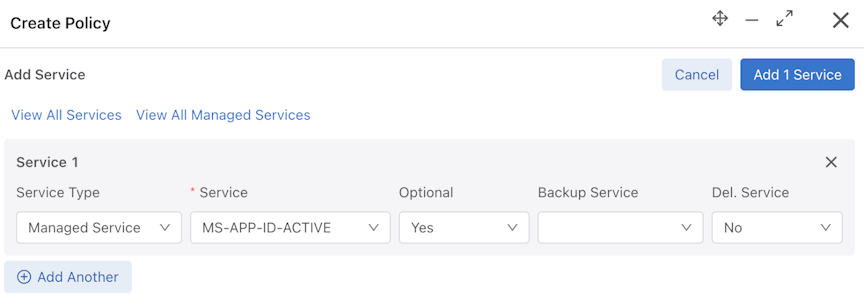
For each Service, specify:
- Service Type: Managed or Unmanaged.
- Service: Name of the Service (required).
- Optional: Whether the Service is optional.
- Backup Service: Name of the backup Service.
- Del. Service: If the Managed Service type is selected, whether to use it as a Delivery Service.
Select Add Another to populate a new row to add another Service. Add (n) Services associates the Services with the policy.
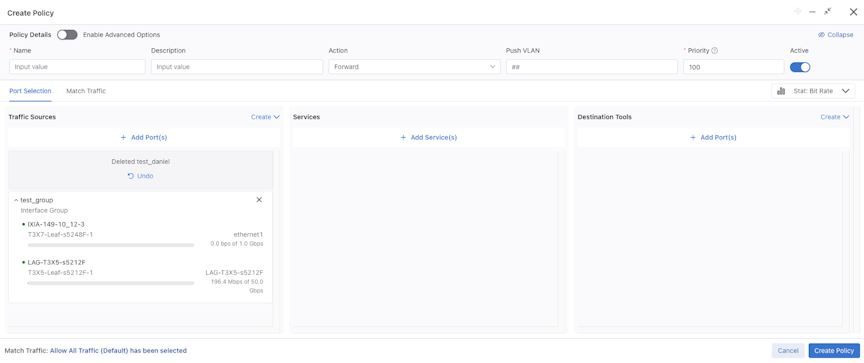
After adding the services, they appear in the Services column. Select the x icon on the Service tile to disassociate the Service from the policy. While remaining on the page, if required, re-associate the Service by selecting Undo.
Destination Tools
The Destination Tools column displays the associated Destination Tool ports to a given policy.

Use Add Port(s) to add more destinations. The configuration page allows adding Delivery Interfaces, Delivery Interface Groups, or Recorder Node Fabric Interfaces.
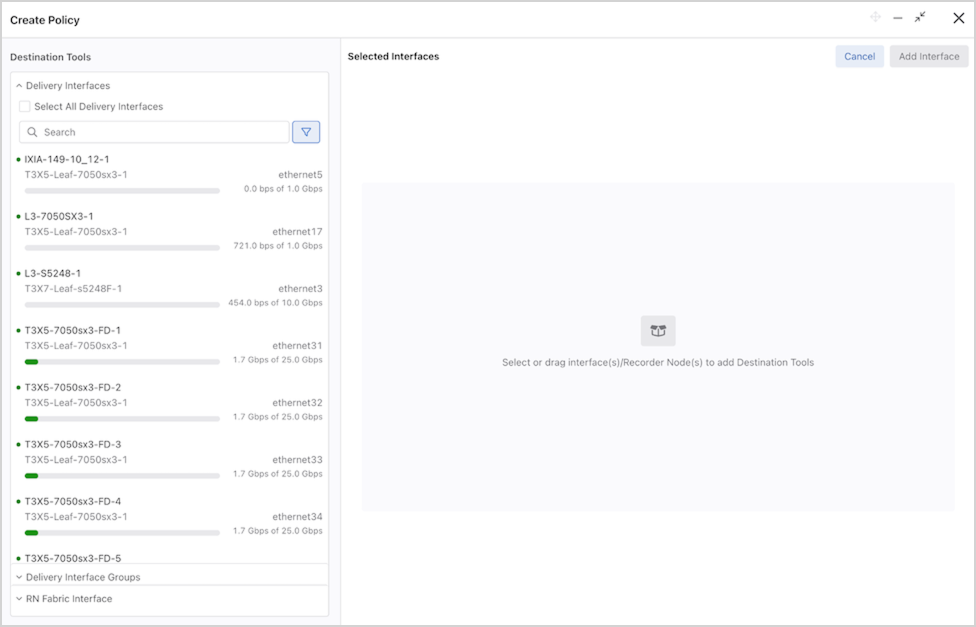
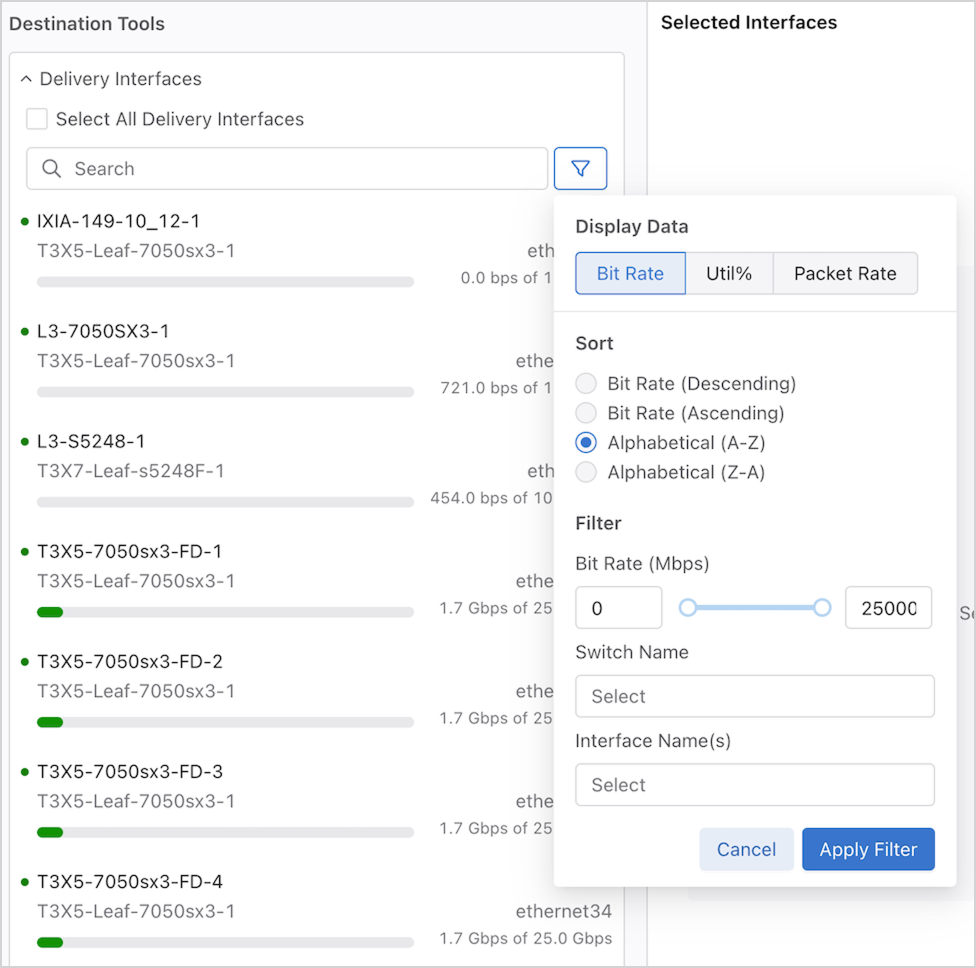
Interfaces can be searched by the available information in the interface tiles using the search bar. Selecting the ![]() icon reveals sorting and filtering options using Display Data, which includes:
icon reveals sorting and filtering options using Display Data, which includes:
Sort - By default, DMF sorts the data in descending Bit Rate order. Optionally, sort the data by ascending Bit Rate order or alphabetically.
Bit Rate (default), Utilization percentage, or Packet Rate
Switch Name
Interface Name(s)
Sort Interface Groups alphabetically (A-Z, by default).
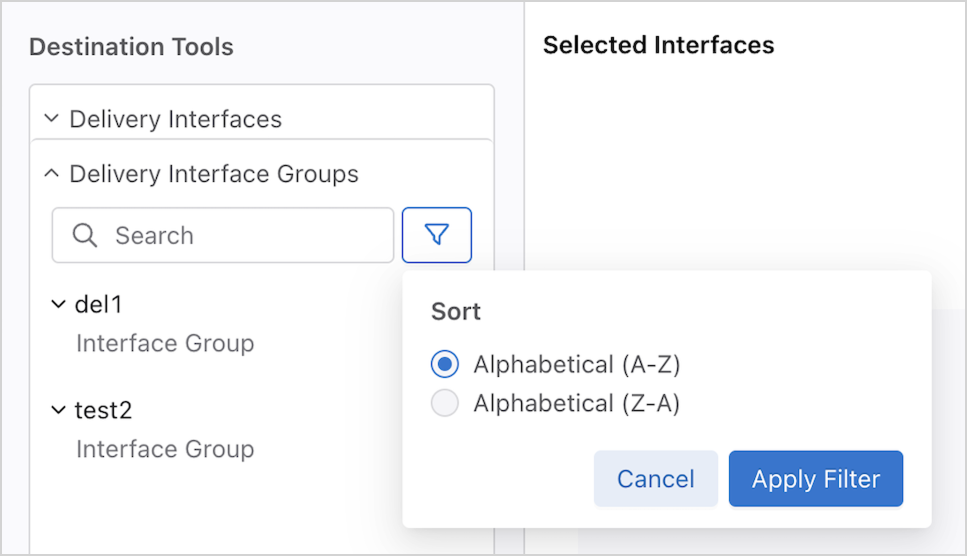
Sort Recorder Node Fabric Interfaces alphabetically (A-Z, by default) and filter by Bit Rate.

Suppose there is still a need to create Destinations (Delivery Interfaces). In that case, Create has two selections: Create Delivery Interfaces and Delivery Interface Groups.
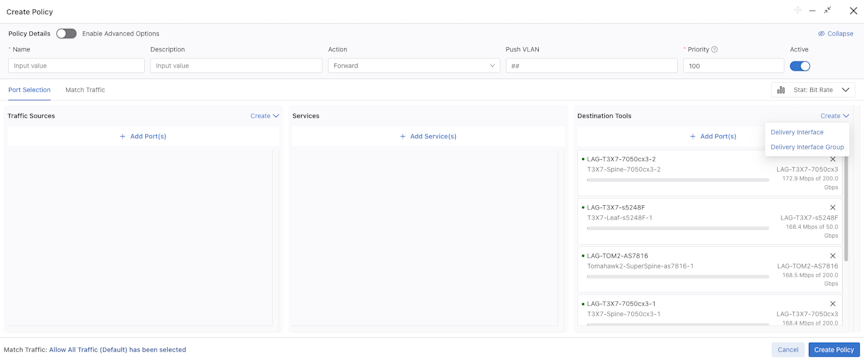
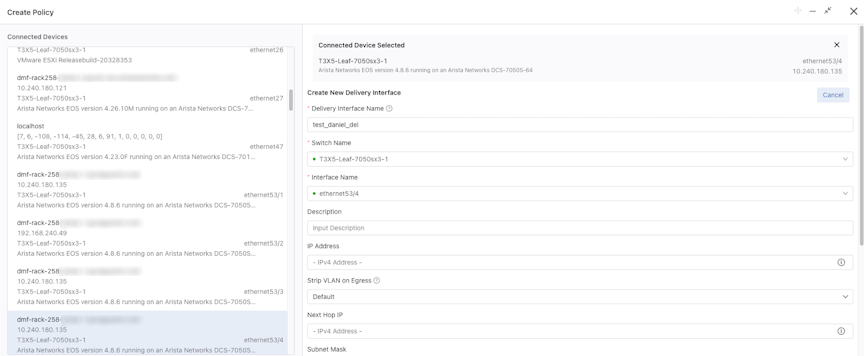
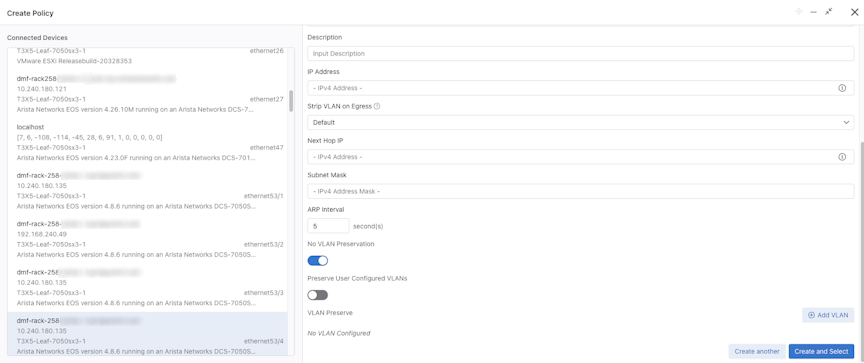
Selecting Delivery Interface opens a form to configure a Delivery Interface. Enter the required settings to configure the new Delivery Interface.
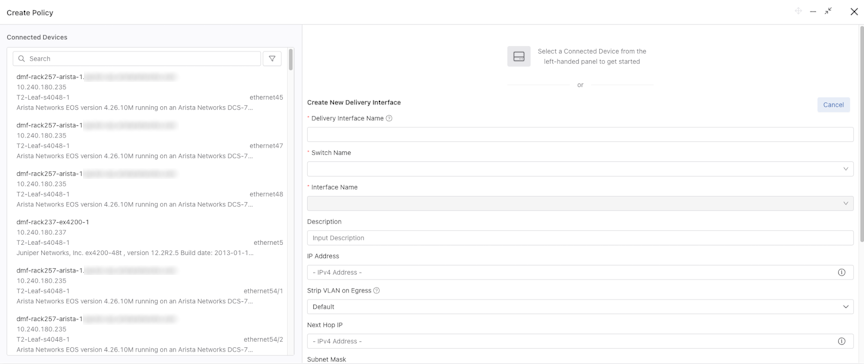
Alternatively, the left column allows the selection of an existing connected device to pre-populate the Switch Name and Interface Name fields and to configure a Delivery Interface based on a connected device. Select Create and Select to create the Delivery Interface and associate it with the current policy.
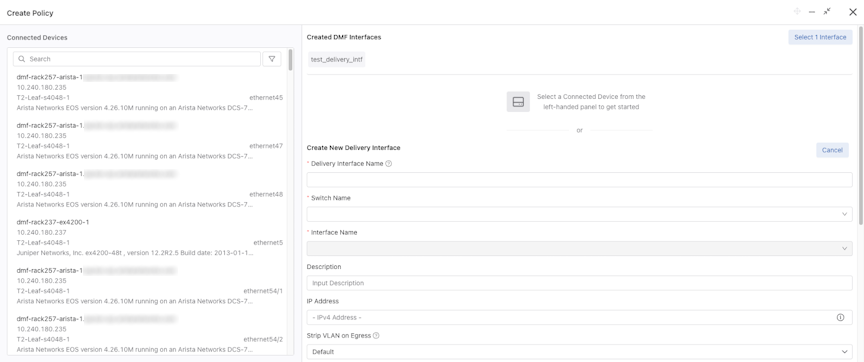
To create multiple Delivery Interfaces, select Create another to create an interface using the current configuration. This action clears the form to allow the creation of an additional Delivery Interface.
Select (n) interface associates all created Delivery Interfaces to the current policy.
Select Create Delivery Interface Group to create a group of delivery interfaces.
Select one or more delivery interfaces to create a Delivery Interface Group.
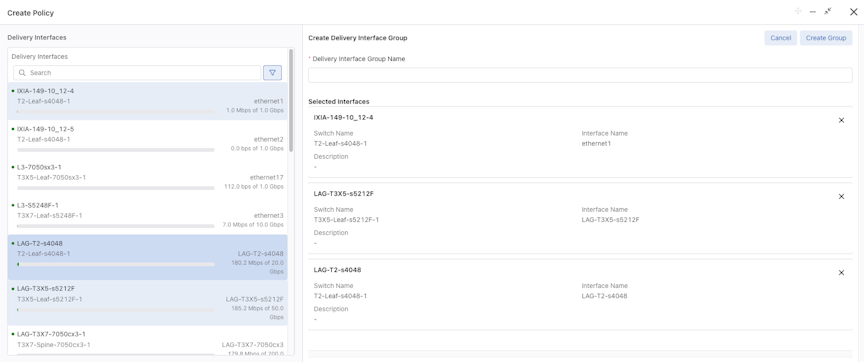
Select Create Group to create the Delivery Interface Group and associate the group with the current policy.

Expand the group tile to view interfaces within an Interface Group.
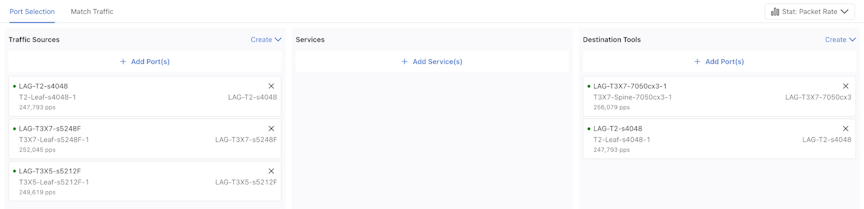
Stat Picker
Use the Stat: Packet Rate drop-down to select view specific data for the associated interfaces.
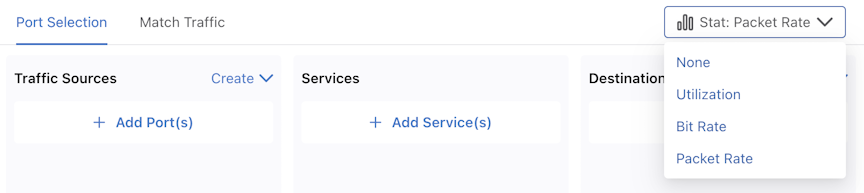
The data options are:
Utilization
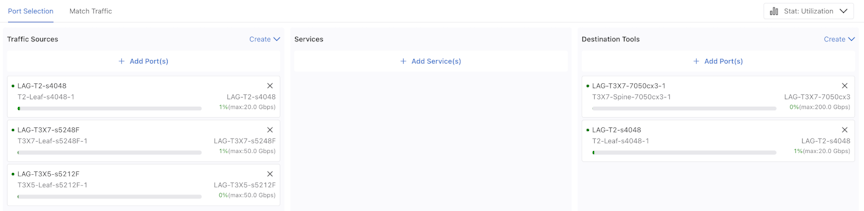
Bit Rate (default)
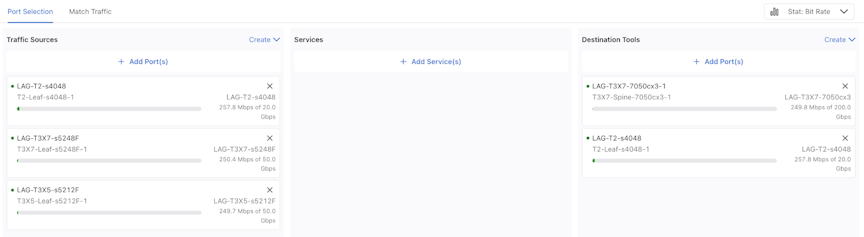
Packet Rate
Match Traffic and Match Traffic Rules
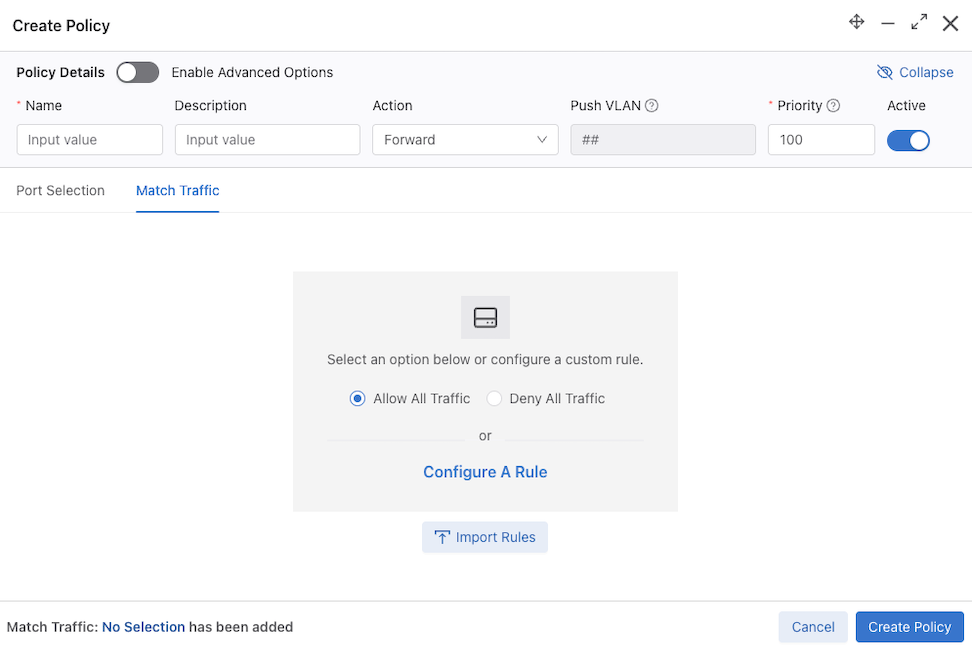
Match Traffic
Use the Match Traffic tab to configure rules for the current policy.
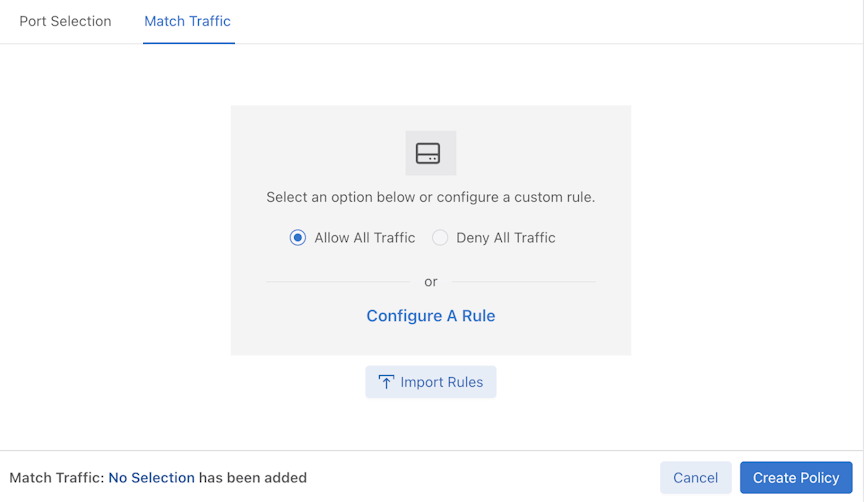
There are four options to configure traffic rules.
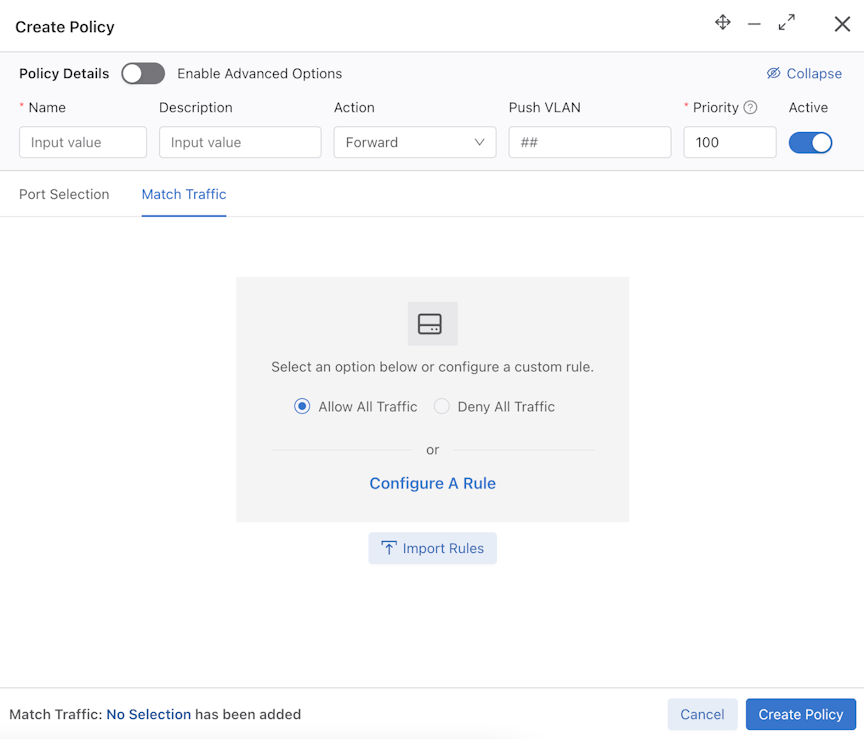
Select the Allow All Traffic or Deny All Traffic radio button to quickly configure a rule for all traffic.
Navigate to the Rule Details configuration panel using Configure A Rule. Refer to the Custom Rule, Match Rule Shortcut, and Match Rule Group sections for more information.
Import Rules opens the import rule configuration dialog and supports importing .txt files using drag and drop or Browse.
Example Text File
1 match ip
2 match tcp
3 match tcp src-port 80
4 match tcp dst-port 25
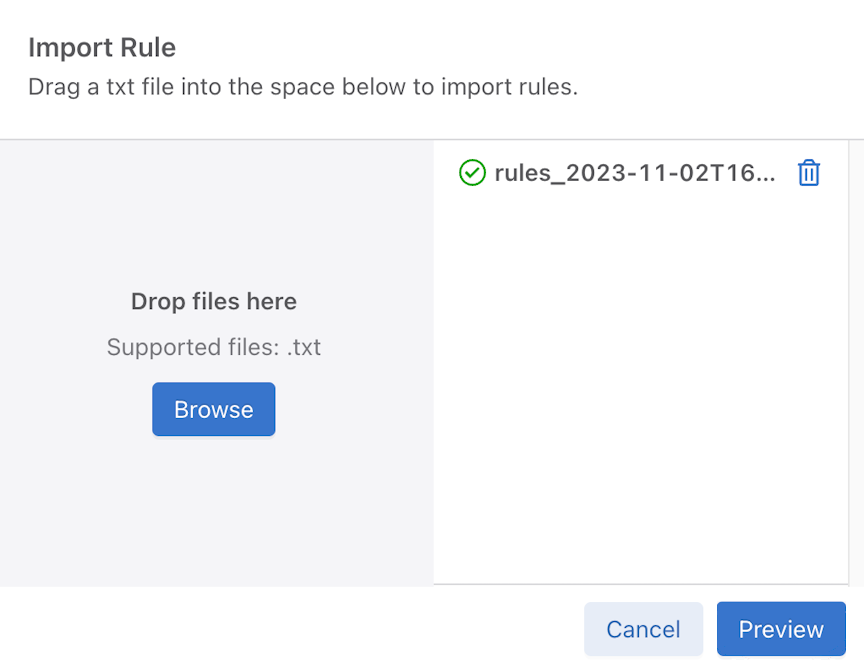
Select Preview to verify the import result.
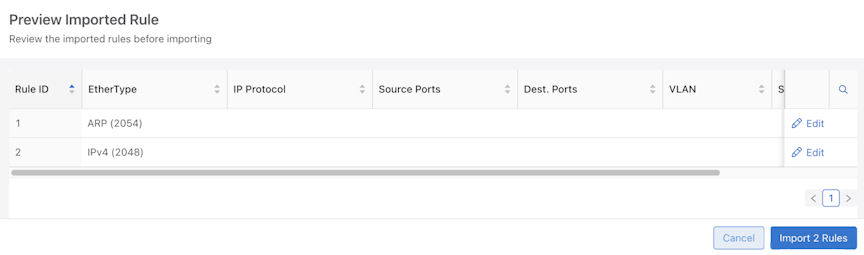
While using the Preview Imported Rule table, select Edit to open the Edit Rule configuration panel.
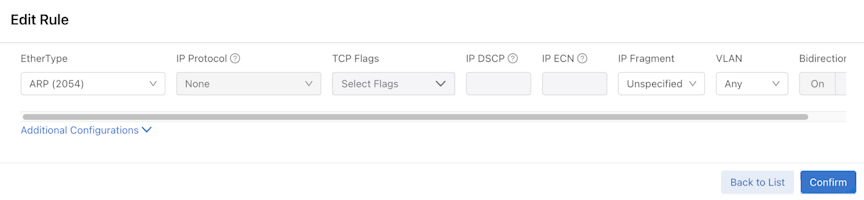
Select Confirm when finished, and use Import x Rules to import the rules.
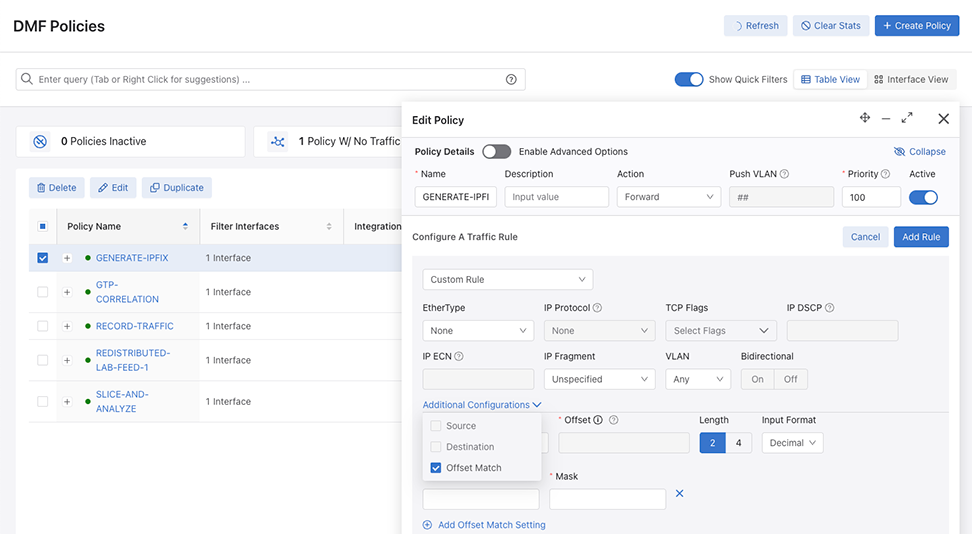
Custom Rule
Select Configure a Rule to open the Configure A Traffic Rule window.
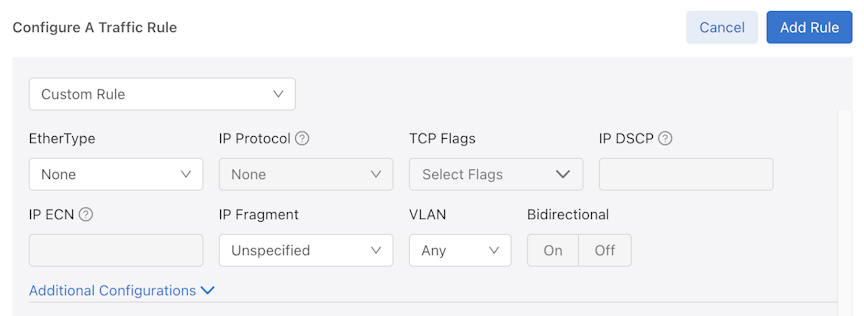
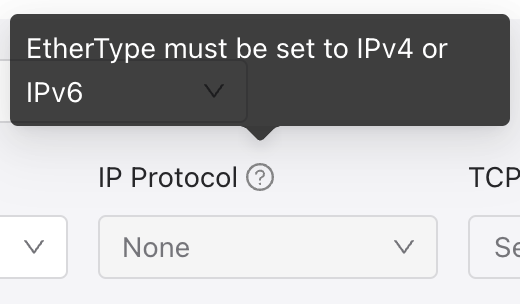
By default, the configuration method is Custom Rule with several fields disabled by default; hover over the question mark icon for more information on enabling an input field.
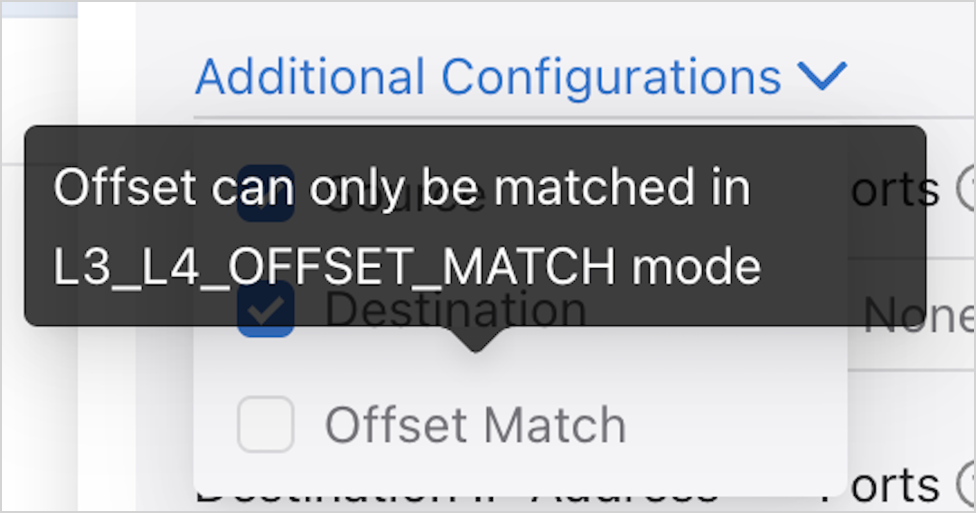
Specific EtherTypes will open an Additional Configurations panel.
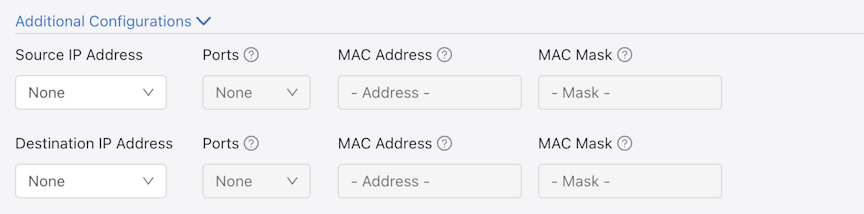
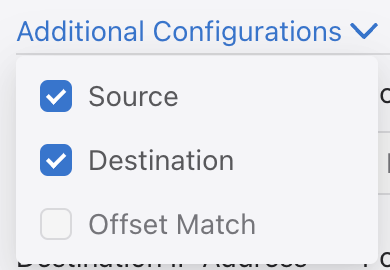
Select the drop-down icon to display additional configurations (Source, Destination, Offset Match). Hovering over Offset Match allows viewing requirements to enable the Offset Match.
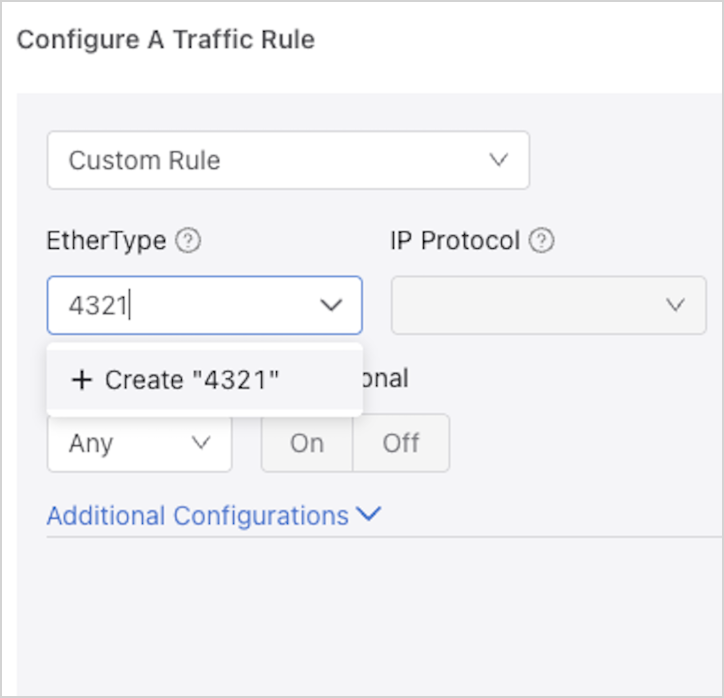
Custom EtherTypes
By default, the EtherType lists all known EtherType names and their hexadecimal values. DMF 8.8.0 allows custom EtherType input. The accepted input types are numbers in decimal or hexadecimal format with values greater than 1535 and less than or equal to 65535. Begin by typing the value in the EtherType input field.
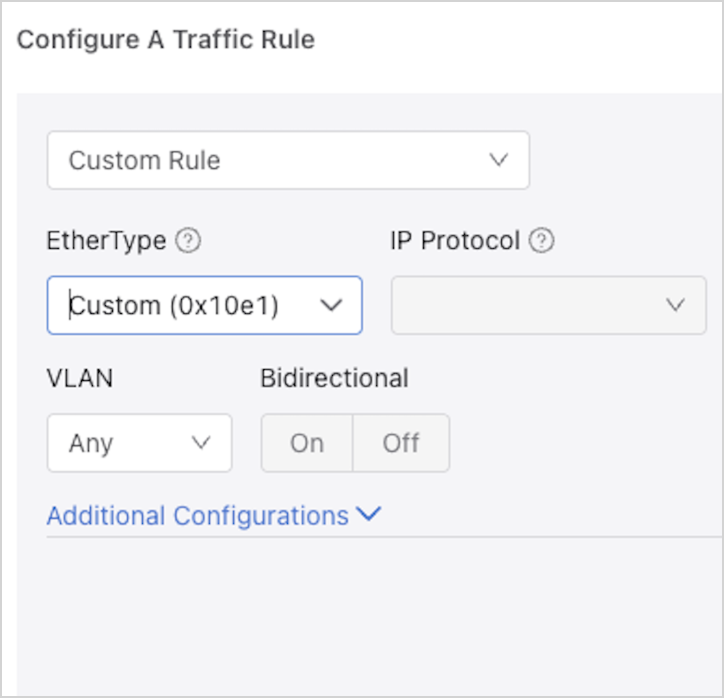
- Only 1 EtherType can be defined for a rule.
- Creating an EtherType for a rule does not save it as a Select option for other rules. You must recreate custom rules each time they are to be used.
- EtherType must be in decimal or hexadecimal format (denoted with the prefix “0x”).
- EtherType must be greater than 1535 and less than or equal to 65535. Otherwise, the system displays the following error message:
Figure 113. Custom EtherType Error Message 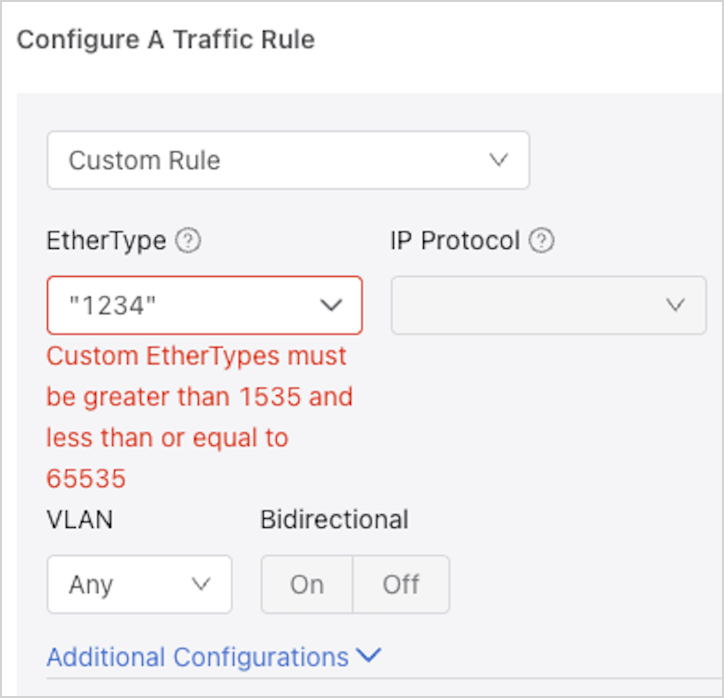
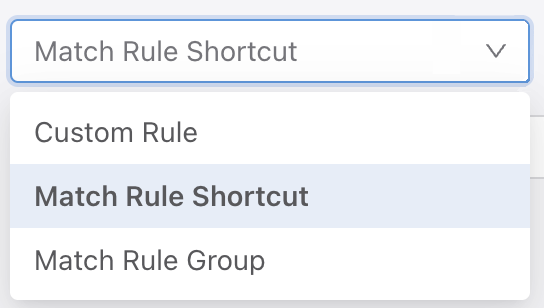
Match Rule Shortcut
To access the Match Rule Shortcut, select the drop-down icon and choose Match Rule Shortcut.
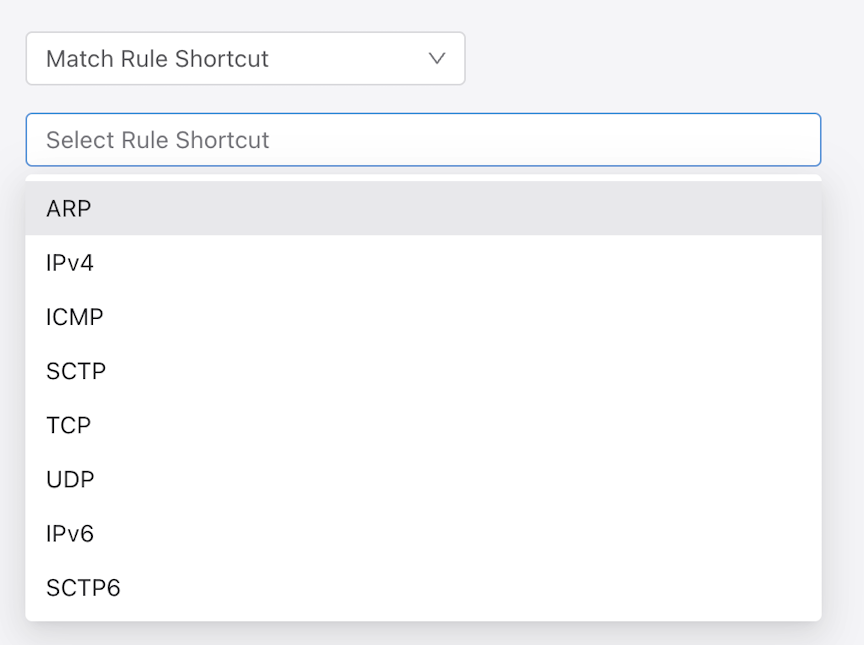
Select the Select Rule Shortcut selector and choose the required shortcut rules (supports multi-selection).
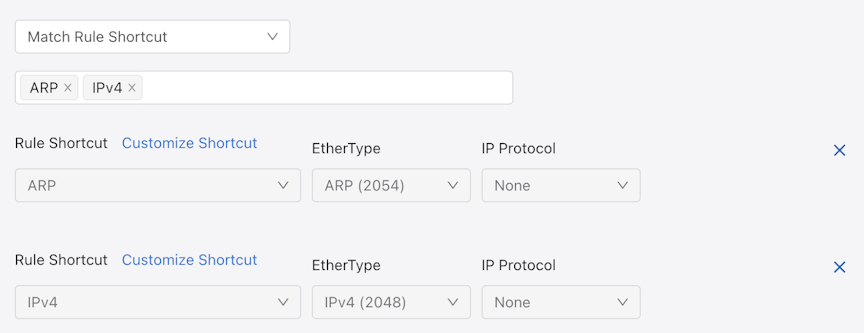
After selecting the rule shortcut:
- All selected rules appear as a card in the selector.
- Delete selected rules using the x icons.
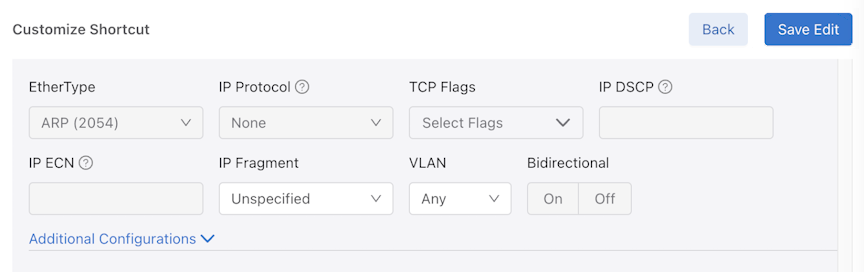
- Select Customize Shortcut to edit a rule shortcut.
After editing, select Save Edit to return to the Match Rule Shortcut view.
After configuring the shortcut rules, select Add (n) Rules to finish the configuration.
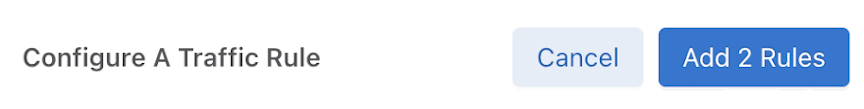
Match Rule Group
To access the Match Rule Group, select the drop-down and choose Match Rule Group.
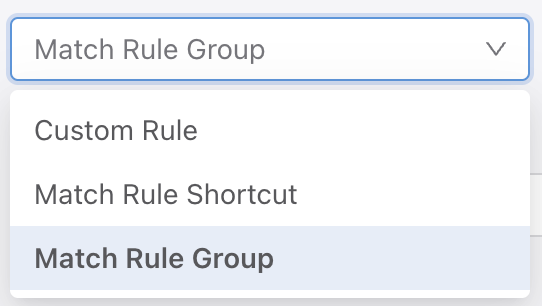
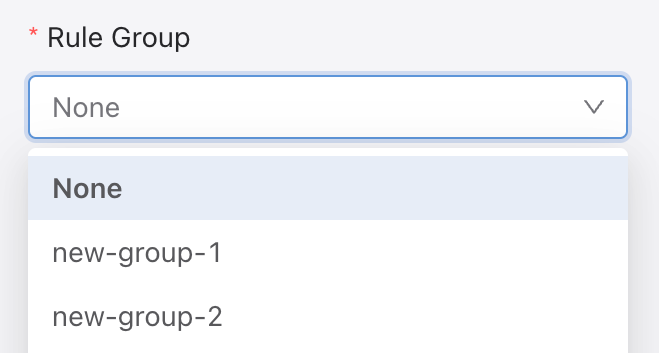
To select a rule group, select the drop-down under Rule Group. All rule groups appear in the menu. Select one. There is no multi-select available. Repeat the Match Rule Group steps to add more than one rule group.
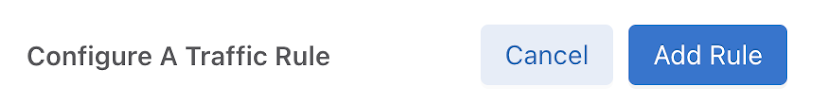
After configuring the rule group, select Add Rule to finish the configuration.
Rules Table
All configured rules appear in the Rules Table.
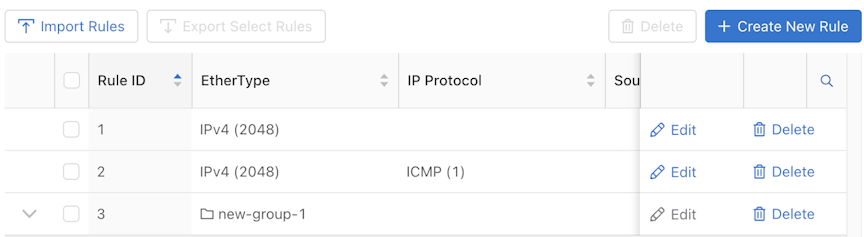
- Import Rules
Figure 122. Import Rules 
- Similar in function to Import Rules on the start page. Refer to Start Page -> Import Rules for more information.
- Export Select Rules
Figure 123. Export Select Rules 
- Disabled by default when no rule is selected.
- Enabled when one or more than one rule is selected.
- Select to export selected rules information as a
.txtfile.
- Delete
Figure 124. Delete 
- Disabled by default when no rule is selected.
- Enabled when one or more than one rule is selected.
- Select to delete the selected rules.
- Create New Rule and Create Rule Group buttons
Figure 125. Create New Rule / Create Rule Group 

- The control appears as Create New Rule when no rule is selected. Select to open the Create New Rule screen.
- When one or more rules are selected, the control changes to Create Rule Group. Select to open the Create Rule Group screen.
Figure 126. Create Rule Group 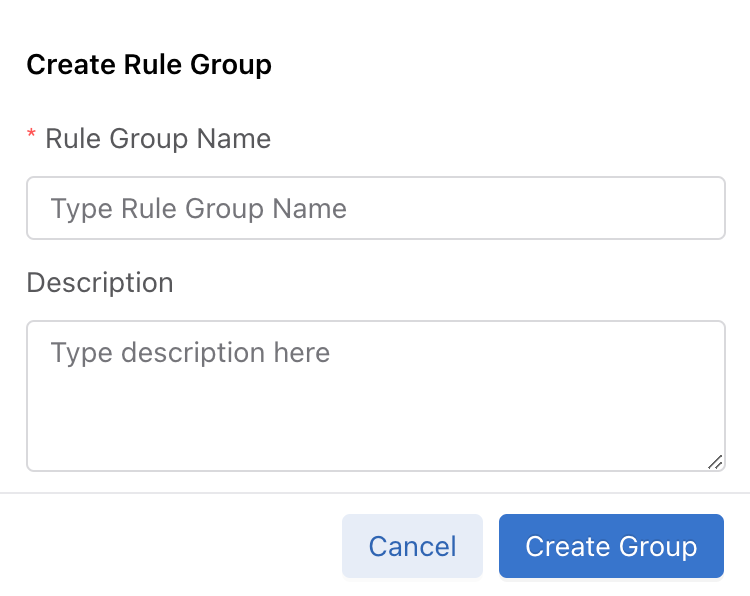
- Table Actions
Figure 127. Edit / Delete 
- Select Edit to edit the rule view.
- Select Delete to delete the rule.
- Table Search
Figure 128. Table Search 
- The Rules Table supports search functionality. Select the magnifying glass icon to activate the search input fields and search the results by the context of each column.
- Checkbox
Figure 129. Checkbox 
- Check the box to select a rule and use the function buttons described above.
- Expandable Group Rules
- Group Rules in the Rule Table display as the group's name with an expand icon.
Figure 130. Expand 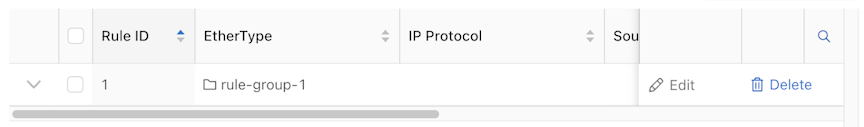
- Select the expand icon to see the rules included in the group.
Figure 131. Expanded Column 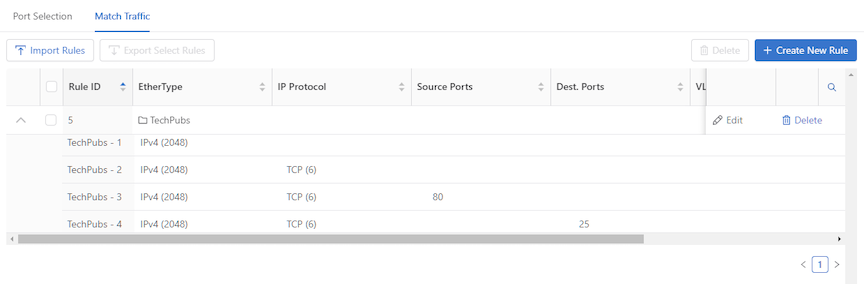
- Group Rules in the Rule Table display as the group's name with an expand icon.
Persist UDF Input Format
The DMF 8.7 Controller remembers the original User Defined Field (UDF) input format across clients. After configuring UDF, the input reflects the original input format, supporting cross-client consistency.
- 32-bit hex string prefixed with 0x
- 32-bit unsigned integer
- Dotted Quad IPv4 address string
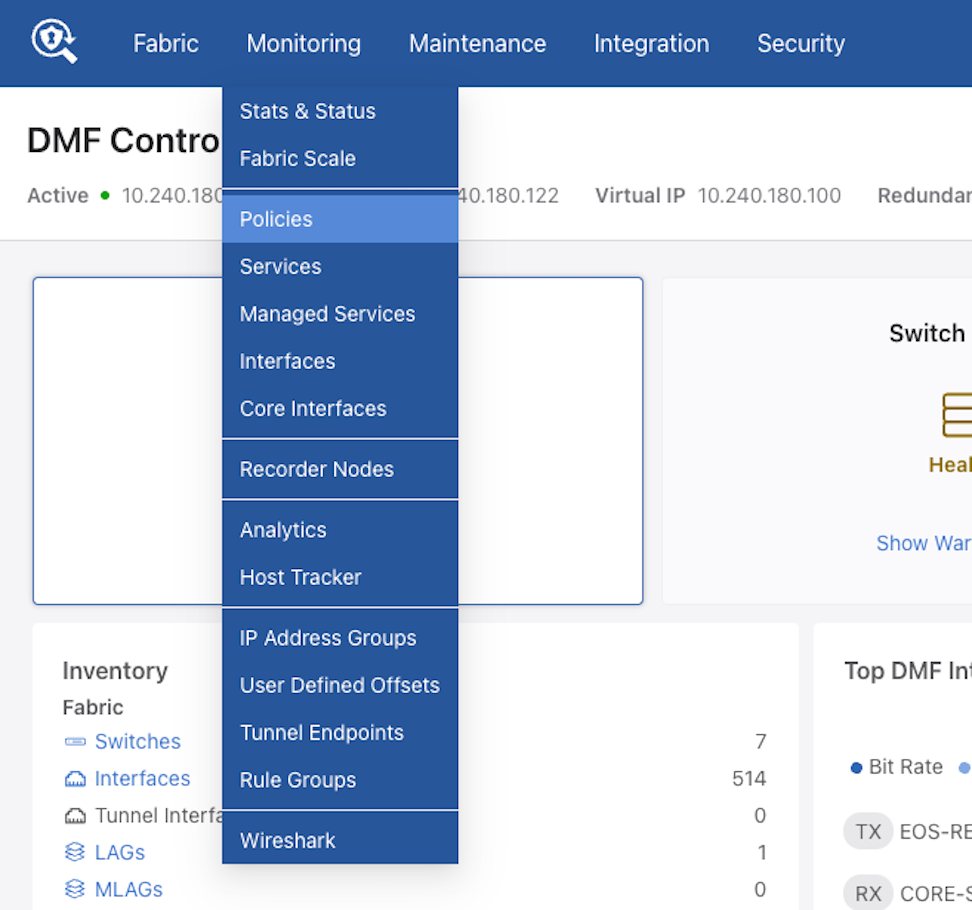
Navigate to .
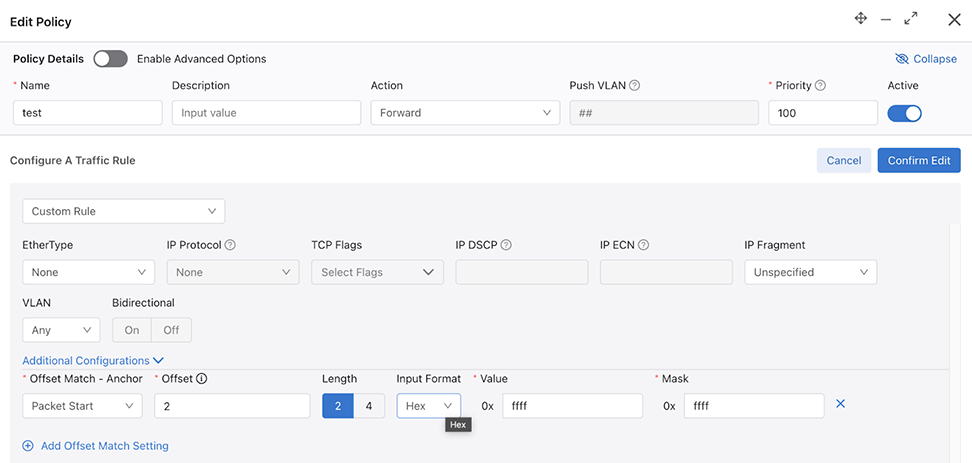
The workflow is contained in the Create or Edit Policy configuration under the Match Traffic tab.
Enable Offset Match using the checkbox (if required). While configuring an Offset Match attribute in a new rule or editing an existing rule, select the Input Format input and enter the Value and Mask inputs in the appropriate format.
Select Add Rule or Confirm Edit to save the rule.
Use Create Policy or Save Policy to save the policy configuration.
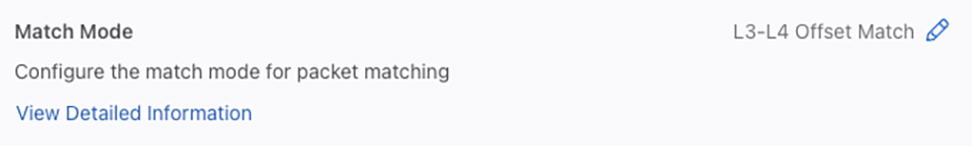
During subsequent editing of the rule of the policy, DMF preserves and populates the Input Format, Value, and Mask inputs with the previously saved values.
Refer to the CLI show commands to view the offset matches.
Considerations
- DMF supports only the three UDF input patterns described earlier.
- The optimized UDFMatch contains value/mask in the user-configured format, but the value/mask of the UDFMatch may not match the configured value/mask. The Controller reports the actual internal value/mask in the form that the user configured.
Multi-vCenter VM Support in Single Policy
The Multi-vCenter VM Support in Single Policy feature enhances scalability and configuration management by allowing the inclusion of Virtual Machines (VMs) from multiple vCenters within a single policy. DMF supports configuring match rules to include multiple VMs across disparate vCenters, unifying policy application and reducing configuration overhead. Whereas, in prior releases, integrating a large number of vCenters with a single DMF fabric required a separate policy for each instance.
DMF User Interface Configuration
Navigate to .
Select Create Policy.
Select Match Traffic followed by Configure A Rule.
EtherTypes, such as IPv4 or IPv6, require source or destination IP addresses.
Selecting Virtual Machine as the type populates the VM name drop-down menu with every virtual machine associated with vCenter and Nutanix instances.
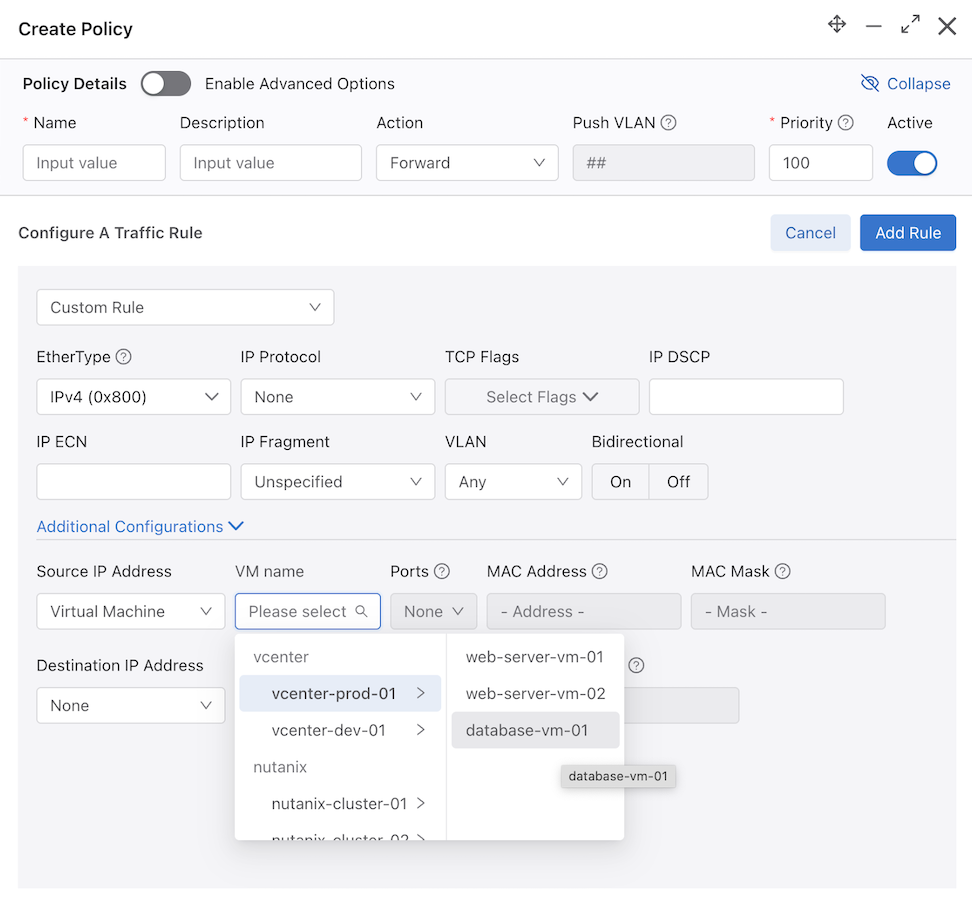
Both menus support text-based searches by vCenter or VM name.
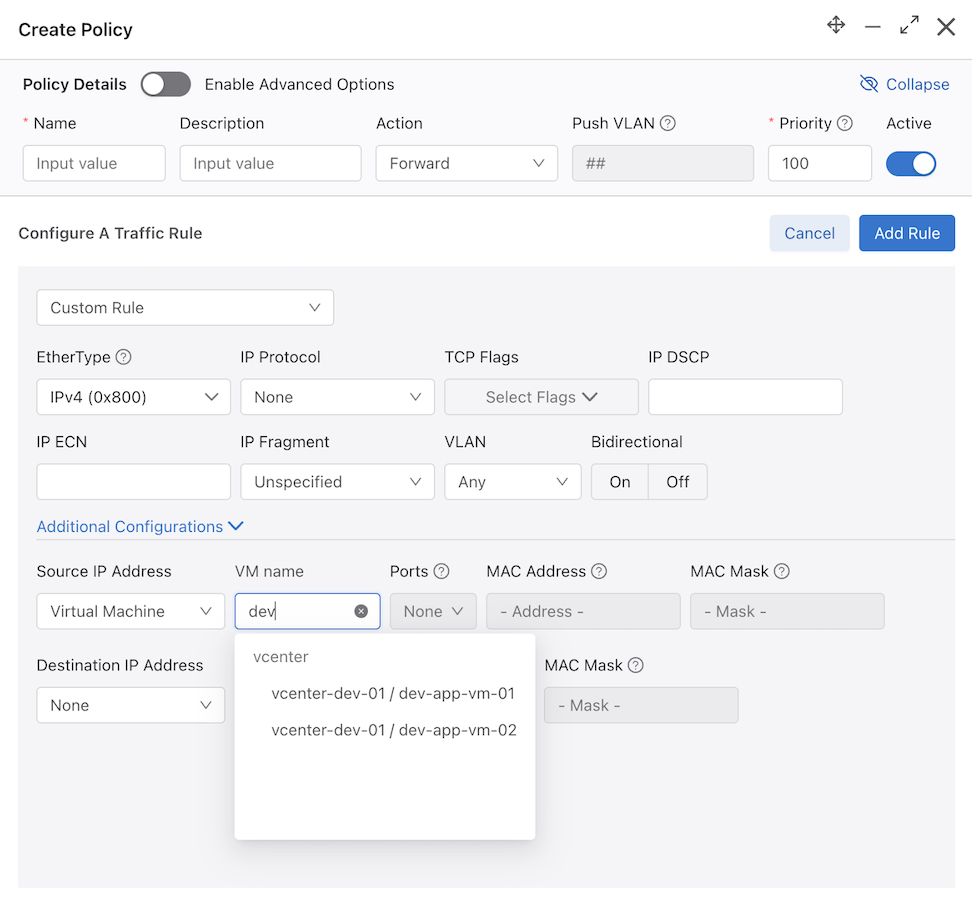
If the expected vCenters are not visible refer to the Troubleshooting section for more information.
Using the Packet Capture Action in a Policy
To enable this feature, connect one of the DMF Controller hardware interfaces to a fabric switch interface defined as a DMF delivery interface.
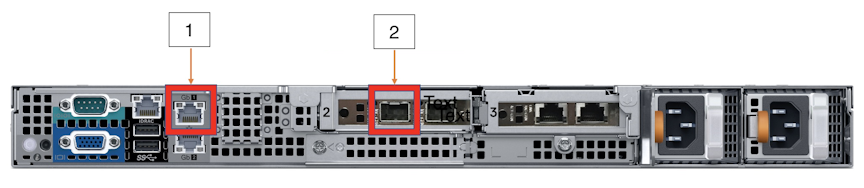
| 1 | 1G Management Port | 2 | DMF Packet Capture |
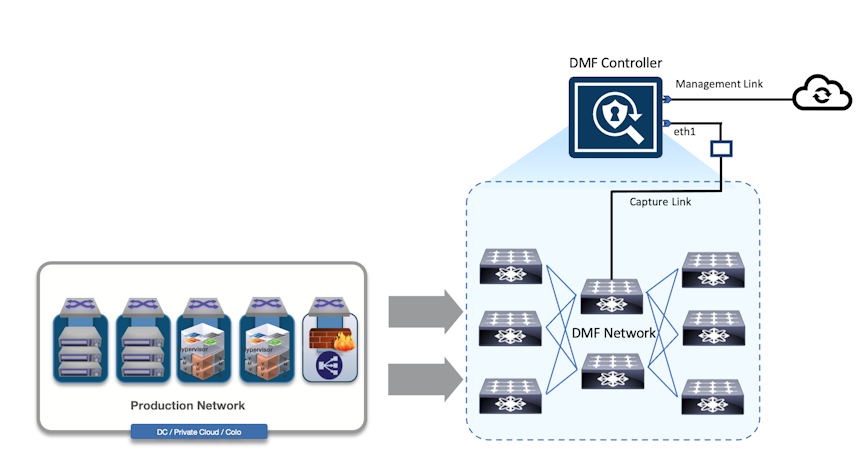
To capture packets, define a policy with filter ports and match rules to select the interesting traffic. Specify the capture action in the policy, then schedule the policy for a duration or packet count. In the illustrated example, a service exists in the policy to modify the packets before capture, but this is optional.
By default, when the policy action is capture, the policy is only active after scheduling the policy. Packet captures are always saved on the master (active) Controller. In case of HA failover, previous packet captures remain on the Controller where they were initially saved.
controller-1(config)# packet-capture retention-days <tab-key>
<retention-days> Configure packet capture file retention period in days. Default is 7 days
controller-1(config)#
Using the Command Line Interface
Stop, Start, and Schedule a Policy
Define Out-of-Band Match Rules
Configure a Policy
To configure a policy, log in to the DANZ Monitoring Fabric (DMF) console or SSH to the IP address assigned and perform the following steps:
Table ing_flow2 is full
<switch_DPID>
.
- ing_flow1- used for programming analytics tracking like DNS, DHCP, ICMP, TCP control packets, and ARP.
- ing_flow2 is the TCAM table used for programming data forwarding.
- To delete an existing policy, use the no policy command and identify the policy to delete, as in the following example:
controller-1(config-policy)# no policy policy-name-1
Warning: submode exited due to deleted object
- When deleting a policy, DMF deletes all traffic rules associated with the policy.
Stop, Start, and Schedule a Policy
Enter the active or inactive command from the config-policy submode to enable or disable a policy.
config-policy submode for the policy, as in the following example:
controller-1(config)# policy policy1
controller-1(config-policy)# stop
By default, if the policy action is forward or drop, the policy is active unless it is manually stopped or disabled.
controller-1(config)# policy policy1
controller-1(config-policy)# start now
For a policy with the forward action, the start now command causes the policy to run indefinitely. However, policies with the capture action run capture for 1 minute unless otherwise specified, after which the policy becomes inactive. This action prevents a capture from running indefinitely and utilizes the appliance storage capacity.
Examples
Use the start command with other options to schedule a stopped or inactive policy.
The full syntax for this command is as follows:
start { now [ duration duration ] | on-date-time start-time [duration duration ] seconds-from-now start-time [ duration duration ]
- now: start the action immediately.
- seconds-from-now: start the action after waiting for the specified number of seconds. For example, 300+ start the action in 5 minutes.
- on-date-time: starts the action on the specified date and time. Use the format %Y-%m-%dT%H:%M:%S.
- duration: Assign a value in seconds.
The start ? command lists the supported options:
controller-1(config-policy)# start ?
now                  Start the policy immediately
on-date-time         Start the policy at a specific date and time
seconds-from-now     Start the policy this many seconds from now
controller-1(config-policy)#
The start now ? command lists the supported now options:
controller-1(config-policy)# start now ?
duration          Duration the policy should remain active starting from its start-time
<Command-end>      <cr>: Return to execute command
;                 command separator
|                 pipe to command
>                 redirect
controller-1(config-policy)#
To set the duration, include the seconds keyword after the specified value. Omitting this keyword results in an Unexpected end of command error.
controller-1(config-policy)# start now duration 60 seconds
Use the start seconds-from-now command to specify when the policy should start and enter the desired start time:
controller-1(config-policy)# start seconds-from-now
<Seconds>     Integer number of seconds until policy should start

controller-1(config-policy)# start seconds-from-now 30
duration          Duration the policy should remain active starting from its start-time
<Command-end>      <cr>: Return to execute command
;                 command separator
|                 pipe to command
>                 redirect
controller-1(config-policy)#
Use the start on-date-time command to specify when the policy should start on a specific date and time and enter the desired values:
controller-1(config-policy)# start on-date-time
<Start-time>     The time to start the policy at (e.g. "2025-01-01T01:01:30" or "Friday at 5pm" or "15:30"; see help start on-date-time for more)

controller-1(config-policy)# start on-date-time "Friday at 5pm"
duration          Duration the policy should remain active starting from its start-time
<Command-end>      <cr>: Return to execute command
;                 command separator
|                 pipe to command
>                 redirect
controller-1(config-policy)#
Clear a Policy
controller-1(config)# no policy sample_policy
This command removes the policy sample_policy.
controller-1(config)# clear-all-configured-policy
View Policies
To display the policies currently configured in the DANZ Monitoring Fabric (DMF) fabric, enter the show policy command, as in the following example:
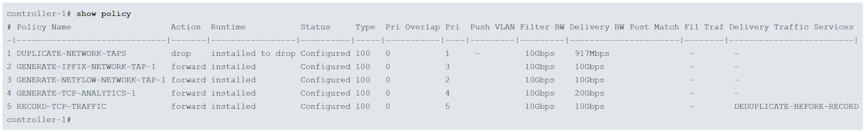
- #: a numeric identifier assigned to the policy.
- Policy Name: name of the policy.
- Action: Forward, Capture, or Drop.
- Runtime Status: a policy is active only when the policy configuration is complete, and a valid path exists through the network from a minimum of one of the filter ports to at least one of the delivery ports (and moves on through the service ports if that is specified). When inserting a service in the policy, the policy can only become active/forwarding when a delivery port is reachable from all the post-service ports of the service.
- Type: configured or dynamic. Refer to the Configuring Overlapping Policies section for details about dynamic policies created automatically to support overlapping policies.
- Priority: determines which policy is applied first.
- Overlap Priority: the priority assigned to the dynamic policy applied when policies overlap.
- Push VLAN: a feature that rewrites the outer VLAN tag for a matching packet.
- Filter BW: bandwidth used.
- Delivery BW: bandwidth used.
The following is the full command syntax for the show policy command:
show policy[ name [filter-interfaces | delivery-interfaces | services | core | optimized-match | failed-paths | drops | match-rules | optimized-match ]]
Use the event history to determine the last time when policy flows were installed or removed. A value of dynamic for Type indicates the policy was dynamically created for overlapping policies.
Rename a Policy
Use the following procedure to rename an existing policy.
Define Out-of-band Match Rules
A policy can contain multiple match rules, each assigned a rule number. However, the rule number does not specify a priority or the sequence in applying the match rule to traffic entering the filter ports included in a policy. Instead, if the traffic matches any match rules, all actions specified in the policy are applied to all matching traffic.
controller-1(config)# policy dmf-policy-1
controller-1(config-policy)# 10 match full ether-type ip dst-ip 10.0.0.50 255.255.255.255
controller-1(config-policy)# 20 match udp src-ip 10.0.1.1 255.255.255.0
controller-1(config-policy)# filter-interface filname2
controller-1(config-policy)# delivery-interface delname3
controller-1(config-policy)# action forward
When more than one action applies to the same packet, DMF makes copies of the matched packet. For details, refer to the chapter Advanced Policy Configuration.
Define a Policy with a Packet Capture Action
Use the packet-capture retention-days command to change the number of days to retain PCAP files. To view the current setting, use the show packet-capture retention-days retention-days command.
controller-1(config-policy)# delete packet-capture files policy capture file 2022-02-24-07-31-25-34d9a85a.pcapng
controller-1(config-policy)# action capture
controller-1(config-policy)# start now duration 60 seconds
For a policy with the forward action, the start now command causes the policy to run indefinitely. However, policies with the capture action run capture for 1 minute unless otherwise specified, after which the policy becomes inactive. This action prevents a capture from running indefinitely and utilizes the appliance storage capacity.
controller-1(config-policy)# show packet-capture files
~~~~~~~~~~~~~~~~~~~~~~~~~~~~~~~~~~~~~~~~~~~~~~~~ All Packet Capture Files ~~~~~~~~~~~~~~~~~~~~~~~~~~~~~~~~~~~~~~~~~~~~~~~~~~~~~~~~~
# Policy Name File Name                          File Size Last Modified                  URL
-|-----------|----------------------------------|---------|------------------------------|----------------------------------------------------------------|
1 capture     2022-11-01-03-03-19-c106e6c.pcapng 258MB     2022-11-01 03:04:17.227000 PDT https://10.9.33.2/pcap/capture/2022-11-01-03-03-19-c106e6c.pcapng
controller-1(config-policy)#
controller-1 > show packet-capture disk-capacity
Disk capacity : 196GB
controller-1> show packet-capture disk-usage
Disk usage : 258MB
controller-1>
controller-1> show packet-capture retention-days
controller-1(config-policy)# show policy capture history
# Time                           Event                           Detail             PCAP File
-|------------------------------|-------------------------------|-----------------|-------------------------------------------------|
1 2022-11-01 03:03:19.382000 PDT installation complete           capturing packets  /pcap/capture/2022-11-01-03-03-19-c106e6c.pcapng
2 2022-11-01 03:04:16.895000 PDT Configuration updated by admin. capturing packets  inactive - outside configured runtime/duration,
                                                                                    scheduled to be started in 7sec if set active
3 2022-11-01 03:04:17.266000 PDT policy removed                                     inactive - outside configured runtime/duration,
                                                                                    scheduled to be started in 6sec if set active
controller-1(config-policy)#
Rename Object
Perform the following rename workflow steps:
DMF updates references to the object (policy in earlier example).
rename-this command instead of rename, as shown in the following example:
dmf-controller(config)# policy existing-policy-name
dmf-controller(config-policy)# show this

! policy
policy existing-policy-name
dmf-controller(config-policy)# rename-this new-policy-name
dmf-controller(config-policy)# show this

! policy
policy new-policy-name
dmf-controller(config-policy)#
Limitations
- Users must have permission to update the object.
- The object must be associated with a submode (the rename command is only available within submodes).
- The new name must follow the requirements for the object's name.
- The REST API does not have a rename verb, and no REST API function can be issued to rename a policy.
- Policy rename is implemented as follows:
- Create a new transaction.
- Delete the existing object within the transaction.
- Create a new object with the requested name within the transaction.
- Commit the transaction.
- Since there is no direct support for object renaming, the Controller identifies this as a new object creation and an existing object deletion. This can result in a service interruption for semantics associated with the modified object.
Persist UDF Input Format
Use the CLI show commands to view the three offset match types.
dmf-controller-1># show policy p1 optimized-match
Optimized Matches :
1 ether-type 2048 offsetMatches [UdfMatch{location=UdfOffset
[anchor=l3-start, offset=4, length=2], value='0x1234', mask='0x123'}]
dmf-controller-1># show policy p1 optimized-match
Optimized Matches :
1 ether-type 2048 offsetMatches [UdfMatch{location=UdfOffset [anchor=l3-start, offset=4, length=2],
value='0.0.1.12', mask='0.0.2.3'}, UdfMatch{location=UdfOffset [anchor=l3-start, offset=2, length=2],
value='0.0.1.1', mask='0.0.12.1'}]
dmf-controller-1># show policy p1 optimized-match
Optimized Matches :
1 ether-type 2048 offsetMatches [UdfMatch{location=UdfOffset [anchor=l3-start, offset=4, length=2],
value='1', mask='1'}]
Multi-vCenter VM Support in Single Policy
The Multi-vCenter VM Support in Single Policy feature enhances scalability and configuration management by allowing the inclusion of Virtual Machines (VMs) from multiple vCenters within a single policy. DMF supports configuring match rules to include multiple VMs across disparate vCenters, unifying policy application and reducing configuration overhead. Whereas, in prior releases, integrating a large number of vCenters with a single DMF fabric required a separate policy for each instance.
Configuration
Monitor traffic from multiple VMs from multiple vCenters by creating one or more match rules specifying VM and vCenter details.
There is no need to configure vCenters using filter-vcenter to use this feature.
dmf-controller-1> en
dmf-controller-1# configure
dmf-controller-1(config)# policy multi-vcenter-policy
dmf-controller-1(config-policy)# 1 match ip src-vcenter vc72 src-vm-name ext-router dst-vcenter vc72 dst-vm-name vlan3
dmf-controller-1(config-policy)# 2 match ip src-vcenter vc-10.240.145.55 src-vm-name nutanix-foundation
src-vm-name and dst-vm-name lists VMs from the selected vCenter.Show Commands
Use the show running-config command to view policy configurations that utilize VMs from multiple vCenters.
dmf-controller-1(config-policy)# show running-config policy multi-vcenter-policy

! policy
policy multi-vcenter-policy
1 match ip src-vcenter vc72 src-vm-name ext-router dst-vcenter vc72 dst-vm-name vlan3
2 match ip src-vcenter vc-10.240.145.55 src-vm-name nutanix-foundation
Troubleshooting
If the expected vCenters are not visible for src|dst-vcenter or the VMs from the chosen vCenter do not appear for src|dst-vm-name, use the vcenter commands to verify the current configuration and inventory details:
show vcenter [all detail]– Displays vCenter information. Verify theStatefield to determine if the corresponding vCenter isconnectedordisconnected.show running-config vcenter– Displays the current vCenter configuration.