Introduction to DMF and Overview
This chapter introduces the DANZ Monitoring Fabric (DMF) and the user interfaces for out-of-band monitoring and configuration.
DANZ Monitoring Fabric (DMF) is a cloud-first Network Packet Broker (NPB) that provides a single pane of glass with an integrated visibility fabric. The DMF solution includes NPB functionality with the DMF Recorder Node and the Analytics Node for deeper monitoring and pervasive security of out-of-band workloads in hybrid cloud deployments.
DMF leverages an SDN-controlled fabric using high-performance, open networking (white box/brite box) switches and industry-standard x86 servers to deploy highly scalable and flexible network visibility and security solutions. Traditional, box-based, hardware-centric NPBs are architecturally limited when trying to meet the evolving security and visibility demands of Cloud Native data centers. DMF addresses the challenges of traditional NPB solutions by enabling a scale-out fabric for enterprise-wide security and monitoring, a single pane of glass for operational simplicity, and multi-tenancy for multiple IT teams, including NetOps, DevOps, and SecOps.
Out-of-band Monitoring with DANZ Monitoring Fabric
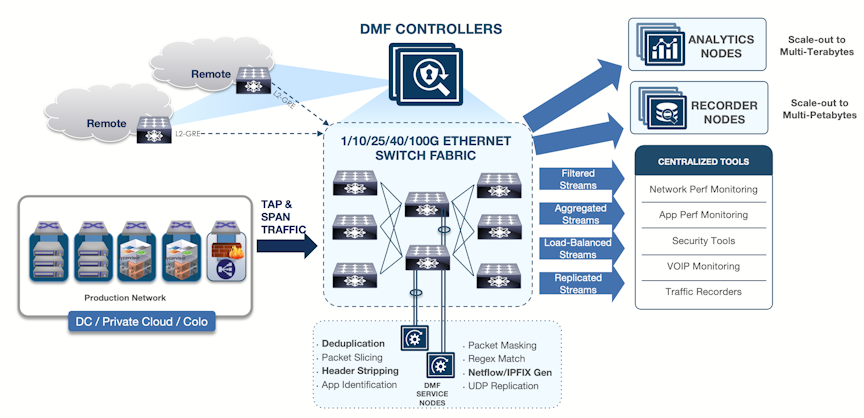
As data center networks move toward 40/100G designs, cloud computing, hyper scale data analytics, and 5G mobile services, traffic monitoring must transition to next-generation designs. To manage the modern data center, much network traffic must be copied and aggregated from TAP or SPAN ports and forwarded to monitoring and analysis tools. These tools, used in managing network performance, application performance, security, and compliance, leverage other systems such as data recorders, intrusion detection systems, data leakage detectors, SLA measurement devices, and other traffic analyzers like Wireshark.
DANZ Monitoring Fabric (DMF) uses high-performance open-networking switches to deliver an open, production-grade, and scalable monitoring solution based on Software Defined Networking (SDN) technology. The centralized DMF Controller provides flexibility, simplifies policy management and monitoring fabric configuration, and supports cost-effective monitoring of data centers and remote sites or branches with up to several thousand TAP and SPAN ports.
DMF architecture, inspired by hyper scale networking designs, consists of the following components:
- HA pair of SDN-enabled DMF Controllers (VMs or hardware appliances), enable simplified and centralized configuration, monitoring, and troubleshooting.
- Arista Networks SDN-enabled Switch Light OS is a production-grade, lightweight OS that runs on DMF Ethernet switches.
- DANZ Service Nodes (optional), a Data Plane Development Kit (DPDK)-powered, x86-based appliances that connect to the DMF singly or as part of a service node chain. The service node provides advanced packet functions, such as deduplication, packet slicing, header stripping, regex matching, packet masking, UDP replication, and IPFIX/NetFlow generation.
- DANZ Recorder Nodes (optional) are x86-based appliances connected to the DMF and are managed via the DMF Controller to provide petabyte packet recording, querying, and replay functions.
- Analytics Nodes (optional) are x86-based appliances that integrate with the DMF to provide multi-terabit, security, and performance analytics with configurable, historical time-series dashboards.
- Organization-wide visibility: delivers traffic from any TAP to any tool at any time across one or multiple locations.
- Flexible, scale-out fabric deployment: supports a large number of 1G, 10G, 25G, 40G, and 100G ports (thousands per fabric).
- Multi-tenant tap and tool sharing: supports monitoring by multiple teams to enable Monitoring Fabric as a Service.
- Massive operational simplification: provides a single pane of glass for provisioning, management, monitoring, and debugging through a centralized SDN Controller. This feature eliminates needing a box-by-box configuration.
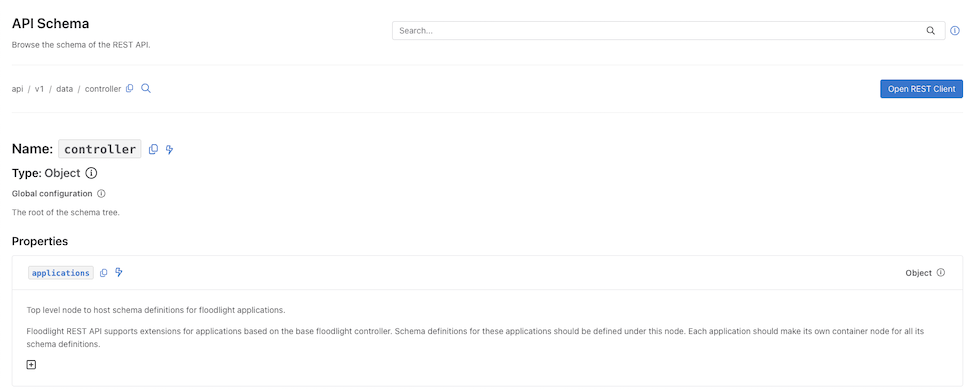
- Centralized programmability: a REST-based API architecture enables event-based, centralized policy management and automation for integrated end-to-end IT work flows. This feature leverages DMF Service Nodes, Analytics Nodes, and Recorder Nodes.
- Dramatic cost savings: Achieving a significant reduction in the total cost of ownership by using open Ethernet switches in combination with industry-standard x86 servers, optimized usage of tools, and SDN-enabled operations and automation.
Using the DANZ Monitoring Fabric GUI
- Mozilla Firefox
- Google Chrome
- Microsoft Edge
- Internet Explorer
- Apple Safari
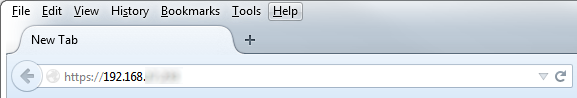
To connect to the DMF GUI, use the DMF Controller IP address. Use the virtual IP (VIP) assigned to the cluster if configured during deployment. Using the VIP ensures that the user connects to the current active Controller, regardless of any failover that may have occurred.
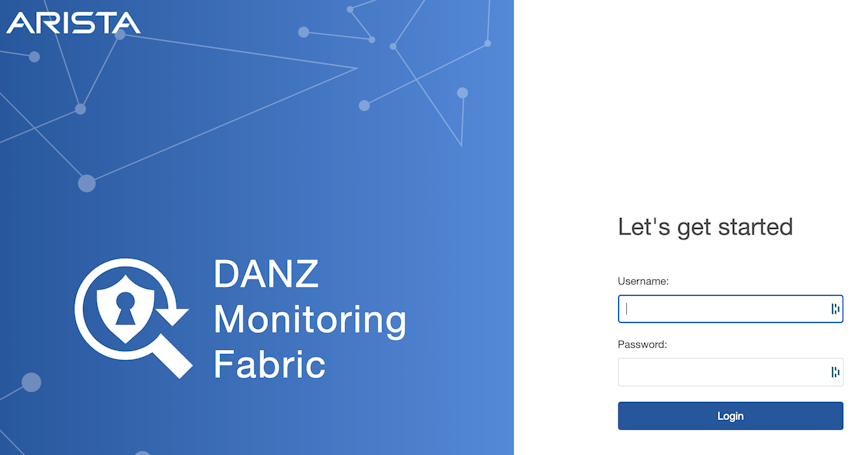
Use the admin username and password configured for the DMF Controller during installation or any user account and password configured with administrator privileges. A user in the read-only group will have access to options for monitoring fabric configuration and activity but cannot change the configuration.

- Fabric: Manage DMF switches and interfaces.
- Monitoring: Manage DMF policies, services, and interfaces.
- Maintenance: Configure fabric-wide settings (clock, SNMP, AAA, sFlow®*, Logging, Analytics Configuration).
- Integration: Manage the integration of vCenter instances to allow monitoring traffic using DMF.
- Security: Manage administrative access.
- DMF Features: Select the gear icon in the navigation bar to view the DMF Features page.
- Alerts: Select the Notification Bell to view the Alerts page.
-
Background Tasks:Select the Task icon to view running background tasks.
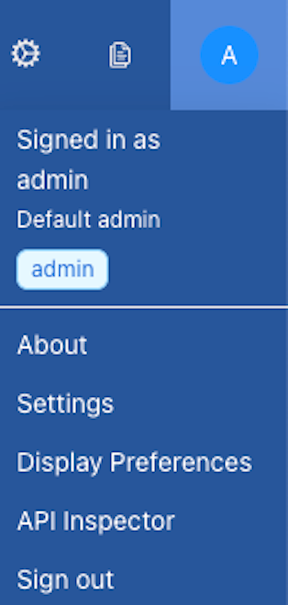
- Admin (A):A page that displays or edits user preferences; the ability to change the password or sign out. Set Display Preferences, enter the API Inspector, change Settings, and view About details.
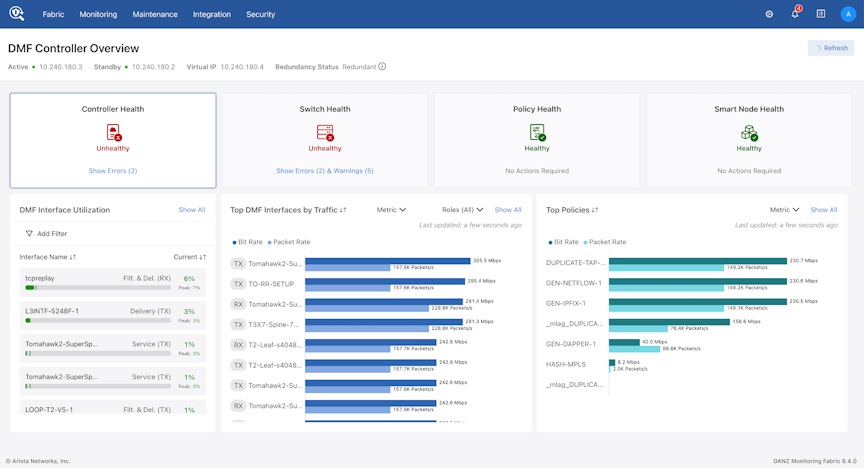
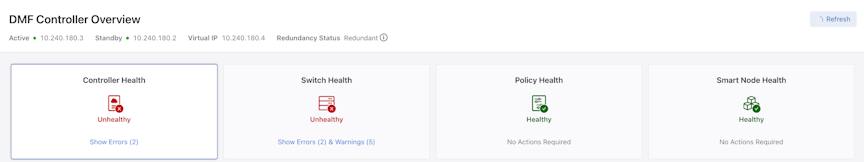
- Active IP address
- Standby IP address
- Virtual IP address
- Redundancy Status - The status contains an informational tool tip that can be hovered for more details.
- Controller Health
- Switch Health
- Policy Health
- Smart Node Health
Admin Settings
The Admin settings menu provides access to the following features and functions.
- Account Sign-in and User Role
- About
- Settings
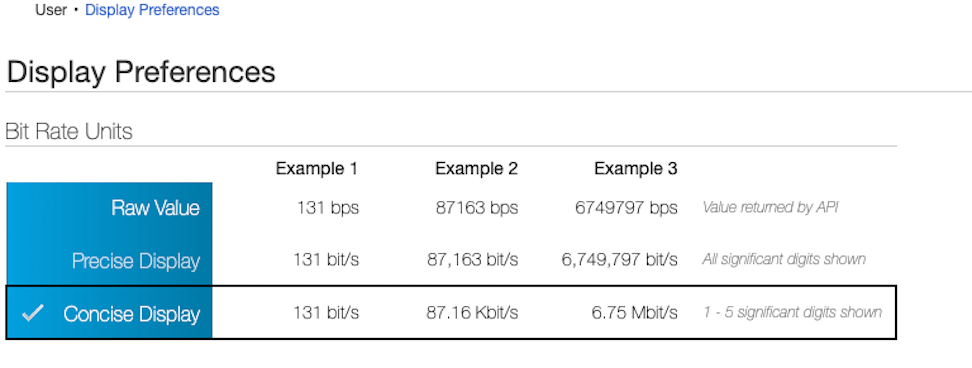
- Display Preferences
- API Inspector
- Sign out
Hover over and select the A (user) icon to view the drop-down menu.
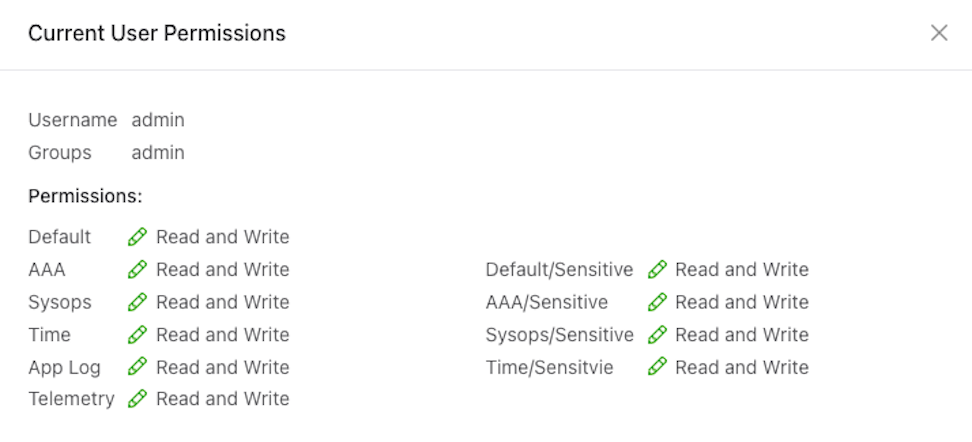
Selecting the User Account icon opens a Current Users Permissions window.
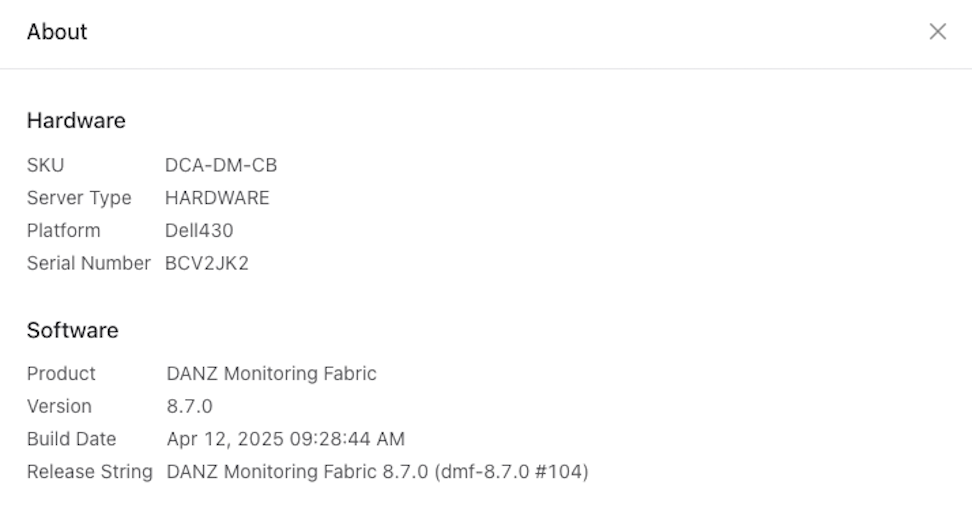
About: Open an information window providing details about the DMF Instance.
To manage user preferences select Settings.
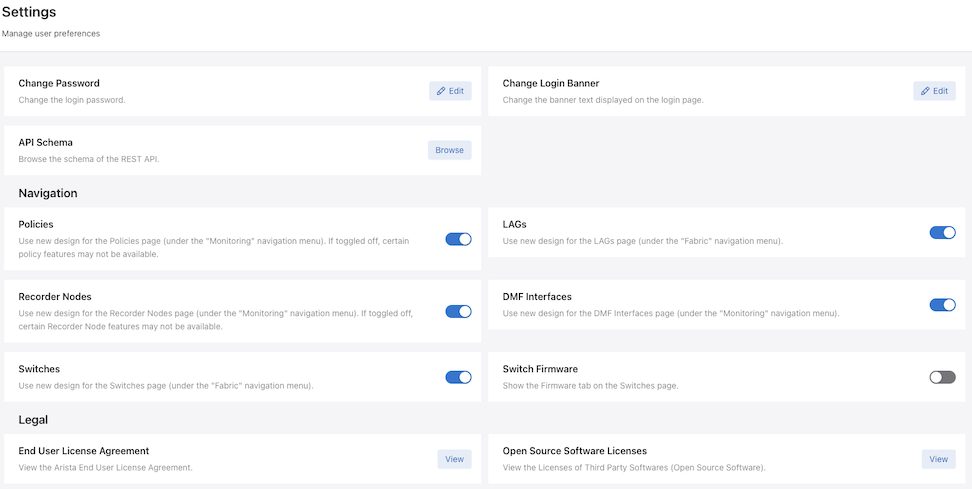
- Change Password: Change the existing user account password.
Figure 11. Password Change 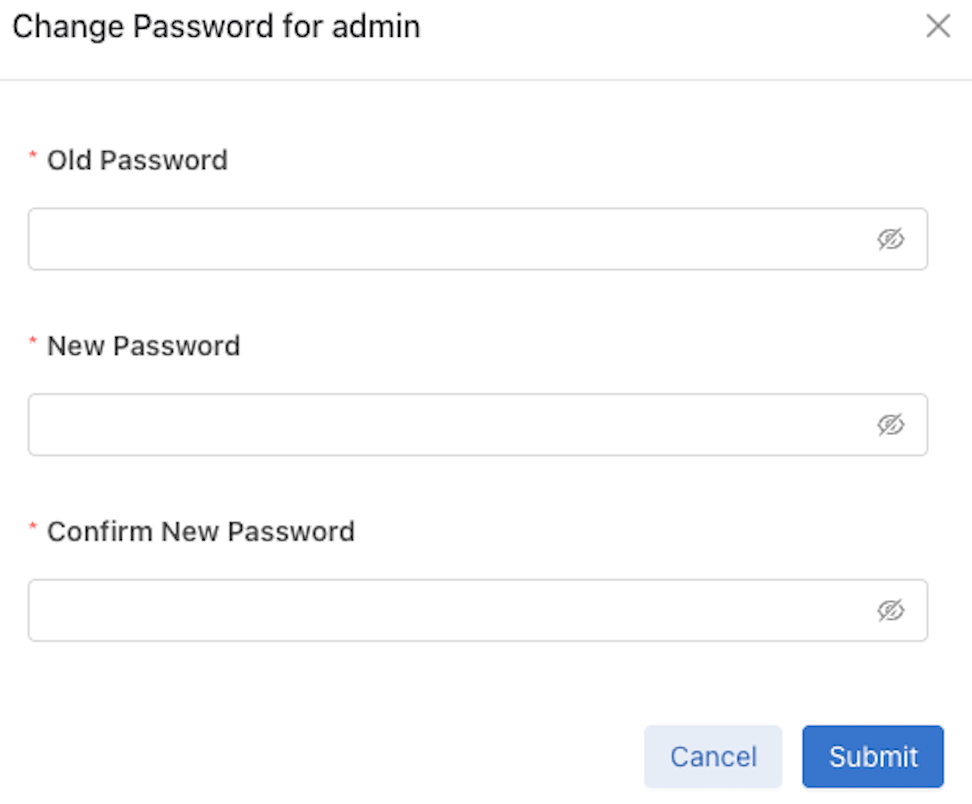
- Change Login Banner: Change the login banner that appears when accessing DMF.
Figure 12. Change Banner 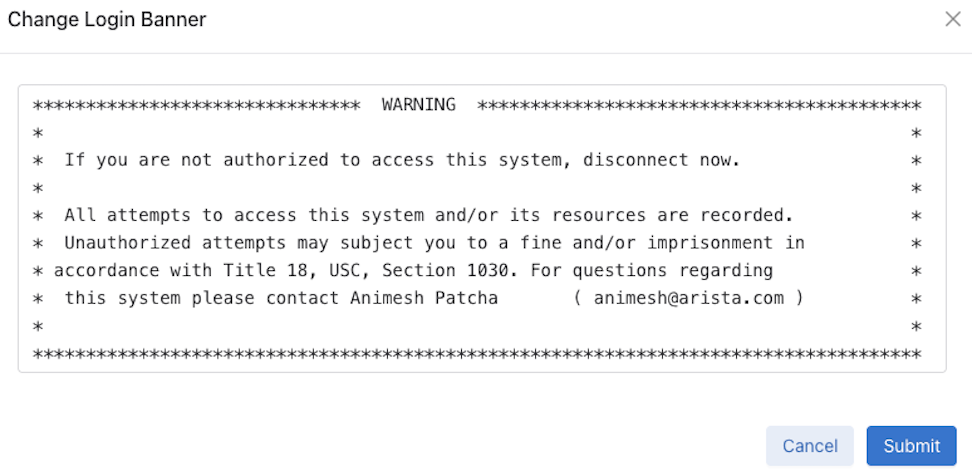
- Navigation and Legal: Configure the user interface preferences and view license details.
Figure 13. Navigation 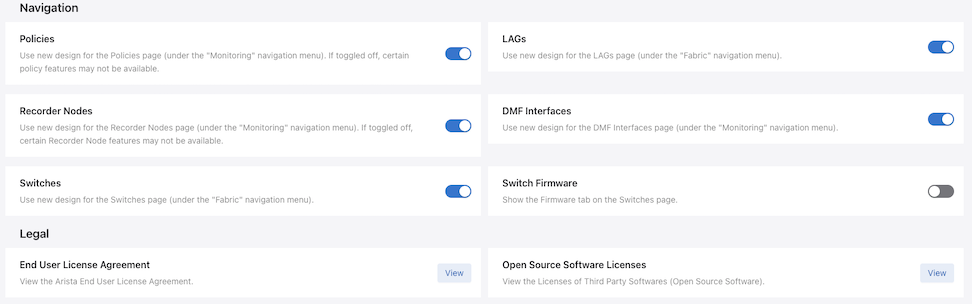
Sign out: Logout of the DMF Instance.
DMF Features Page
Page Layout
All fabric-wide configuration settings required in advanced use cases for deploying DMF policies appear in the new DMF Features Page.
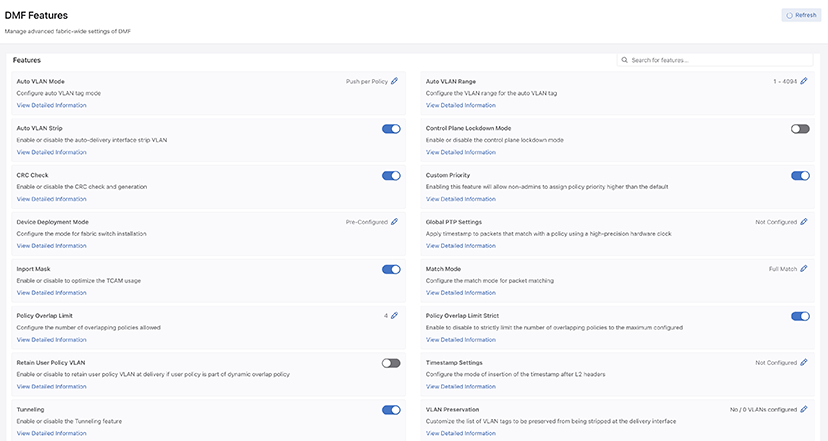
The fabric-wide options used with DMF policies include the following:
| Auto VLAN Mode | Auto VLAN Range |
|---|---|
| Auto VLAN Strip | Control Plane Lockdown Mode |
| CRC Check | Custom Priority |
| Device Deployment Mode | Error Disable |
| Filter MAC Rewrite | Global PTP Settings |
| Inport Mask | MACsec |
| Match Mode | Policy Overlap Limit |
| Policy Overlap Limit Strict | Retain User Policy VLAN |
| Supervisor Redundancy Settings | Timestamp Settings |
| Tunneling | VLAN Preservation |
- Feature Title
- A brief description
- View / Hide Detailed Information
- Current Setting
- Edit Link - Use Edit (pencil icon) to change the value.
View Detailed Information
Feature Settings
Auto VLAN Strip
- A toggle button controls the configuration of this feature. Locate the corresponding card and move the toggle button.
Figure 20. Toggle Switch 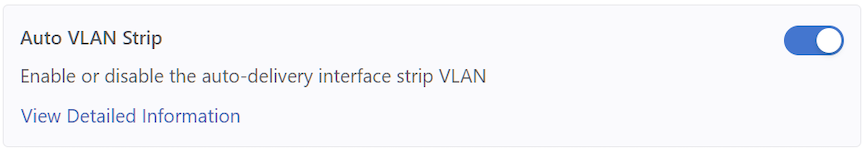
- A confirm window pops up, displaying the corresponding prompt message. Select Enable to confirm the configuration changes or choose Cancel to cancel the configuration. Conversely, to disable the configuration, select Disable.
Figure 21. Confirm Enable 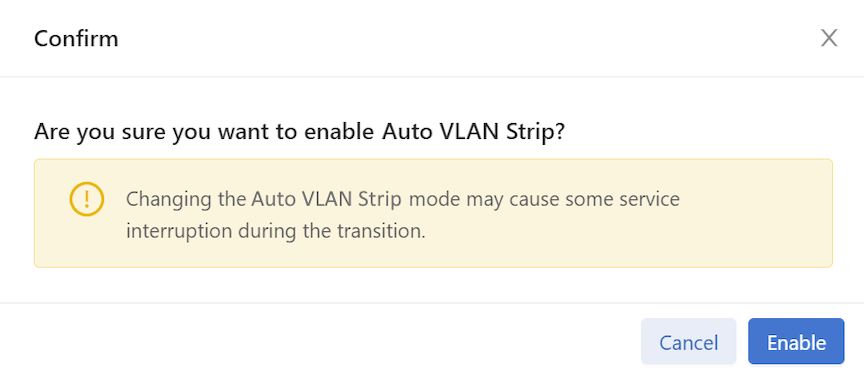
Figure 22. Confirm Disable 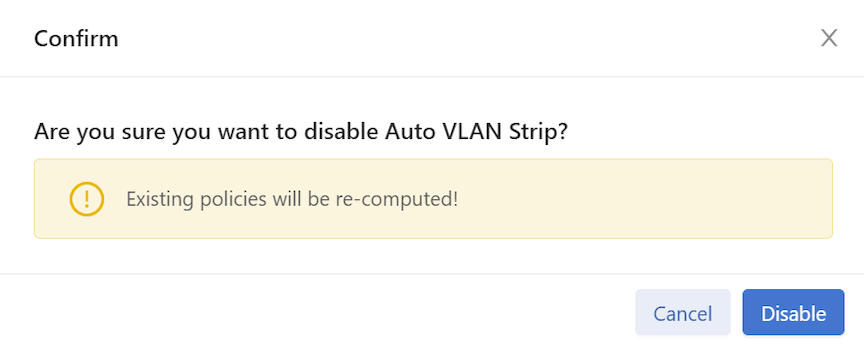
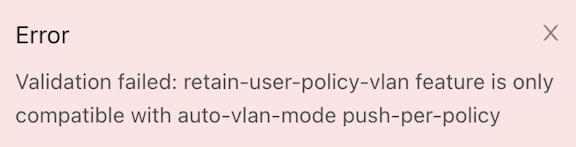
- Review any warning messages that appear in the confirmation window during the configuration process.
Figure 23. Warning Message - Changing 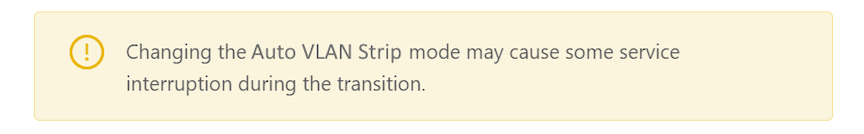
The following feature sets work in the same manner as the Auto VLAN Strip feature described above.
| CRC Check | Policy Overlap Limit Strict |
|---|---|
| Custom Priority | Retain User Policy VLAN |
| Inport Mask | Tunneling |
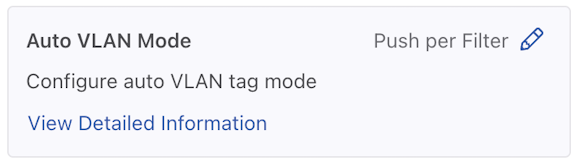
Auto VLAN Mode
- Control the configuration of this feature using the Edit icon by locating the corresponding card and selecting the pencil icon.
Figure 24. Auto VLAN Mode Config 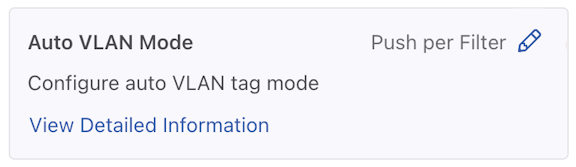
- A confirmation edit dialogue window appears, displaying the corresponding prompt message.
Figure 25. Edit VLAN Mode 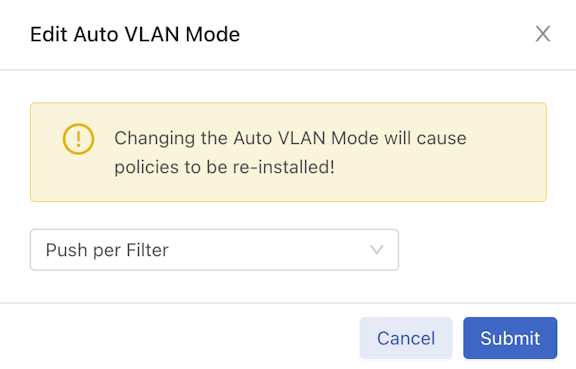
- To configure different modes, select the drop-down arrow to open the menu.
Figure 26. Drop-down Example 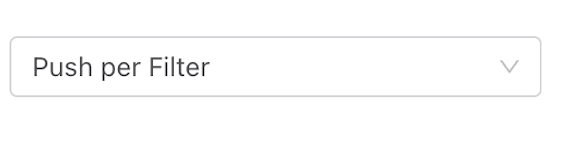
- From the drop-down menu, select and select the desired mode.
Figure 27. Push Per Policy 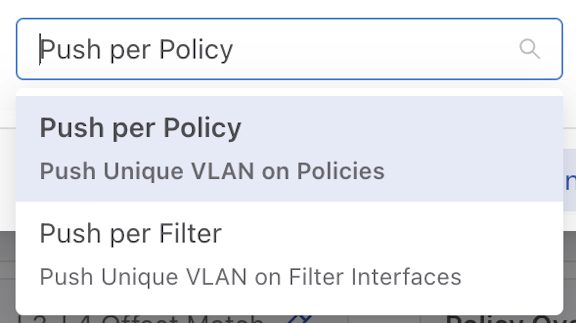
- Alternatively, enter the desired mode name in the input area.
Figure 28. Push Per Policy 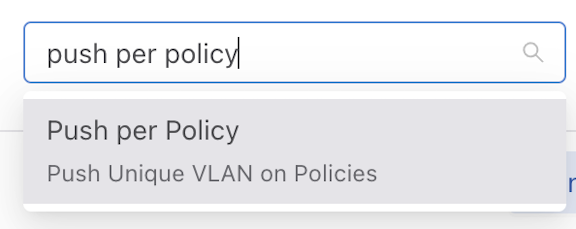
- Select Submit to confirm the configuration changes or choose Cancel to discard the changes.
Figure 29. Submit Button - After successfully setting the configuration, the current configuration status displays next to the edit icon.
Figure 30. Current Configuration Status 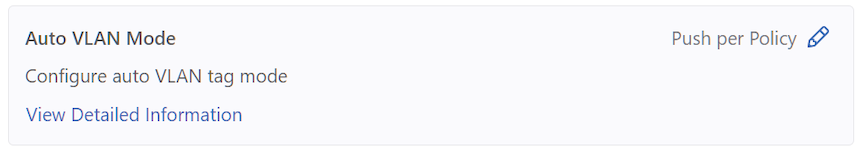
The following feature sets work in the same manner as the Auto VLAN Mode feature described above.
- Device Deployment Mode
- Match Mode
Auto VLAN Range
- Control the configuration of this feature using the Edit icon by locating the corresponding card and selecting the pencil icon.
Figure 31. Edit Auto VLAN Range 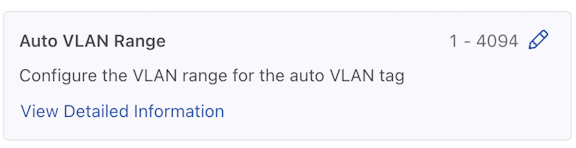
- A configuration edit dialogue window pops up, displaying the corresponding prompt message. The Auto VLAN Range defaults to 1 - 4094.
Figure 32. Edit Auto VLAN Range 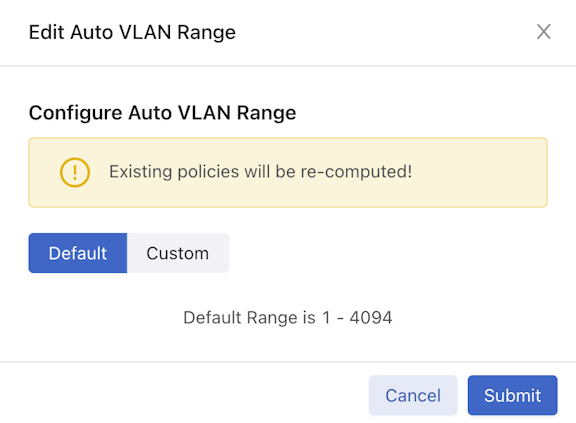
- Select Custom to configure the custom range.
Figure 33. Custom Button 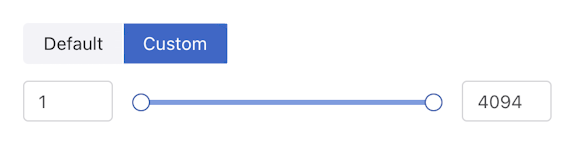
- Adjust range value (minimum value: 1, maximum value: 4094). There are three ways to adjust the value of a range:
- Directly enter the desired value in the input area, with the left side representing the minimum value of the range and the right side representing the maximum value.
- Adjust the value by dragging the slider using a mouse. The left knob represents the minimum value of the range, while the right knob represents the maximum value.
- Use the up and down arrow buttons in the input area to adjust the value accordingly. Pressing the up arrow increments the value by 1, while pressing the down arrow decrements it by 1.
- Select Submit to confirm the configuration changes or Cancel to discard the changes.
- After successfully setting the configuration, the current configuration status displays next to the pencil (edit) icon.
Figure 34. Configuration Change Success 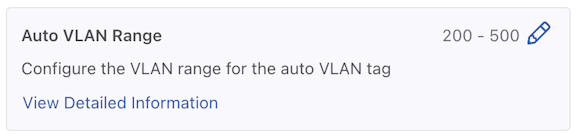
Policy Overlap Limit
- Control the configuration of this feature using the Edit icon by locating the corresponding card and selecting the pencil icon.
Figure 35. Policy Overlap Limit 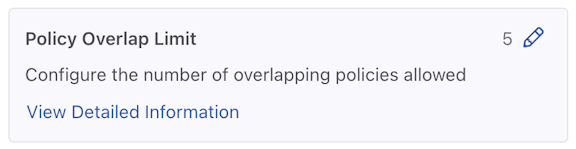
- A configuration edit dialogue window pops up, displaying the corresponding prompt message. By default, the Policy Overlap Limit is 4.
Figure 36. Edit Policy Overlap Limit 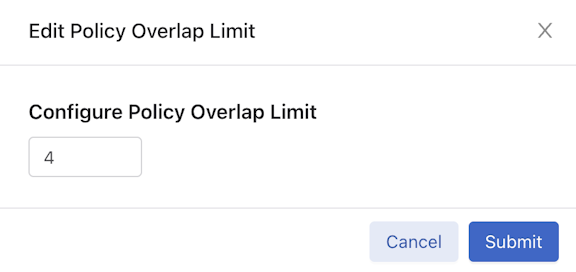
- Adjust the Value (minimum value: 0, maximum value: 10). There are two ways to adjust the value:
- Directly enter the desired value in the input area.
- Use the up and down arrow buttons in the input area to adjust the value accordingly. Pressing the up arrow increments the value by 1, while pressing the down arrow decrements it by 1.
- Select Submit to confirm the configuration changes or Cancel to discard the changes.
- After successfully setting the configuration, the current configuration status displays next to the pencil (edit) icon.
Figure 37. Policy Overlap Limit Change Success 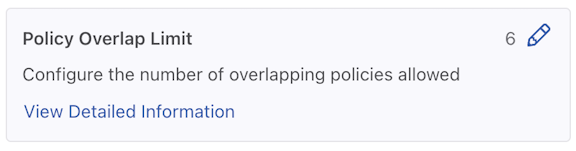
VLAN Preservation
- Control the configuration of this feature using the Edit icon by locating the corresponding card and selecting the pencil icon.
Figure 38. VLAN Preservation Feature Set 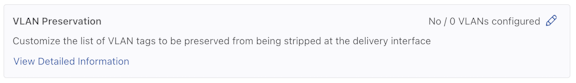
- A configuration edit dialogue window appears displaying the corresponding prompt message. The VLAN Preservation defaults to:
- Preserve User Configured VLANS: Off
- Preserve VLAN: No VLAN Configured
- To configure Preserve User Configured VLANs, toggle on the switch.
Figure 39. Edit VLAN Preservation Configuration 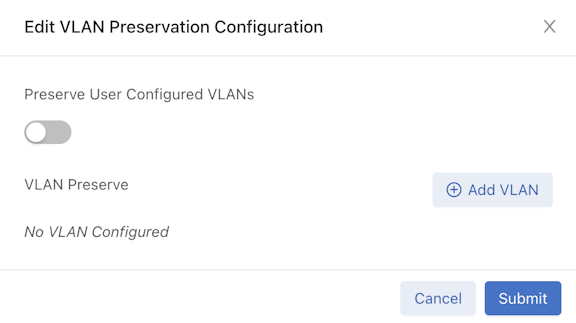
- To configure Preserve VLAN, select Add VLAN to add a configuration area for preserving the VLAN value.
Figure 40. Preserve VLAN - Add VLAN 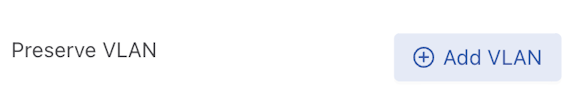
- Select the drop-down icon. There are two ways to configure the preserved VLAN value (minimum value: 1, maximum value: 4094) and a method to delete an entry.
Figure 41. VLAN Single Example 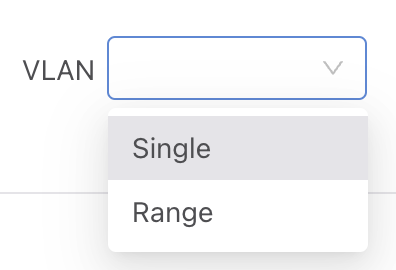
- Add Single: Choose Single in the VLAN drop-down menu, and type in the value in the input area.
Figure 42. Add Single VLAN 
- Add Range: Choose Range in the VLAN drop-down menu, and type in the input area's minimum and maximum values.
Figure 43. Add VLAN Range 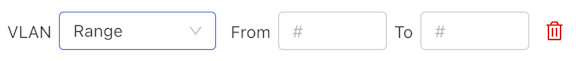
- Delete: Since there must be a corresponding number in the value input area when submitting the configuration, when accidentally adding multiple redundant VLAN configuration areas, delete the corresponding rows by selecting the red trash can icon
 .
.
Note: The feature supports combinations of any number of single values and any number of range values. - Add Single: Choose Single in the VLAN drop-down menu, and type in the value in the input area.
- Select Submit confirm the configuration changes or Cancel to discard the changes.
- After successfully setting the configuration, the current configuration status displays next to the pencil (edit) icon.
Figure 44. Preserve VLAN Configuration Change 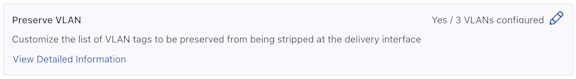
Global PTP Settings
- Control the configuration of this feature using the Edit icon by locating the corresponding card and selecting the pencil icon.
Figure 45. Global PTP Settings 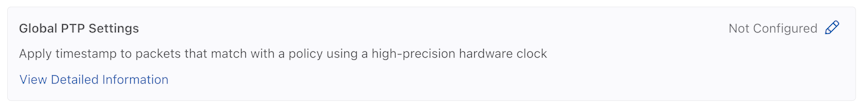
- A configuration edit dialogue window appears displaying the corresponding prompt message. By default, these features are not configured. Enter the desired configuration value in the corresponding input area. Hover over the question mark icon to obtain additional explanatory information.
Figure 46. Edit PTP Settings 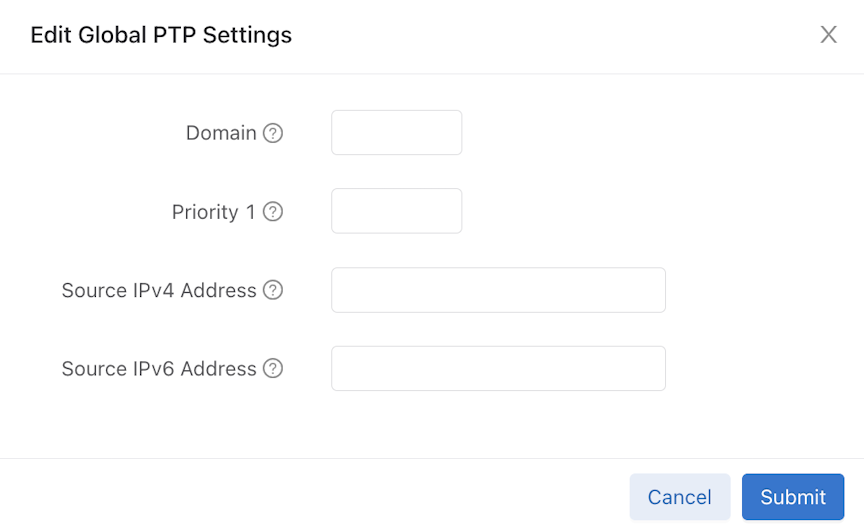
- Select Submit to confirm the configuration changes or Cancel to discard the changes.
- After successfully setting the configuration, the current configuration status displays next to the pencil (edit) icon.
Figure 47. PTP Timestamping Configuration Change 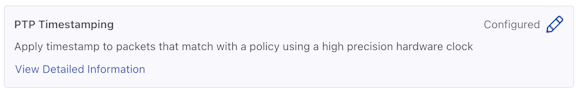
Feature Setting Notification Message

Control Plane Lockdown Mode
Enable or disable the Control Plane Lockdown Mode feature.- A toggle button controls the configuration of this feature. Locate the corresponding card and select the toggle switch.
Figure 50. Control Plane Lockdown Mode 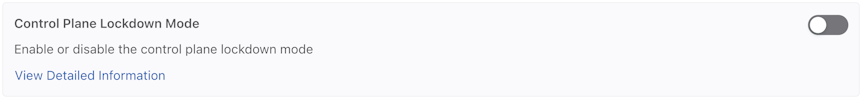
- Select Enable to enable Control Plane Lockdown Mode or Cancel to discard the changes.
Figure 51. Enable Control Plane Lockdown Mode 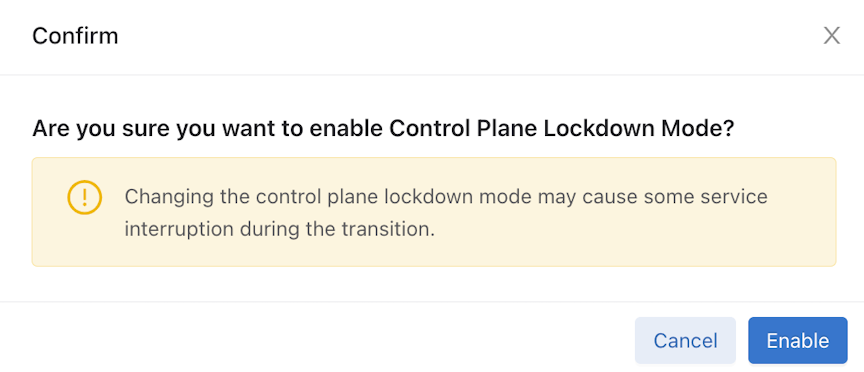 Note: Changing the Control Plane Lockdown Mode may cause some service interruption during the transition.
 - On enabling Control Plane Lockdown Mode, a success notification message pops up with specific details.
Figure 52. Success Message 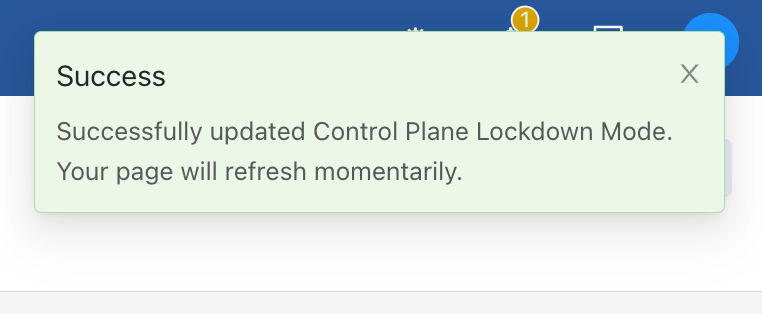
Timestamp Settings
- Control the configuration of this feature using the Edit icon by locating the corresponding card and selecting the pencil icon.
Figure 53. Timestamp Settings 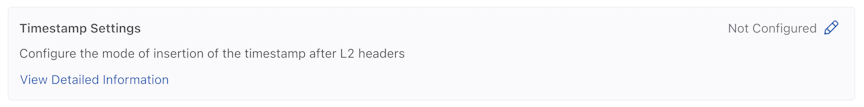
- To configure different header modes, select the drop-down arrow. There are two ways to edit the timestamp settings - Replace Source MAC or Add Header after L2.
Figure 54. Edit Timestamp Settings 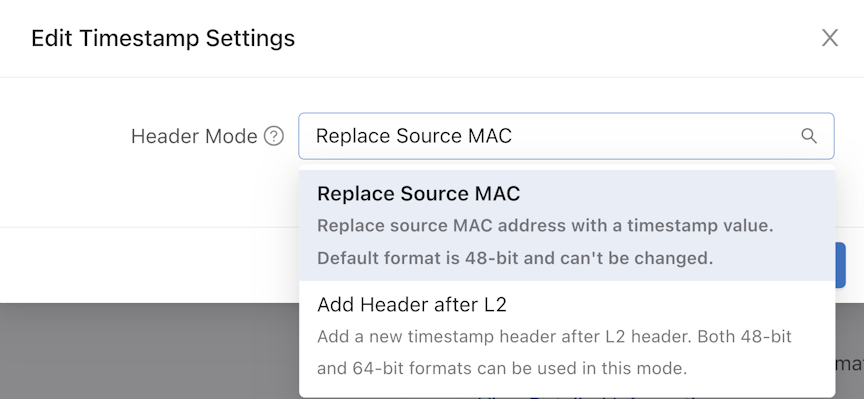
- For Add Header after L2 Mode, choose the header format as 48-bit or 64-bit.
Figure 55. Add Header after L2 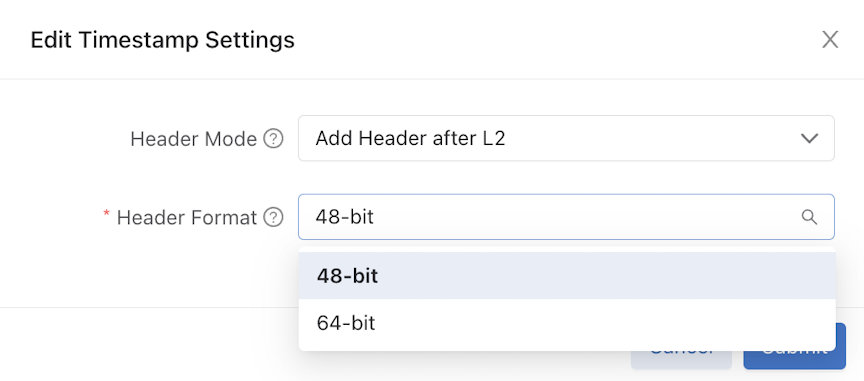
- Select Submit to confirm the configuration changes or Cancel to discard the changes.
Figure 56. Submit Timestamp Changes 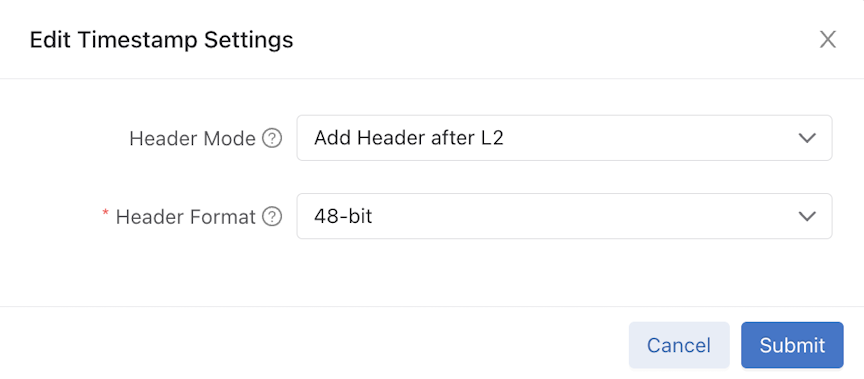
- Select Replace Source MAC Mode and use Submit to confirm the configuration changes or Cancel to discard the changes.
Figure 57. Replace Source MAC 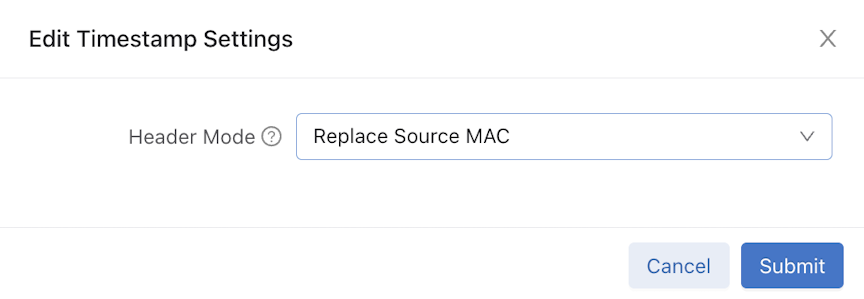
- On enabling Timestamp Settings, a success notification message pops up with specific details.
Figure 58. Success Message 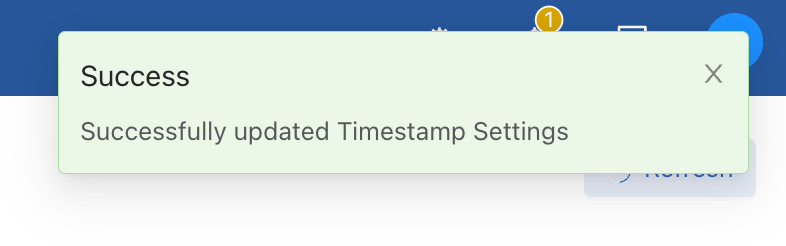
Dashboard Layout
- Controller Health
- Switch Health
- Policy Health
- Smart Node Health
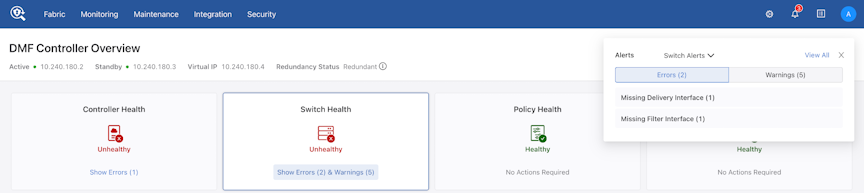

Controller Health
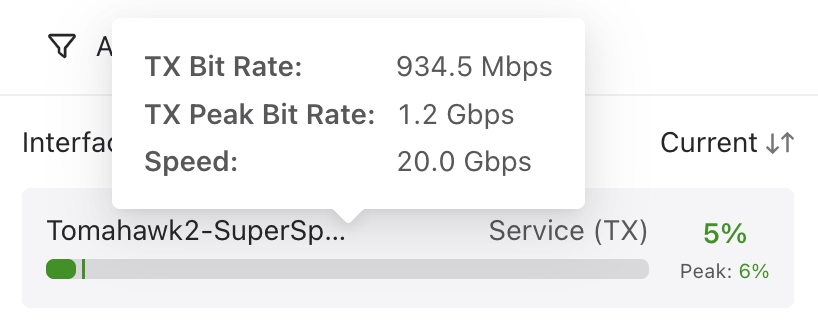
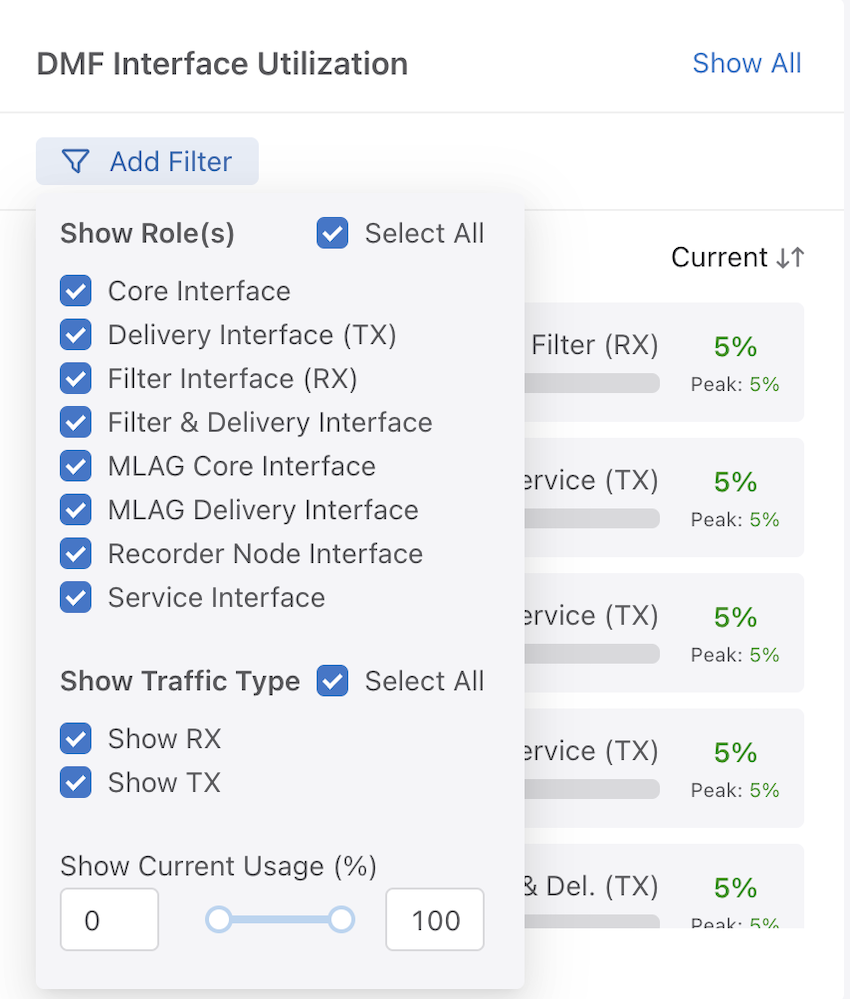
DANZ Monitoring Fabric (DMF) Interface Utilization
This widget displays the utilization of each DMF interface as follows:
- DMF Interface Name
- Interface Role
- Traffic Direction
- Current Utilization (%)
- Peak Utilization (%)
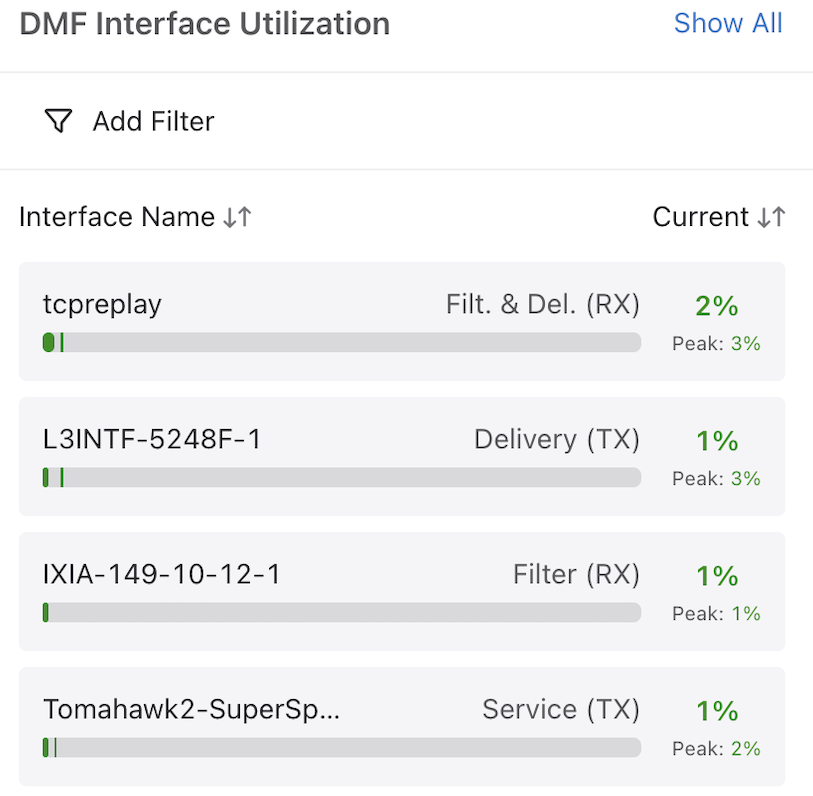
The bar indicates the current utilization and shows peak utilization with a vertical line. The color of the bar and percentage changes depending on the utilization:
- Red means the utilization percentage is greater than 95%.
- Yellow means the utilization percentage is greater than 70%.
- Green means the utilization percentage is less than 70%.
Filter interfaces display only RX traffic, while delivery interfaces display only TX traffic. Other roles with bidirectional data can have one item for each direction of traffic, RX, or TX.
Show All leads to the DMF Interfaces page.
Sort interfaces by Interface Name or Current Utilization. The interfaces are sorted by current utilization (descending order) by default.
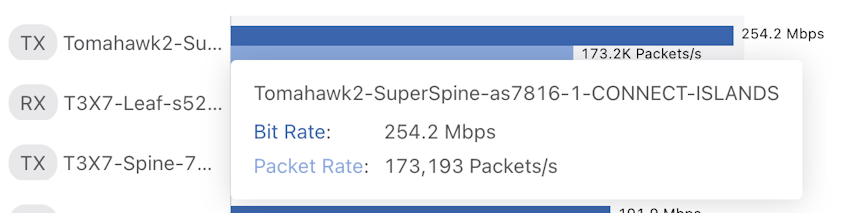
Top DMF Interfaces by Traffic
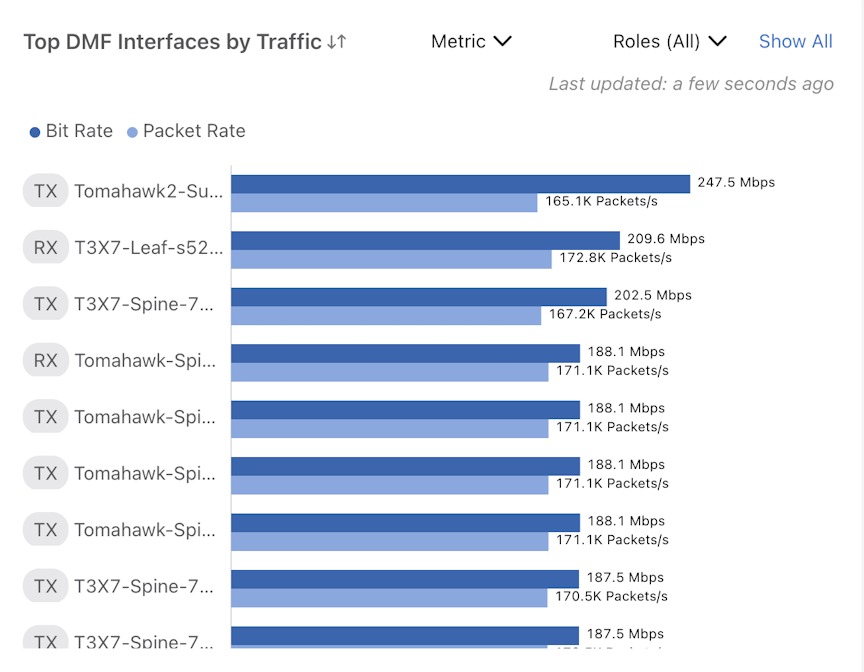
The widget shows each interface's traffic direction, DMF Interface name, bit rate, and packet rate. Show All leads to the DMF Interfaces page. Sort interfaces by Bit Rate and filter by Metric and Role. By default, DMF sorts the data in descending order of bit rate.
Top Policies
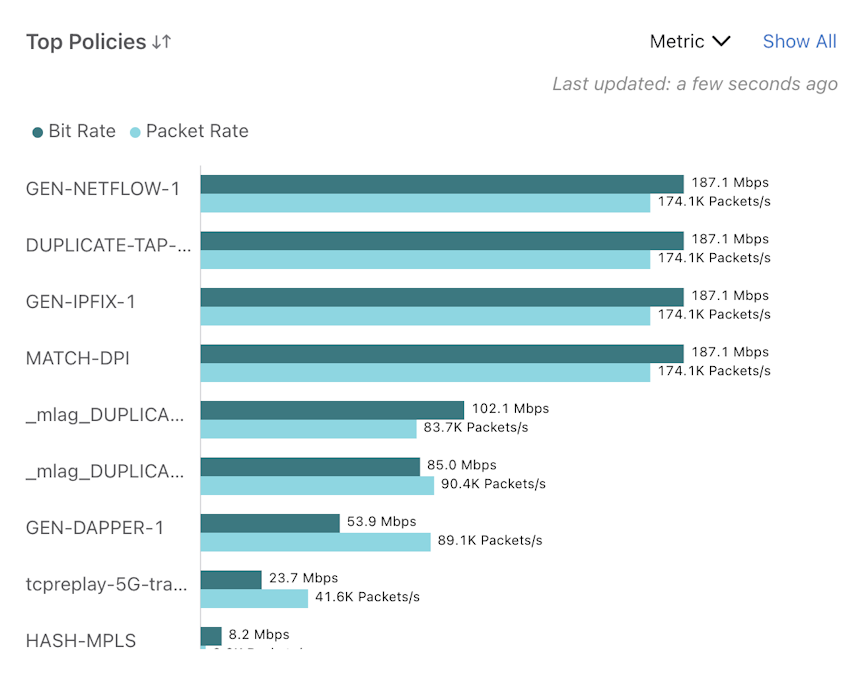
For each policy, the bar chart shows the following:
- Policy Name
- The sum of the bit rates of all filter interfaces associated with the policy.
- The sum of the packet rates of all filter interfaces associated with the policy.
Sort policies by Bit Rate and filter by Metric. By default, DMF sorts the policies in descending order of bit rate.
Show All leads to the Policies page.
Switch Health
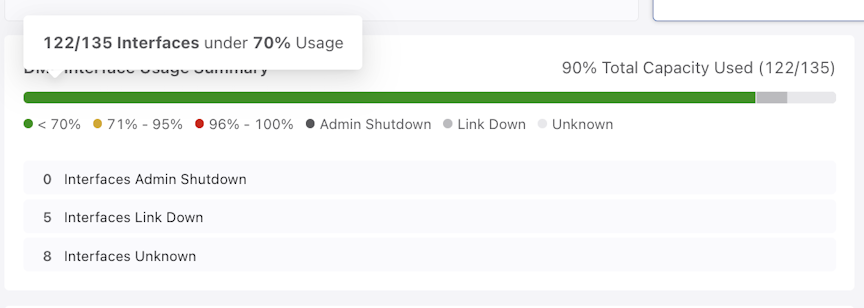
Interface Usage Summary
- Red means that the utilization percentage is greater than 95%.
- Yellow means that the utilization percentage is greater than 70%.
- Green means that the utilization percentage is less than 70%.
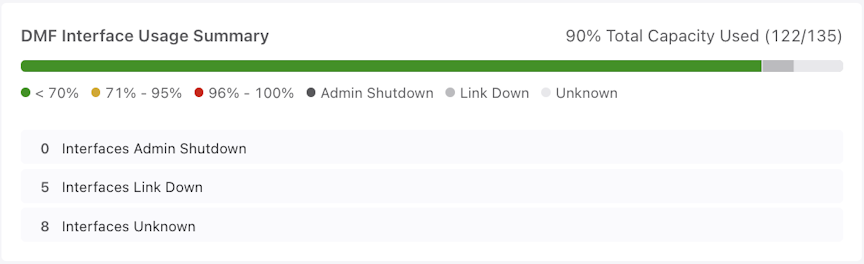
- Admin Shutdown
- Link Down
- Unknown - when Interface Speed is undefined or not known
- Total Capacity Used displays with Total Capacity defined as the number of Active DMF Interfaces divided by the Number of Total DMF Interfaces
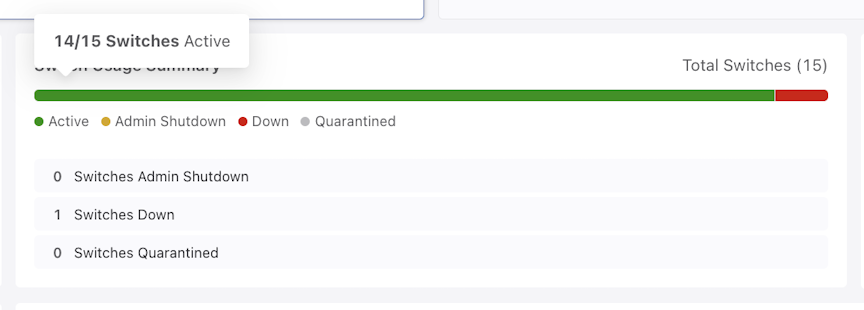
Switch Usage Summary
This widget displays the usage statistics for each switch. All switches are grouped by:
- Active (Green)
- Admin Shutdown (Yellow)
- Down (Red)
- Quarantined (Grey)
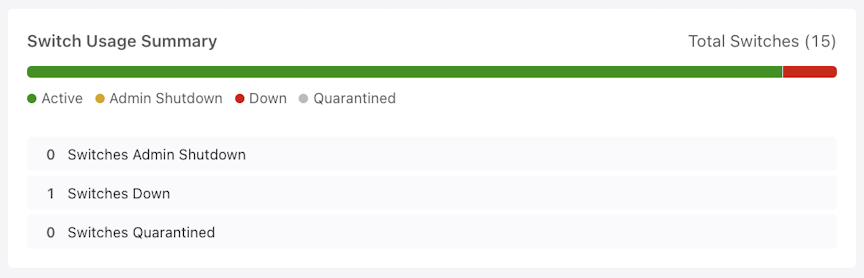
The total number of switches is displayed.
Three list items display the number of:
- Switches Admin Shutdown
- Switches Down
- Switches Quarantined
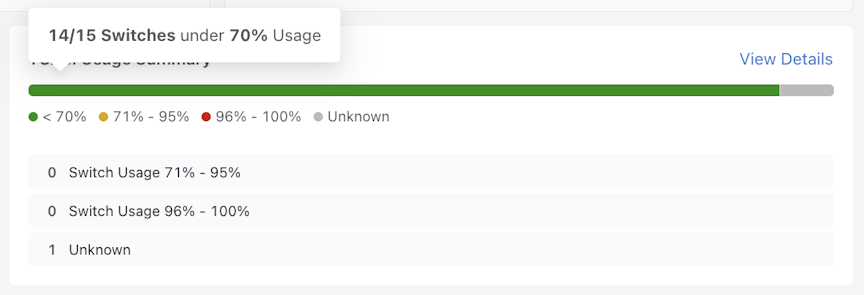
TCAM Usage Summary
This widget displays the usage statistics for the TCAM of each switch and groups all active TCAMs by usage:
- Red means that the utilization percentage is greater than 95%.
- Yellow means that the utilization percentage is greater than 70%.
- Green means that the utilization percentage is less than 70%.
- Grey means that the utilization is Unknown.
- A switch is grouped in the Unknown category when no TCAM usage statistics are available, generally from a switch being shut down or disconnected.
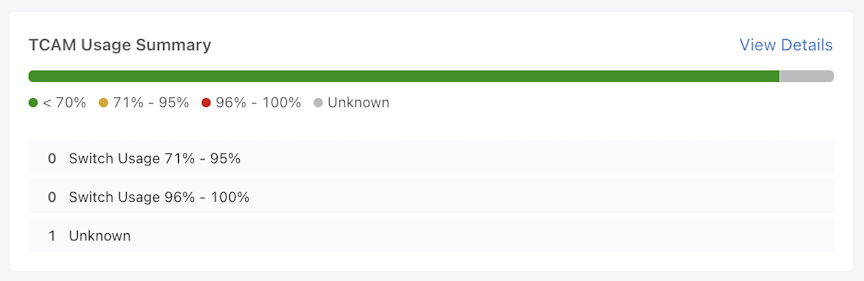
The View Details link leads to the TCAM Utilization tab of the Switches page.
- Switch Usage 71% - 95%
- Switch Usage 96% - 100%
- Unknown
DMF Interface Utilization
DMF Interface Utilization is similar to the data displayed in the Controller Health tab. Please refer to its description for more information.
Switch Utilization
- Switch Usage
- TCAM Usage
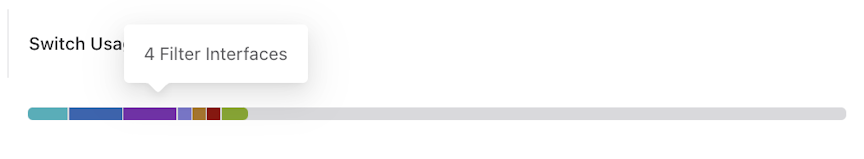
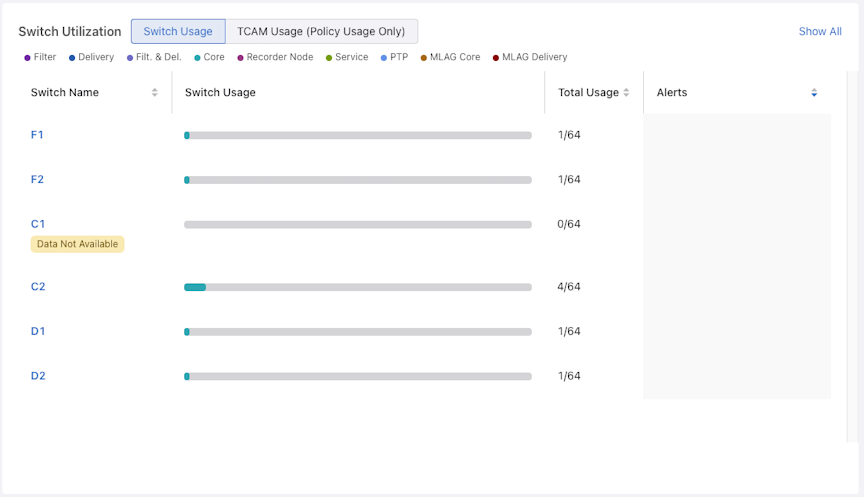
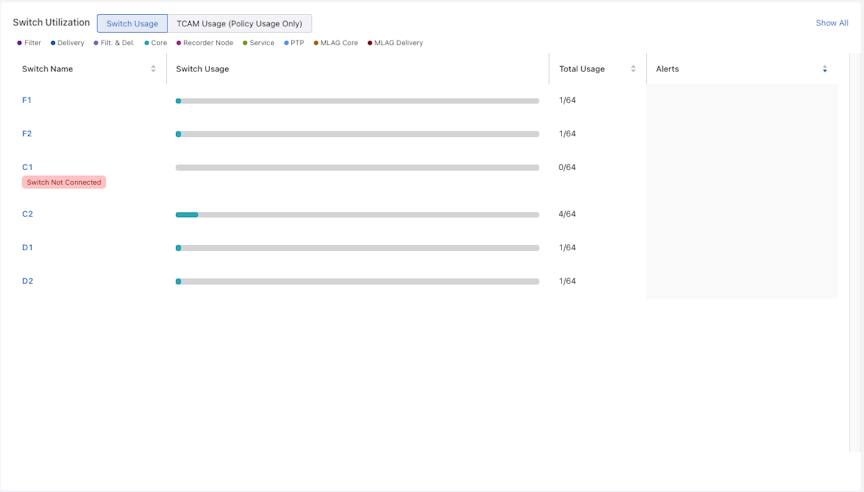
Switch Usage

The widget displays the following data for each switch:
- Switch Name (contains a link to the Switches page for that specific switch).
- Switch Usage: Each section represents the number of interfaces with a specific role.
- Total Usage: Displays the Number of Interfaces with an assigned role divided by the Total Number of Interfaces on the switch.
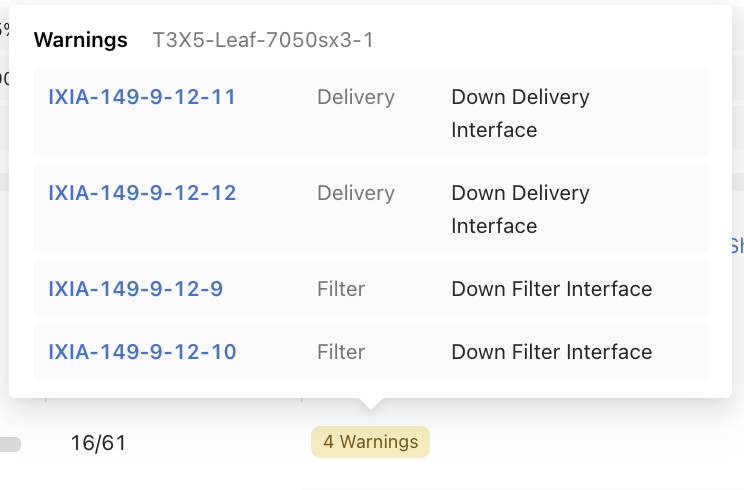
- Alerts: This column displays any alerts related to interfaces.
- The yellow badge indicates the number of warnings, while the red badge shows the number of errors.
- Filter
- Delivery
- Filter and Delivery
- Core
- Recorder Node
- Service
- PTP
- MLAG Core
- MLAG Delivery.
- Sort the Switch Name column in alphabetical order.
- Sort the Total Usage column by percentage (%) usage (# used interfaces / # total interfaces).
- Sort the Alerts column by the total number of alerts (# warnings + # errors).
The default sort order for this table is the Alerts column in descending order, which ensures the switches with the highest number of alerts are initially at the top.
While hovering over the warnings or alerts badge, a table appears and displays Warnings for the yellow badge and Errors for the red badge, and it will also show the switch name.
Each row of the table contains the following:
- Interface name (includes a link to Interfaces/[INTERFACE-NAME] page)
- Interface role
- Alert type (e.g., Down Delivery Interface)
TCAM Usage
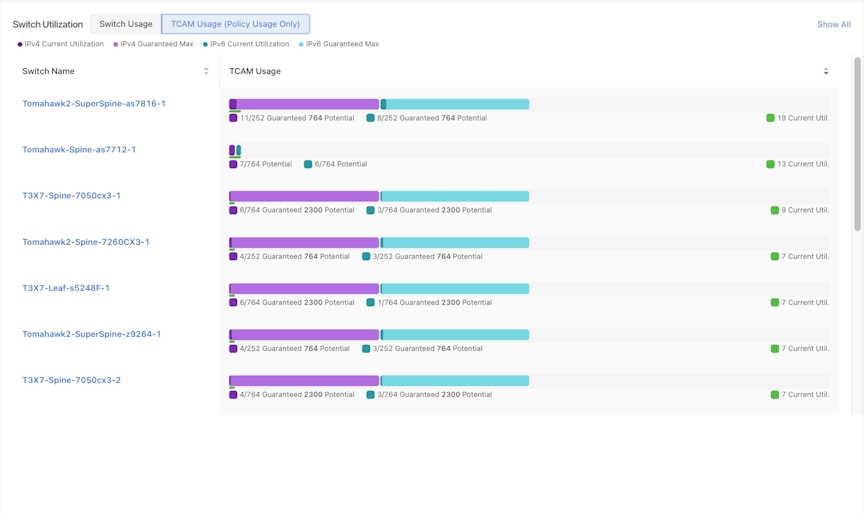
This widget displays a TCAM Usage chart for each switch:
- The purple bar shows IPv4 Current Utilization and Guaranteed Maximum.
- The cyan bar shows IPv6 Current Utilization and Guaranteed Maximum.
- Each row will display Current Utilization (IPv4 + IPv6 Current Utilization)
- Sort by Switch Name and Current Utilization.
- Sort the Switch Name column alphabetically (descending and ascending).
- Sort the Current Utilization column in descending and ascending order (IPv4 + IPv6 Current Utilization).
- The default sort order for the table is the Current Utilization column in descending order, ensuring the switches with the highest current utilization display first.
Top DMF Interfaces by Traffic
- Core
- Delivery
- Filter
- Filter and Delivery
- MLAG Core
- MLAG Delivery
- Recorder Node
- Service
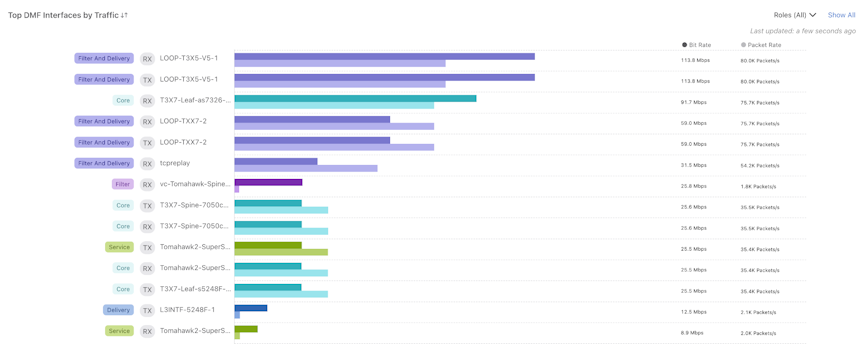
- Interface role
- Traffic direction
- DMF interface name
- Bit rate
- Packet rate
Show All leads to the DMF Interfaces page.

Policy Health
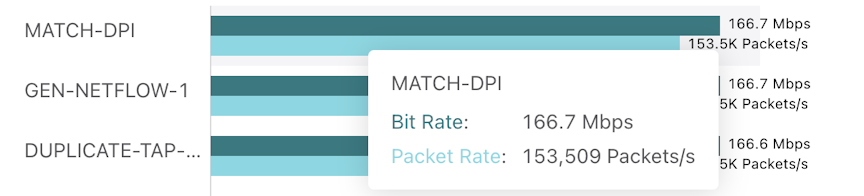
Policies Usage by Traffic
This widget displays policy traffic. For each policy, the bar chart shows:
- Name of the policy
- Bit rate
- Packet rate
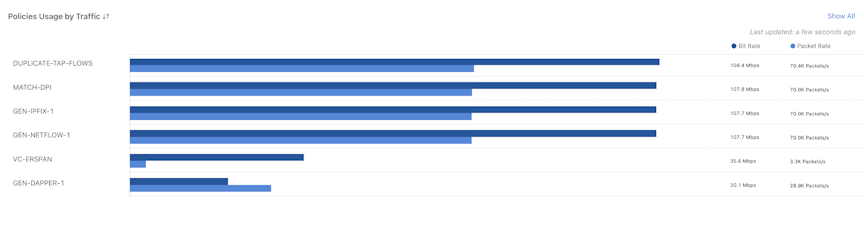
On hover, similar information displays.
Sort policies by Bit Rate.
Show All leads to the Policies page.
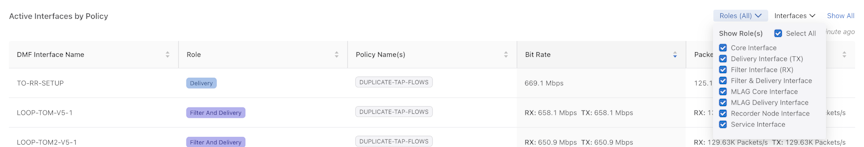
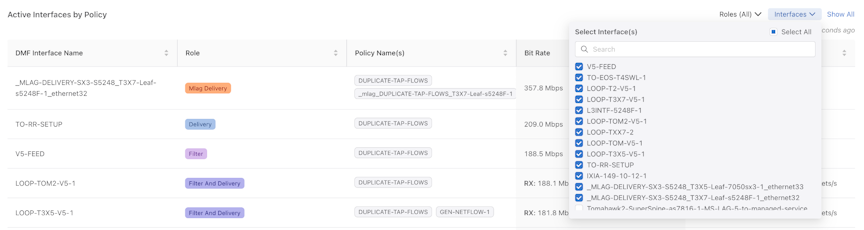
Active Interfaces by Policy
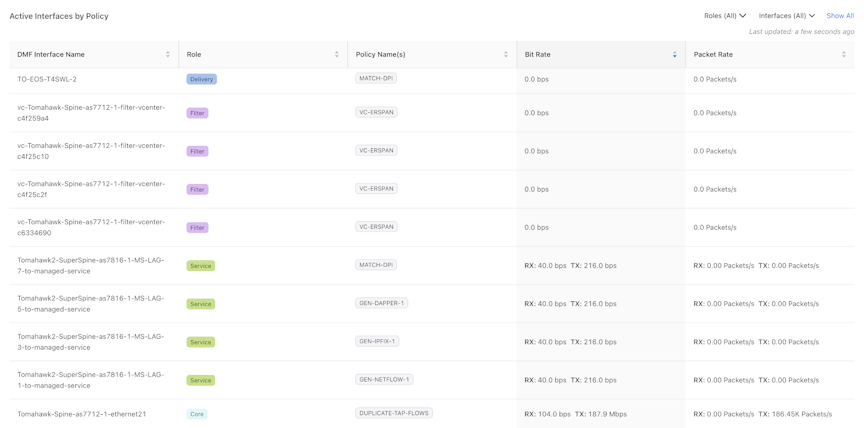
The table contains the following columns:
- DMF Interface Name: The DMF name of the switch interface.
- Role: The role of the interface.
- Policy Name(s): A list of the policies associated with the interface.
- Bit Rate: The bit rate of the interface.
- Packet Rate: The packet rate of the interface.
Show All leads to the DMF Interfaces page.
Sort the table by each column; DMF sorts the items in descending bit rate order by default.
Smart Node Health
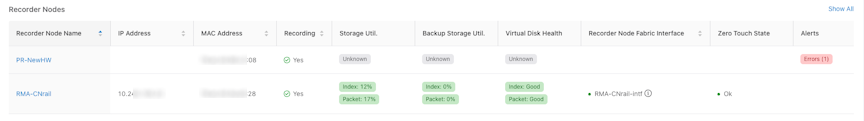
Recorder Node
- Recorder Node Name
- IP Address
- MAC Address
- Recording
- Indicates the status of the Recorder Node recording configuration, either Yes or No.
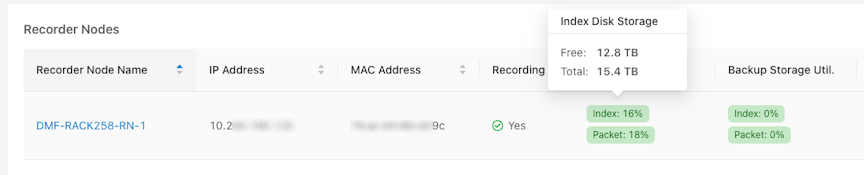
- Storage Utilization
- Index and Packet disk storage utilization % (percentage) using the following colors:
- Red means the utilization percentage is greater than 95%.
- Yellow means the utilization percentage is greater than 70%.
- Green means the utilization percentage is less than 70%.
- Free and Total Disk Usage
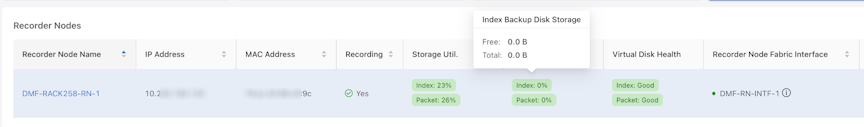
- Backup Storage Utilization
- Index and Packet backup disk storage utilization % (percentage) using the following colors.
- Red means the utilization percentage is greater than 95%.
- Yellow means the utilization percentage is greater than 70%.
- Green means the utilization percentage is less than 70%.
- Virtual Disk Health
- Status of Index and Packet virtual disks:
- Green means the virtual disk’s health is good.
- >Red means the value of the virtual disk’s health is bad.
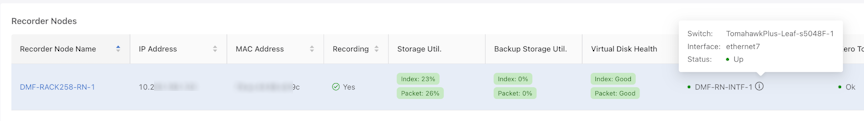
- Recorder Node Fabric Interface
- Shows the DMF interface name and its status where the Recorder Node connects to the DMF Fabric.
- Switch, Interface, and status
- Zero Touch State
- Alerts
- Errors and warnings for the Recorder Node - Hovering over an error displays additional information about the errors and warnings.
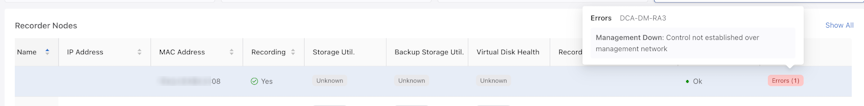
The View All link leads to the Recorder Node page.
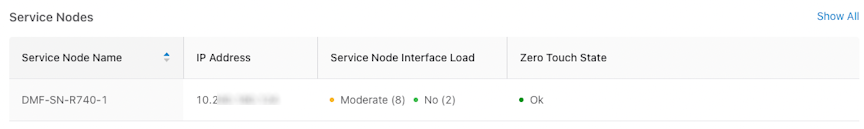
Service Node
- Service Node Name
- IP Address
- Service Node Interface Load
- Zero Touch State
- Interface Name
- Service Name
- Action
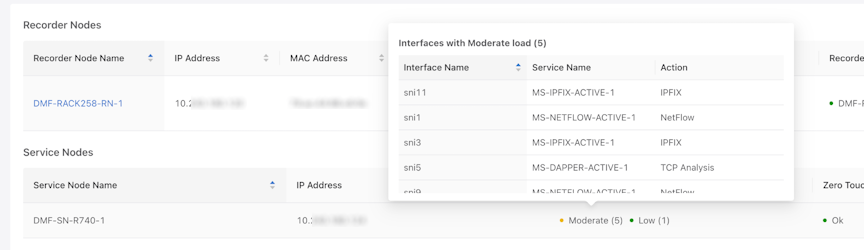
The View All link leads to the Service Node page.
Analytics Node
- IP Address: The configured Analytics Node IP address.
- Selecting the IP Address opens the Analytics Node UI.
- Redis Status
- Displays the status in green if healthy, along with the last updated timestamp.
- Displays the status in red if unhealthy, along with the latest updated timestamp.
- Replicated Redis Status
- Displays the status in green if healthy, along with the latest updated timestamp.
- Displays the status in red if unhealthy, along with the latest updated timestamp
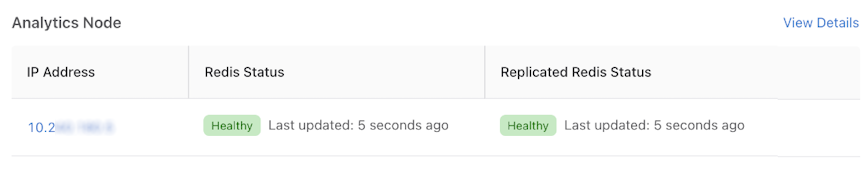
The View Details link leads to the Analytics Node details page.
Refreshing Data
Data automatically refreshes every minute, and interface topology data automatically refreshes every 10 seconds.
Manually refresh dashboard data using Refresh.
Empty State
When there are no provisioned switches, DANZ Monitoring Fabric (DMF) Interface Utilization and Top DMF Interfaces by Traffic will display an Empty Component.
Top Policies will display an Empty Component if no policies exist.
Policies Usage by Traffic displays the same Empty Component as Top Policies.
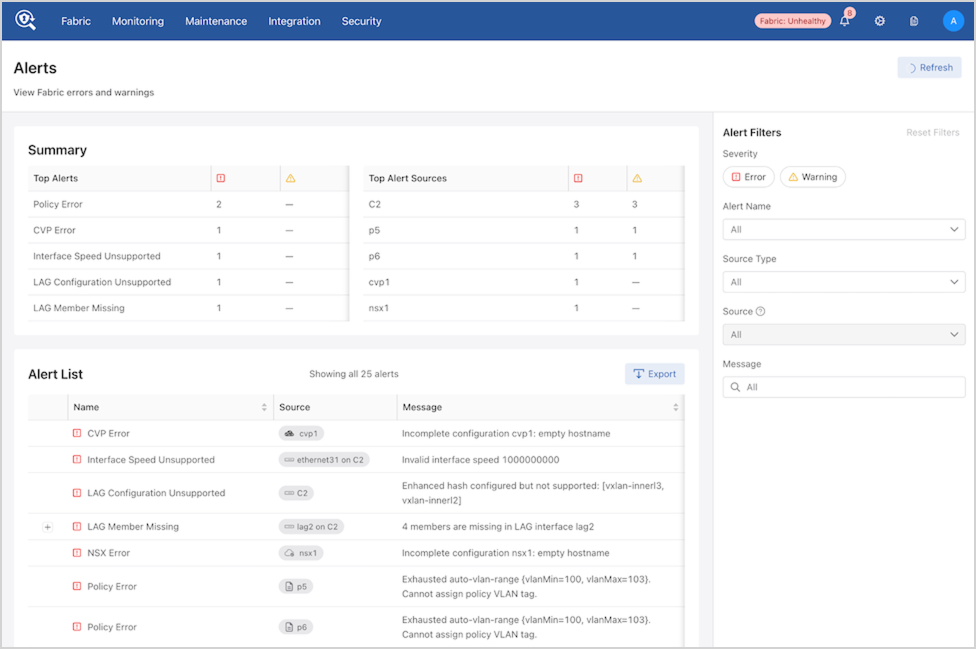
Alerts
The Alerts page is the central hub for monitoring system errors and warnings. It provides a quick summary of critical issues and a detailed list of all active alerts, enabling swift identification, investigation, and subsequent addressing of potential problems within the fabric.
Key Features:
- Enhanced Visibility: A clear summary section at the top provides an immediate snapshot of the most critical alerts.
- Intuitive Filtering: A dedicated Alert Filters panel makes it easier to narrow down alerts based on severity, name, source, and message.
- Detailed Alert List: The Alert List offers a comprehensive view with sortable columns and expandable details for each alert.
- Improved User Experience: Streamlined navigation and a clean layout ensure a more efficient workflow.
Navigation
Navigate to the Alerts page by selecting the notification icon in the navigation bar.

DMF displays a summary of fabric alerts. Select View All to proceed to the Alerts page.
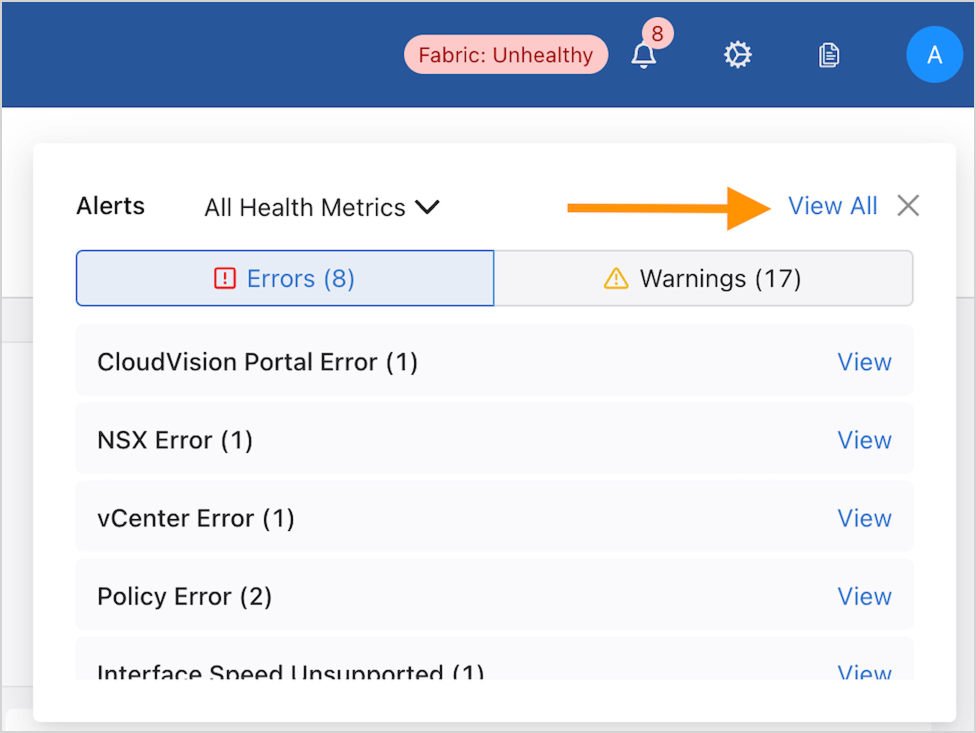
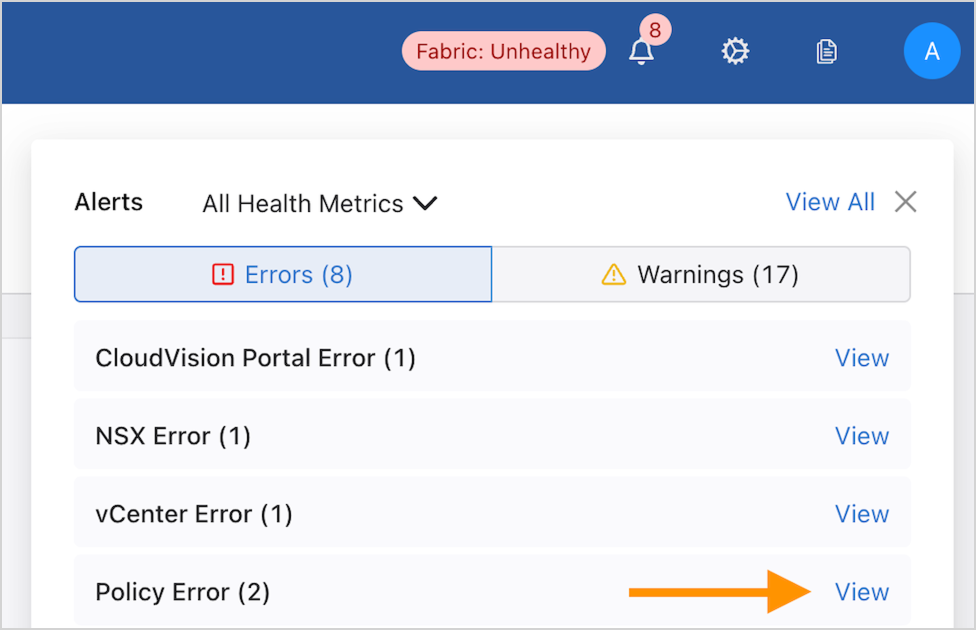
The Alerts dashboard displays the current list of Alerts and Warnings.
Select View to display a specific alert.
Summary
The Summary section provides a high-level overview of the most frequent and impactful alerts.
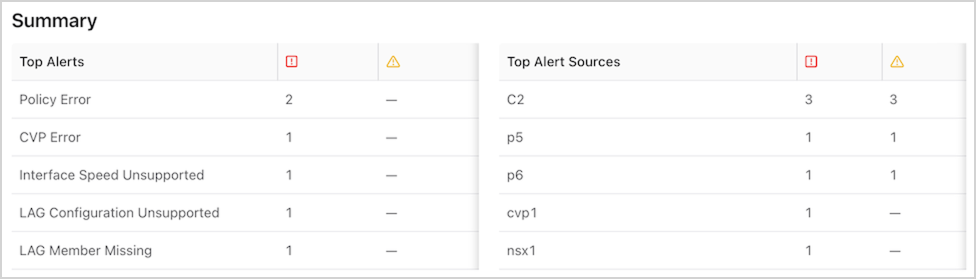
The Summary section contains two key areas:
Top Alerts
Top Alerts displays the top 5 names of the current and most prevalent alerts and the count of active instances for each:
- Total: The total number of active alerts for that specific alert name.
- Error (Red Square): The count of alerts categorized as Error severity.
- Warning (Yellow Triangle): The count of alerts categorized as Warning severity.
Top Alert Sources
Top Alert Sources highlights the top 5 sources (e.g., specific devices and policies) generating the most alerts. Similar to Top Alerts, it shows:
- Total: The total number of alerts originating from that specific source.
- Error (Red Square): The count of alerts categorized as Error severity from that source.
- Warning (Yellow Triangle): The count of alerts categorized as Warning severity from that source.
Alert Filters
The Alert Filters section is a powerful tool for refining alert views. Combine multiple filters to pinpoint specific issues. When filters are applied, DMF updates both the Summary and Alert List sections.
-
Severity
- Error: Displays only alerts categorized as errors.
- Warning: Displays only alerts categorized as warnings.
Figure 104. Severity 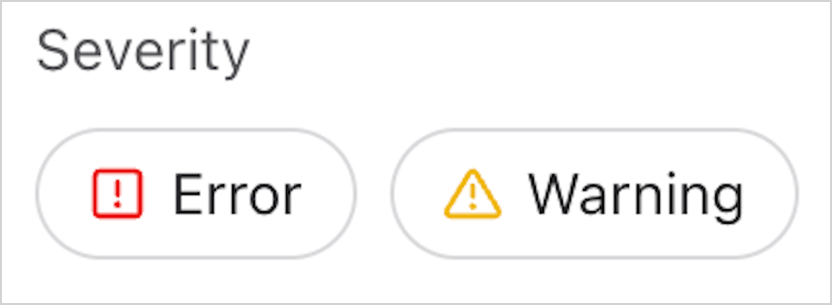 Note: Select or deselect both Error and Warning to view all alerts.
- Alert Name: Use the drop-down menu to select a specific or multiple alert names to filter the list.
Figure 105. Alert Name 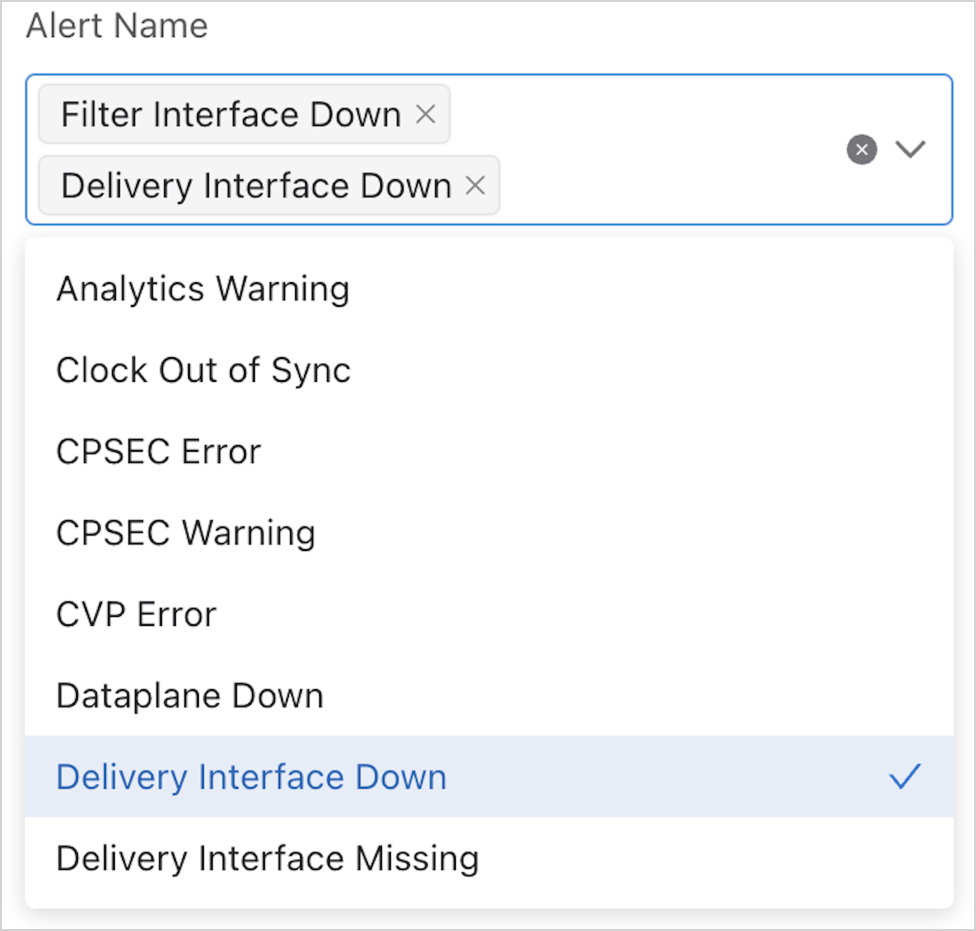
- Source Type: Use the drop-down menu to select a specific type of source (e.g., switch, policy, etc.).
Figure 106. Source Type 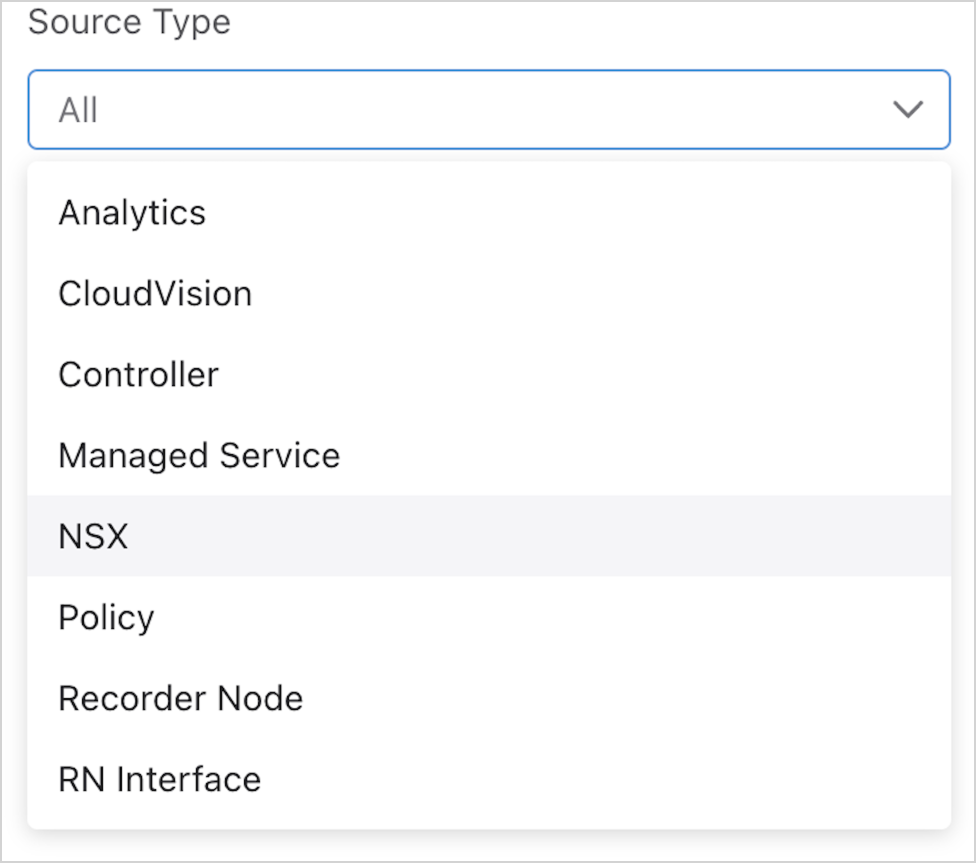
- Source: If a Source Type is selected, the Source drop-down lists all the source names (e.g., switch names, policy names, etc.) used by the alert source as filters.
Figure 107. Source 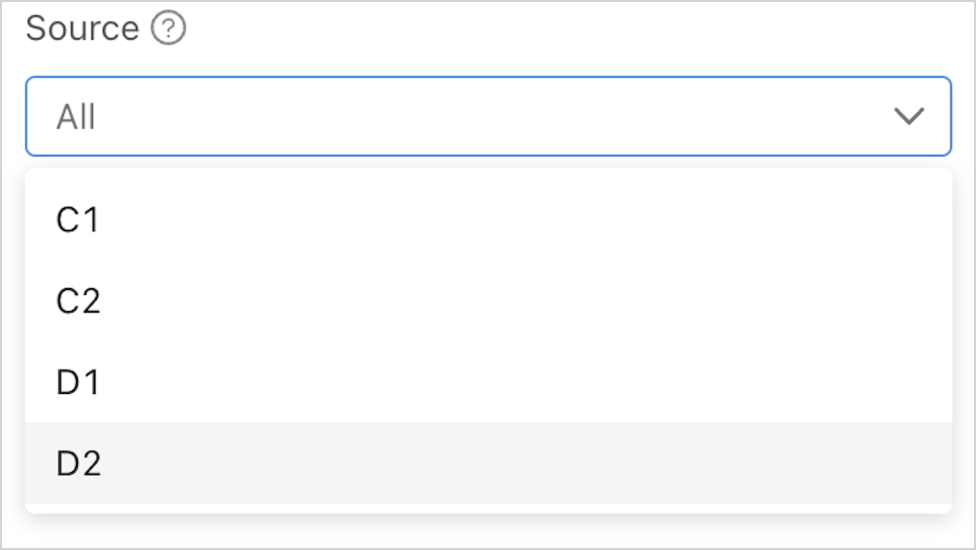 Note: The Source drop-down is enabled only when selecting one Source Type.
 - Message: Enter keywords or phrases into the search text box to filter alerts based on their message content.
Figure 108. Message 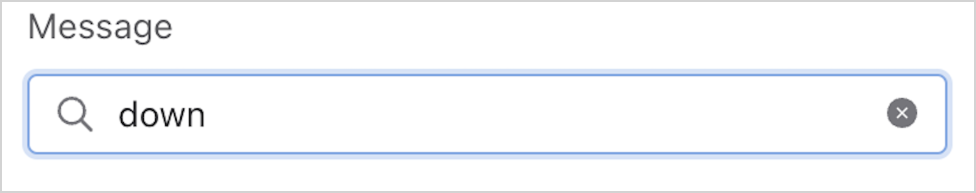
Reset Filters: In the Alert Filters section, select Reset Filters to clear all applied filters and view all alerts again.
Alert List
The Alert List section provides a comprehensive view of all active alerts based on the applied filters.
- Columns: The list includes the following columns:
- Name: The name of the alert.
- Source: The origin of the alert (e.g., policy name, switch name, etc.).
- Message: A brief description of the alert.
- Sorting: Sort the list by Name or Source by selecting the respective column headers. An arrow indicates the current sort order (ascending or descending).
- Expanding Alert Details: For some alerts, an expand icon appears next to the alert name. Selecting the icon displays additional details about the alert.
Figure 109. LAG Member Missing 
Figure 110. Inactive Policy 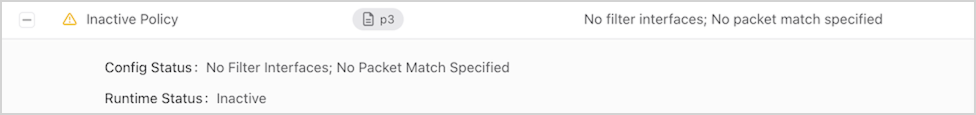
- Export: Select Export to download the current list of alerts to a file (CSV or JSON file), which can be useful for further analysis or record-keeping.
show fabric
warnings command.Using the Command Line Interface
config-switch submode for each switch. Do not log in to the switch to make changes directly using the switch CLI.- login mode: commands available immediately after logging in, with the broadest possible context.
- enable mode: commands that are available only after entering the enable command.
- config mode: commands that significantly affect system configuration and can only be entered after entering the
configurecommand. The user can also access submodes from this mode.
Enter submodes from config mode to provision specific monitoring fabric objects. For example, the switch switchname command changes the CLI prompt to (config-switch)# and lets the user configure the switch identified by the switch name.
controller-1>
controller-1> enable
controller-1#
(config)#, as shown below:
controller-1> config
controller-1(config)#
controller-1(config)# switch filter-switch-1
controller-1(config-switch)# interface ethernet54
controller-1(config-switch-if)#
controller-1(config)# end
controller-1#
controller-1(config-switch-if)# show this
! switch
switch filter-switch-1
interface ethernet54
controller-1(config-switch-if)# show this details
! switch
switch filter-switch-1
!
interface ethernet54
no force-link-up
no optics-always-enabled
no shutdown
controller-1> help
For help on specific commands: help <command>
Commands:
%<n>                     Move job to foreground
debug
echo                     Print remaining arguments
enable                   Enter enable mode
exit                     Exit submode
help                     Show help
history                  Show commands recently executed
logout                   Logout
no                       Prefix existing commands to delete item
ping                     Send echo messages
ping6                    Send echo messages
profile                  Configure user profile
reauth                   Reauthenticate
set                      Manage CLI sessions settings
show
support                  Generate diagnostic data bundle for technical support
terminal                 Manage CLI sessions settings
topic                    Show documentation on topic
upload                   Upload diagnostic data bundle for technical support
watch                    Show output of other commands
whoami                   Identify the current authenticated account
workflow                 Show workflow documentation
controller-1>
controller-1> help support
Support Command:         Generate diagnostic data bundle for technical support
Support Command Syntax:  no support skip-switches skip-cluster skip-service-nodes
                         skip-recorder-nodes sequential support [[skip-switches]
                         [skip-cluster] [skip-service-nodes]
                         [skip-recorder-nodes] [sequential]]
Next Keyword Descriptions:
sequential:              Use sequential (non-parallel) fallback collection mode, which will be
                         slower but use fewer resources.
skip-cluster:            Skip cluster information from the collection.
skip-recorder-nodes:     Skip recorder nodes information from the collection.
skip-service-nodes:      Skip service nodes information from the collection.
skip-switches:           Skip switches information from the collection.
Support Command:         Generate diagnostic data bundle for technical support
Support Command Syntax:  no support skip-switches skip-cluster skip-service-nodes
                         skip-recorder-nodes sequential support [[skip-switches]
                         [skip-cluster] [skip-service-nodes] [skip-recorder-nodes] [sequential]]
Next Keyword Descriptions:
sequential:              Use sequential (non-parallel) fallback collection mode, which will be
                         slower but use fewer resources.
skip-cluster:            Skip cluster information from the collection.
skip-recorder-nodes:     Skip recorder nodes information from the collection.
skip-service-nodes:      Skip service nodes information from the collection.
skip-switches:           Skip switches information from the collection.
controller-1>
controller-1> support ?
<cr>
sequential               Use sequential (non-parallel) fallback collection mode, which will be
                         slower but use fewer resources.
skip-cluster             Skip cluster information from the collection.
skip-recorder-nodes      Skip recorder nodes information from the collection.
skip-service-nodes       Skip service nodes information from the collection.
skip-switches            Skip switches information from the collection.
controller-1>
controller-1> support <TAB>
<cr> sequential skip-cluster
skip-recorder-nodes skip-service-nodes skip-switches
controller-1>
For information about managing administrative access to the DMF Controller, refer to the DANZ Monitoring Fabric Deployment Guide.