DMF Recorder Node
- Installing and configuring DMF Recorder Node: DANZ Monitoring Fabric Deployment Guide
- Integrating DMF Recorder Node with Analytics: Arista Analytics User Guide
- Stenographer Queries: Stenographer Reference for DMF Recorder Node
- DMF Recorder Node REST API: DMF Recorder Node REST APIs
Overview
The DANZ Monitoring Fabric (DMF) Recorder Node (RN) integrates with the DMF for single-pane-of-glass monitoring. A single DMF Controller can manage multiple RNs, delivering packets for recording through Out-of-Band policies. The DMF Controller also provides central APIs for packet queries across one or multiple RNs and for viewing errors, warnings, statistics, and the status of connected RNs.
A DMF out-of-band policy directs matching packets for recording to one or more RNs. An RN interface identifies the switch and port used to attach the RN to the fabric. A DMF policy treats these as delivery interfaces and adds them to the policy so that flows matching the policy are delivered to the specified RN interfaces.
Configuration Summary
At a high level, perform the following steps to configure the Recorder Node (RN).
Step 1: Add the RN instance to the DMF Controller.
Step 2: Define DMF policy to select the traffic to forward to the RN.
Step 3: View and analyze the recorded traffic.
Refer to the Recorder Node User Interface section and the Arista Analytics User Guide for more information.
Indexing Configuration
The Recorder Node (RN) indexing configuration defines the fields used to query packets on the RN. By default, DMF enables all indexing fields in the indexing configuration. Selectively disable the specific indexing fields not required in RN queries.
Disabling indexing fields has two advantages. First, it reduces the index space required for each packet recorded. Second, it improves query performance by reducing unnecessary overhead. Arista recommends disabling unnecessary indexing fields.
- MAC Source
- MAC Destination
- VLAN 1: Outer VLAN ID
- VLAN 2: Inner/Middle VLAN ID
- VLAN 3: Innermost VLAN ID
- IPv4 Source
- IPv4 Destination
- IPv6 Source
- IPv6 Destination
- IP protocol
- Port Source
- Port Destination
- MPLS
- Community ID
- MetaWatch Device ID
- MetaWatch Port ID
To understand leveraging an indexing configuration, consider the following examples:
Example 1: To query packets based on applications defined by unique transport ports, disable all indexing fields except source and destination transport ports, saving only transport ports as metadata for each packet recorded. This technique greatly reduces per-packet index space consumption and increases RN query speed.
However, this will impact an effective query on any other indexing field because that metadata was not saved when the packets were recorded.
Example 2: The RN supports community ID indexing, a hash of IP addresses, IP protocol, and transport ports that identify a flow of interest. Suppose the RN use case is to query based on community ID. In that case, indexing on IPv4 source and destination addresses, IPv6 source and destination addresses, IP protocol, and transport port source and destination addresses might be redundant.
Pre-buffer Configuration and Events
The Recorder Node (RN) pre-buffer is a circular buffer recording received packets. When enabled, the pre-buffer feature allows for the retention of the packets received by the RN for a specified length of time prior to an event that triggers the recording of buffered and future packets to disk. Without an event, the RN will record into this buffer, deleting the oldest packets when the buffer reaches capacity.
When an RN event is triggered, DMF saves packets in the pre-buffer to disk. The packets received from the time of the event trigger to the time of the event termination are saved directly to disk upon termination of the event. However, the received packets are also retained in the pre-buffer until the next event is triggered. By default, the pre-buffer feature is disabled, indicated by a value of zero minutes.
For example, when configuring the pre-buffer to thirty minutes, the buffer will receive up to thirty minutes of packets. When triggering an event, DMF records the packets currently in the buffer to disk, and packets newly received by the RN bypass the buffer and are written directly to disk until the termination of the event. When terminating the event, the pre-buffer resets, accumulating received packets for up to the defined thirty-minute pre-buffer size.
The packets affiliated with an event can be queried, replayed, or analyzed using any RN query. Each triggered event is identified by a unique, user-supplied name, used in the query to reference packets recorded in the pre-buffer before and during the event.
Using an Authentication Token
When using a DANZ Monitoring Fabric (DMF) Controller authentication token, the Recorder Node (RN) treats the DMF Controller as an ordinary client, requiring it to present valid credentials either in the form of an HTTP basic username and password or an authentication token.
Static authentication tokens are pushed to each RN as an alternative form of authentication in headless mode when the DMF Controller is unreachable or by third-party applications that do not have or do not need Controller credentials.
Recorder Node User Interface
Overview
DANZ Monitoring Fabric (DMF) 8.7.0 introduces a redesigned Recorder Node (RN) UI with an improved configuration workflow, monitoring page, and query features.
Features and Functions
There are several functions used in the DMF Recorder Node that are used throughout the user interface (UI).
These include:
| Search and Filtering | Cancel | |||
|---|---|---|---|---|
| Column Sorting
Ascending or Descending |
Window Controls
Move, Minimize, Expand, Close |
|||
| Refresh Data Immediately | Information | |||
| Create Policy | Edit | |||
| Collapse Extra Settings | Delete | |||
| Show Extra Settings | Error Condition | |||
| Create | Warning Condition | |||
| Unit Display
Bit Rate Packet Rate Utilization |
Expand Window | |||
| Export Data | Show or Hide Columns | |||
| Save
Settings or Configuration |
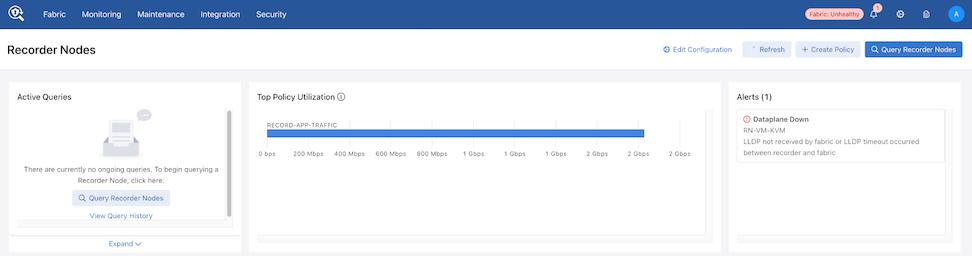
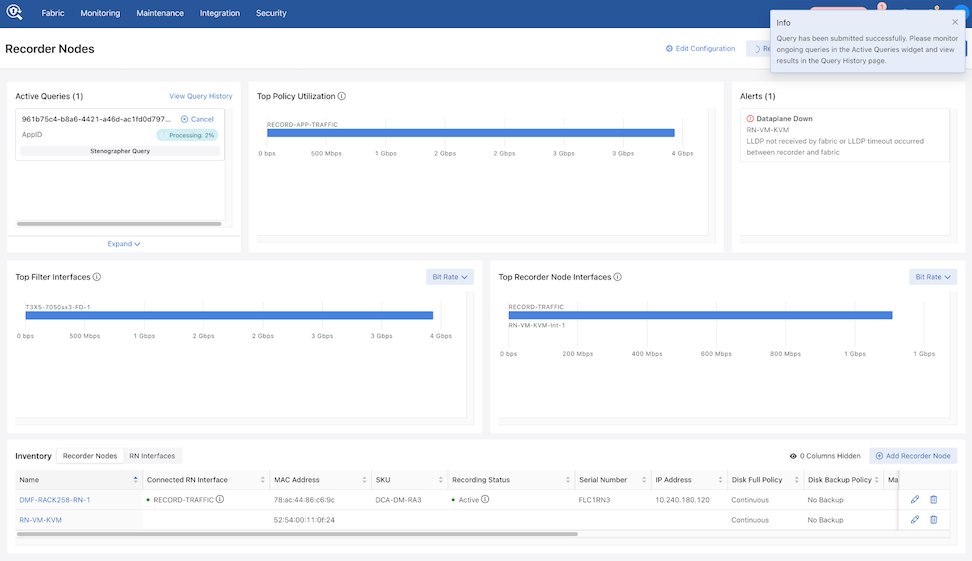
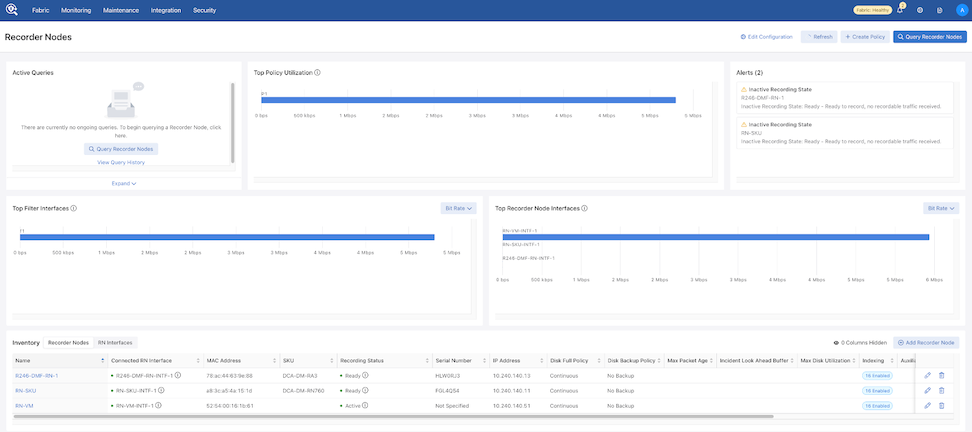
Recorder Node Dashboard Layout
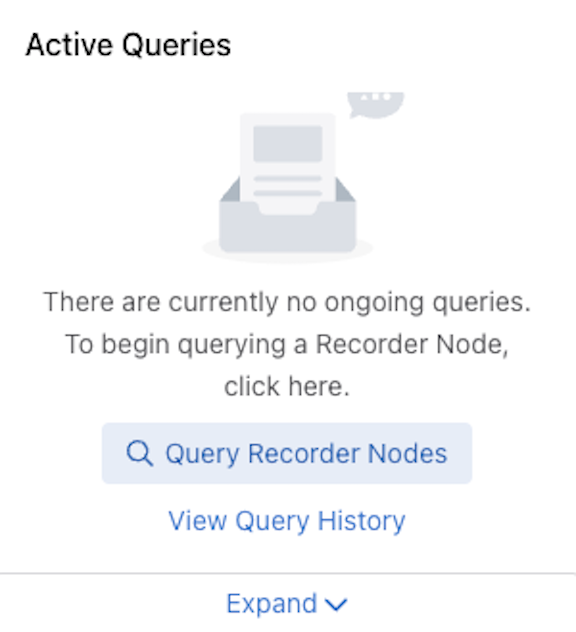
Active Queries: Expand the Active Queries widget to view ongoing queries.
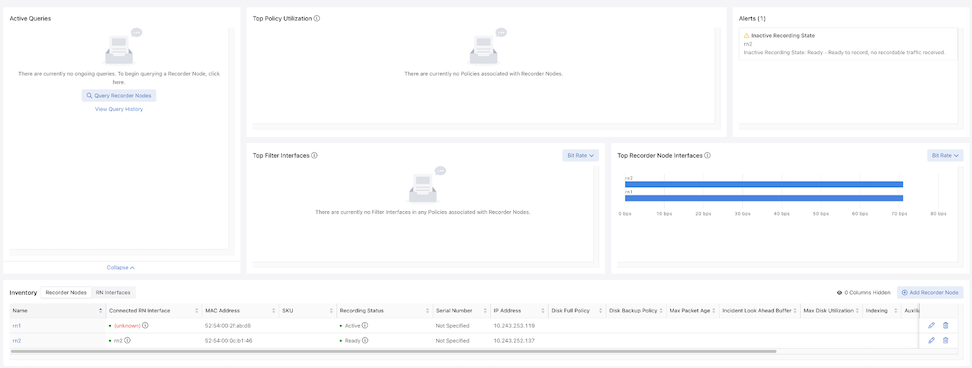
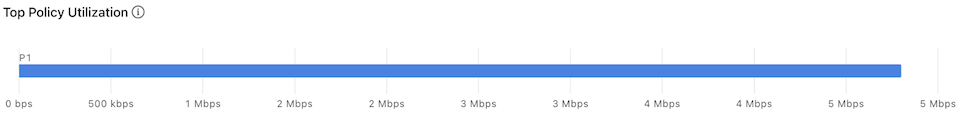
Top Policy Utilization: The chart displays up to 5 top policies associating the Recorder Node interfaces with their respective bit rates.
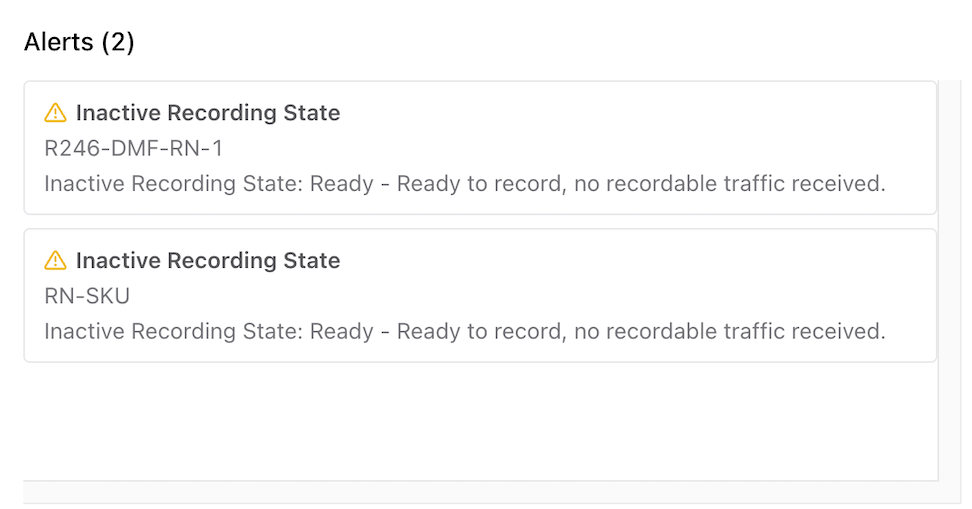
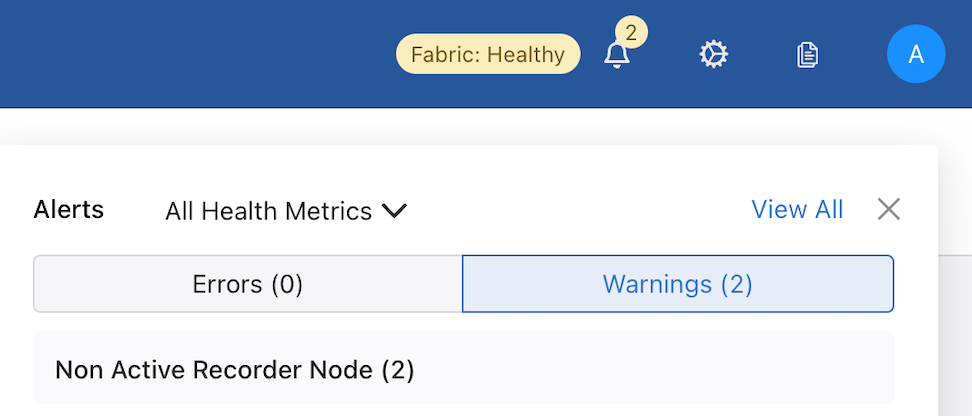
Alerts: The Alerts widget displays Recorder Node warnings or errors. Any errors appear in the Alerts drop-down in the menu bar.
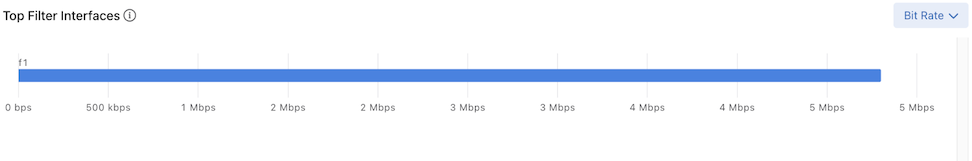
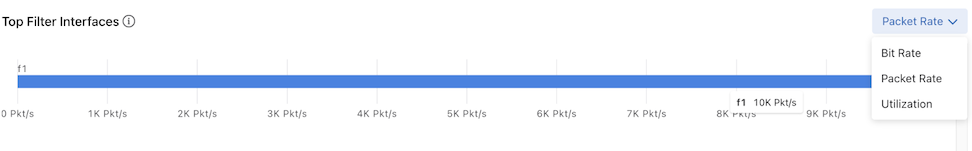
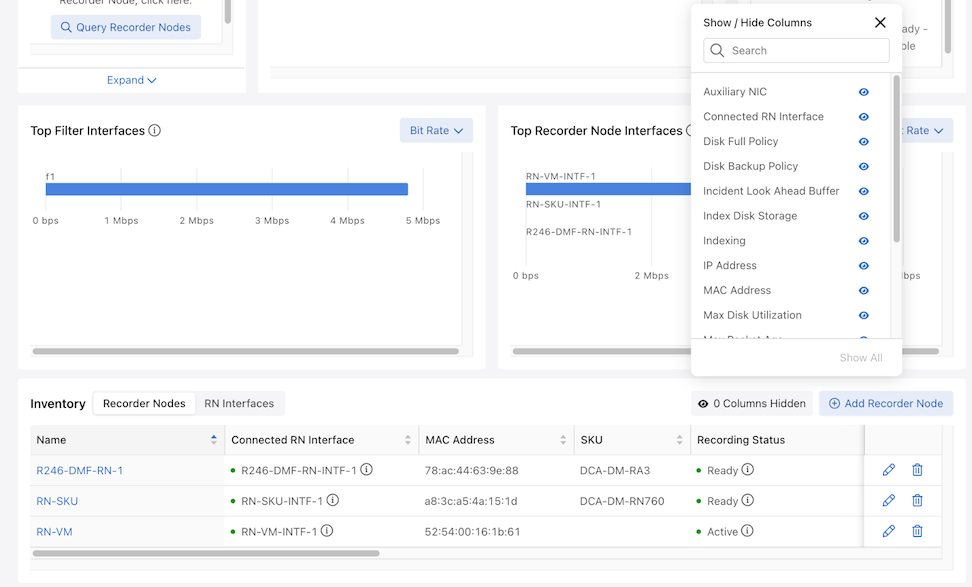
Top Filter Interfaces: Top Filter Interfaces displays the Top Filter Interfaces (up to five) attached to a policy with associated Recorder Node interfaces. Select the Unit drop-down to update the data with the selected unit type. The selection persists until changed. Hovering over a bar displays the throughput for the interface.
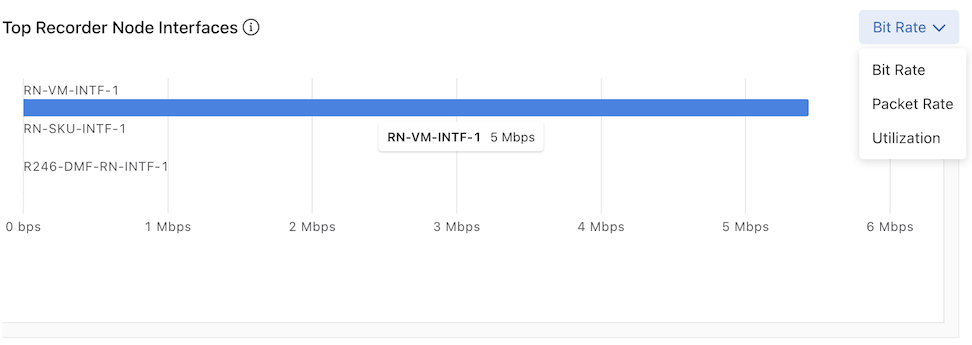
Top Recorder Node Interfaces: Top Recorder Node Interfacesdisplays the Top Recorder Node Interfaces (up to five) attached to a policy with associated Recorder Node interfaces. Select the Unit drop-down to update the data with the selected unit type. The selection persists until changed. Hovering over a bar displays the throughput for the interface.
Inventory Table:
The Inventory Table is located in the lower section of the Recorder Nodes dashboard and displays all Recorder Node instances configured on the DMF Fabric. Selecting RN Interfaces displays all Recorder Node Interfaces configured in DMF.
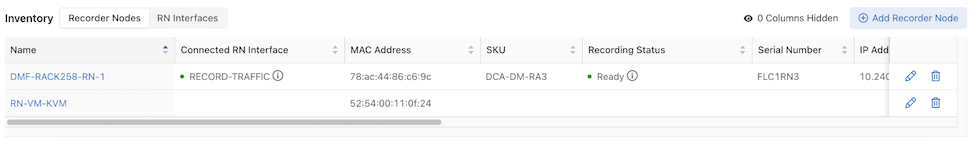
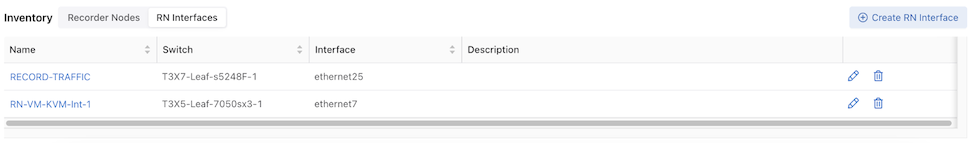
Select Edit to modify the Edit Recorder Node Interface or Edit Recorder Node configuration.
Onboard a Recorder Node
- Select from the main menu bar of the DANZ Monitoring Fabric (DMF) GUI.
Figure 13. Recorder Nodes 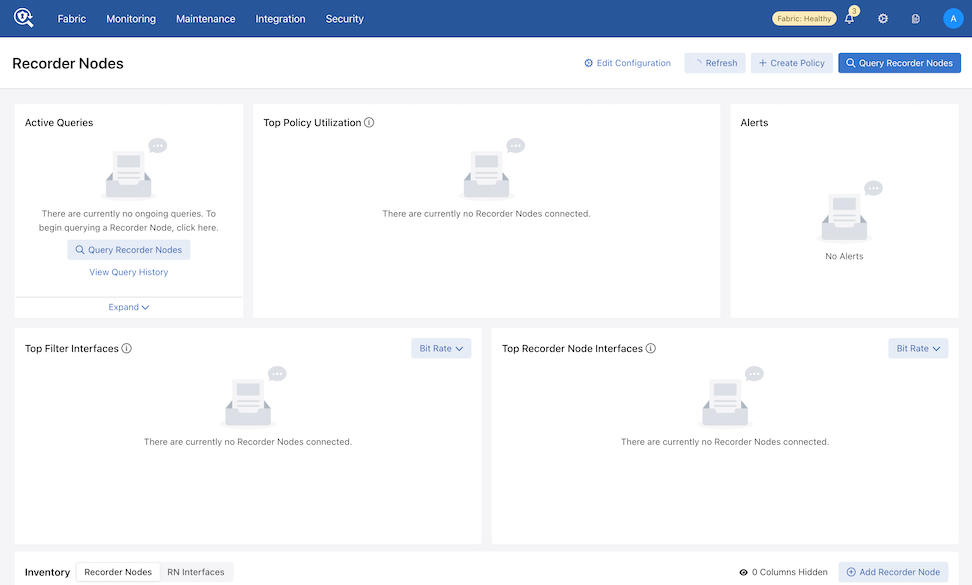
- To add a new RN, select the Add Recorder Node (Recorder Nodes tab active) in the Inventory section.
Figure 14. Provision Recorder Node 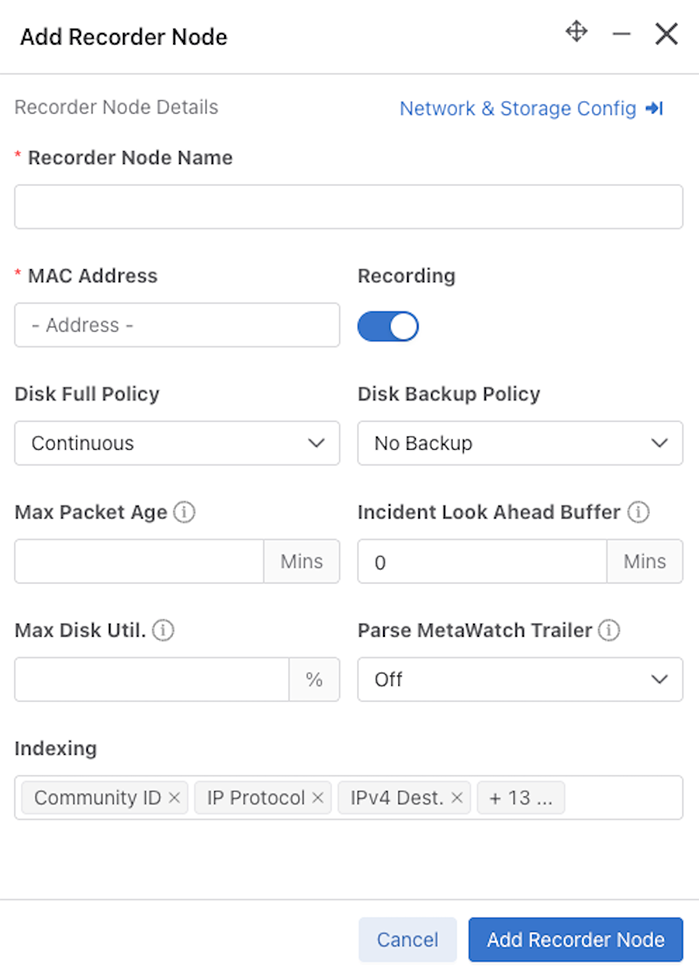
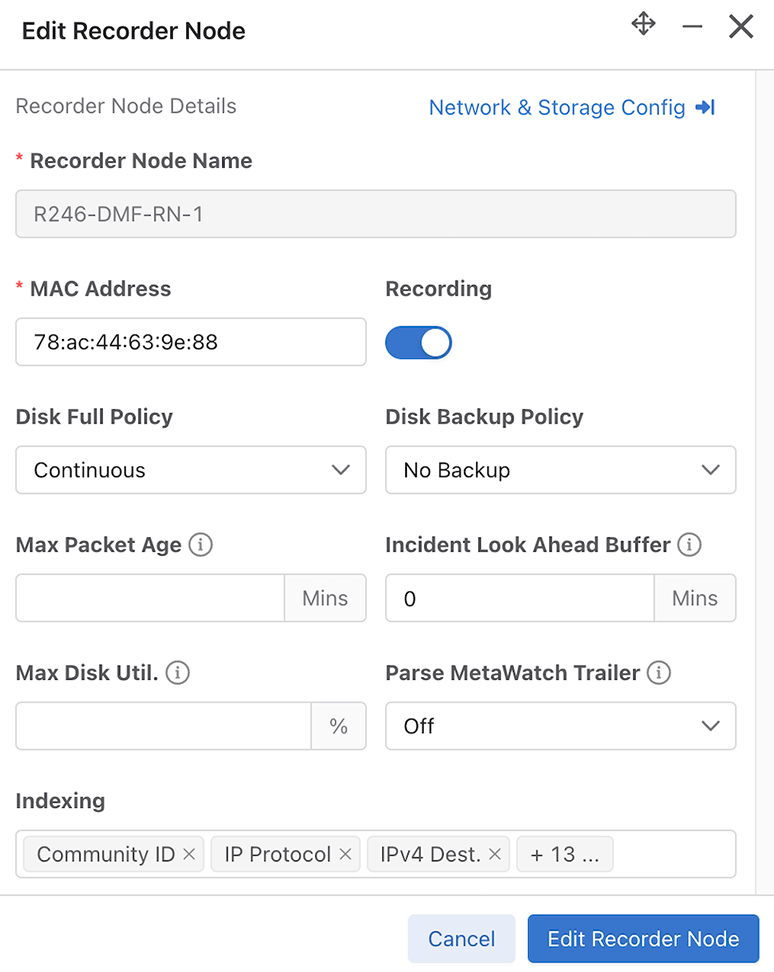
- Enter the following information in the required fields:
- Assign a name to the RN.
- Set the MAC Address of the RN. Obtain the MAC address from the chassis ID of the connected device, using the .
Figure 15. Connected Devices 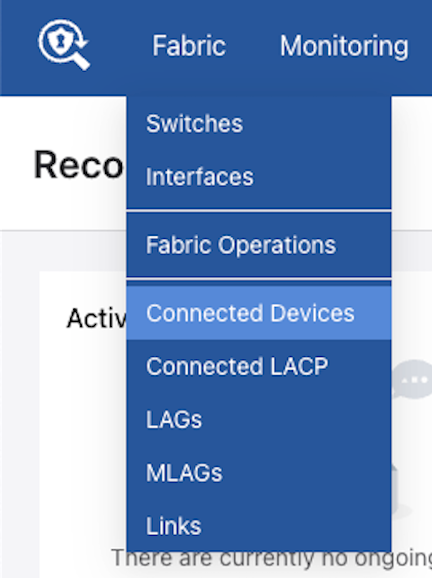
- Configure network and storage settings selecting Network & Storage Config.
In order to store packets on external storage using an NFS mount, connect the Recorder Node's (RN) auxiliary interface to the same network and subnet where the NFS storage resides, as displayed in the figure below.
Figure 16. Topology to Use External Storage 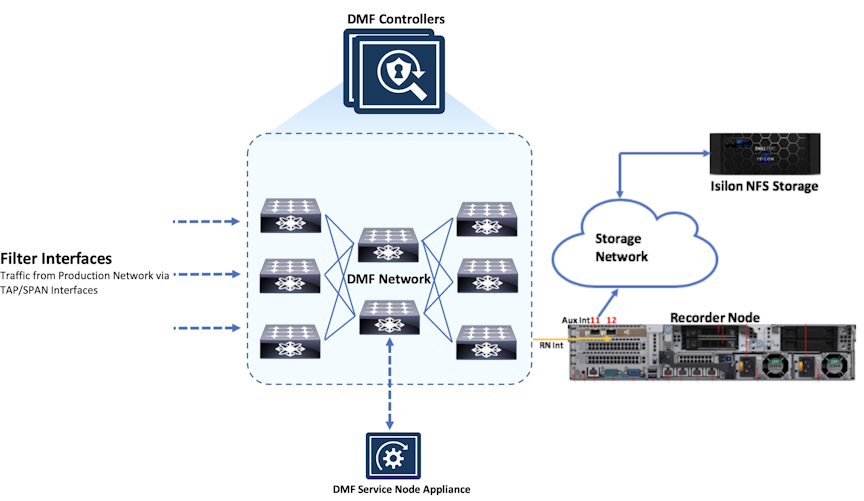 Note: Create the volume for the index and packet on the NFS storage first. Refer to the vendor-specific NFS storage documentation about creating the volume (or path).
Figure 17. Network & Storage Settings 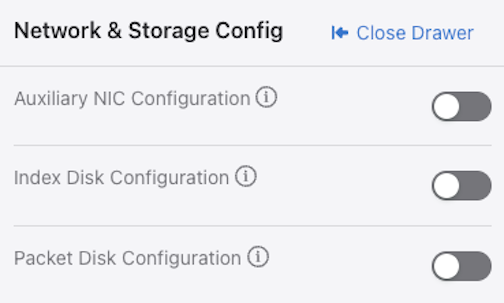
- Auxiliary NIC Configuration: Move the toggle switch to On.
Enter the IP Address and Mask. These are required fields.
Figure 18. Auxiliary NIC Configuration 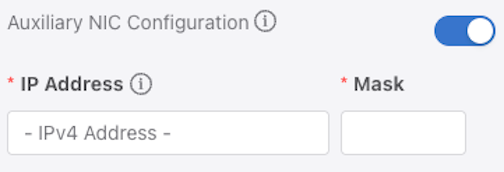
- Index Disk Configuration: Move the toggle switch to On.
Enter the NFS Server as an IP address or hostname. For external NFS storage, such as Isilon, connect the auxiliary interface of the RN to a network and subnet that is reachable to Isilon NFS storage. When recording to an Isilon cluster over NFS with SmartConnect, the name of the storage pool can be specified. SmartConnect requires this name be registered as an A record pointing to the SmartConnect VIP in the DNS server used by the recorder node. The recorder will establish many mount points to the provided volume name in this storage pool. Each mount point will resolve to a different node in the storage pool, allowing the recorder to distribute recorded packets and metadata across multiple nodes in parallel.Enter the Volume: Specify the storage location or path on the NFS server for the Index Disk.Enter the Transport Port of NFS Service details. DMF uses the default value (2049) if no value is specified. Specify a value if the NFS storage has been configured to use something other than the default value.
Figure 19. Index Disk Configuration 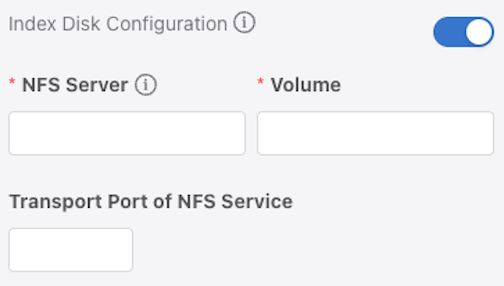
- Packet Disk Configuration: Move the toggle switch to On.
Enter the NFS Server as an IP address or hostname. For external NFS storage, such as Isilon, connect the auxiliary interface of the RN to a network and subnet that is reachable to Isilon NFS storage. When recording to an Isilon cluster over NFS with SmartConnect, the name of the storage pool can be specified. SmartConnect requires this name be registered as an A record pointing to the SmartConnect VIP in the DNS server used by the recorder node. The recorder will establish many mount points to the provided volume name in this storage pool. Each mount point will resolve to a different node in the storage pool, allowing the recorder to distribute recorded packets and metadata across multiple nodes in parallel.Enter the Volume: Specify the storage location or path on the NFS server for the Packet Disk.Enter the Transport Port of NFS Service details. DMF uses the default value (2049) if no value is specified. Specify a value if the NFS storage has been configured to use something other than the default value.
Figure 20. Packet Disk Configuration 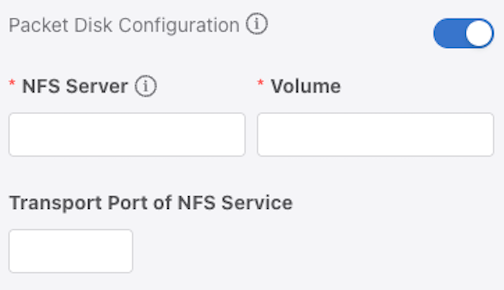
- Auxiliary NIC Configuration: Move the toggle switch to On.
- Select Add Recorder Node to save and close the configuration page.
Figure 21. Provision Recorder Node-Indexing 
dmf-controller-1># restart recorder-node rn-name application
Configure a Recorder Node Interface
- To add a new RN interface, select the RN Interfaces tab in the Inventory section.
Figure 22. Create DMF Recorder Node Interface 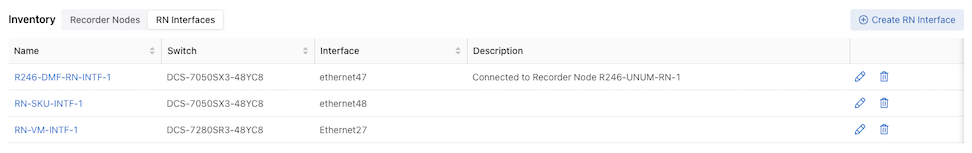
- Select Create RN Interface.
Figure 23. Create Recorder Node Interface 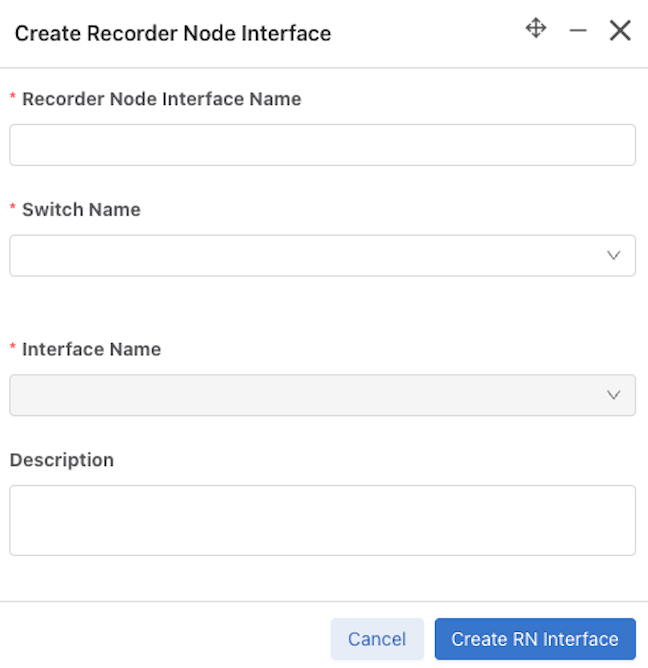
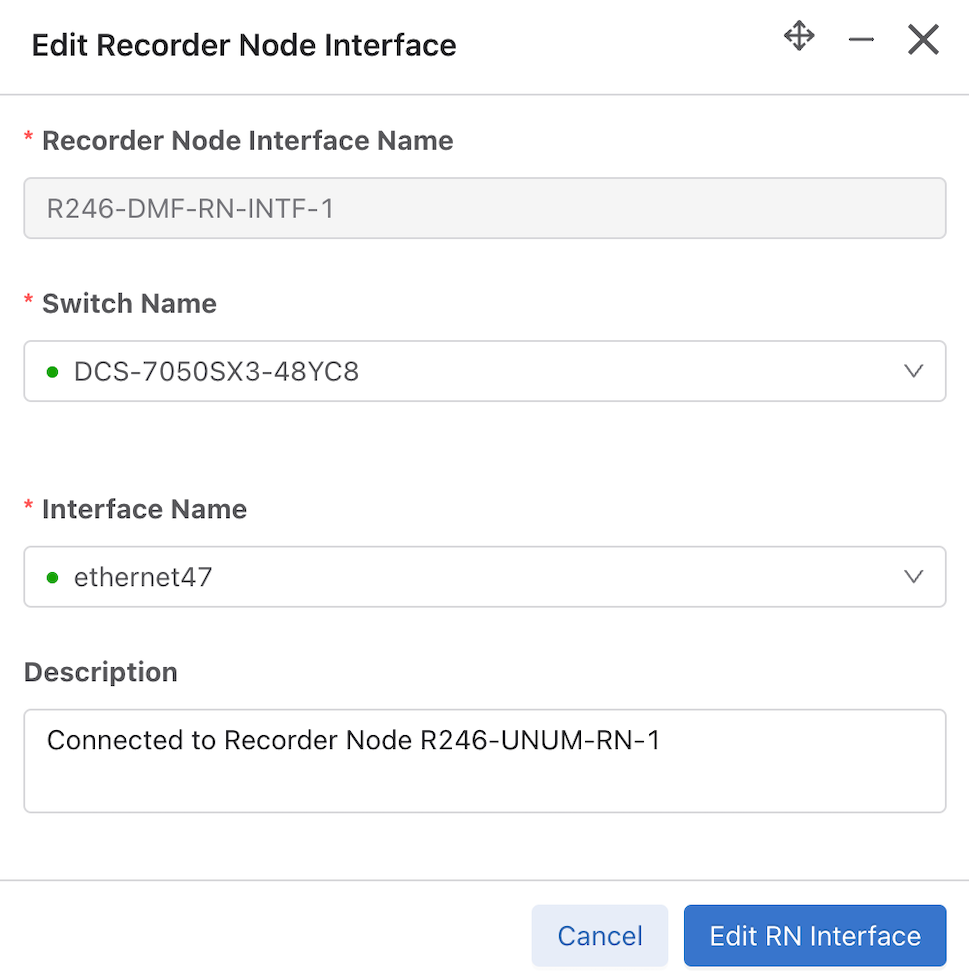
Edit a Recorder Node Interface
- Select the RN Interfaces tab in the Inventory section.
Figure 24. Create DMF Recorder Node Interface - Select an interface from the Inventory list and use the Edit icon.
Figure 25. Create Recorder Node Interface 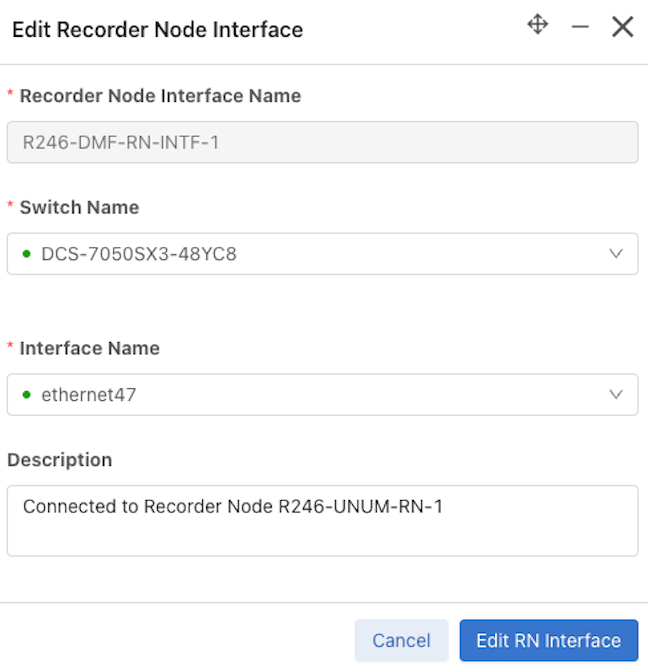
- To delete an interface, use the Delete icon and Confirm.
Figure 26. Confirm Delete 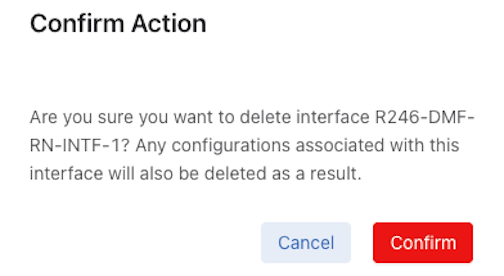
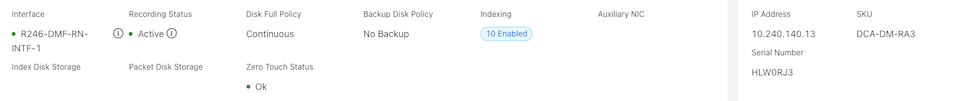
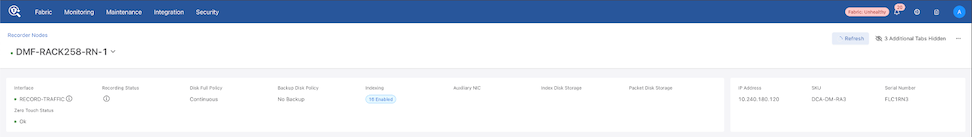
Recorder Node Details
The Recorder Node Detail page displays specific information about the Recorder Node.
In the Inventory window (Recorder Nodes tab active), select the Recorder Node Name to navigate to the details page.
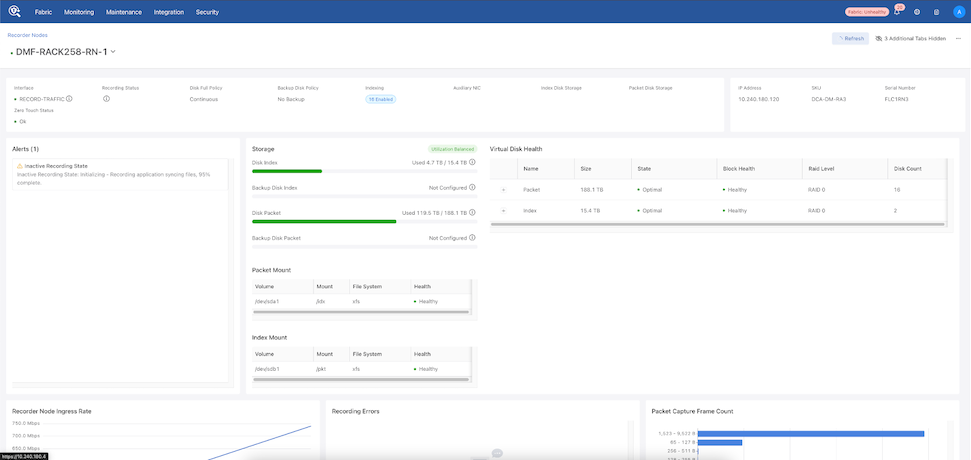
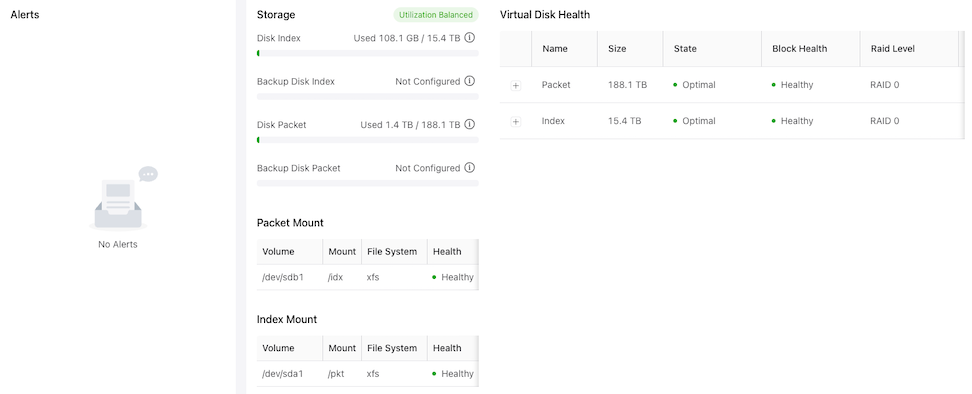
- Storage
- Disk Index
- Backup Disk Index
- Disk Packet
- Backup Disk Packet
- Index Mount
- Volume, Mount, File System, and Health
- Packet Mount
- Volume, Mount, File System, and Health
- Virtual Disk Health
- Name, Size, State, Block Health, and Raid Level
- Use the + icon to obtain granular information on the Virtual Disk Packet and Index health.
- Slot #, Device ID, Type, Size, State, Temp, Predicted Failure Count, Media Error Count, and Other Error Count.
Figure 30. Virtual Disk Health Details 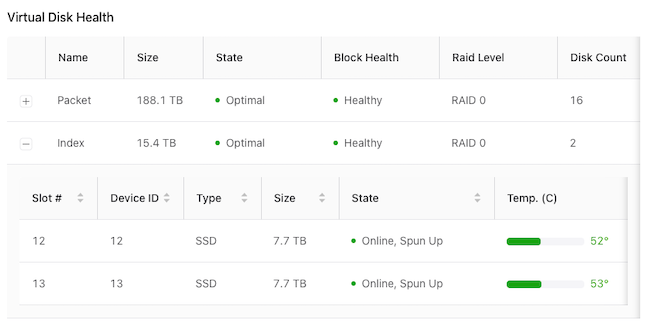
- Slot #, Device ID, Type, Size, State, Temp, Predicted Failure Count, Media Error Count, and Other Error Count.
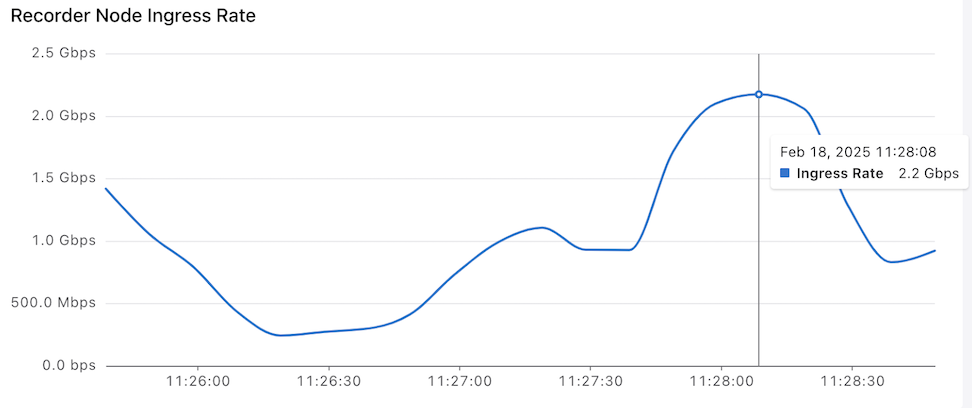
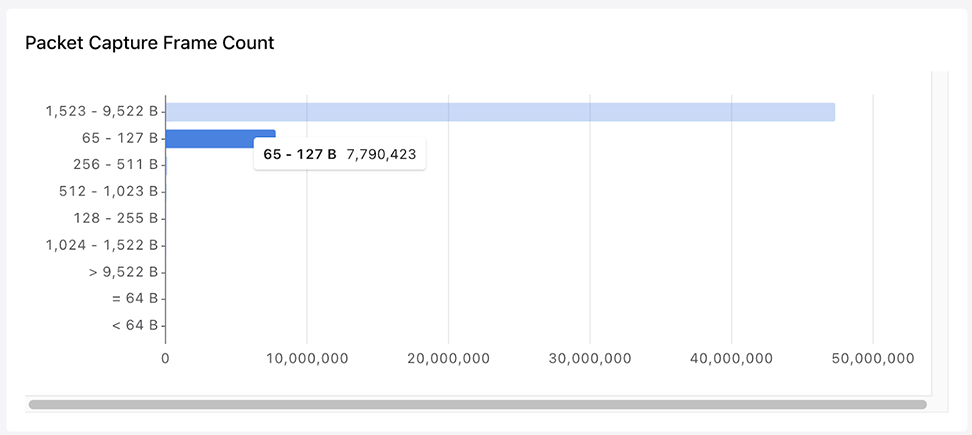
The lower dashboard displays live graphs of the Recorder Node Ingress Rate, Recording Errors, and Packet Capture Frame Count, and Events.
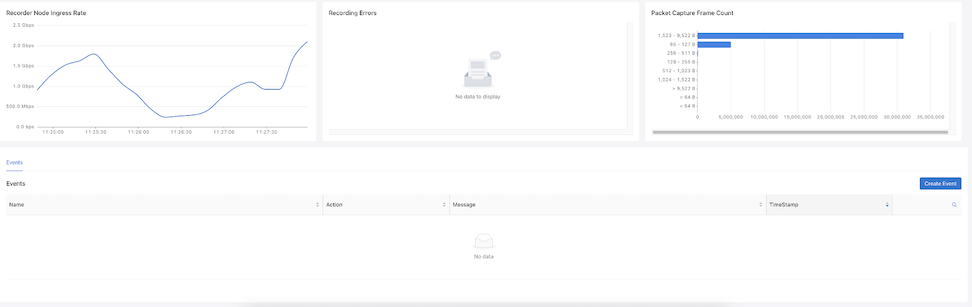
Hovering over the graph displays Timestamps and Ingress Rate.
Hovering over a bar displays Timestamps and Frame Count.
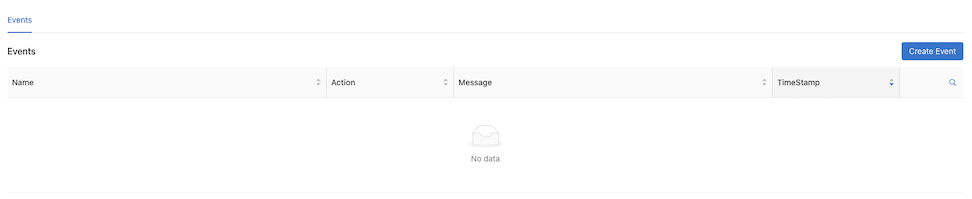
Recorder Node Events
The Recorder Node Details dashboard displays Events in the lower section.
- Name: Enter a name for the RN event.
- Incident Look Ahead Buffer: Enter a value (in minutes).
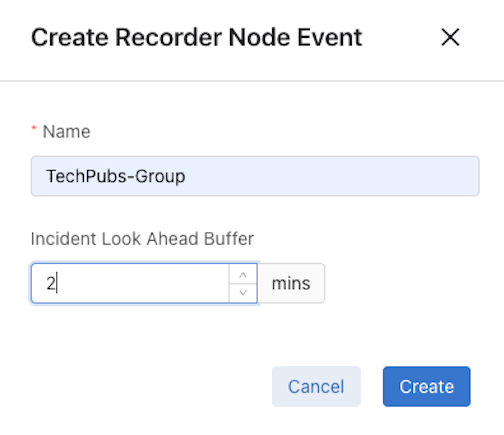
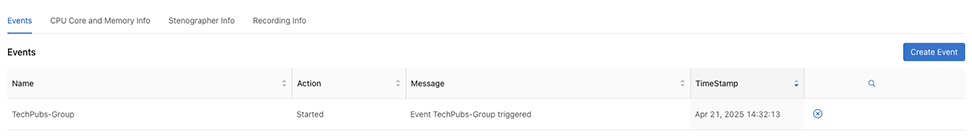
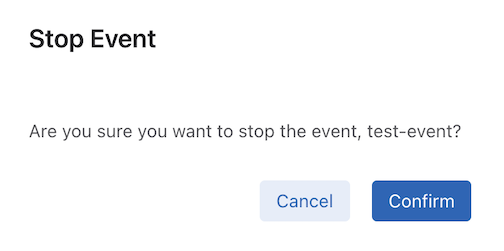
Use the X icon to stop the event and confirm.
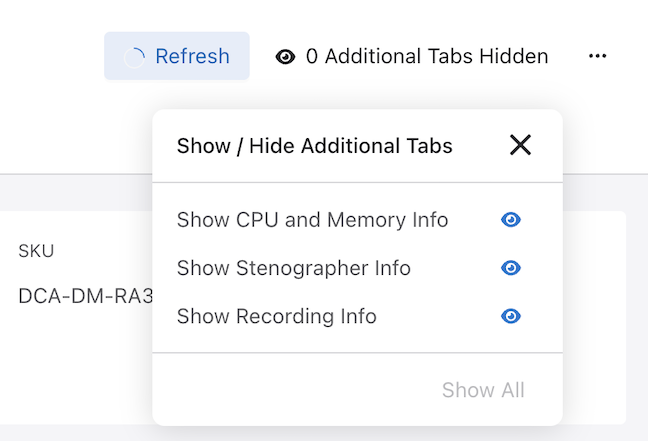
CPU Core and Memory Info
The CPU Core and Memory Info dashboard displays Memory Info and CPU Status.
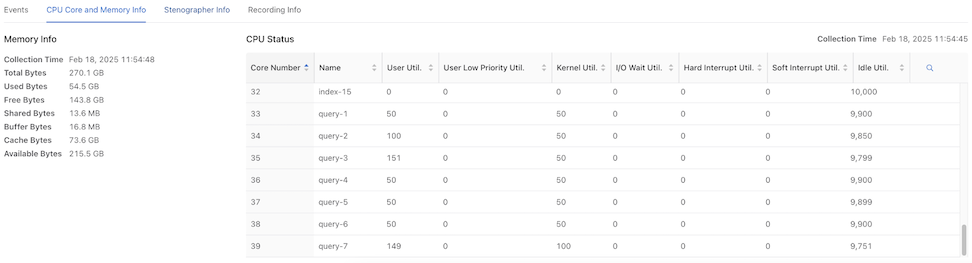
- Collection Time
- Total Bytes
- Used Bytes
- Free Bytes
- Shared Bytes
- Buffer Bytes
- Cache Bytes
- Available Bytes
- Core Number
- Name
- User Utilization
- User Low Priority Utilization
- Kernel Utilization
- I/O Wait Utilization
- Hard Interrupt Utilization
- Soft Interrupt Utilization
- Idle Utilization
Stenographer Info
The Stenographer Info dashboard displays Stenographer Info and Recording Threads.
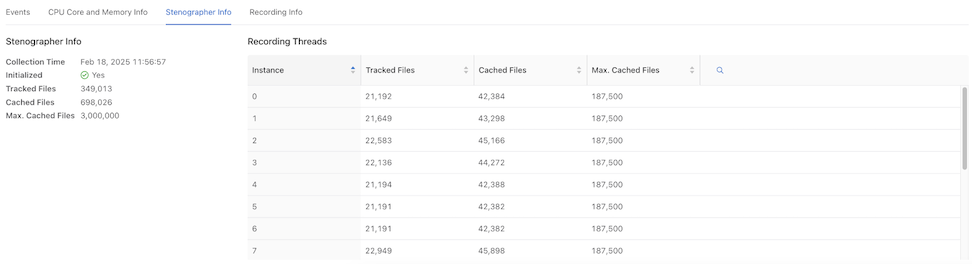
- Collection Time
- Initialized
- Tracked Files
- Cached Files
- Maximum Cached Files
- Instance
- Tracked Files
- Cached Files
- Maximum Cached Files
Recording Info
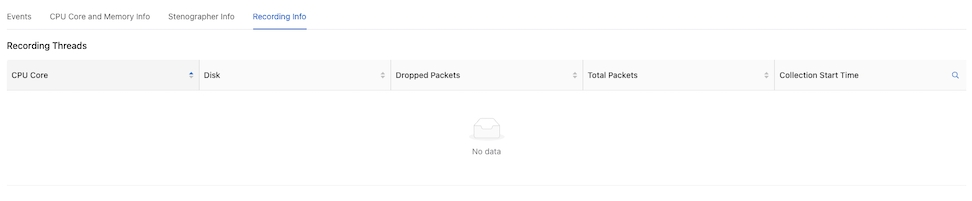
- CPU Core
- Disk
- Dropped Packets
- Total Packets
-
Collection Start Time
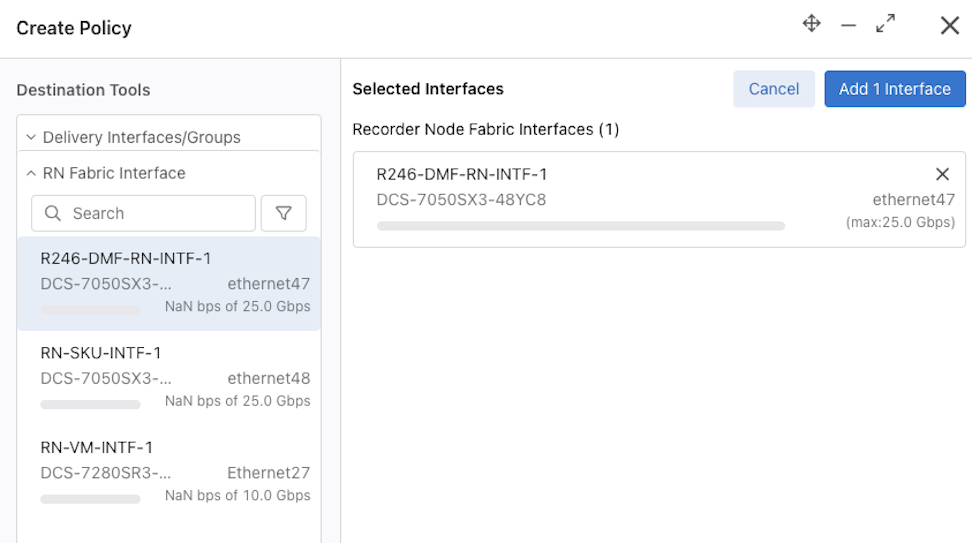
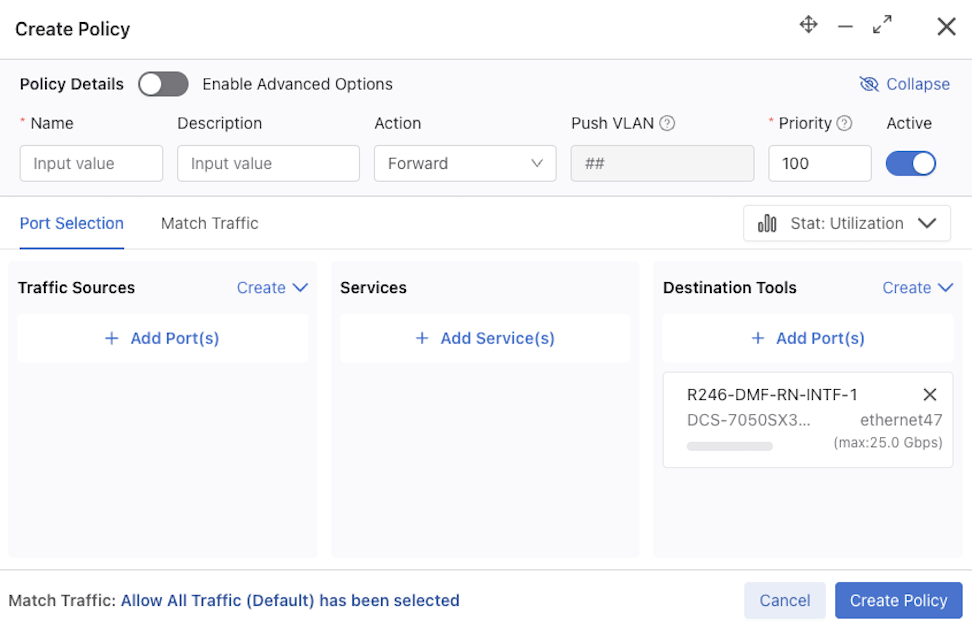
Assign a Recorder Node Interface to a Policy
To forward traffic to a Recorder Node (RN), include one or more RN interfaces as a delivery interface in a DANZ Monitoring Fabric (DMF) policy. Two methods exist to create a Policy:
Using Recorder Nodes to Create a Policy
Using Monitoring Policies to Create a Policy
Using Recorder Nodes to Create a Policy
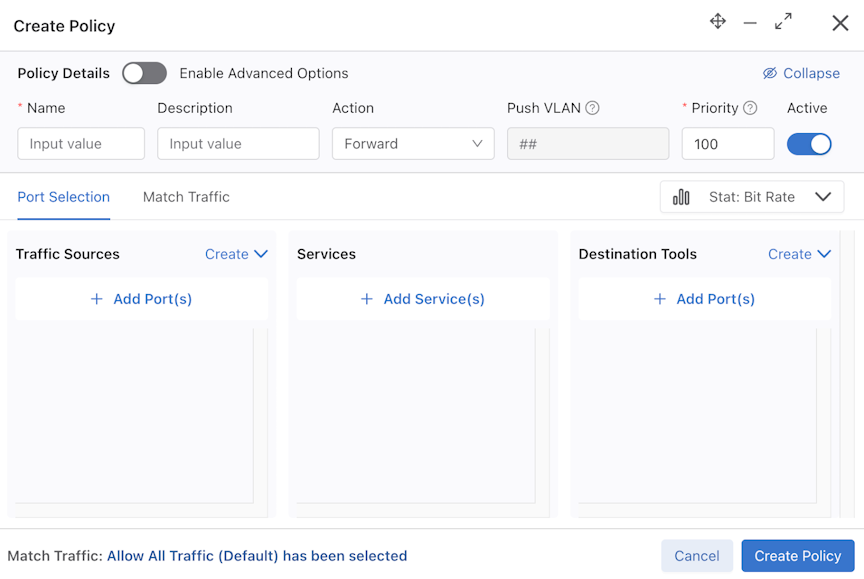
Select Create Policy.
For more information on configuring Policies refer to the Managing DMF Policies section.
Using Monitoring Policies to Create a Policy
Select Create Policy.
For more information on configuring Policies refer to the Managing DMF Policies section.
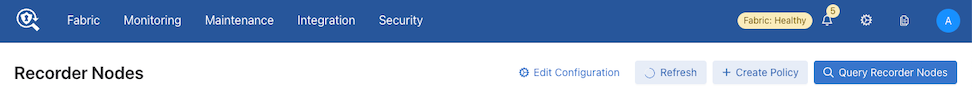
Recorder Node Query
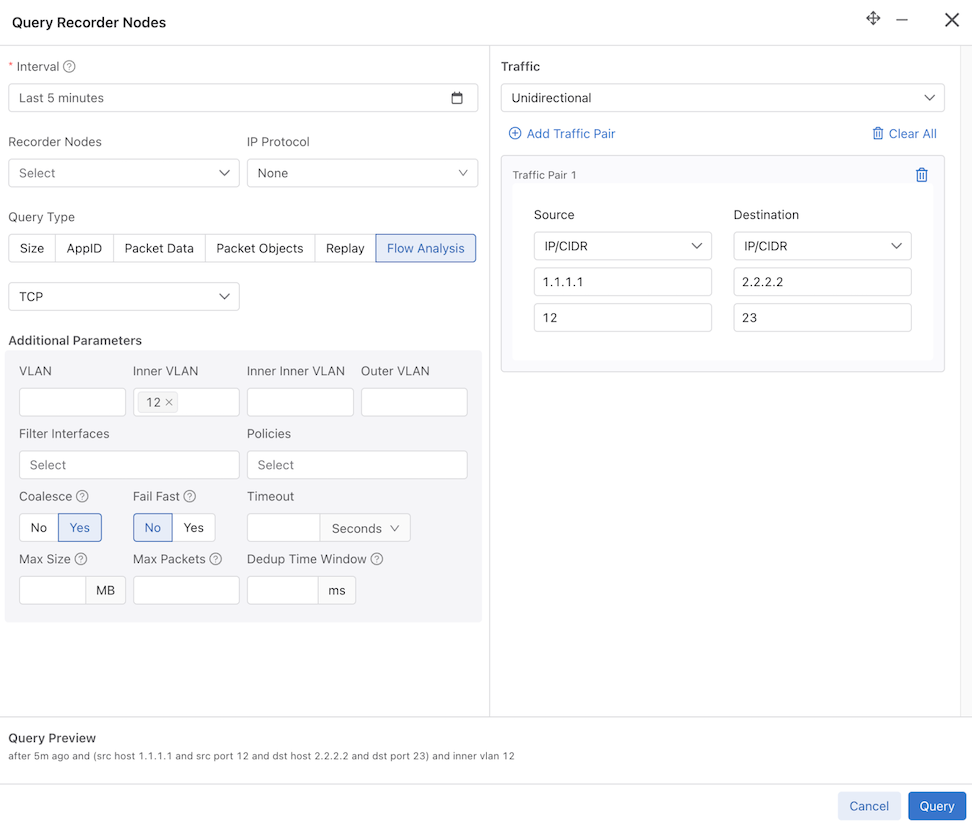
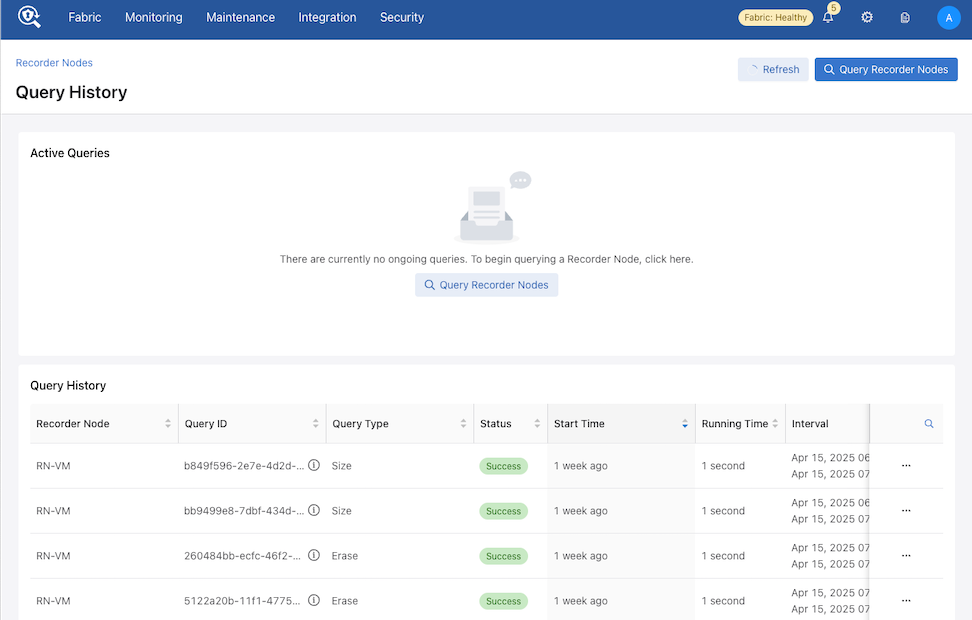
Use the options in the Query Recorder Nodes section to create a query and submit it to the RN for processing.
Initiate the Query Recorder Node workflow from the Recorder Nodes or Query History pages.
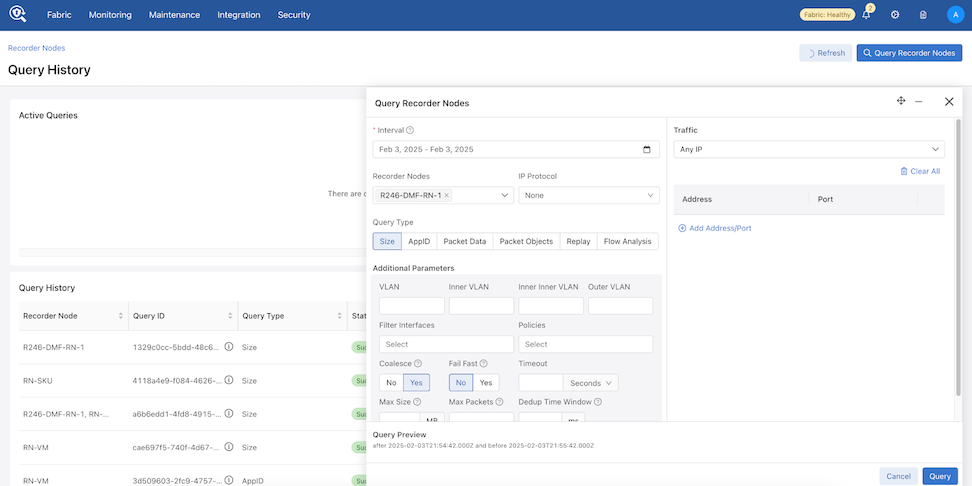
Select Query Recorder Nodes to open the Query Recorder Node window.
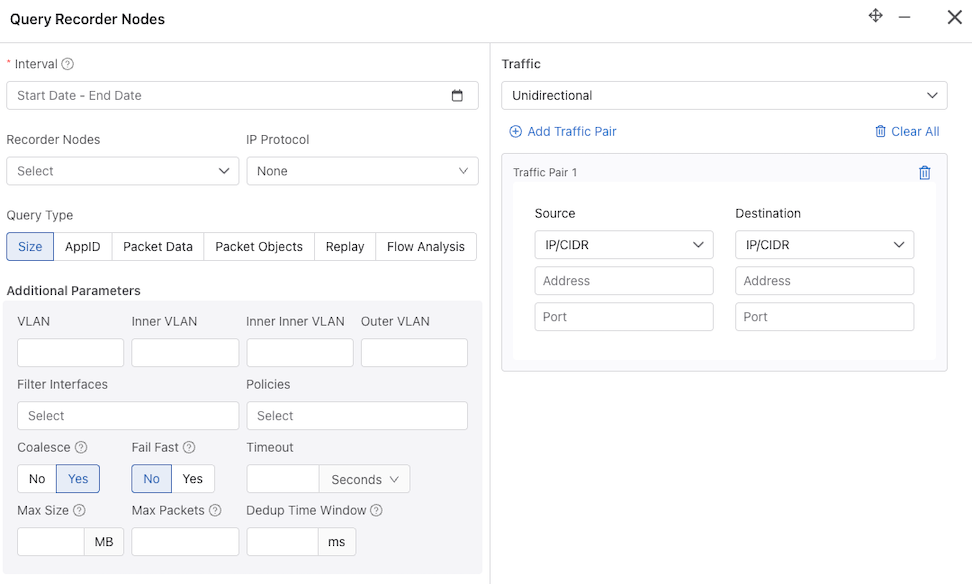
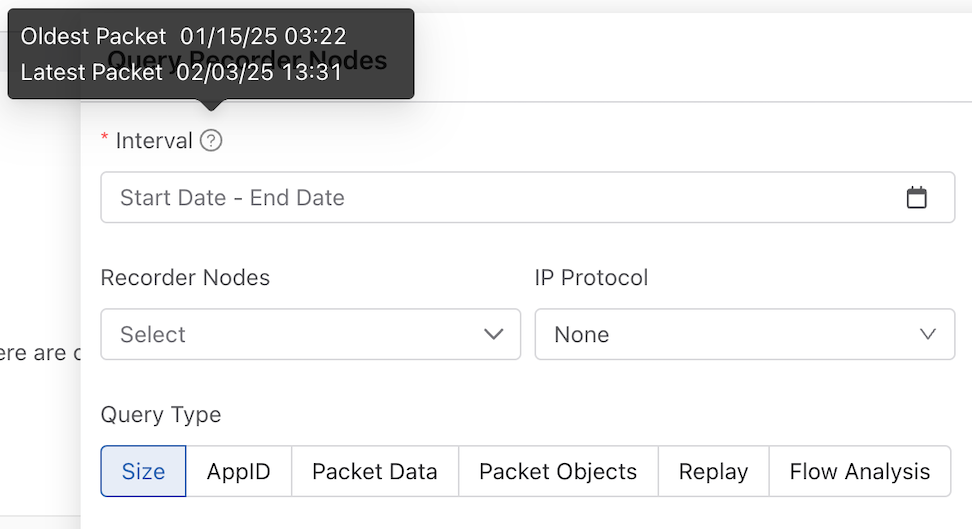
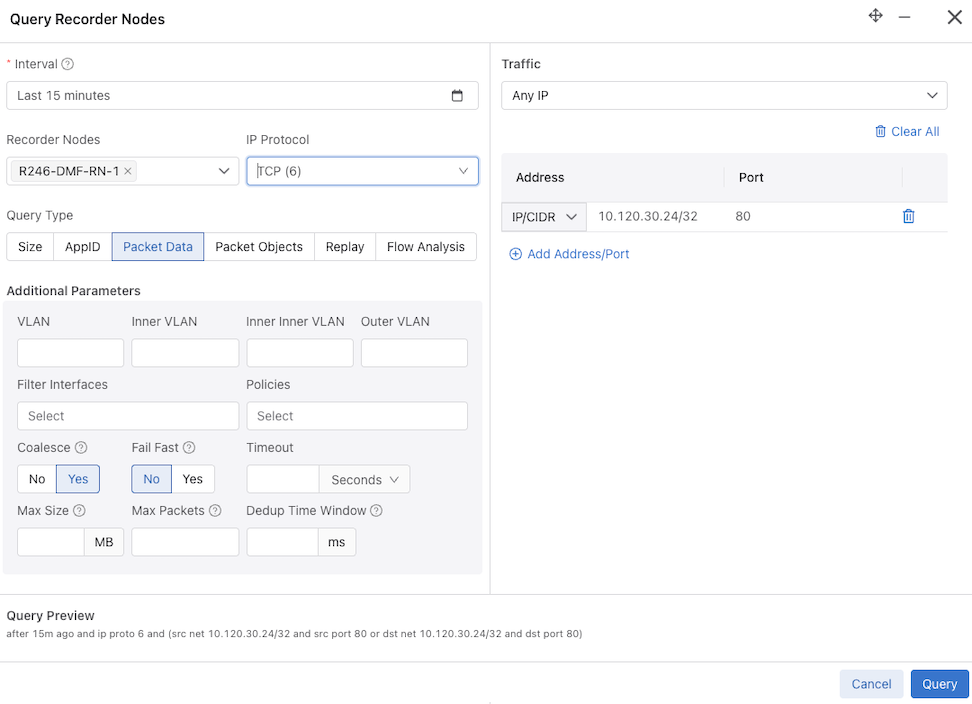
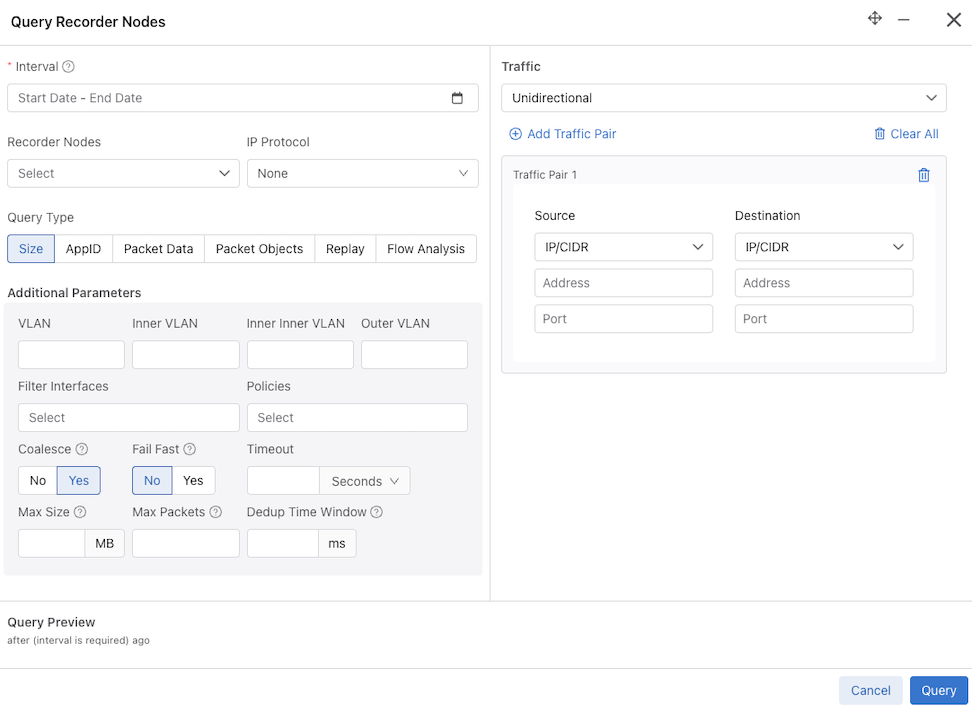
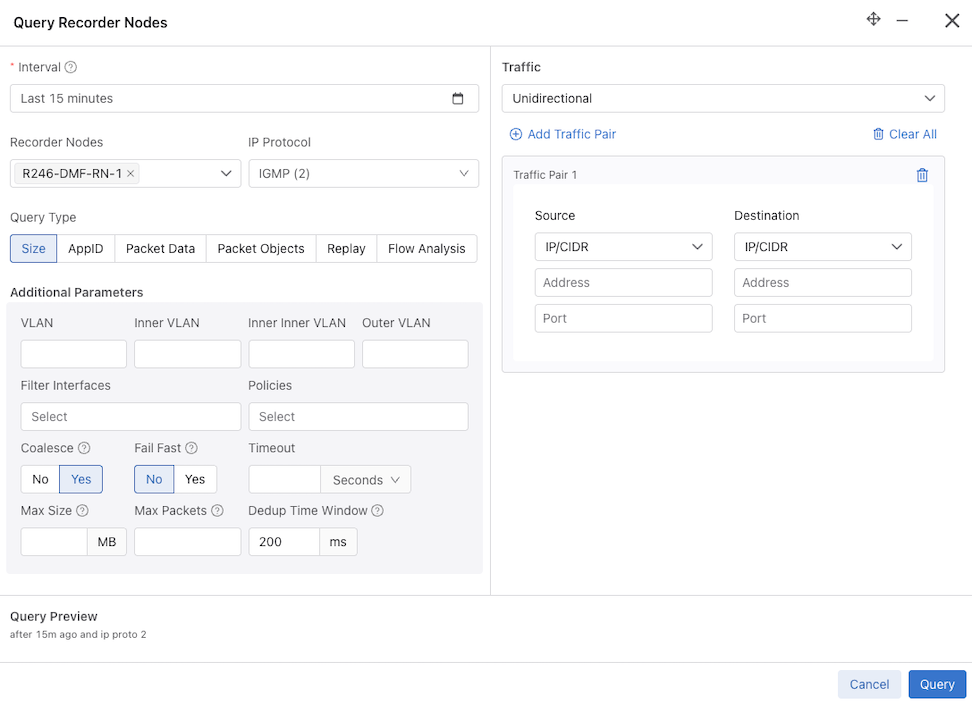
- Interval: Retrieve the oldest and most recent recorded packet timestamps. While hovering over the info icon provides information about the oldest and newest timestamp, to perform a query, you must enter the query time range using one of the following:
- Quick Windows: A time range relative to the current time in which look for packets.
- Select Range: A specific time range in which to look for packets.
- Recorder Nodes: Select a single or multiple Recorder Nodes from the drop-down list.
- IP Protocol: If required, select the IP protocol from the drop-down list or specify the numeric identifier of the protocol.
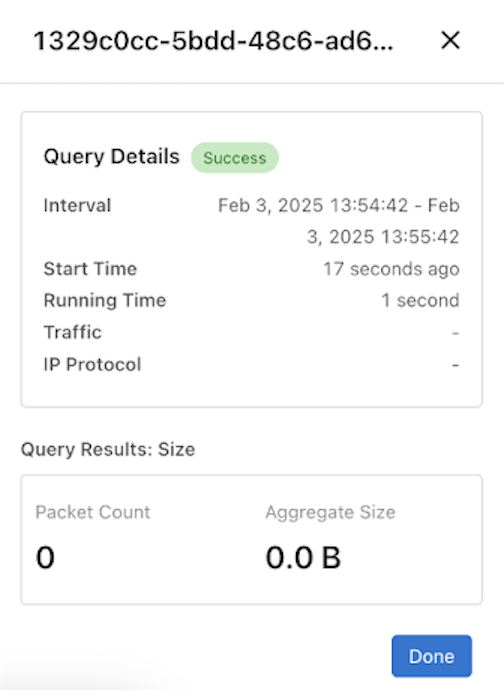
- Size: Provides the number of packets and their aggregate size in bytes that match the filter criteria specified.
- AppID: Performs deep packet inspection to identify applications communicating with the packets recorded and that match the filter criteria specified.
- Packet Data: Retrieves all the packets that match the filter criteria specified.
- Packet Objects: The packet object query extracts unencrypted HTTP objects from packets matching the given stenographer filter.
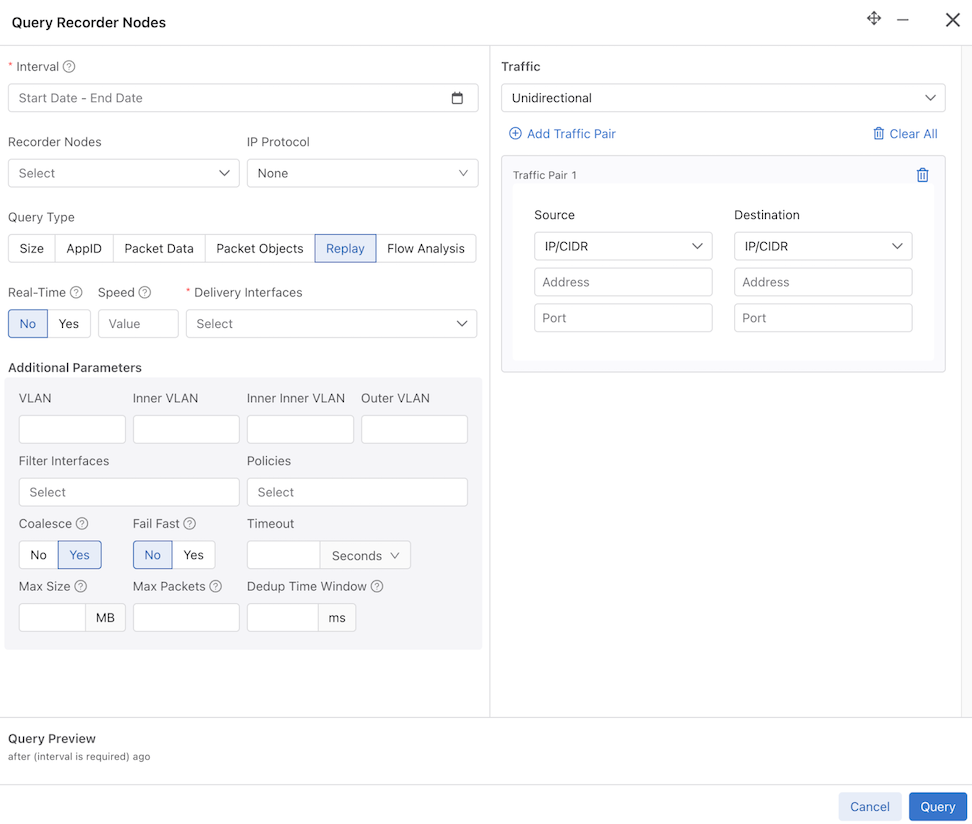
- Replay: Replays selected packets and transmits them to the specified delivery interface.
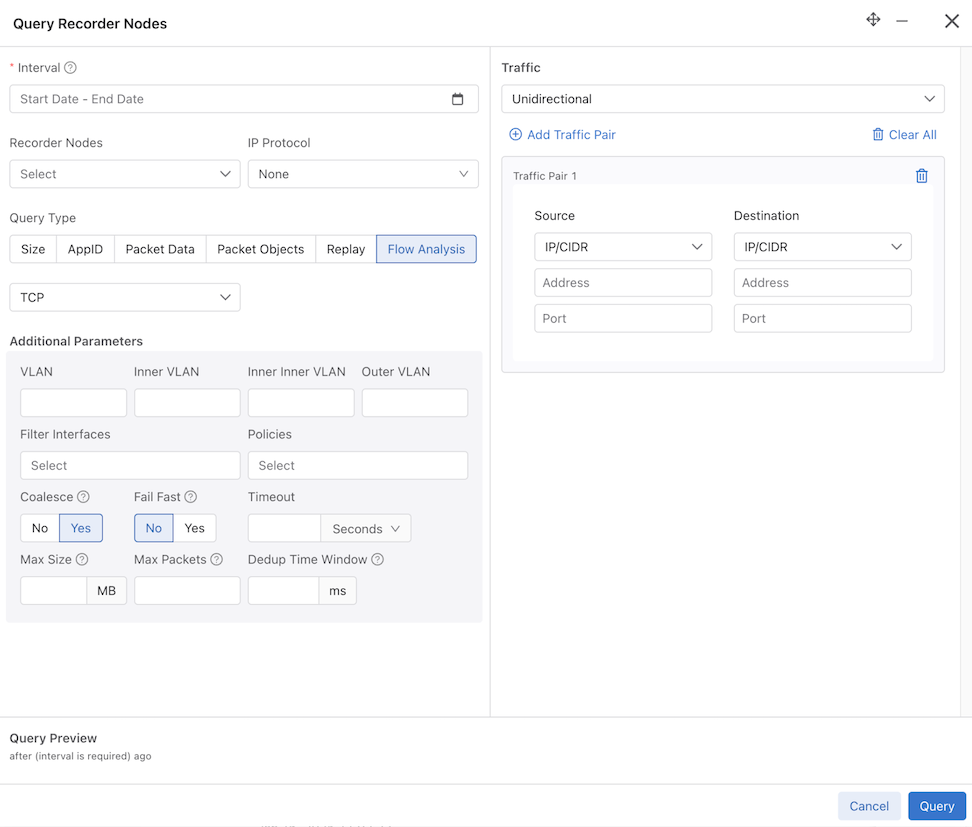
- Flow Analysis: Analyzes TCP flows for information such as maximum RTT, retransmissions, throughput, etc.
- Traffic:
- Any IP: Include packets with the specified IP address in the IP header (either source or destination).
- Unidirectional: Include packets with the specified source and/or destination IP address in the IP header.
- Traffic Pair - Source Destination:
- IP/CIDR or Mac: Select packets with a specific source and destination IP or MAC address.
- Src Port: Include packets with the specified protocol port number in the Src Port field in the IP header.
- Dst Port: Include packets with the specified protocol port number in the Dst Port field in the IP header.
- VLAN: Select packets with a specific VLAN ID.
- Inner VLAN
- Inner Inner VLAN
- Outer VLAN
- Filter Interfaces: Select the filter interfaces to restrict the query to those interfaces.
- Policies: Select the policies to restrict the query to those policies.
- Coalesce: Defines whether or not the data is coalesced if from multiple Recorder Nodes.
- Fast Fail: For multi-packet-recorder queries, if one packet recorder fails, fail the entire query immediately. Otherwise, continue obtaining a partial result from the remaining packet recorders.
- Timeout: Specify a timeout interval in Seconds, Minutes, or Hours.
- Max Size: This option is only available for packet queries. Specify the maximum number of bytes returned by a packet query in a PCAP file.
- Max Packets: This option is only available for packet queries. Specify the maximum number of packets returned by a packet query in a PCAP file.
- Dedup time Window: Refer to Deduplicate Packets for more information.
To query the Recorder Nodes, enter the required information. Interval details are mandatory, while other fields are optional. The current computed Stenographer Query string displays under Query Preview.
Hovering over the info icon for the Interval field displays the range of packets found.
The Replay query type has an additional mandatory field: Delivery Interfaces. Select Delivery Interfaces or Delivery Interface Groups from the drop-down.
- DNS: Analyzes any DNS packets, extracting query and response metadata.
- HTTP: Analyzes HTTP packets, extracting request URLs, response codes, and statistics.
- HTTP Request
- HTTP Response
- HTTP Stat
- Hosts: Identifies all the unique hosts that match the filter criteria specified.
- IPv4: Identifies and dissects distinct IPv4 flows.
- IPv6: Identifies and dissects distinct IPv6 flows.
- RTP Streams: Characterizes the performance of Real Time Protocol streaming packets.
- SIP Correlate:
- SIP Health:
- TCP: Identifies and dissects distinct TCP flows.
- TCP Flow Health: Analyzes TCP flows for information such as maximum RTT, retransmissions, throughput, etc.
- UDP: Identifies and dissects distinct UDP flows.
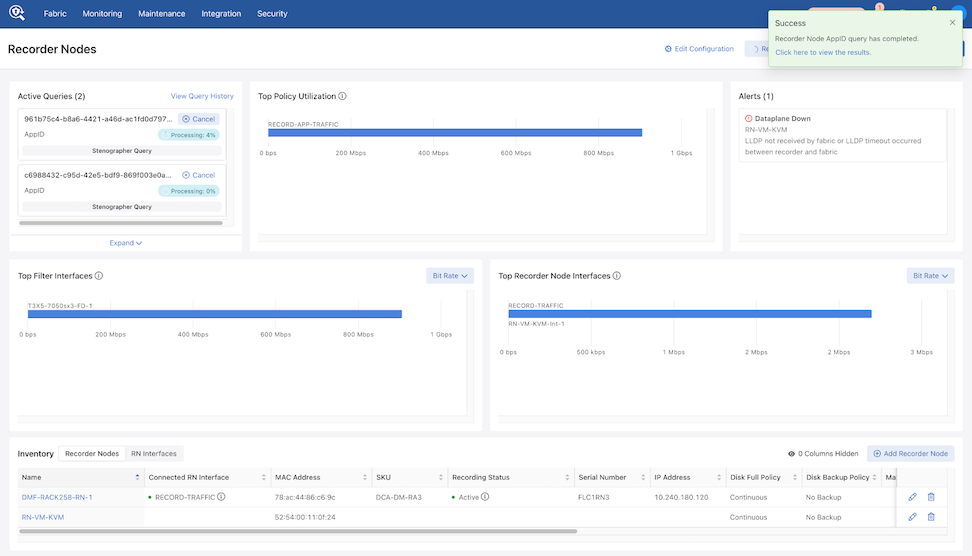
Upon entering the information and selecting Query, the window closes, and an info notification appears. The Active Queries are populated (unless the query completes quickly).
When the query completes, a success notification appears. Selecting the link goes to the Query History page.
Select Re-Query from the Query History page to pre-populate certain querying fields.
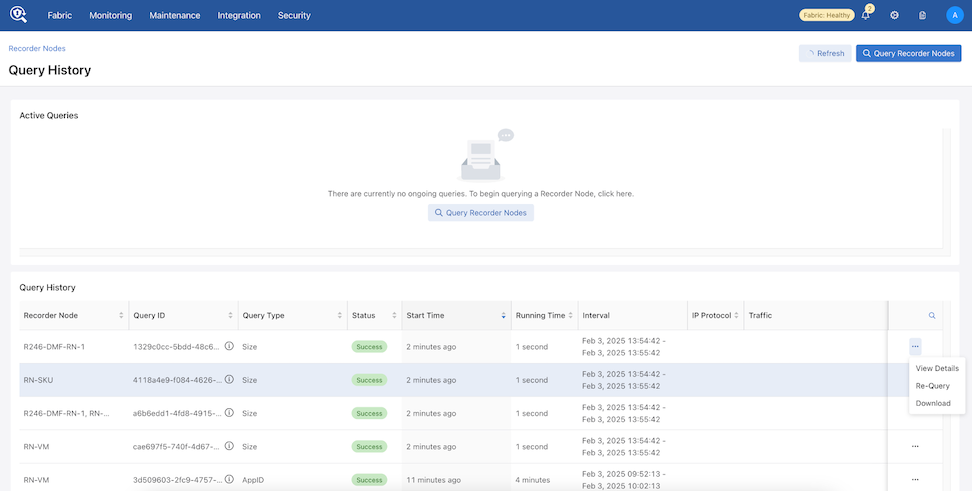
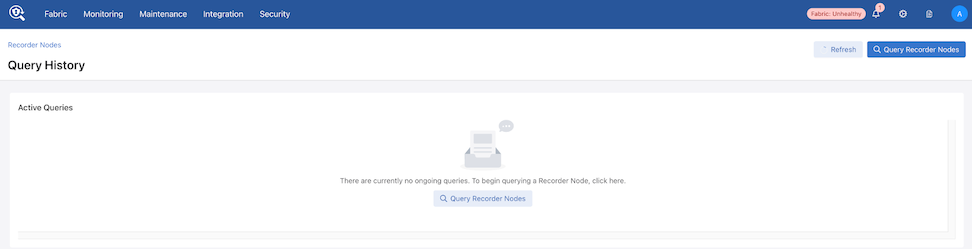
Viewing Query History
Navigate to and scroll down to the Query History section.
From Active Queries, select View Query History.
The Query History dashboard appears.
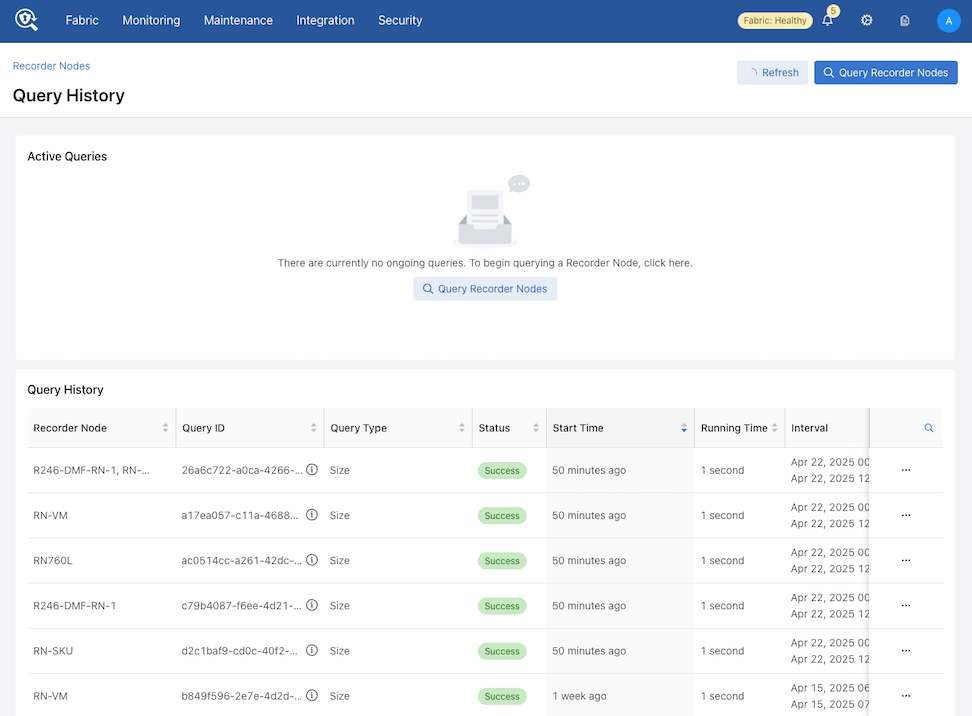
While on the Query History page, use Recorder Nodes to return to the Recorder Nodes page.
Multiple Queries
To run queries on recorded packets by the RN, navigate to the page.
Under the Active Queries section, select Query Recorder Nodes to select the type of analysis to run on the recorded packets.
After selecting the query type, use filters to limit or narrow the search to obtain specific results. Providing specific filters also helps to complete the query analysis faster. In the following example, the query result for the TCP query type will return the results for IP address 10.240.30.24 for the past 15 minutes.
After entering the desired filters, select Query. Query status windows appear.
To view the results select Active Queries. If the query has finished, view the results using Query History.
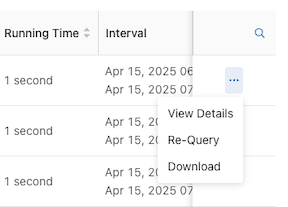
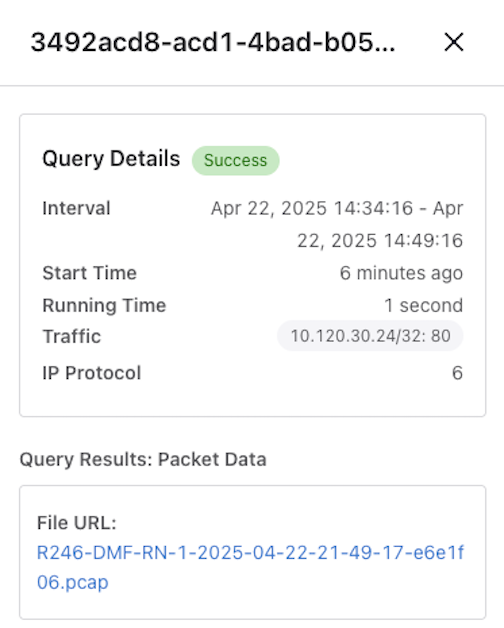
Query Results
To view Recorder Node Query Results, navigate to Query History.
View Details displays the results of the query.
Deduplicate Packets
For Recorder Node queries, the recorded packets matching a specified query filter may contain duplicates when packet recording occurs at several different TAPs within the same network; i.e., as a packet moves through the network, it may be recorded multiple times. The dedup feature removes duplicate packets from the query results. By eliminating redundant information, packet deduplication improves query results' clarity, accuracy, and conciseness. Additionally, the dedup feature significantly reduces the size of query results obtained from packet query types.
The Query Recorder Nodes configuration window appears.
Deduplication is off by default for these queries. To enable deduplication, perform the following steps:
Manage Access to the Recorder Node
Use Role-Based Access Control (RBAC) to manage access to the DANZ Monitoring Fabric (DMF) Recorder Node (RN) by associating the RN with an RBAC group.
To restrict access for a specific RN to a specific RBAC group, use the following instructions.
RBAC Configuration
- Select , and select Edit from the Actions and select + Create Group.
Figure 76. Create Security Group 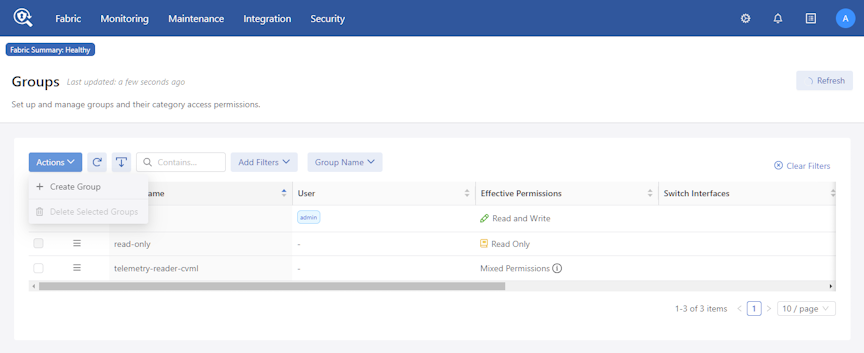
- Enter a Group Name.
Figure 77. Create Group 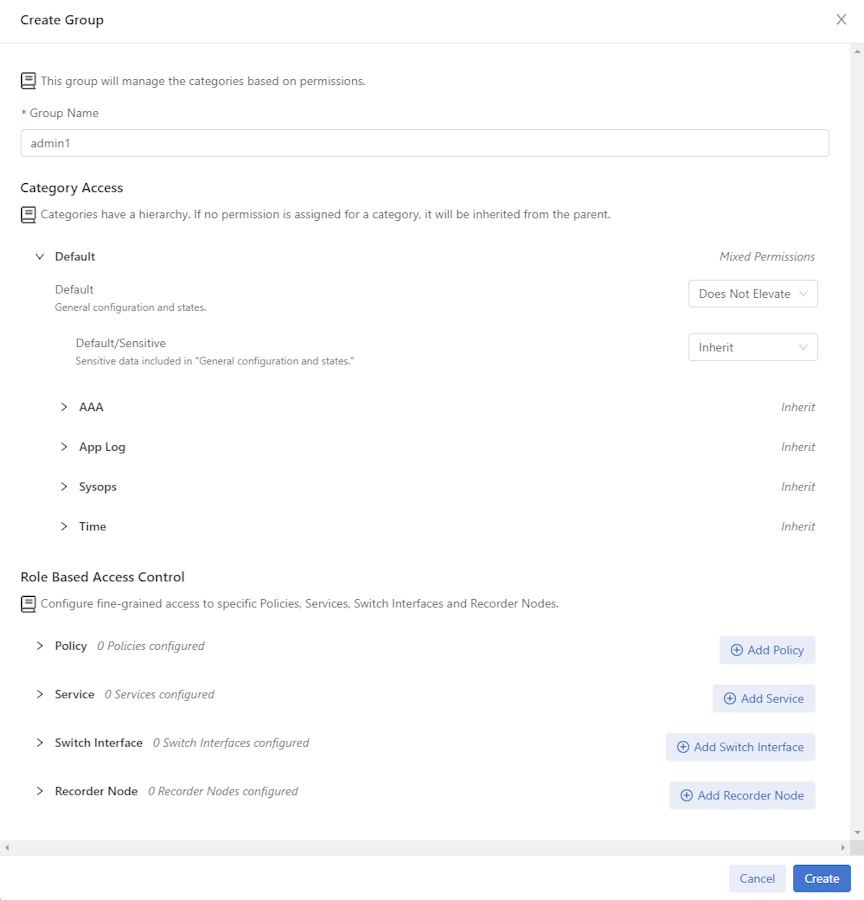
- Select the Recorder Node from the selection list, and assign the permissions required.
- Read: The user can view recorded packets.
- Use: The user can define and run queries.
- Configure: The user can configure packet recorder instances and interfaces.
- Export: The user can export packets to a different device.
Figure 78. Associate Recorder Node 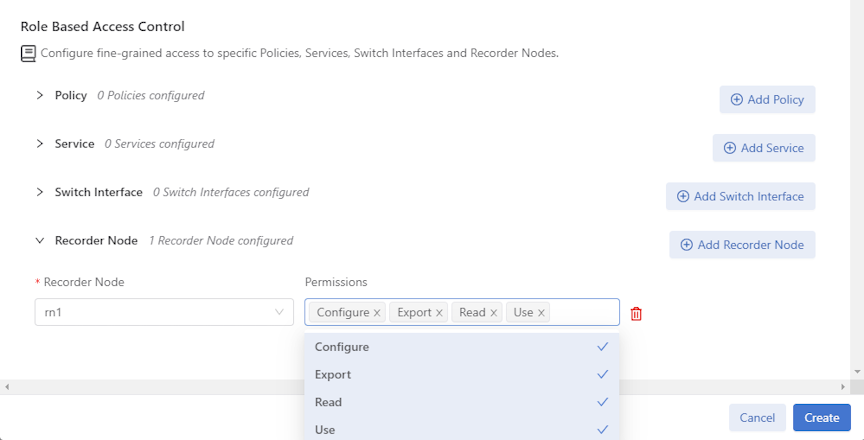
Rename a RBAC Group
This topic describes the workflow for renaming a Group Name in DMF.
Overview
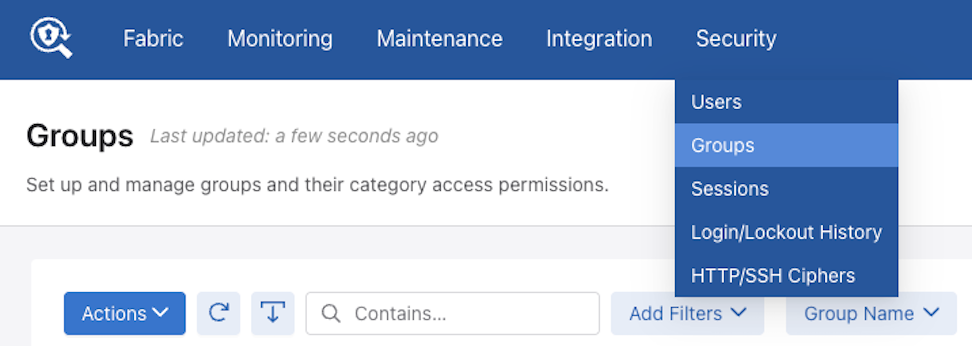
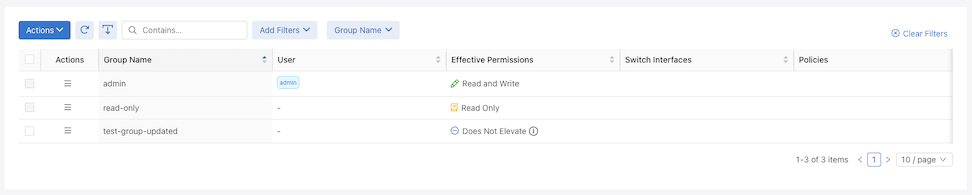
Navigate to and select Groups.
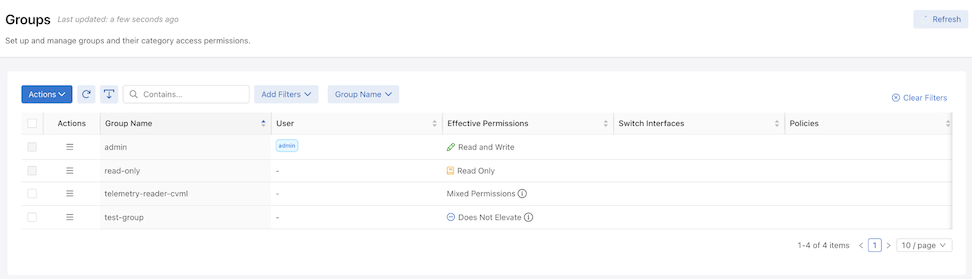
Renaming a Group Name
To update a Group Name, such as changing test-group to test-group-updated, select Edit in the row menu action.
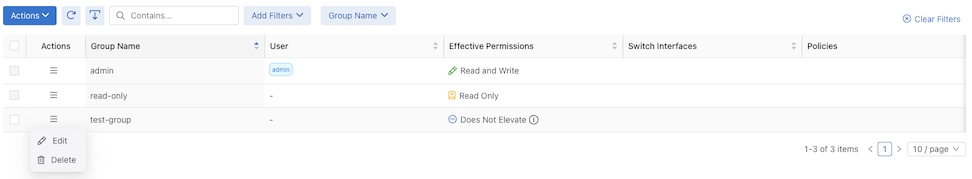
An Edit Group window displays.
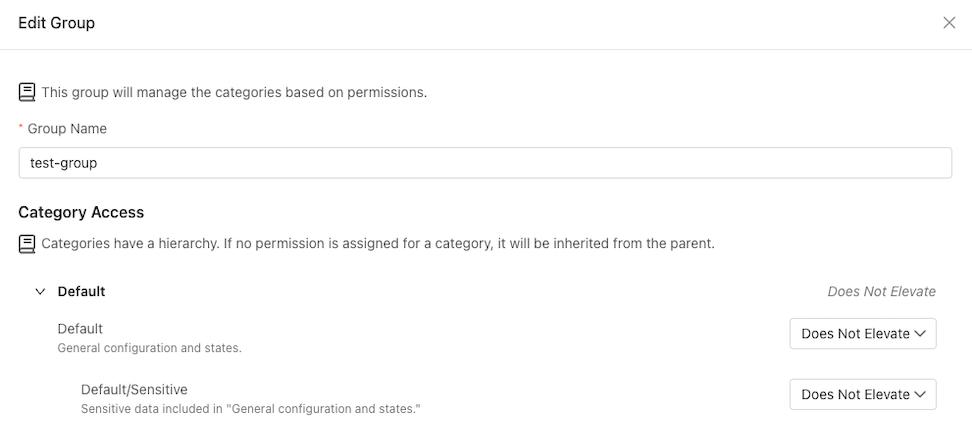
Enter the new Group Name.
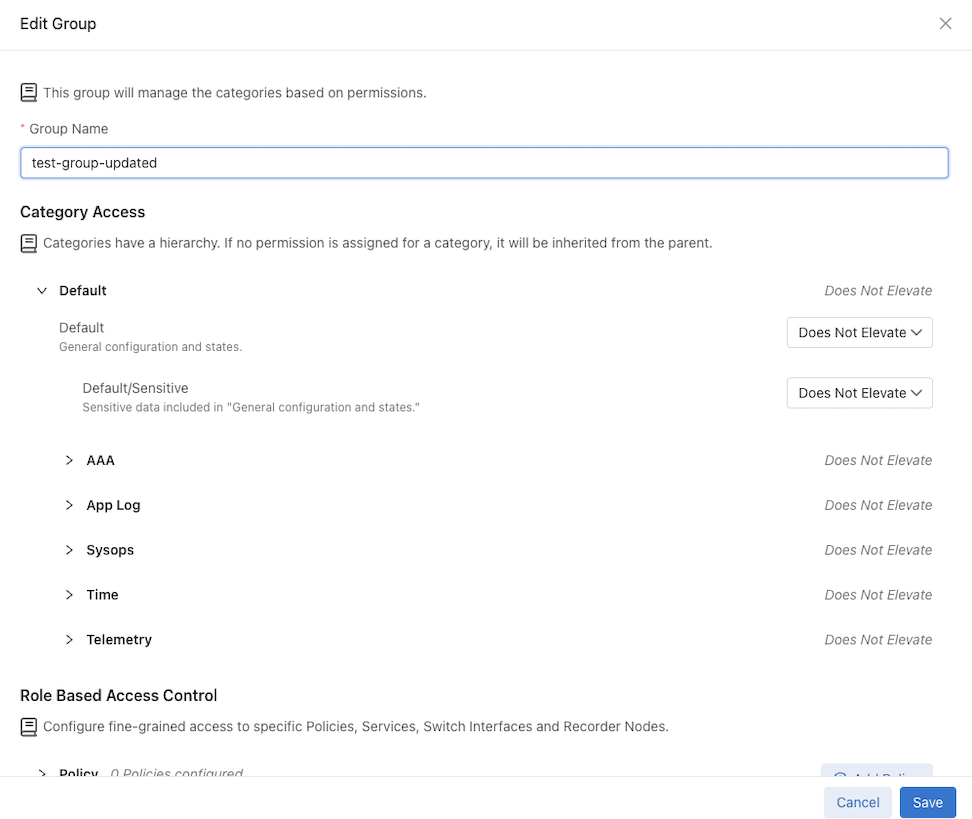
Select Save to apply the change.
DMF updates the Group Name.
Enabling Egress sFlow® on Recorder Node Interfaces
Enable egress sFlow®* to sample traffic sent to any DANZ Monitoring Fabric (DMF) Recorder Node (RN) attached to the fabric. Examining these sampled packets on a configured sFlow collector allows the identification of post-match-rule flows recorded by the RNs without performing a query against the RNs. While not explicitly required, Arista Networks highly recommends using the DMF Analytics Node (AN) as the configured sFlow collector, as it can automatically identify packets sampled utilizing this feature.
Platform Compatibility
All platforms apart from the following series:
- DCS-7280R
- DCS-7280R2
- DCS-7500R
- DCS-7020
- DCS-7050X4
Configuration
After configuring the fabric for sFlow and setting up the sFlow collector, navigate to .
Select Edit Configuration and the configuration menu appears.
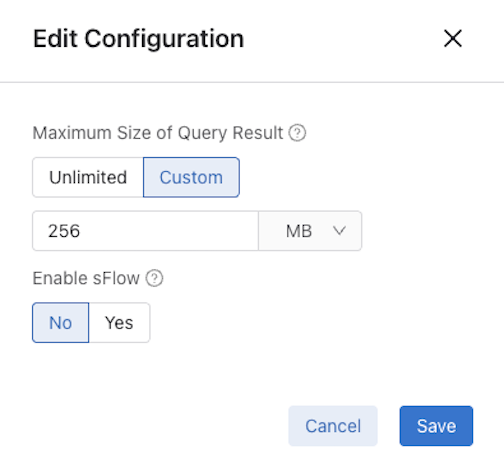
Set Enable sFlow to Yes.
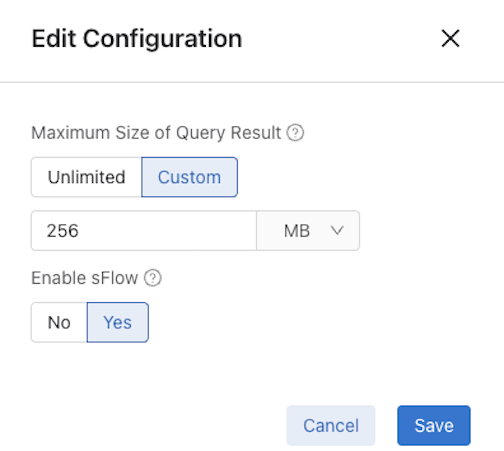
Select Save.
DMF Analytics Node
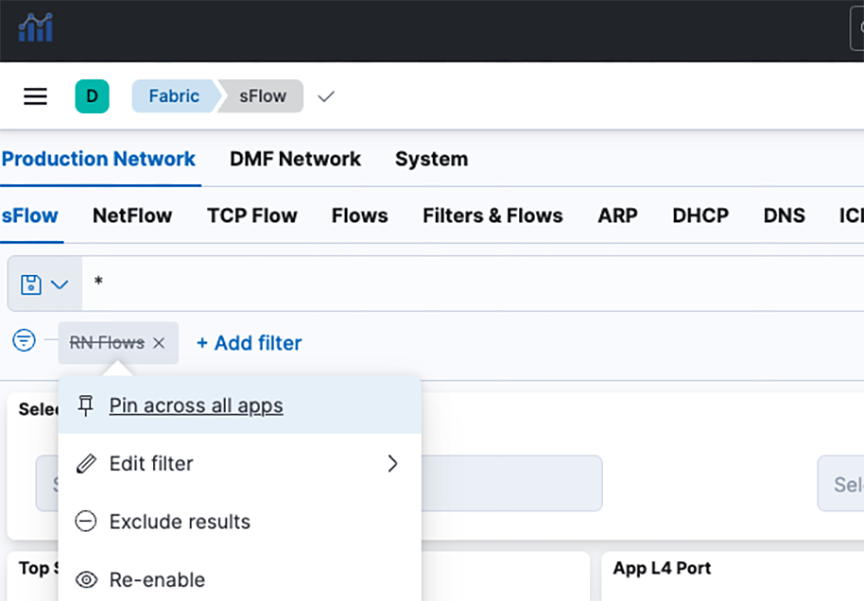
When using a DMF Analytics Node as the sFlow collector, it has a dashboard to display the results from this feature. To access the results:
- Navigate to the sFlow dashboard from the Fabric dashboard.
- Select the disabled RN Flows filter.
- Select the option to Re-enable the filter.
Troubleshooting Egress sFlow Configurations
Switches not affiliated with a sFlow collector (either a global sFlow collector or a switch-specific sFlow collector) do not have an active feature even if the feature is enabled. Ensure the fabric is set up for sFlow and a configured sFlow collector exists. To verify that a configured global sFlow collector exists, use the command:
dmf-controller-1# show sflow default
A configured collector appears as an entry in the table under the column labeled collector. Alternatively, to verify a configured collector exists for a given switch, use the command:
dmf-controller-1# show switch switch-name table sflow-collector
This command displays a table with one entry per configured collector.
A feature-unsupported-on-device warning appears when connecting an unsupported switch to an RN. The feature does not sample packets passing to an RN from an unsupported switch. View any such warnings using the GUI or using the following CLI command:
dmf-controller-1# show fabric warnings feature-unsupported-on-device
To verify the feature is active on a given switch, use the command:
dmf-controller-1# show switch switch-name table sflow-sample
If the feature is enabled, the entry values associated with the ports connected to an RN would include an EgressSamplingRate(number) with a number greater than 0. The following example illustrates Port(1) on switch-name connecting to an RN.
dmf-controller-1# show switch <switch-name> table sflow-sample
#  Sflow-sample Device name    Entry key Entry value
--|------------|---------------|---------|----------------------------------------------------------------------------------|
53  52           <switch-name>  Port(1)   SamplingRate(0), EgressSamplingRate(10000), HeaderSize(128), Interval(10000)
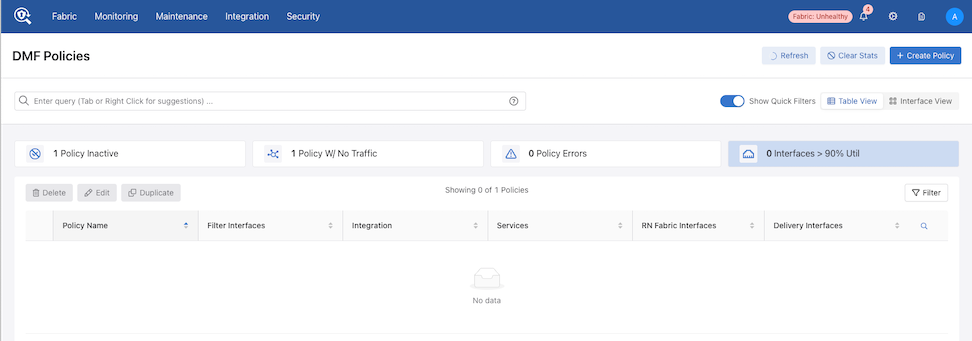
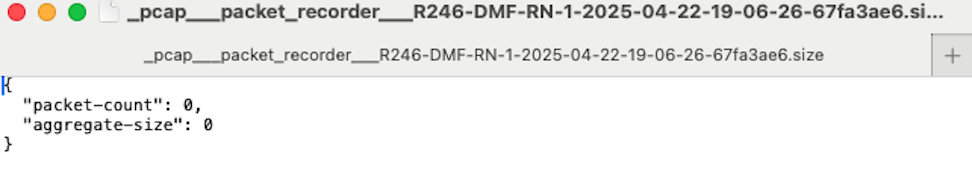
Empty State
Please refer to the DMF Deployment Guide for more information on installing and configuring a DMF Recorder Node.
Wireshark Web Interface via the DMF Interface
Accessing the Wireshark Web Interface via the DMF Interface
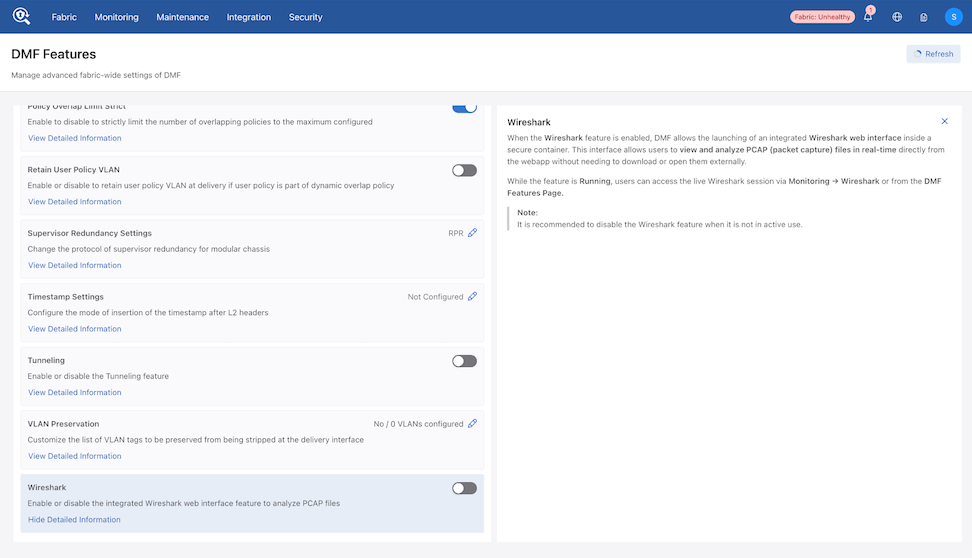
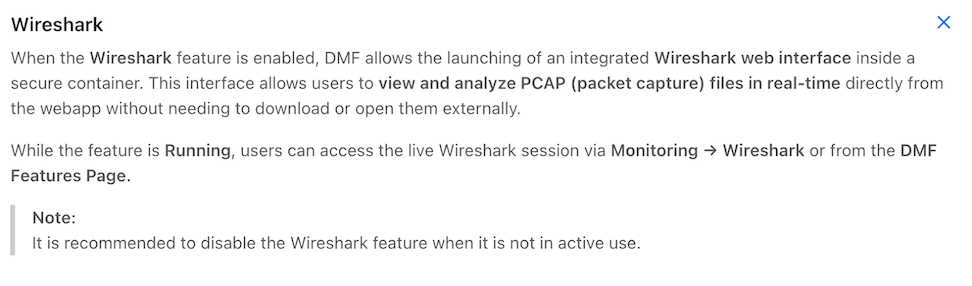
Security policies occasionally prevent the download of PCAP files from packet queries. The integrated Wireshark web interface enables PCAP analysis within the DMF environment and requires authentication. This integration provides full Wireshark functionality while keeping the PCAP file on the Controller to maintain adherence to security requirements.
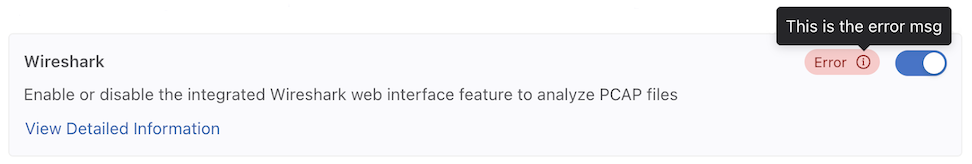
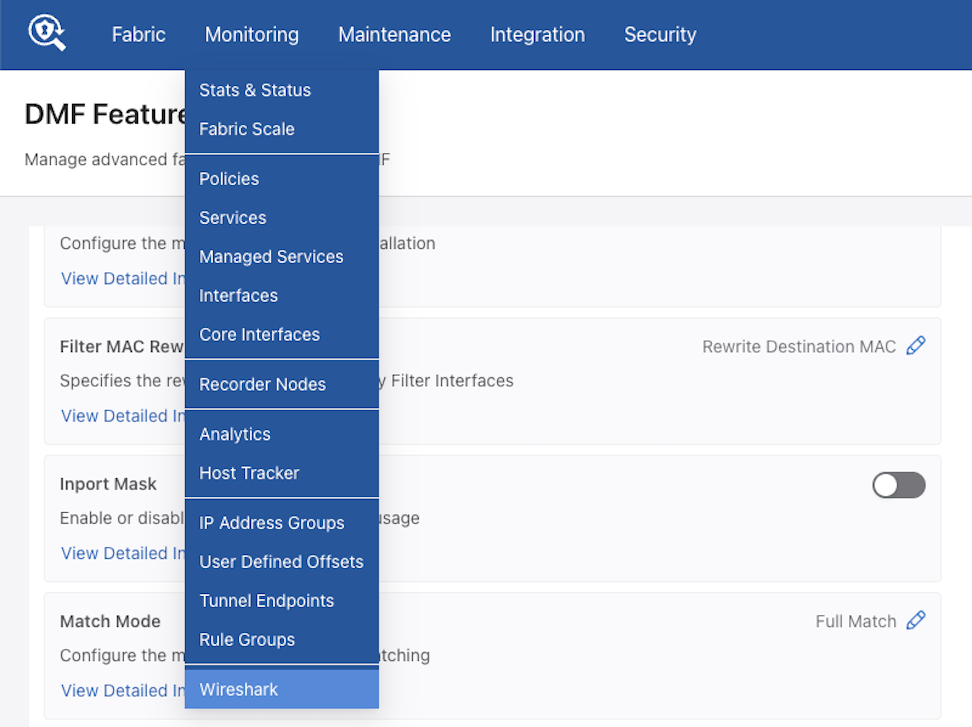
The DMF Controller User Interface (UI) offers a toggle for Wireshark within the Features menu.

The DMF Features page also contains a link to detailed information within the Wireshark feature box, providing additional technical insights.
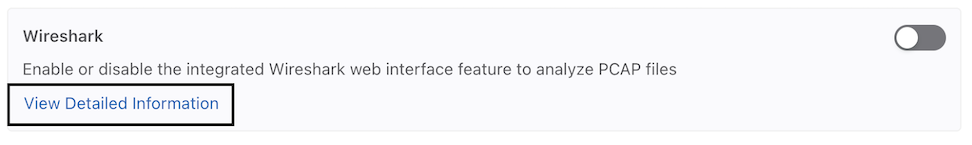
Select View Detailed Information to obtain additional information about the Wireshark feature, consistent with other DMF interface features.
Wireshark Feature States
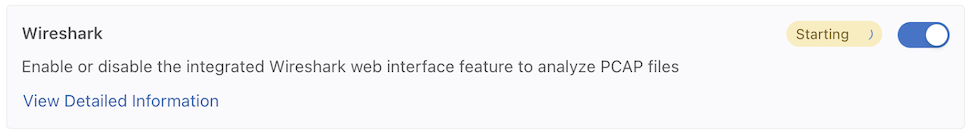
The Wireshark feature displays the following operational states:
-
Enabled, starting: The system is initializing the service.
-
Enabled, error: The service failed to start or encountered a malfunction.
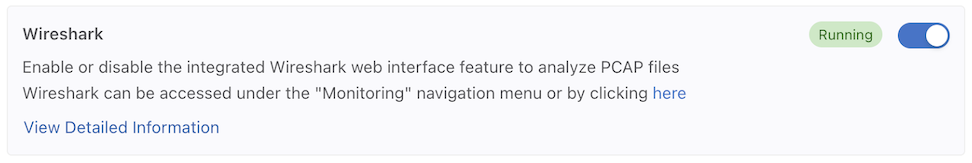
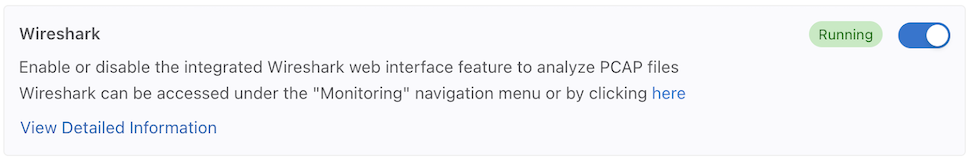
-
Enabled, running: The service is active and functional.
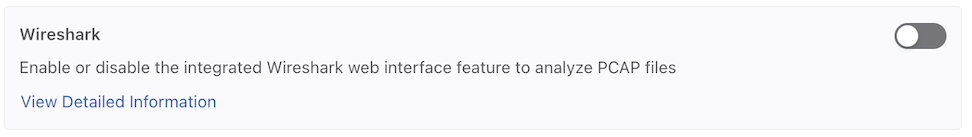
-
Disabled: The service remains inactive.
Accessing the Wireshark Interface
Access to the Wireshark page occurs via two primary methods:
-
Using the here link within the feature box after the state reaches Enabled, running.
-
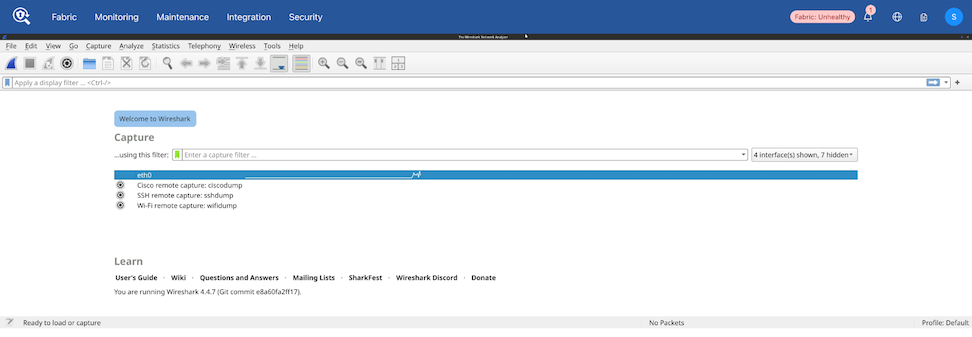
Selecting Wireshark from the Monitoring menu.
The DMF UI hosts the Wireshark interface for direct viewing and analysis.
-
Single Session Access: The interface supports only one active session at a time on a first-come, first-served basis.
-
Memory Constraints: A 2GB memory limit applies to file operations. Opening PCAP files that exceed this limit triggers an automatic denial of the attempt and a system restart.
Syslog Messages
DANZ Monitoring Fabric (DMF) generates specific syslog messages related to Wireshark to record events, status changes, and errors. The logs provide real-time visibility and serve as a primary resource for troubleshooting and to identify specific message types, understand severity levels, and determine the appropriate corrective actions.
- INFO
- WRS1000: Successfully started Wireshark container.
- WRS1001: Stopped Wireshark container.
- WRS1002: Updating Wireshark configuration. Status set to {Wireshark UI status}.
- ERROR
- WRS7000: Error stopping Wireshark container: {Error message}.
- WRS7001: Failed to execute wireshark command: {Command string}.
- WRS7002: Failed to start Wireshark.
- WRS7003: Wireshark command timed out after {Time} seconds: {Command string}.
- WRS7004: Failed to automatically start Wireshark container when config was enabled.
- WARN
- WRS4000: Wireshark exec process still alive, destroying: {Command string}.
Troubleshooting
Use the following steps to resolve common issues with the underlying Docker service.
If the Docker service remains inactive, the following commands initiate and enable the service:
sudo systemctl start docker
sudo systemctl enable docker
If the web page displays an error:
-
Wireshark initialization may require additional time. Wait 30 seconds and refresh the page.
-
Controller authentication must remain active.
If the Docker service is active and enabled but the command fails to execute, the following command manually starts the endpoint:
sudo /usr/share/floodlight/wireshark/wireshark-exec --start
| Command | Function |
|---|---|
sudo docker ps -a |
Lists all Docker containers on the system. |
sudo docker logs container-name |
Displays logs generated by a specific container. |
sudo docker info |
Displays a detailed overview of the Docker system configuration, including container and image statistics. |
sudo systemctl status docker |
Checks the status of the main Docker background service (daemon) to verify operational state or identify errors. |
Considerations
The following operational requirements and limitations apply to using Wireshark in the DMF User Interface.
- Single Session Access: The interface supports only one active session at a time on a first-come, first-served basis.
- Memory Constraints: A 2GB memory limit applies to file operations. Opening PCAP files that exceed this limit triggers an automatic denial of the attempt and a system restart.
- No live capture: The interface does not support real-time streaming of live captures.
Recorder Node Stats in Analytics Node
The Analytics Node (AN) enables the correlation of 5-tuple data from Flows and DMF metadata with the corresponding packets retrieved from the Recorder Node (RN). Previously, the system displayed Egress sFlow®* to indicate potentially recorded flow packets.
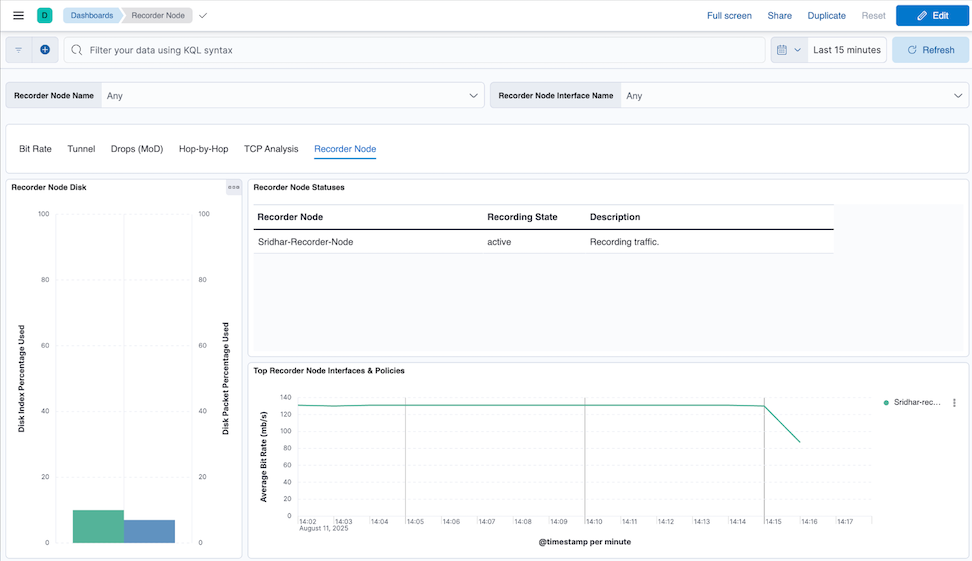
The dashboard now includes enhanced RN Statistics to:
- Identify which interfaces and policies transmit packets to the RN.
- Monitor the current recording status.
- Track disk usage for both the RN index and packet storage.
Follow the CLI instructions to provision the DMF Controller with the AN IP address to enable statistics export.
Using the Recorder Node Command Line Interface
Viewing Information about a Recorder Node
Changing the Recorder Node Default Configuration
Recorder Node Management Migration L3ZTN
Manage the DMF Recorder Node
Basic Configuration
- Set the MAC address of the RN.
controller-1(config-recorder-node)# mac 18:66:da:fb:6d:b4
Determine from the chassis ID of connected devices if the management MAC is unknown.
Authentication Token Configuration
Static authentication tokens are pushed to each Recorder Node (RN) as an alternative form of authentication in headless mode when the DANZ Monitoring Fabric (DMF) Controller is unreachable or by third-party applications that do not have or do not need DMF controller credentials to query the RN.
controller-1(config)# recorder-node auth token mytoken
Auth : mytoken
Token : some_secret_string <--- secret plaintext token displayed once here
controller-1 (config)# show running-config recorder-node auth token
! recorder-node
recorder-node auth token mytoken $2a$12$cwt4PvsPySXrmMLYA.Mnyus9DpQ/bydGWD4LEhNL6xhPpkKNLzqWS <---hashed token shows in running config
controller-1(config)# recorder-node auth generate-controller-token
Configuring the Pre-buffer
controller-1(config)# recorder-node device name
controller-1(config-recorder-node)# pre-buffer minutes
Replace name with the recorder node name. Replace minutes with the number of minutes to allocate to the pre-buffer.
Triggering a Recorder Node Event
To trigger an event for a specific Recorder Node (RN), enter the following command from enable mode:
controller-1# trigger recorder-node name event event-name
Replace name with the RN name and replace event-name with the name to assign to the current event.
Terminating a Recorder Node Event
controller-1# terminate recorder-node name event event-name
Replace name with the RN name and replace event-name with the RN event name to terminate.
Viewing Recorder Node Events
controller-1# show recorder-node events
# Packet Recorder Time                           Event
-|---------------|------------------------------|-------------------------------------------------------------------|
1 pkt-rec-740     2018-02-06 16:21:37.289000 UTC Pre-buffer event my-event1 complete. Duration 3 minute(s)
2 pkt-rec-740     2018-02-06 20:23:59.758000 UTC Pre-buffer event event2 complete. Duration 73 minute(s)
3 pkt-rec-740     2018-02-07 22:39:15.036000 UTC Pre-buffer event event-02-7/event3 complete. Duration 183 minute(s)
4 pkt-rec-740     2018-02-07 22:40:15.856000 UTC Pre-buffer event event5 triggered
5 pkt-rec-740     2018-02-07 22:40:16.125000 UTC Pre-buffer event event4/event-02-7 complete. Duration 1 minute(s)
6 pkt-rec-740     2018-02-22 06:53:10.216000 UTC Pre-buffer event triggered
Run Recorder Node Queries
Packet Replay
replay recorder-node command from enable mode to replay the packets recorded by a Recorder Node (RN).
controller-1# replay recorder-node name to-delivery interface filter stenographer-query
[realtime | replay-rate bps ]
- name: Specify the RN from which to replay the recorded packets.
- interface: The DMF delivery interface name receiving the packets.
- stenographer-query: The filter used to look up desired packets.
- (Optional) real-time: Replay the packets at the original rate recorded by the specified RN. The absence of this parameter will result in a replay up to the line rate of the RN interface.
- (Optional) replay-rate bps: Specify the number of bits per second used for replaying the packets recorded by the specified RN. The absence of this parameter will result in a replay up to the line rate of the RN interface.
controller-1# replay recorder-node packet-rec-740 to-delivery eth26-del filter 'after 1m ago'
controller-1#
Replay policy details:
controller-1# show policy-flow | grep replay
1 __replay_131809296636625 packet-as5710-2 (00:00:70:72:cf:c7:cd:7d) 0 0 6400 1
in-port 47 apply: name=__replay_131809296636625 output: max-length=65535, port=26
Packet Data Query
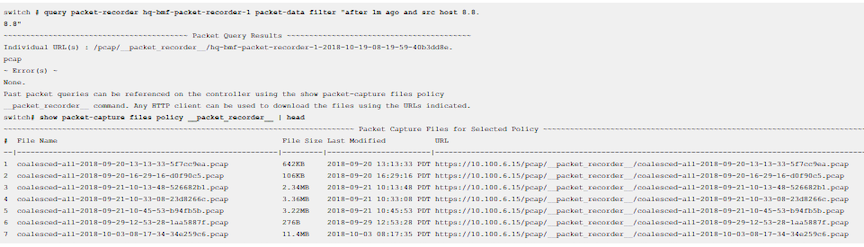
Use a packet query to search the packets recorded by a specific Recorder Node (RN). The operation uses a Stenographer query string to filter only the interesting traffic. The query returns a URL to download and analyze the packets using Wireshark or other packet-analysis tools.
switch # query recorder-node name packet-data filter stenographer-query
- name: Identify the RN.
- packet-data filter stenographer-query: Look up only the packets that match the specified Stenographer query.
Packet Object Query
switch# query recorder-node bmf-integrations-pr-1 packet-object filter 'after 5m ago'
switch# query recorder-node bmf-integrations-pr-1 packet-object filter 'after 1m ago'
~~~~~~~~~~~~~~~~~~~~~~~~~~~~~~~~~~~ Packet Object Query Results ~~~~~~~~~~~~~~~~~~~~~~~~~~~~~~~~~~~
Coalesced URL     : /pcap/__packet_recorder__/coalesced-bmf-2022-11-21-14-27-56-67a73ea9.tgz
Individual URL(s) : /pcap/__packet_recorder__/bmf-integrations-pr-1-2022-11-21-14-27-55-598f5ae7.tgz
Untar the folder to extract the HTTP objects.
Size Query
Use a size query to analyze the number of packets and the total size recorded by a specific Recorder Node (RN). The operation uses a Stenographer query string to filter only the interesting traffic.
# query recorder-node name size filter stenographer_query
- name: Identify the RN.
- size filter stenographer-query: Analyze only the packets that match the specified Stenographer query.
switch# query recorder-node hq-bmf-packet-recorder-1 size filter "after 1m ago and src host 8.8.8.8"
~ Summary Query Results ~
# Packets : 66
Size      : 7.64KB
~ Error(s) ~
None.
Window Query
Use a window query to analyze the oldest and most recent available packets recorded by a specific Recorder Node (RN).
Enter the query recorder-node command from enable mode to run a window query.
switch# query recorder-node name window
- name: Identify the RN.
switch# query recorder-node hq-bmf-packet-recorder-1 window
~~~~~~~~~~~~~ Window Query Results ~~~~~~~~~~~~~
Oldest Packet Available : 2020-07-30 05:01:08 PDT
Newest Packet Available : 2020-10-19 08:14:21 PDT
~ Error(s) ~
None.
Stopping a Query
controller-1# abort recorder-node name filter string
controller-1# abort recorder-node hq-bmf-packet-recorder-1 filter ""
Abort any request with the specified filter? This cannot be undone. enter "yes" (or "y") to
continue:
yes
Result : Success
~ Error(s) ~
None.
Viewing Query History
View Recorder Node (RN) submitted queries using the CLI.
dmf-controller> show recorder-node query-history
#   Packet Recorder Query          Type                     Start                          Duration
---|---------------|--------------|------------------------|------------------------------|--------|
1   HW-PR-2         after 10m ago  analysis-hosts           2019-03-20 09:52:38.021000 PDT 3428
2   HW-PR-1         after 10m ago  analysis-hosts           2019-03-20 09:52:38.021000 PDT 3428
3   HW-PR-2         after 10m ago  abort                    2019-03-20 09:52:40.439000 PDT 711
4   HW-PR-1         after 10m ago  abort                    2019-03-20 09:52:40.439000 PDT 711
---------------------------------output truncated---------------------------------------------------
Using RBAC to Manage Access to the DMF Recorder Node
Use Role-Based Access Control (RBAC) to manage access to the DANZ Monitoring Fabric (DMF) Recorder Node (RN) by associating the RN with an RBAC group.
To restrict access for a specific RN to a specific RBAC group, use the CLI as described in the following instructions.
RBAC Configuration Using the CLI
View Information about a Recorder Node
This section describes monitoring and troubleshooting the Recorder Node (RN) status and operation. The RN stores packets on the main hard disk and the indices on the SSD volumes.
Viewing the Recorder Node Interface
controller-1(config)# show topology recorder-node
# DMF IF       Switch IF  Name       State Speed  Rate Limit
-|------------|----------|----------|-----|------|----------|
1 RecNode-Intf Arista7050 ethernet1  up    25Gbps -
Viewing Recorder Node Operation
controller-1# show recorder-node device packet-rec-740 interfaces stats
Packet Recorder Name Rx Pkts       Rx BytesRx Drop  Rx Errors Tx Pkts  Tx Bytes   Tx Drop Tx Errors
---------------|----|-------------|---------------|--------|---------|--------|----------|-------|---------|
packet-rec-740  pri1 2640908588614 172081747460802 84204084 0 24630503 3053932660 0       0
Ctrl-2(config)# show policy PR-policy
Policy Name                            : PR-policy
Config Status                          : active - forward
Runtime Status                         : installed
Detailed Status                        : installed - installed to forward
Priority                               : 100
Overlap Priority                       : 0
# of switches with filter interfaces   : 1
# of switches with delivery interfaces : 1
# of switches with service interfaces  : 0
# of filter interfaces                 : 1
# of delivery interfaces               : 1
# of core interfaces                   : 0
# of services                          : 0
# of pre service interfaces            : 0
# of post service interfaces           : 0
Push VLAN                              : 1
Post Match Filter Traffic              : 1.51Gbps
Total Delivery Rate                    : 1.51Gbps
Total Pre Service Rate                 : -
Total Post Service Rate                : -
Overlapping Policies                   : none
Component Policies                     : none
Installed Time                         : 2023-09-22 12:16:55 UTC
Installed Duration                     : 3 days, 4 hours
~ Match Rules ~
# Rule
-|-----------|
1 1 match any

~~~~~~~~~~~~~~~~~~~~~~~~~~~~~~~~~~~~~~~~~~~~~~~~~~~~~~ Filter Interface(s)  ~~~~~~~~~~~~~~~~~~~~~~~~~~~~~~~~~~~~~~~~~~~~~~~~~~~~~~
# DMF IF      Switch              IF Name   State Dir Packets     Bytes          Pkt Rate Bit Rate Counter Reset Time
-|-----------|-------------------|---------|-----|---|-----------|--------------|--------|--------|------------------------------|
1 Lab-traffic Arista-7050SX3-T3X5 ethernet7 up    rx  97831460642 51981008309480 382563   1.51Gbps 2023-09-22 12:16:55.738000 UTC

~~~~~~~~~~~~~~~~~~~~~~~~~~~~~~~~~~~~~~~~~~~~~~~~~~~~~~~~ Delivery Interface(s) ~~~~~~~~~~~~~~~~~~~~~~~~~~~~~~~~~~~~~~~~~~~~~~~~~~~~~~~~
# DMF IF          Switch              IF Name    State Dir Packets     Bytes          Pkt Rate Bit Rate Counter Reset Time
-|---------------|-------------------|----------|-----|---|-----------|--------------|--------|--------|------------------------------|
1 PR-intf Arista-7050SX3-T3X5 ethernet35 up    tx  97831460642 51981008309480 382563   1.51Gbps 2023-09-22 12:16:55.738000 UTC

~ Service Interface(s) ~
None.

~ Core Interface(s) ~
None.

~ Failed Path(s) ~
None.
Ctrl-2(config)#
Viewing Errors and Warnings
- show fabric errors
- show fabric warnings
- show recorder-node errors
- show recorder-node warnings
| Type | Condition | Cause | Resolution |
|---|---|---|---|
| Error | Recorder Node (RN) management link down. | RN has not received controller LLDP. | Wait 30s if the recorder node is newly configured. Verify it is not connected to a switch port that is a DANZ Monitoring Fabric (DMF) interface. |
| Error | RN fabric link down. | Controller has not received RN LLDP. | Wait 30s if recorder node is newly configured. Check it is online otherwise. |
| Warning | Disk/RAID health degraded. | Possible hardware degradation. | Investigate specific warning reported. Could be temperature issue. Possibly replace indicated disk soon. |
| Warning | Low disk space. | Packet or index disk space has risen above threshold. | Prepare for disk full soon. |
| Warning | Disk full. | Packet or index disk space is full. Packets are being dropped or rotated depending on removal policy. | Do nothing if removal policy is rolling-FIFO. Consider erasing packets to free up space otherwise. |
| Warning | Recorder misconfiguration on a DMF interface. | A recorder node has been detected in the fabric on a switch interface that is configured as a filter or delivery interface. | Remove the conflicting interface configuration, or re-cable the recorder node to a switch interface not defined as a filter or delivery interface. |
Changing the Recorder Node Default Configuration
controller-1(config)# recorder-node device instance
Replace instance with the alias to use for the RN. This alias is affiliated with the MAC hardware address using the mac command.
config-recorder-node submode to override the default configuration for the associated RN:
- banner: Set the RN pre-login banner message
- mac: Configure the MAC address for the RN
- ntp: Configure RN to override default timezone and NTP parameters.
- snmp-server: Configure RN SNMP parameters and traps.
- logging: Enable RN logging to Controller.
- tacacs: Set TACACS defaults, server IP address(es), timeouts and keys.
- ntp override-global: Override global time configuration with RN time configuration.
- snmp-server override-global: Override global SNMP configuration with RN SNMP configuration.
- snmp-server trap override-global: Override global SNMP trap configuration with RN SNMP trap configuration.
- logging override-global: Override global logging configuration with packet recorder logging configuration.
- tacacs override-global: Override global TACACS configuration with RN TACACS configuration.
- ntp merge-global: Merge global time configuration with RN time configuration.
- snmp-server merge-global: Merge global SNMP configuration with RN SNMP configuration.
- snmp-server trap merge-global: Merge global SNMP trap configuration with RN SNMP trap configuration.
- logging merge-global: Merge global logging configuration with RN logging configuration.
TACACS configuration does not have a merge option. It can either be inherited from the DMF Controller or overridden to use only the RN-specific configuration.
Large PCAP Queries
Access the RN via a web browser to run large PCAP queries to the Recorder Node (RN). This allows running packet queries directly to the RN without specifying the maximum byte or packet limit for the PCAP file (which is required when executing the query from the DANZ Monitoring Fabric (DMF) Controller).
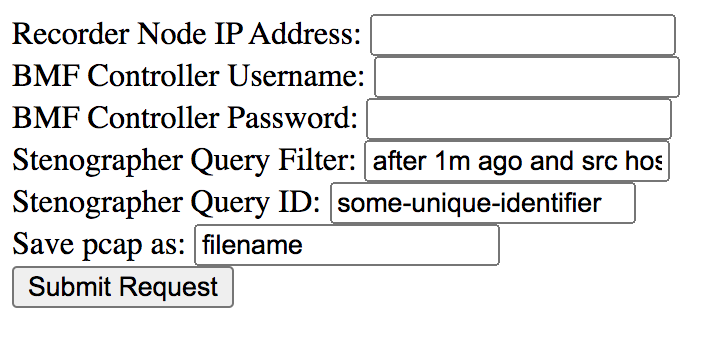
- Recorder Node IP Address: Enter the target RN IP address.
- DMF Controller Username: Provide the DMF Controller username.
- DMF Controller Password: Provide the password for authentication.
- Stenographer Query Filter: Use the query filter to filter the query results to look for specific packets. For example, to search for packets with a source IP address of 10.0.0.145 in the last 10 minutes, use the following filter:
after 10m ago and src host 10.0.0.145
- Stenographer Query ID: Starting in DMF 8.0, a Universally Unique Identifier (UUID) is required to run queries. To generate a UUID, run the following command on any Linux machine and use the result as the Stenographer query ID:
$ uuidgen
b01308db-65f2-4d7c-b884-bb908d111400
- Save pcap as: Provide the file name for this PCAP query result.
- Submit Request: Sends a query to the specified RN and saves the PCAP file with the provided file name to the default download location for the browser.
Recorder Node Management Migration L3ZTN
pre-configure.To migrate management to a new Controller, follow the steps below:
- Once the RN is back online, the DMF Controller receives the ZTN request.

- Verify the addition of the RN to the new DMF Controller using the command below:
Recorder Node Show Commands
The following commands are available from the Recorder Node (RN):
RecNode(config)# show version
Controller Version : DMF Recorder Node 8.1.0 (bigswitch/enable/dmf-8.1.x #5)
RecNode(config)#
RecNode(config)# show controllers
controller            Role   State     Aux
---------------------|------|---------|---|
tcp://10.106.8.2:6653 master connected 0
tcp://10.106.8.3:6653 slave  connected 0
tcp://10.106.8.3:6653 slave  connected 1
tcp://10.106.8.3:6653 slave  connected 2
tcp://10.106.8.2:6653 master connected 1
tcp://10.106.8.2:6653 master connected 2
RecNode(config)#
Ability to Deduplicate Packets - Query from Recorder Node
For Recorder Node queries, the recorded packets matching a specified query filter may contain duplicates when packet recording occurs at several different TAPs within the same network; i.e., as a packet moves through the network, it may be recorded multiple times. The dedup feature removes duplicate packets from the query results. By eliminating redundant information, packet deduplication improves query results' clarity, accuracy, and conciseness. Additionally, the dedup feature significantly reduces the size of query results obtained from packet query types.
Deduplicate Packets
In the DANZ Monitoring Fabric (DMF) Controller CLI, packet deduplication is available for the packet data, packet object, size, and replay query types. Deduplication is off by default for these queries. Add the dedup option to the end of the query command after all optional values (if any) have been selected to enable deduplication.
The following are command examples of enabling deduplication.
Enabling deduplication for a size query:
controller# query recorder-node rn size filter “before 5s ago” dedup
Enabling deduplication for a packet data query specifying a limit for the size of the PCAP file returned in bytes:
controller# query recorder-node rn packet-data filter “before 5s ago” limit-bytes 2000 dedup
Enabling deduplication for a replay query:
controller# replay recorder-node rn to-delivery dintf filter “before 5s ago” dedup
Enabling deduplication for a replay query specifying the replay rate:
controller# replay recorder-node rn to-delivery dintf filter “before 5s ago” replay-rate 100 dedup
Specify a time window (in milliseconds) for deduplication. The time window defines the time required between timestamps of identical packets to no longer be considered duplicates of each other. For example, for a time window of 200 ms, two identical packets with timestamps that are 200 ms (or less) apart are duplicates of each other. In contrast, if the two identical packets had timestamps more than 200 ms apart, they would not be duplicates of each other.
The time window must be an integer between 0 and 999 (inclusive) with a default time window of 200 ms when deduplication is enabled and no set time window value.
To configure a time window value, use the dedup-window option followed by an integer value for the time window after the dedup option.
controller# query recorder-node rn size filter “before 5s ago” dedup dedup-window 150
Enable Egress sFlow
Enable egress sFlow®* to sample traffic sent to any DANZ Monitoring Fabric (DMF) Recorder Node (RN) attached to the fabric. Examining these sampled packets on a configured sFlow collector allows the identification of post-match-rule flows recorded by the RNs without performing a query against the RNs. While not explicitly required, Arista Networks highly recommends using the DMF Analytics Node (AN) as the configured sFlow collector, as it can automatically identify packets sampled utilizing this feature.
Platform Compatibility
All platforms apart from the following series:
- DCS-7280R
- DCS-7280R2
- DCS-7500R
- DCS-7020
- DCS-7050X4
Configuration
The egress sFlow feature requires a configured sFlow collector. After configuring the sFlow collector, enter the following command from the config mode to enable the feature:
dmf-controller-1(config)# recorder-node sflow
To disable the feature, enter the command:
dmf-controller-1(config)# no recorder-node sflow
Mask DTMF Tones in RTP
The Mask Dual-tone Multi-Frequency (DTMF) in Real-time Transport Protocol (RTP) feature supports masking digits in voice data to hide sensitive information, such as credit card or social security numbers. Masking of sensitive data is a compliance issue that various agencies require to obfuscate information before storage.
The masking operation is a pipeline action executed on the DMF Service Node via a policy encompassing all Session Initiation Protocol (SIP) and RTP traffic. The Service Node parses SIP signaling and Session Description Protocol (SDP) bodies to identify UDP flows carrying RTP streams. For each identified flow, the node inspects the RTP payload for telephone-event packets (RFC 4733/2833) and maps digits 0–9 to a mask character (e.g., '*') to obfuscate the original input. All other packets are forwarded as is, with the sole exception of these masked telephone events. All current DMF platforms support this feature.
Configuration
- If no ports are specified, the action configures both
tcp-portandudp-portto the default value of5060. This setting applies exclusively to SIP/SDP packets and excludes RTP packets. - If custom ports are specified, the system configures the action with specified custom ports.
Configuration Examples
Case 1 - Default ports:
dmf-controller-1(config)# managed-service msd
dmf-controller-1(config-managed-srv)# 1 action sip-mask
dmf-controller-1(config-managed-srv-sip-mask)# show this
! managed-service
managed-service msd
service-interface switch core1 ethernet1
1 action sip-mask
Case 2 - Custom ports:
dmf-controller-1(config)# managed-service ms
dmf-controller-1(config-managed-srv)# 2 action sip-mask
dmf-controller-1(config-managed-srv-sip-mask)# tcp-port 5061
dmf-controller-1(config-managed-srv-sip-mask)# udp-port 5062
dmf-controller-1(config-managed-srv-sip-mask)# exit
dmf-controller-1(config-managed-srv)# show this
! managed-service
managed-service ms
service-interface switch core1 ethernet1

2 action sip-mask
tcp-port 5061
udp-port 5062
The sip-mask action maintains various counters to identify SIP parsing failures and related processing errors. View these values from the Controller by running the show debug
debug-counters service-node command.
Resources
- The Session Initiation Protocol is defined in RFC 3261.
- Discovery: The Service Node parses the SIP (RFC 3261) signaling.
- The Real-Time Transport Protocol is defined in RFC 3550.
- Inspection: It monitors the resulting RTP (RFC 3550) stream for specific Telephone Event (RFC 4733) packets.
- The Session Description Protocol is defined in RFC 8866.
- Mapping: It extracts the media port and payload type information from the SDP (RFC 8866) body.
Configure Recorder Note Stats in Analytics Node
Configuration
Configure the DMF Controller with the Analytics Node (AN) IP address to enable statistics export.
Configure Analytics Node Access Lists
redis and replicated-redis on the AN to allow the DMF Controller to establish the export channel.Permit traffic from both the active and standby physical IP addresses of the DMF Controller. The following example illustrates the required commands:
dmf-controller-1> en
dmf-controller-1# config
dmf-controller-1#(config) config-analytics
dmf-controller-1(config-analytics)# analytics-server address 10.240.145.2
Important: Now configure access for redis AND replicated-redis on the AN
AN(config-cluster-access)# access-list <redis|replicated-redis>
AN(config-cluster-access-list)# 1 permit from <DMF-active-physical-IP/32>
AN(config-cluster-access-list)# 2 permit from <DMF-standby-physical-IP/32>
Verify Channel Status
Verify that the export channel is active using the show analytics status command on the DMF Controller.
Replicated Redis
Status
is unhealthy. Both statuses must report healthy for full functionality.dmf-controller-1(config-analytics)# show analytics status # Analytics ip Redis Status Redis Timestamp Replicated Redis Status Replicated Redis Timestamp -|------------|------------|------------------------------|-----------------------|------------------------------| 1 10.240.145.2 healthy 2026-01-16 05:30:11.061000 UTC unhealthy 2026-01-16 05:30:11.061000 UTC
Refer to the Recorder Node Stats in Analytics Node section to view the AN dashboard.
Considerations and Limitations
Deduplication Limitations
Expect a query with packet deduplication enabled to take longer to complete than packet deduplication disabled. Hence, packet deduplication, by default, is off.
The maximum time window value permitted is 999 ms to ensure that TCP retransmissions are not regarded as duplicates, assuming that the receive timeout value for TCP retransmissions (of any kind) is at least 1 second. If the receive timeout value is less than 1 second (particularly, exactly 999 ms or less), then it is possible for TCP retransmissions to be regarded as duplicates when the time window value used is larger than the receive timeout value.
Due to memory constraints, removing some duplicates may not occur as expected. This scenario is likely to occur if a substantial amount of packets match the query filter, which all have timestamps within the specified time window from each other. We refer to this scenario as the query having exceeded the packet window capacity. To mitigate this from occurring, decrease the time window value or use a more specific query filter to reduce the number of packets matching the query filter at a given time.
Guidelines and Limitations for Enabling Egress sFlow
Consider the following guidelines and limitations while enabling Egress sFlow:
- The Egress sFlow support for the Recorder Nodes (RN) feature requires a configured sFlow collector in a fabric configured to allow sFlows.
- If a packet enters a switch through a filter interface with sFlow enabled and exits through a port connected to an RN while the feature is enabled, only one sFlow packet (i.e., the ingress sFlow packet) is sent to the collector.
- The Egress sFlow feature does not identify which RN has recorded a given packet in a fabric when there are multiple RNs. This is fine in a normal case as the queries are issued to the RNs in aggregate rather than to individual RNs, and hence, the information that any RN has received a packet is sufficient. In some cases, it may be possible to make that determination from the outport of the sFlow packet, but that information may not be available in all cases. This is an inherent limitation of egress sFlow.
- An enabled egress sFlow feature captures the packets sent to any RN with recording enabled, regardless of whether the RN is actively recording or not.
Recorder Node Recording State API Limitations
The ready state only occurs after the recording application has finished initializing if no recordable traffic has been received yet. The recording application must undergo its initialization process whenever the RN is rebooted, restarted, or after restarting the RN application from the DMF Controller. If the RN is in the active state and stops receiving packets, it will not regress into the ready state; it will remain in the active state.
Mask DTMF Tones in RTP Limitations
Limitations
- This feature is currently limited to RTP containing telephone-event messages. Other tone encodings are not included.
- All digits are masked. There is no reasonable way to match a particular pattern, as each digit is in a separate packet.
- SIP over TLS is not supported.
- There is limited support for SIP over TCP. SIP messages divided across multiple TCP packets may not be parsed correctly.
- The
sip-maskaction can track up to 256K flows. When more flows are identified, the oldest existing flows are purged. View the flow count by running theshow debug counterscommand.
Recorder Node Support for CVaaS
The Recorder Node (RN) supports being managed by CloudVision (CV) on-prem starting DMF 8.7.0. This feature extends support to CVaaS starting DMF 8.8.0. Recorder Node was not supported with CVaaS before 8.8.0 because of an RN requirement to store the query results file in CV while archiving the query results. However, this was not permitted on CVaaS as these files might contain data that cannot be stored in a cloud service. This feature supports CVaaS by allowing the RN to store query result files.
Query Files and Storage
RN stores query files in the query archive directory. The system mounts the directory (/var/lib/query-archive) to a new storage volume called the archive volume. This volume (/dev/flvg/query-archive) is part of the RN’s main disk and can be 10 or 50GB in size, depending on the size of the main disk. This directory is mapped to a new file server on the RN, allowing retrieval of query files from the RN via a URL.
The RN manages stored query files without user input. The system automatically deletes files from the archive older than 7 days, deleting any files when the archive volume does not have enough space for a new query file to be stored. In this case, it first deletes the oldest files until enough space becomes available. Metadata queries require at least 256MB to be available on the volume, whereas the user can set this value for packet queries.
Stored Files State API
file-name: Name of stored query result filequery-id: ID of associated query requestcreation-time: ISO8601 timestamp of when the file was createdfile-size: Size of file in bytes
Query RPC API
storage-method for selecting the archiving method to use for the request. The new parameter is an enumeration that has the following choices:
- no-store: (default) Result will not be archived
- local: Store query result file on the local archive volume
- upload: Upload query result file to a remote file server
For packet queries, an additional input parameter called max-result-size is available. This parameter controls the maximum size (in bytes) of the query result, which by default is 2GB.
file-url entry which is the location where the query result file is stored. This is an empty string when no storage method is selected. For the upload method, this is the upload URL provided in the query input. For the local method, this is a relative URL for downloading the file from the file server on the RN.Platform Compatibility
This feature is available for both physical and virtual Recorder Nodes. The only difference between the two deployments is the size of the archive volume. For a physical RN, the volume size is 50GB. For the virtual RN, the volume size might be limited to 10GB in scenarios where the main disk (the disk of the platform where the virtual RN is deployed) is not sufficiently large.
Show Commands
The stored query files can be viewed from the RN CLI using show query stored-files. Below is an example of the output from this command.
pr1> show query stored-files
# Creation time           File name                                                       File size Query id
-|-----------------------|---------------------------------------------------------------|---------|--------------------------------|
1 2025-06-12 17:56:12 UTC size_2025-06-12T17-56-12Z_luwIwp4rnInbkb1j24BW8pj3ua_FwaYV.json 42B       luwIwp4rnInbkb1j24BW8pj3ua_FwaYV
2 2025-06-12 18:02:14 UTC size_2025-06-12T18-02-14Z_9AUJ277ZmpCTr07NszoEC0DCFggzixU2.json 43B       9AUJ277ZmpCTr07NszoEC0DCFggzixU2
Troubleshooting
- For issues with accessing the file server, view the access log on the RN at: /var/log/nginx/packet-recorder.access.log.
- For archiving errors returned by the query RPC, view the RN floodlight log at: /var/log/floodlight/floodlight.log. Error, warning, and info logs relating to this feature in the floodlight log have log ID prefix
RNQRY. The floodlight log can be filtered by this prefix to find logs relating to this feature for troubleshooting purposes. - For issues with the setup of the archive volume or directory, view the storage.service log using the following command in RN bash:
sudo journalctl -u storage.
RPC Errors
The following are new RPC errors that can be returned by a query if the local storage method is selected:
- 400: Invalid max result size, value exceeds total size of storage volume
- If this occurs for a packet query where the max-result-size parameter has been configured, please try decreasing the value of this parameter. The value of the parameter should not exceed the size of the volume. The size of the volume is 10GB or 50GB based on the platform used (VM or physical RN).
- If this occurs for a query where either the max-result-size parameter has not been configured or is not configurable, please try rebooting the RN.
- 500: Query file archive is unavailable, see floodlight log for details
- This error is due to the file archive being unhealthy in some capacity. The error log associated with this error has log ID
RNQRY7006. The exception included in this log indicates the specific issue resulting in the archive being considered unhealthy. Please try rebooting the RN.
- This error is due to the file archive being unhealthy in some capacity. The error log associated with this error has log ID
Considerations
- If a file that the RN is trying to delete is currently open, whether a user manually opened it or the system opened it because it is currently being downloaded, the delete operation will fail. In this case, the RN does not retry deleting the file, but the system removes it from the stored files list. So, it will appear as if the file has been deleted, but in fact, it has not been deleted. Restarting the RN will re-initialize the stored files list based on the contents of the archive directory, at which point the removed file is tracked again in the list.
- Users can manually delete files from the archive directory. However, this is not recommended unless necessary, as it causes the stored files list to be out of sync with the filesystem for a short time. Manually deleted files are removed from the stored files list within an hour of being deleted.
- Users can store other files within the archive directory if desired. However, this is not recommended unless necessary since the RN only manages query files within this directory. The RN ignores all other files within this directory, so they will never be deleted or modified in any way. This is problematic if these files occupy a large amount of space on the volume, which may lead to queries failing due to a lack of available space.