Managing DMF Switches and Interfaces
This chapter describes the basic configuration required to deploy and manage DANZ Monitoring Fabric (DMF) switches and interfaces.
DMF Switches Dashboard
DANZ Monitoring Fabric (DMF) 8.7 introduces an updated Switches dashboard. A header and tabulated layout enable observation of different aspects of the installed switches and provisioning new switches, all within the same dashboard.
Using the DMF Switches Dashboard
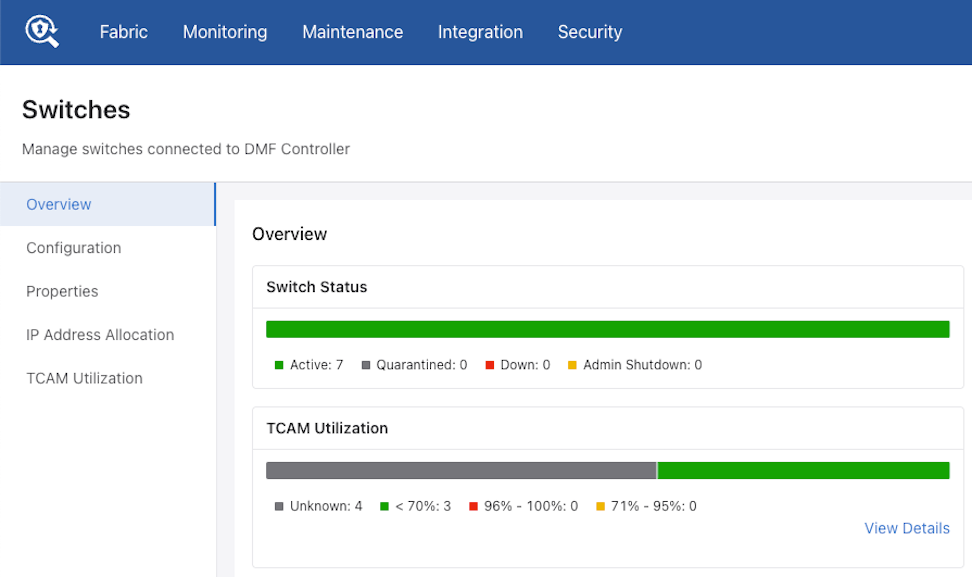
Overview
Select .
The Overview dashboard comprises two separate sections: Overview and Inventory.

The Overview section has seven charts.
- Switch Status: Displays the summary of switch connection status.
- Zerotouch State: Displays the summary of Zerotouch state of all switches.
- TCAM Utilization: Displays the TCAM usage of all switches. The View Details link navigates to the TCAM Utilization and Capacity view.
- Alerts: Displays the count of relevant switch alerts and warnings. The View Details link navigates to the Alerts page.
- Fan Status: Displays the switch count, and fan count; a donut chart shows the percentage of fans with an unhealthy status.
- Thermal Sensor Status: Displays the switches count, thermal sensors count and a donut chart showing the percentage of sensors with an unhealthy status.
- PSU (Power Supply Unit) Status: displays the switches count, PSU count, and a donut chart showing the percentage of PSUs with unhealthy status.
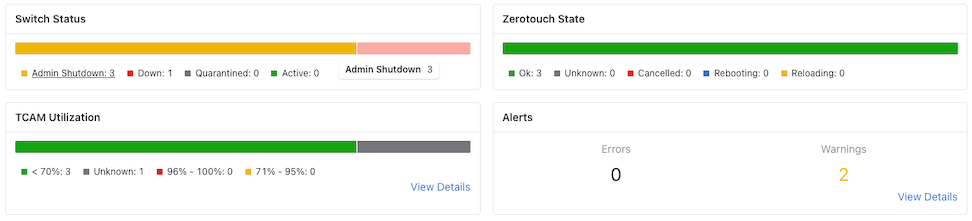
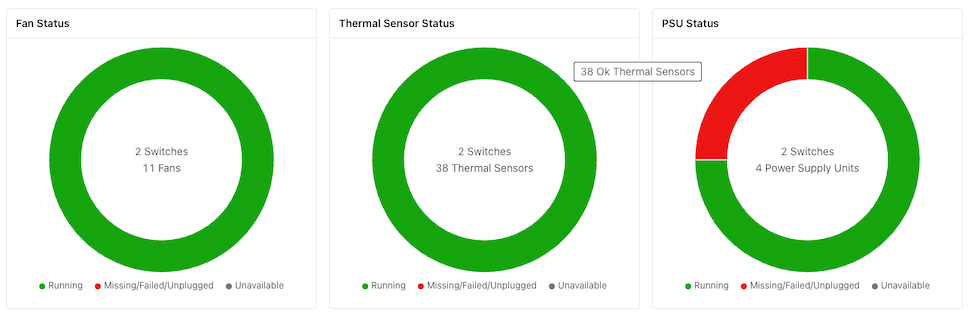
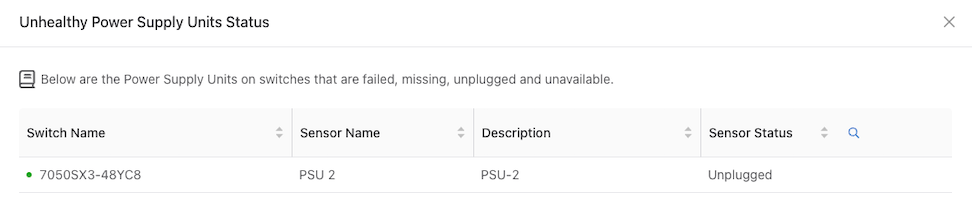
Selecting an unhealthy arc in Fan Status, Thermal Sensor, or PSU, opens a status window listing the items with an abnormal status or if the status is unavailable.
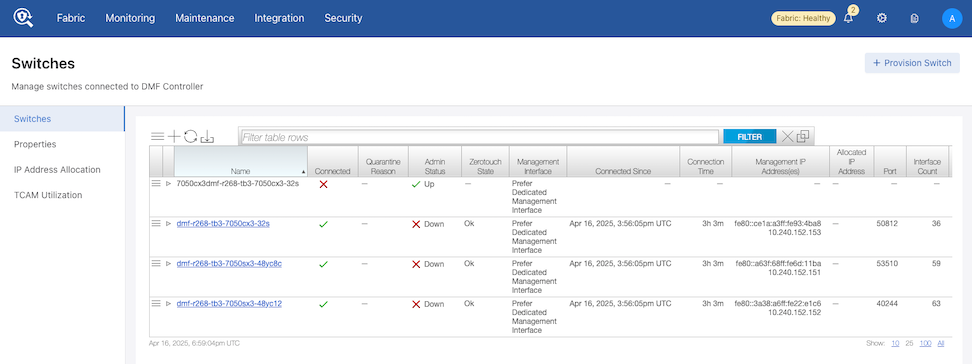
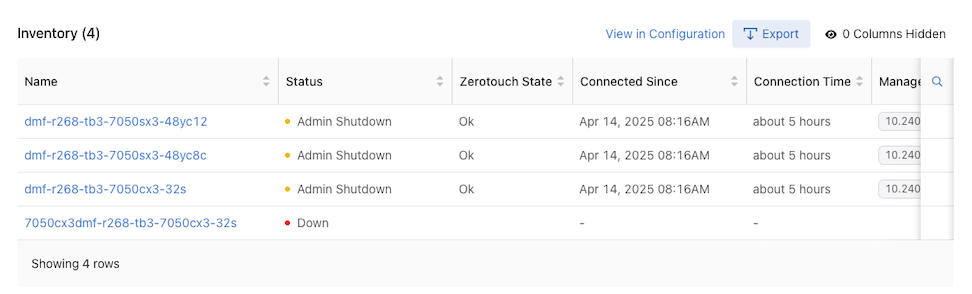
Inventory
The Inventory section displays all inventory records configured in the switches. Table functionality includes exporting, filtering, sorting, hiding, or showing columns.
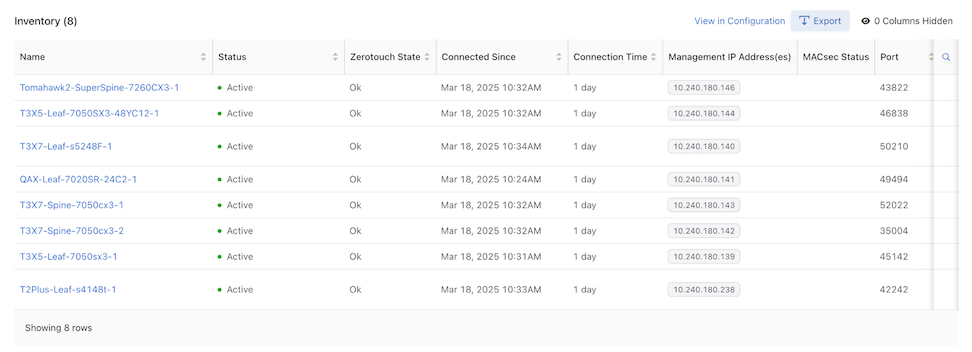
Columns include:
| Name | Status | Zerotouch State |
|---|---|---|
| Connected Since | Connection Time | Management IP Address(es) |
| MACsec Status | Port | SKU |
| Platform | Serial Number | ASIC |
| Software Description | Pipeline Mode |
Search: Filter rows with matching text.
Optic Cable Transceiver Detail Information
The Switch detail page in the DMF GUI has an Inventory tab displaying information about optics, cables, and transceivers.
Select to display a list of fabric switches.
Choose a switch from the Configuration list.

Select Inventory to view the inventory details.
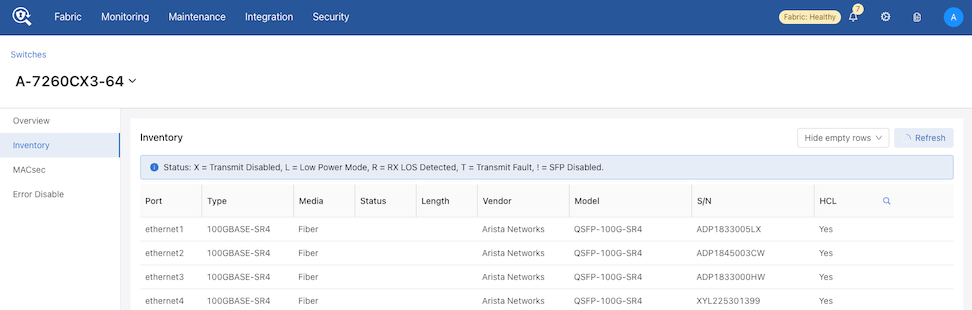
Refresh Button

The data in the Inventory tab refreshes automatically every 60 seconds. However, you can manually refresh the data by using Refresh as needed.
The inventory data for SwitchLight (SWL) and EOS switches display differently.
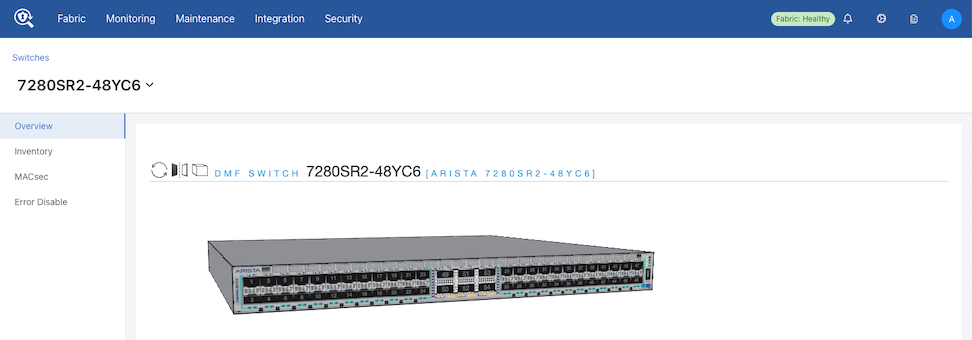
Header
The header contains two interactive components.
- A Switches back button that returns user to the switches page or configuration table.
- A Select drop-down to conveniently view the inventory of other switches and allows text and search.
- Back Button & Select Drop-down.
Figure 12. Back Button & Select Drop-down 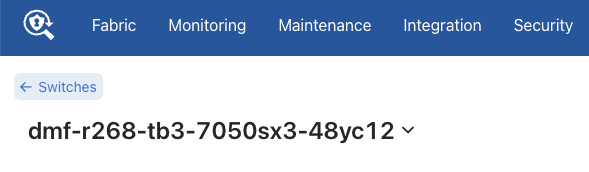
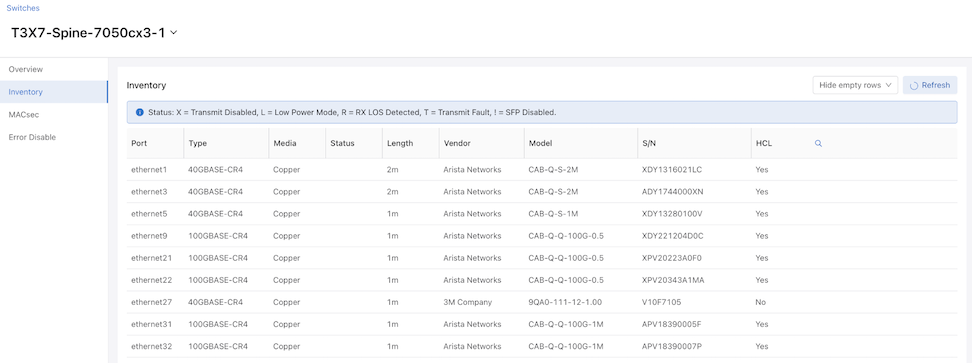
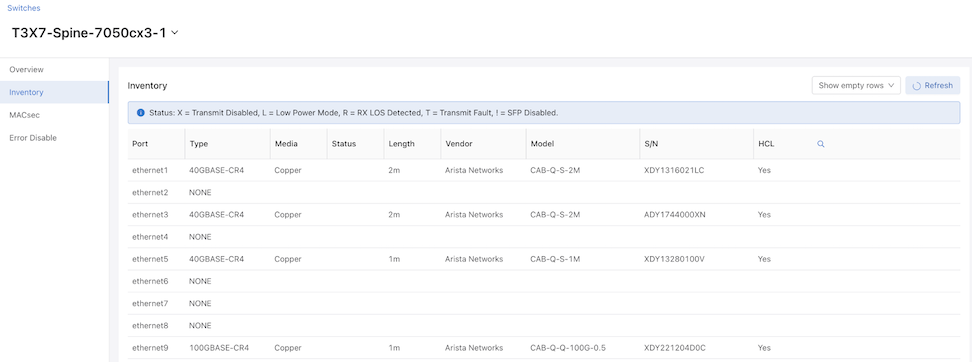
SwitchLight (SWL) Switch
DMF displays SwitchLight switches inventory information as a table. Search functionality allows quick entry lookup.
There is an option to hide and show the table with empty rows.
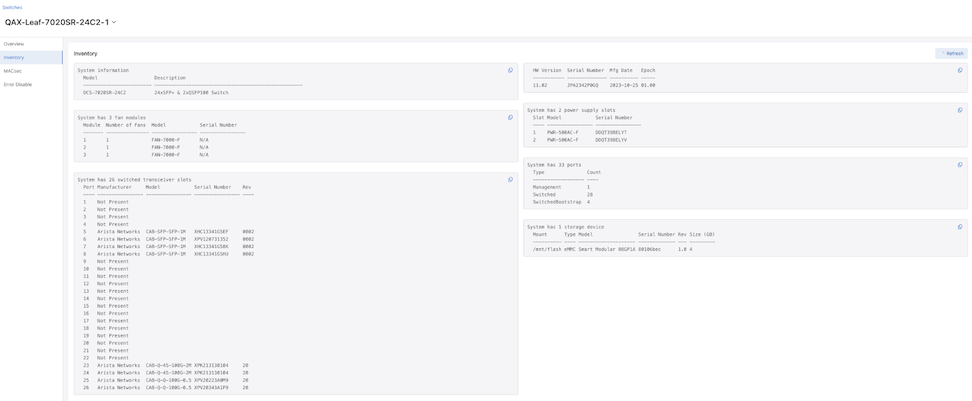
EOS Switch
DMF displays the inventory information for EOS switches in block format. Each block displays a different aspect of the inventory and contains a copy icon enabling quick data copying.
Configuration
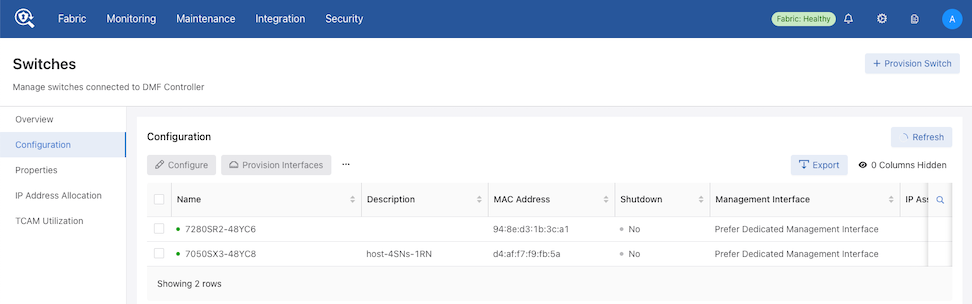
Configuration Details: A sortable display of all configurations of the switches currently installed in DMF.
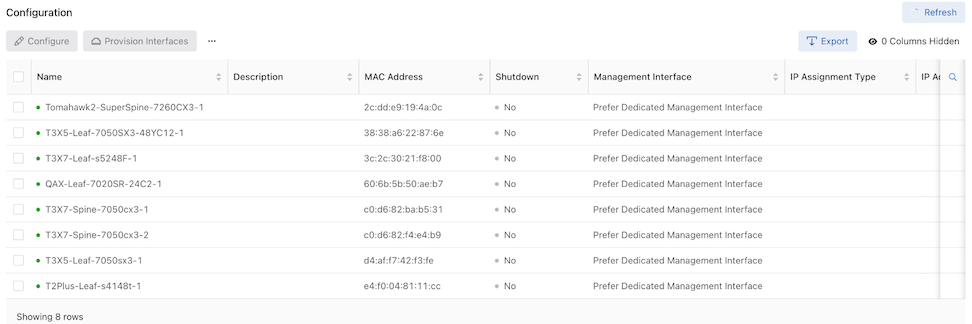
Columns include:
| Name | Description |
|---|---|
| MAC Address | Shutdown |
| Management Interface | IP Assignment Type |
| IP Address | Tunnel Encapsulation Type |
| Strip VXLAN UDP Port | Password |
| PTP Domain | PTP Priority1 |
| PTP IPv4 Address | PTP IPv6 Address |
The Configuration dashboard comprises the following components and controls:
- Refresh: By default, the system refreshes data every 60 seconds. Hovering over Refresh displays the time remaining until the next update. When required, select Refresh to update the data immediately.
- Configure: Opens the Configuration Switch window with pre-populated switch information. Edit the configuration as required and select Save.
Configure is disabled unless one switch is selected.
Figure 18. Configure Switch 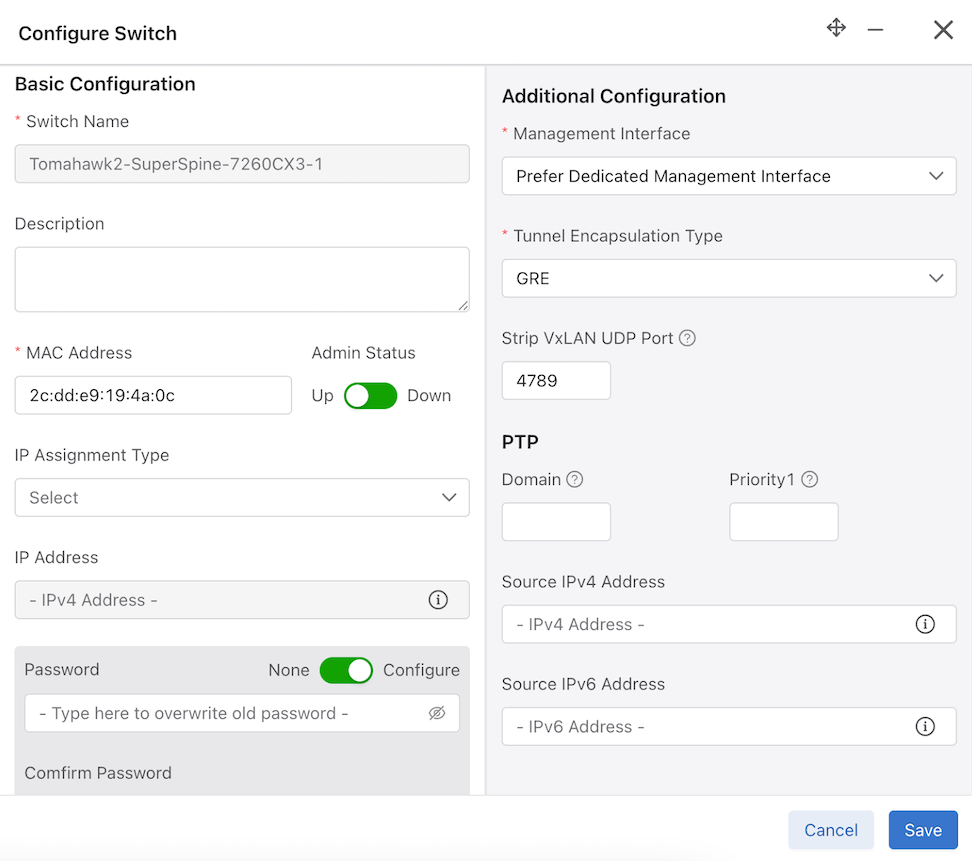
- Provision Interfaces: Provides a fast and convenient way to populate a large number of interfaces. Prefix works similarly to template string formatting, where the
{num}is replaced by a number between start and end, if present.Provision Interfaces is disabled unless one switch is selected.
Figure 19. Provision Interfaces 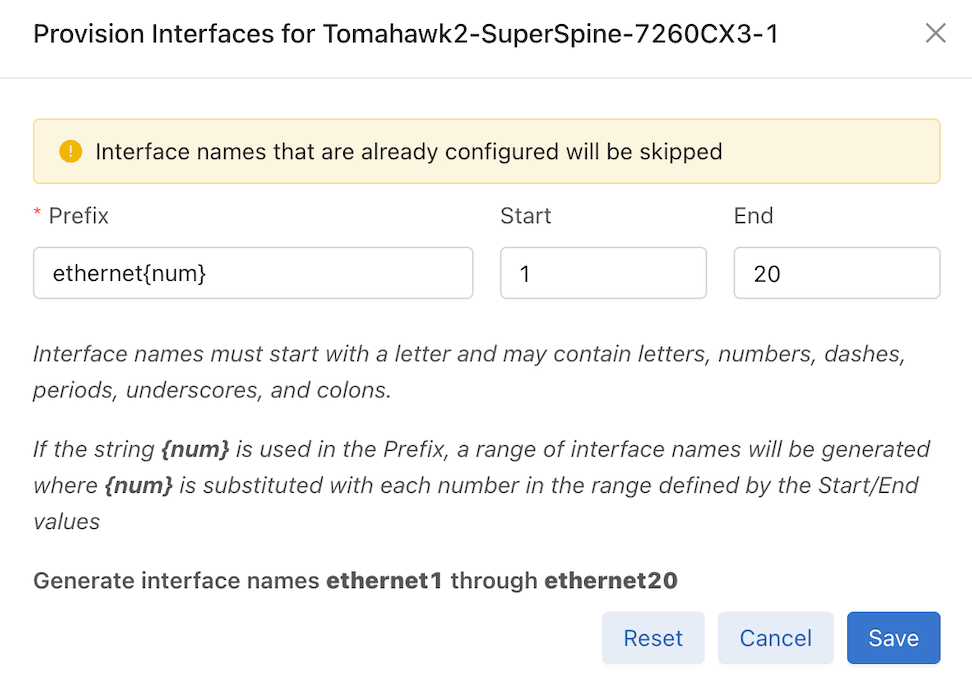
- Reset: Disconnect and reset the connection to the switch.
Reset is disabled unless one switch is selected.
Figure 20. Confirm Reset 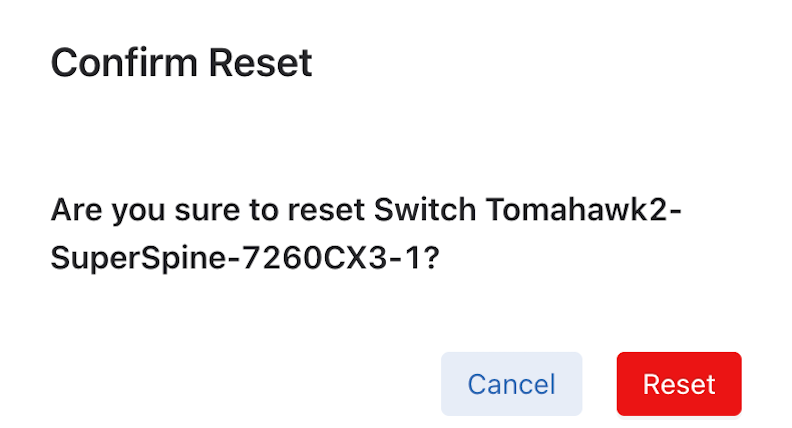
- Shutdown: Sets shutdown property of the switch config to true, thus shutting down the switch.
Shutdown is disabled unless one switch is selected.
Figure 21. Confirm Shutdown 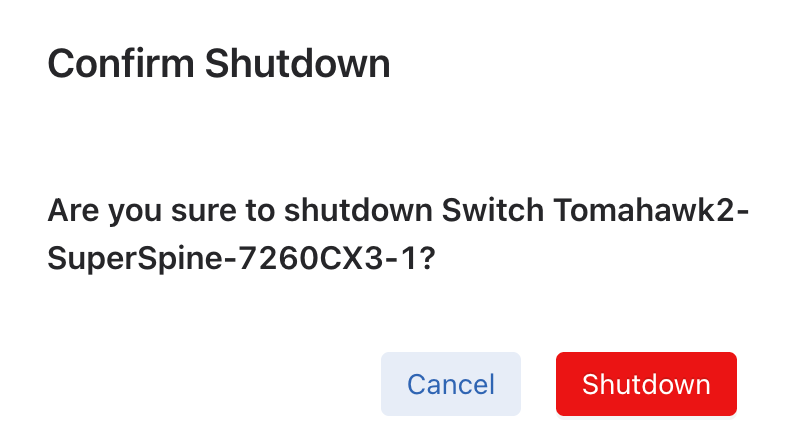
- Reboot: Reboot the zerotouch device.
Reboot is disabled unless one switch is selected and the selected switch is a ZTN device. For a Chassis, select the Module Type and the Slot to reboot.
- Beacon: Beacons the LED light of the zerotouch device for a certain period.
Beacon is disabled unless one switch is selected and the selected switch is a ZTN device.
Figure 22. Confirm Beacon 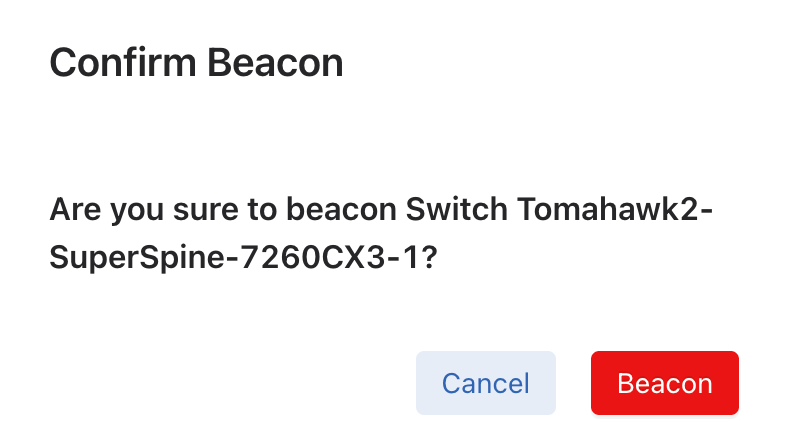
For a Chassis, select the Module Type, Slot, and Option to beacon.
- Clear Config: Deletes the current switch configuration.
Clear is disabled unless one switch is selected.
Figure 23. Config Clear 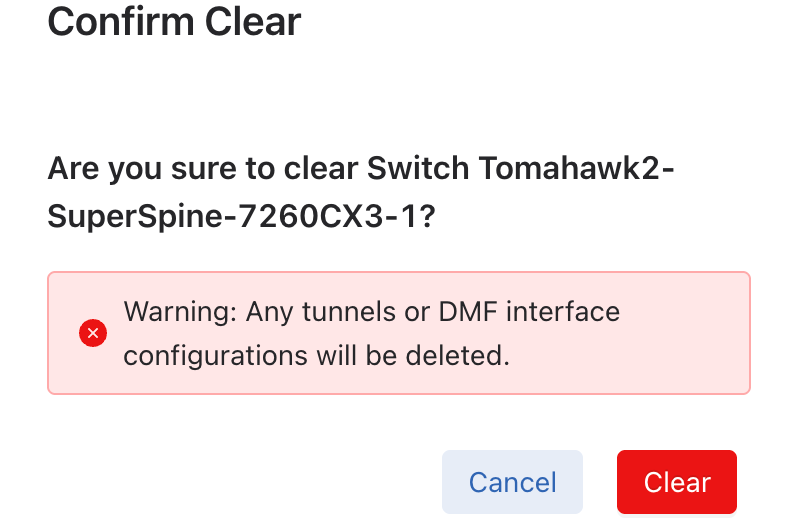
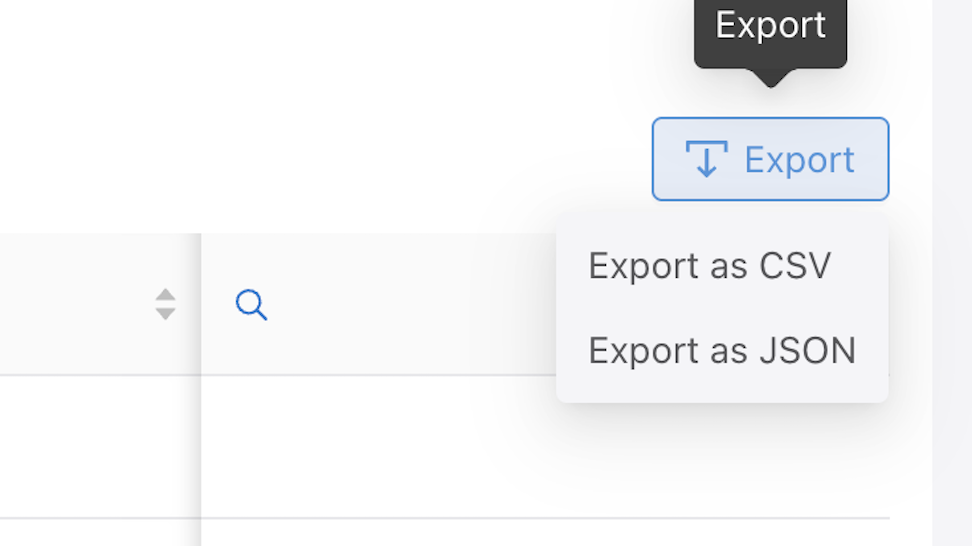
- Export: Export the data in CSV or JSON format.
Figure 24. Export Data 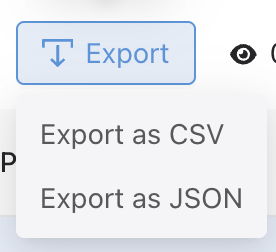
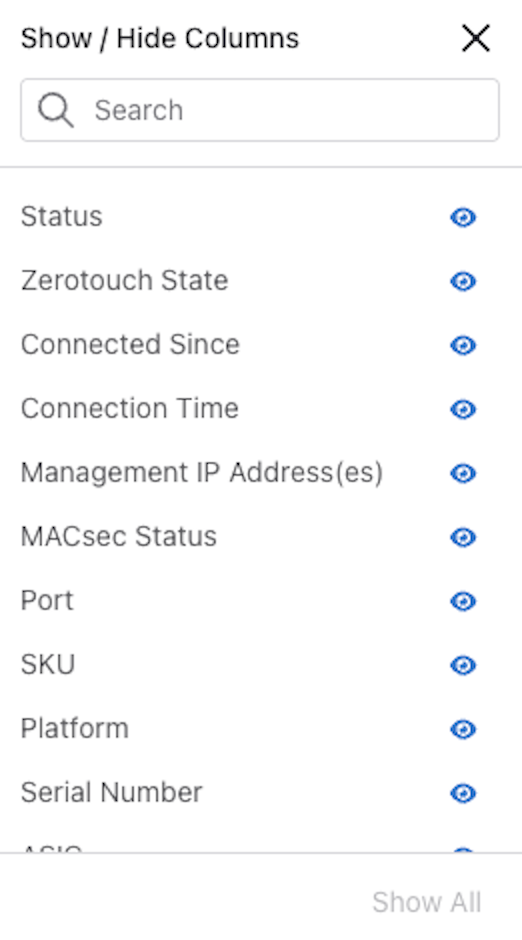
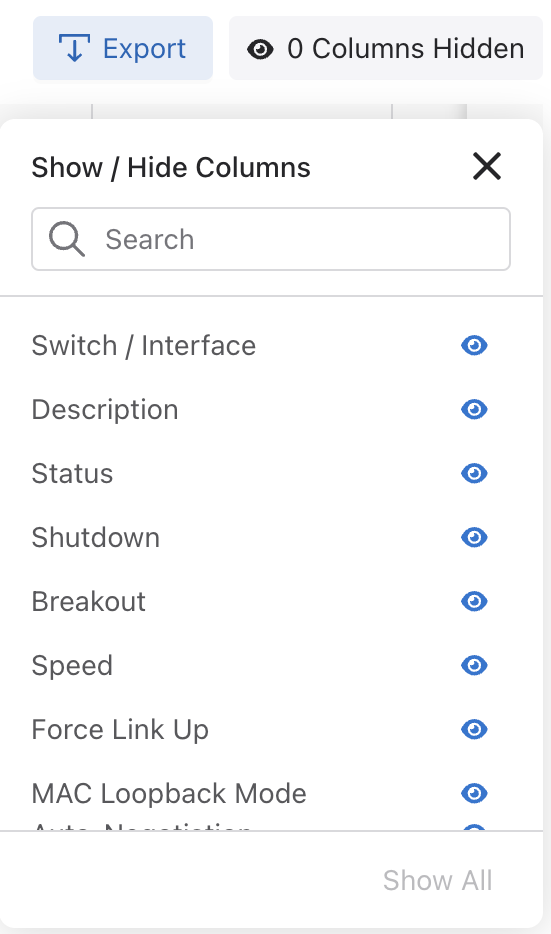
- Show / Hide Columns determine the information displayed in the dashboard and are user-selectable. Selections persist until changed.
Note: The Name column cannot be hidden.
Figure 25. Show / Hide Columns 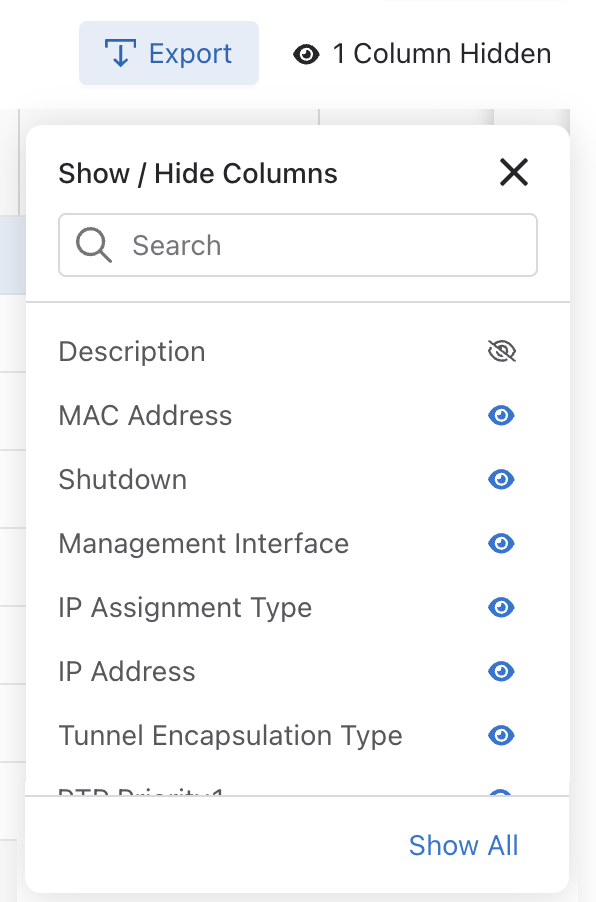
- Search: Filter rows with matching text.
Properties
Select .
Properties Dashboard: A sortable display of all switch properties currently installed in DMF.
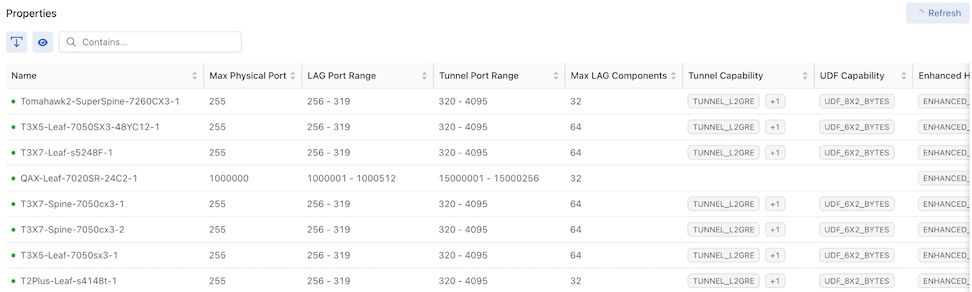
Columns include:
| Name | Max Physical Port |
|---|---|
| LAG Port Range | Tunnel Port Range |
| Max LAG Components | Tunnel Capability |
| UDF Capability | Enhanced Hash Capability |
| Rate Limit Range | Max Multicast Replication Groups |
| Max Multicast Replications | Supports CPU Trap Table |
| PTP Timestamp Capability | Truncate Range |
| Strip Header Capability | MACsec Capability |
| Port Count | Egress Strip VLAN Capability |
The Properties dashboard comprises the following components and buttons:
- Refresh: By default, the system refreshes data every 60 seconds. Hovering over Refresh displays the time remaining until the next update. When required, select Refresh to update the data immediately.
-
Actions:
- Export: Export data in CSV or JSON format.
- Show / Hide Columns determine the information displayed in the dashboard and are user-selectable. Selections persist until changed.
Figure 27. Show / Hide Columns Note: The Name column cannot be hidden.
- Search: Filter rows with matching text.
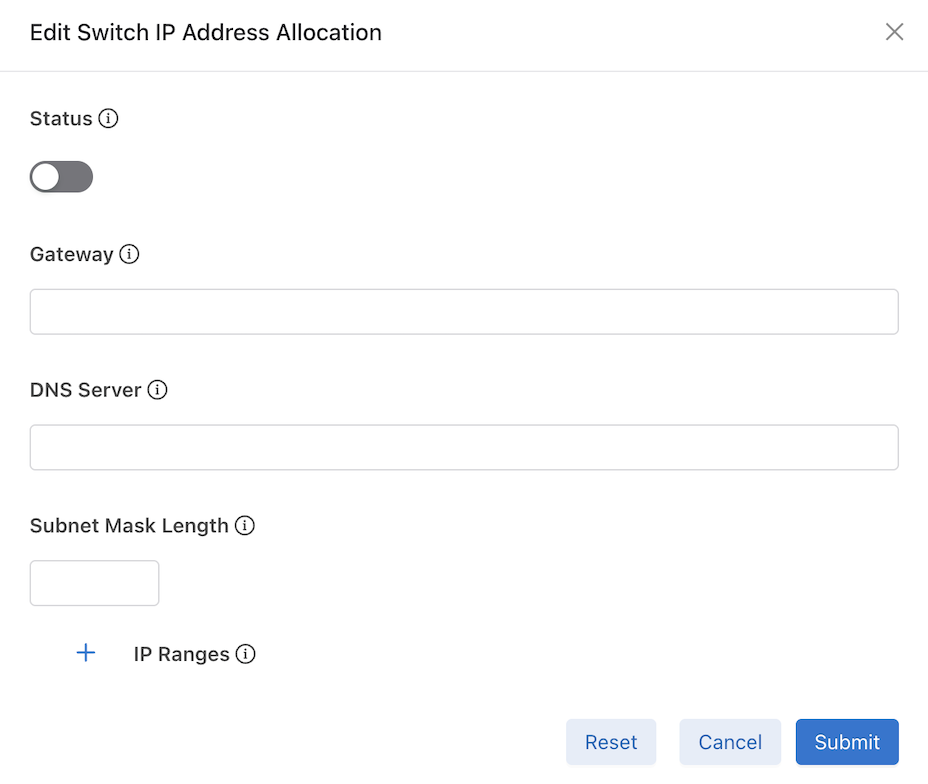
IP Address Allocation
Select .
The IP Address Allocation dashboard displays the current switches' IP Address Allocation Configuration and IP Range Allocation Status.
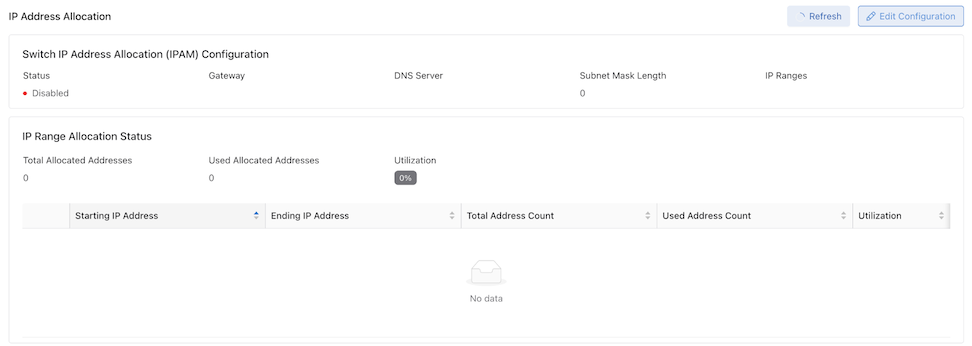
Columns include:
| Starting IP Address | Ending IP Address | Total Address Count | Used Address Count | Utilization |
Select Edit Configuration to configure or modify IP Address Allocation.
Use Status to enable or disable the feature.
Enter the required information and select Submit. Optionally, select Reset to clear the information and start again.
TCAM Utilization
Select .
The TCAM Utilization and Capacity dashboard displays the TCAM utilization and capacity of the current switches. View capacity and utilization of Ingress Flow 1 and Ingress Flow 2 TCAM tables on supported switches.
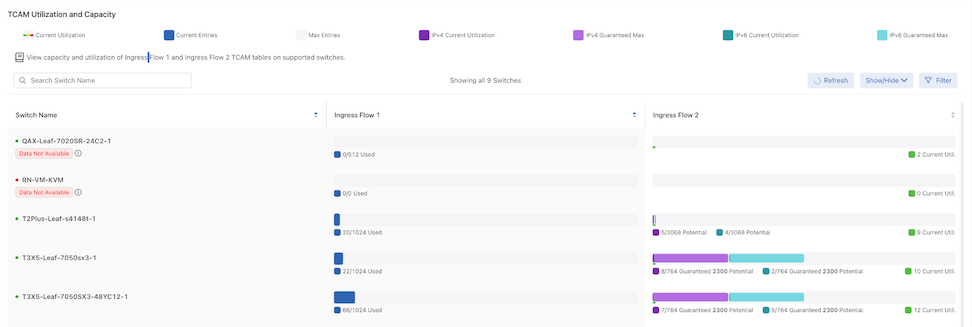
Columns include:
| Switch Name | Ingress Flow 1 | Ingress Flow 2 |
The TCAM Utilization and Capacity dashboard comprises the following components and buttons:
- Refresh: By default, the system refreshes data every 60 seconds. Hovering over Refresh displays the time remaining until the next update. When required, select Refresh to update the data immediately.
-
Show / Hide Columns determine the information displayed in the dashboard and are user-selectable. Selections persist until changed.
Figure 31. Show / Hide Columns 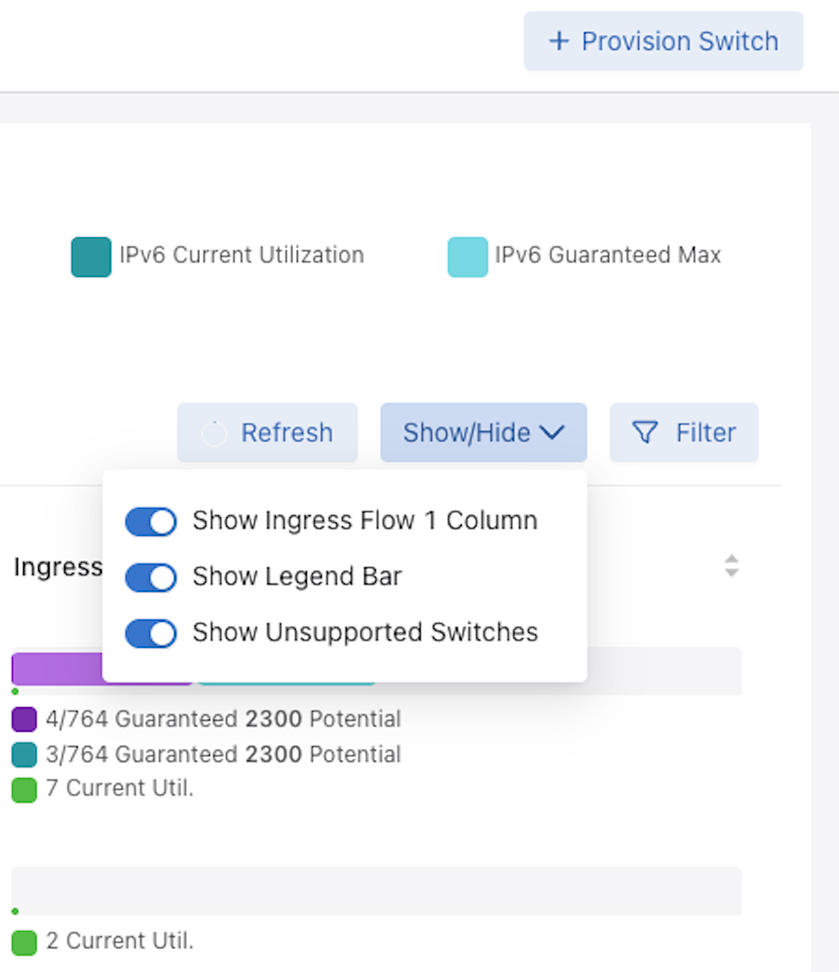
-
Filter: Filter on Ingress Flow 1 and Ingress Flow 2 by entering a value or moving the sliders and select Apply.
Figure 32. Filter Ingress Flow 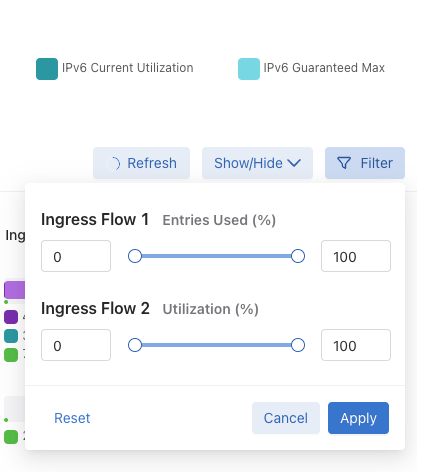
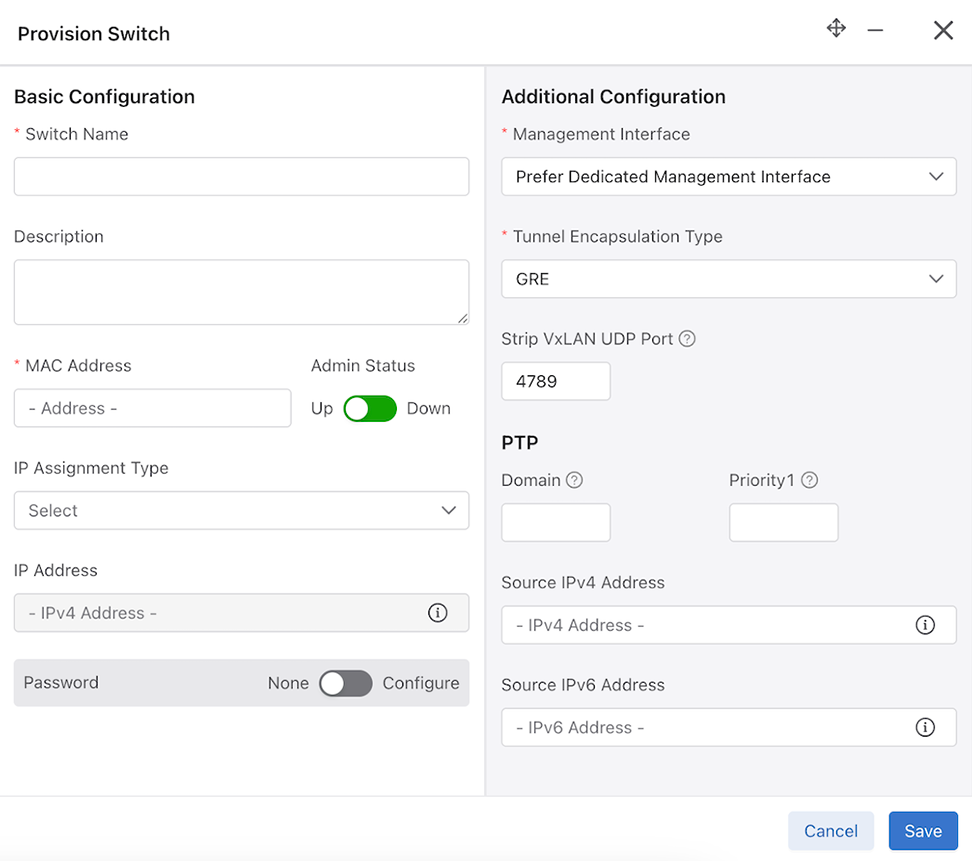
Provision Switch
Select .
Provision Switch opens a window to provision a single switch. The required fields are:
- Switch Name
- MAC Address
- Management Interface
- Tunnel Encapsulation Type
The remaining fields are optional.
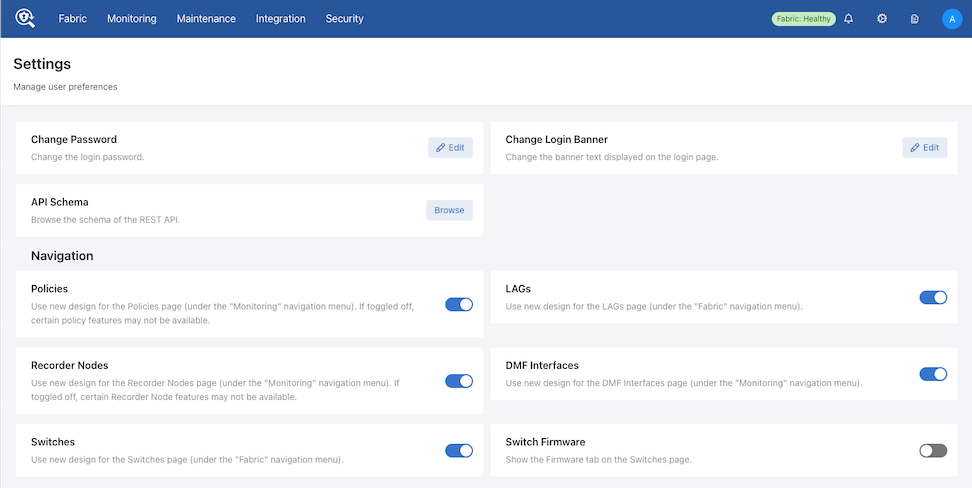
Firmware
The Firmware dashboard is hidden by default (Dell switches are not supported in the DMF 8.7.0 release).
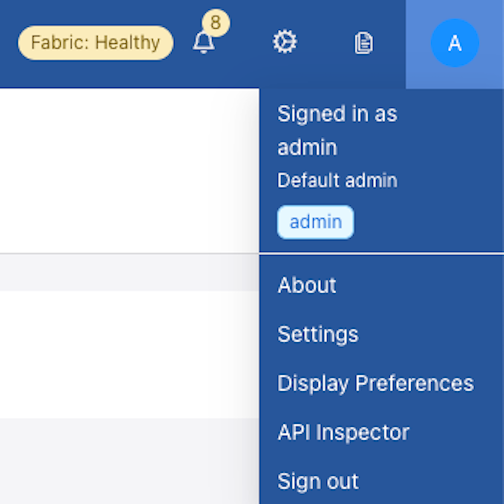
If required, enable the Firmware dashboard using Switch Firmware on the Settings page.
To access the page, select the Admin icon followed by Settings.
Firmware
Select .
Firmware Dashboard: A sortable display of all switch firmware properties currently installed in DMF.
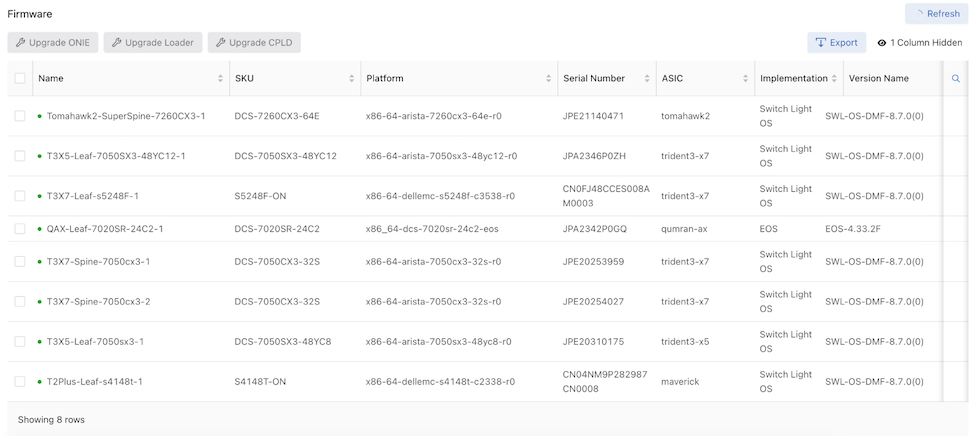
Columns include:
| Name | Manufacturer |
|---|---|
| SKU | Platform |
| Serial Number | ASIC |
| Implementation | Version Name |
| Loader Version | Next Loader Version |
| CPLD | Next CPLD |
| ONIE | Next ONIE |
The Firmware dashboard comprises the following components:
- Refresh: By default, the system refreshes data every 60 seconds. Hovering over Refresh displays the time remaining until the next update. When required, select Refresh to update the data immediately.
-
Actions:
- Upgrade ONIE: Upgrade the ONIE settings of the current switch from the Current Version to the Next Version.
Upgrade is disabled unless one switch is selected.
Figure 37. Upgrade ONIE 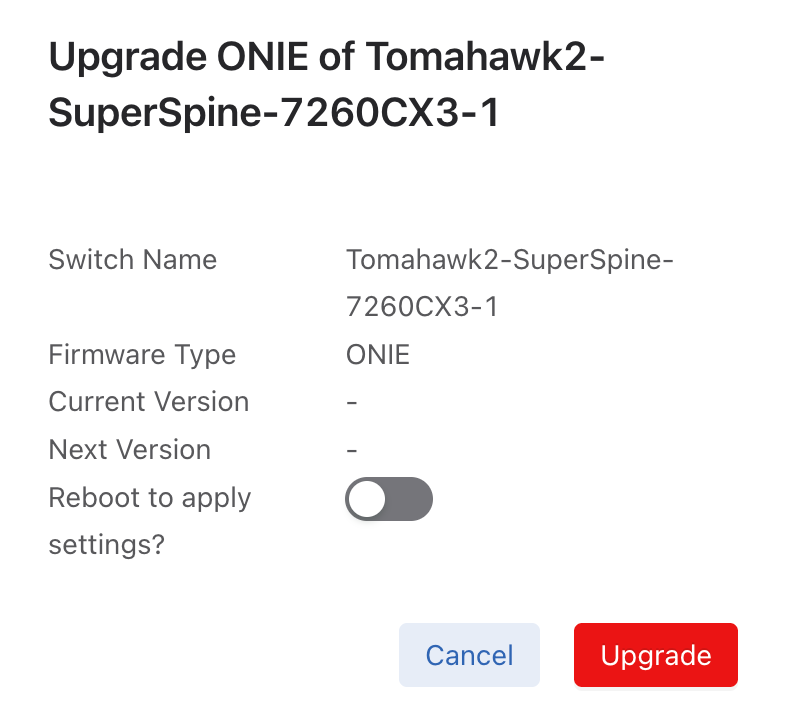
- Upgrade Loader: Upgrade the Loader settings of the current switch from the Current Version to the Next Version.
Upgrade is disabled unless one switch is selected.
Figure 38. Upgrade Loader 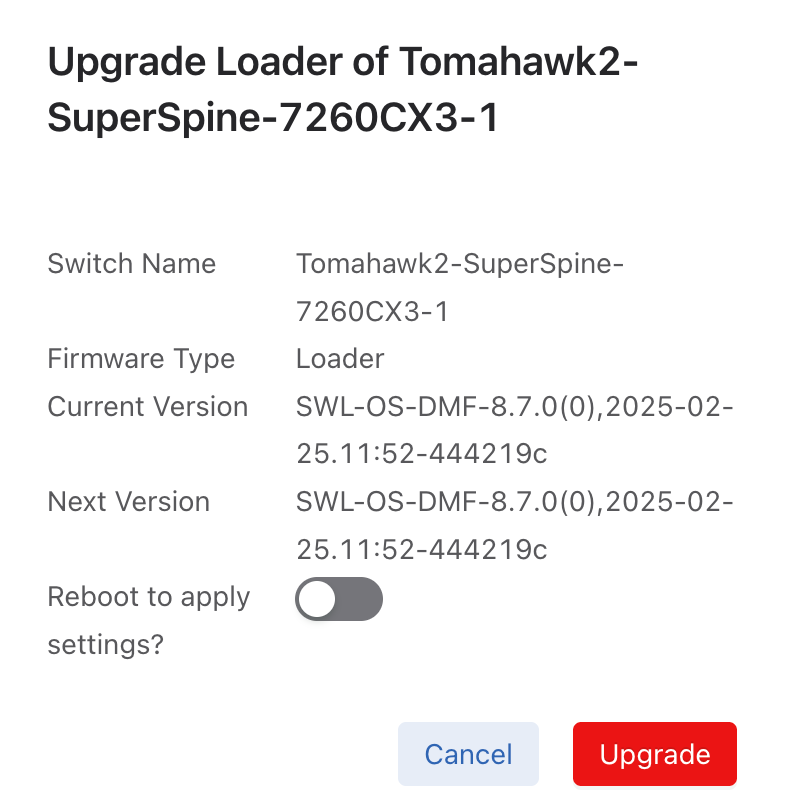
- Upgrade CPLD: Upgrade the CPLD settings of the current switch from the Current Version to the Next Version.
Upgrade is disabled unless one switch is selected.
Figure 39. Upgrade CPLD 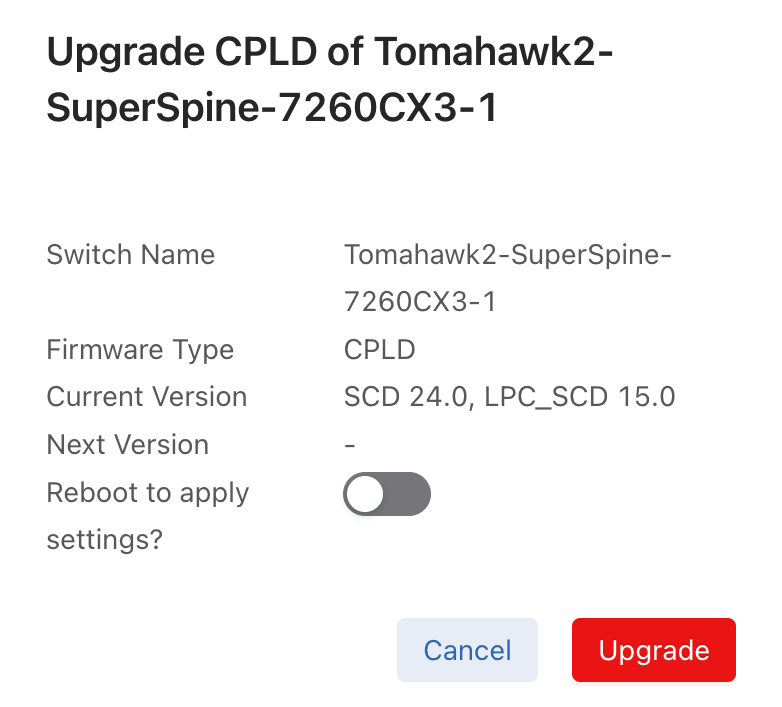
- Export: Export data in CSV or JSON format.
Figure 40. Export Data - Show / Hide Columns determine the information displayed in the dashboard and are user-selectable. Selections persist until changed.
Note: The Name column cannot be hidden.
Figure 41. Show / Hide Columns 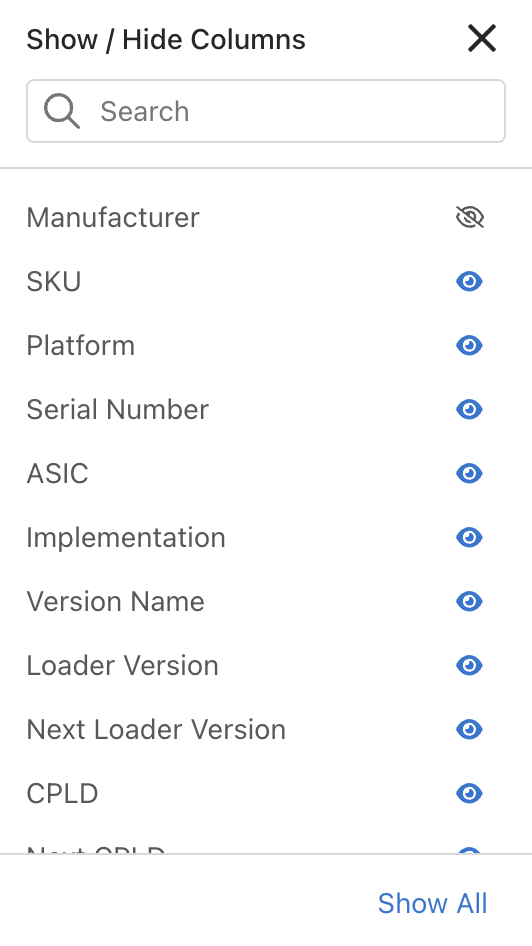
- Search: Filter rows with matching text.
- Upgrade ONIE: Upgrade the ONIE settings of the current switch from the Current Version to the Next Version.
Revert to the Legacy Dashboard
You can choose to remain on the legacy dashboard by toggling the Switches setting in the Settings dashboard.
To do so, select and turn off the Switches setting.
Accept Additional MAC Address Formats
When configuring the MAC address of a switch, CLI commands and REST endpoints will accept a MAC address formatted as three groups of four hexadecimal digits separated by periods (e.g. 1122.3344.5566) in addition to the already accepted form of six hexadecimal digit pairs separated by colons (e.g. 11:22:33:44:55:66). To ensure continued compatibility for all downstream users, an address in the period-separated format is automatically translated into the colon-separated format in the configuration.
c1(config)# switch core1
c1(config-switch)# mac 1234.5678.9abc
c1(config-switch)# show this

! switch
switch core1
  mac 12:34:56:78:9a:bc
Considerations
The system does not maintain the format used for a given address in the configuration. Regardless of the address format entered in the configuration, it is stored and presented in the colon-separated format.
DMF Interfaces
- Filter Interfaces: ports where traffic enters the DMF. Use filter interfaces to TAP or SPAN ports from production networks.
- Delivery Interfaces: ports where traffic leaves the DMF. Use delivery interfaces to connect to troubleshooting, monitoring, and compliance tools. These include Network Performance Monitoring (NPM), Application Performance Monitoring (APM), data recorders, security (DDoS, Advanced Threat Protection, Intrusion Detection, etc.), and SLA measurement tools.
- Filter and Delivery interfaces: ports with both incoming and outgoing traffic. When placing the port in loopback mode, use a filter and delivery interface to send outgoing traffic back into the switch for further processing. To reduce cost, use a filter and delivery interface when transmit and receive cables are connected to two separate devices.
-
Service interfaces: interfaces connected to third-party services or network packet brokers, including any interface that sends or receives traffic to or from an NPB.
In addition, interfaces connected to managed service nodes and DANZ recorder nodes can be referenced in the configuration directly without assigning a role explicitly. Also, Inter-Switch Links (ISLs), which interconnect DANZ monitoring switches, are automatically detected and referred to as core interfaces.
This chapter describes configuring DMF interfaces.
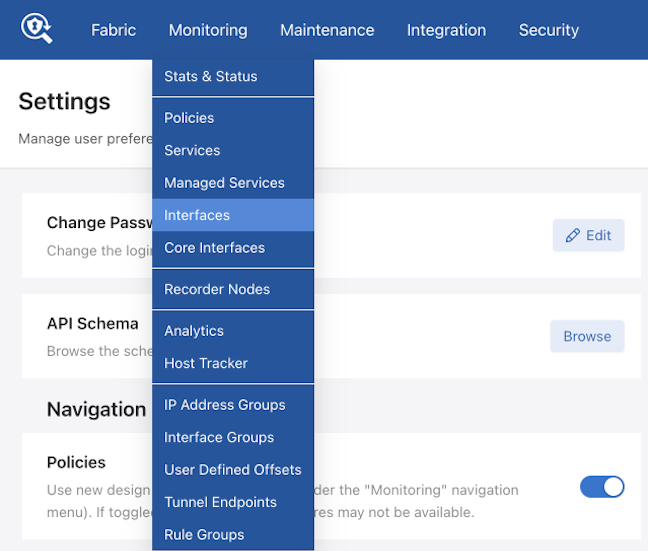
Overview
While preserving the information from the previous DMF version, the updated DMF Interfaces user interface introduces a new layout, design, and enhanced functionalities for improved interface viewing and monitoring for easy troubleshooting.
Select to access DMF Interfaces.
Overview Dashboard
Overview is the default landing page for DMF Interfaces.
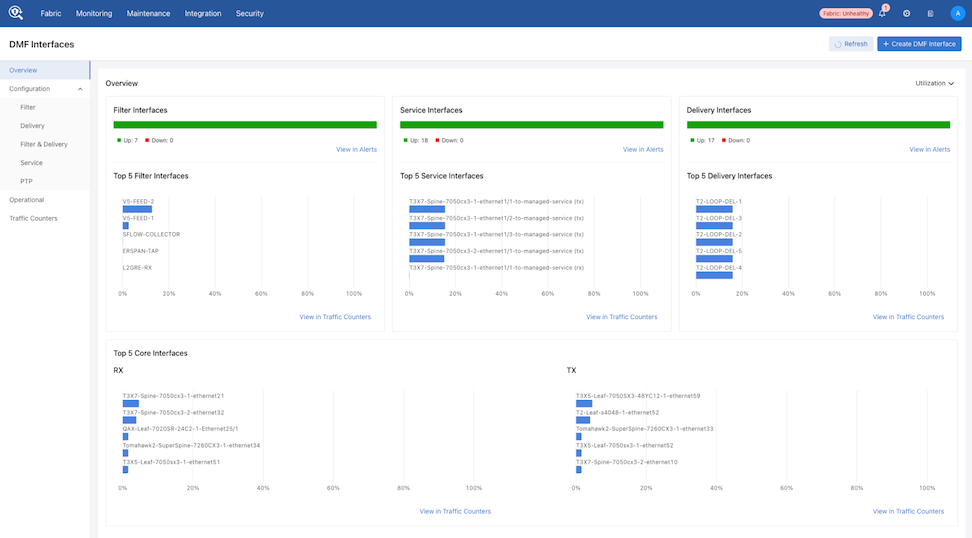
DMF displays interface status in:
- Filter Interfaces
- Service Interfaces
- Delivery Interfaces
Each interface displays an Up and Down count.
Select View Alerts to navigate to the Alerts dashboard for more details on the down interfaces.
DMF displays interface metrics in:
- Top 5 Filter Interfaces
- Top 5 Service Interfaces
- Top 5 Delivery Interfaces
- Top 5 Core Interfaces
- RX - Receive
- TX - Transmit
Select View in Traffic Counters to navigate to Traffic Counters (described later in this section).
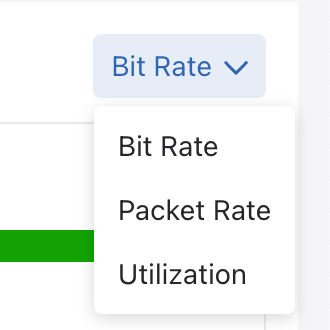
Select the Utilization, Bit Rate, or Packet Rate (Unit) drop-down to switch between utilization, bit rate, and packet rate data. The Overview widgets update with the selected unit type. The selection persists until changed.
Configuration
The Configuration dashboard displays tabular configuration information for the following:
- Filter Interfaces
- Delivery Interfaces
- Filter & Delivery Interfaces
- Service Interfaces
- PTP Interfaces
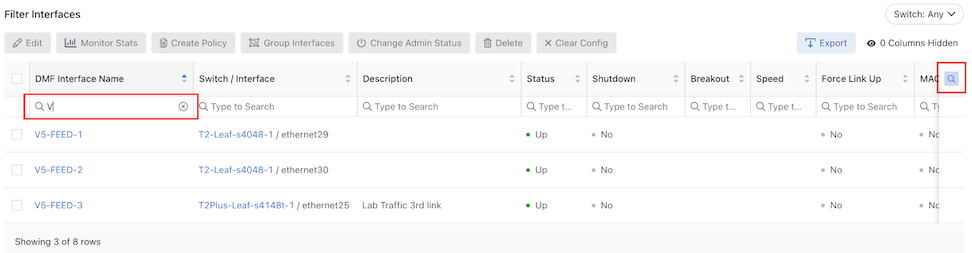
Action Buttons (Example - Filter Interfaces)

- When selecting multiple rows Edit is disabled.
Monitor Stats opens the Traffic Counters (described later in this section) window.
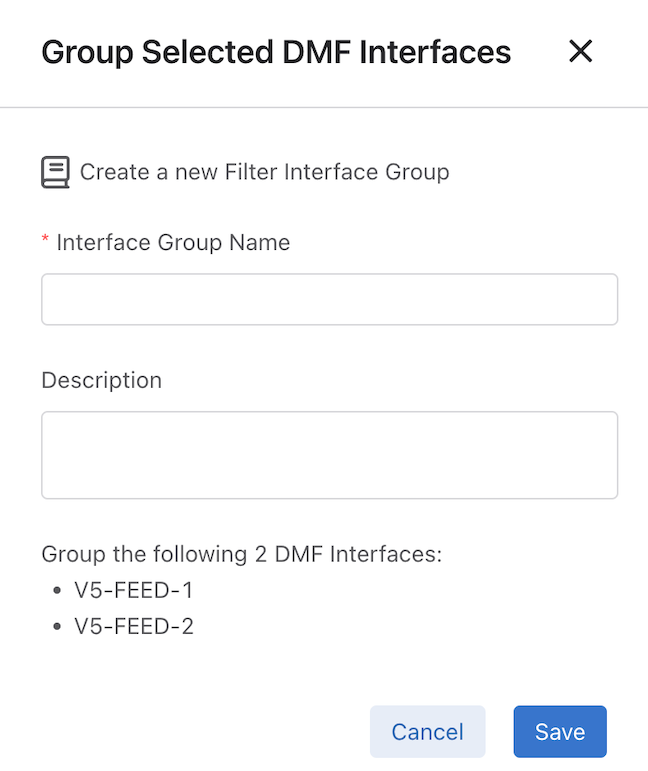
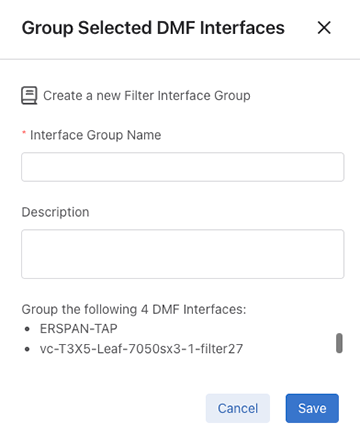
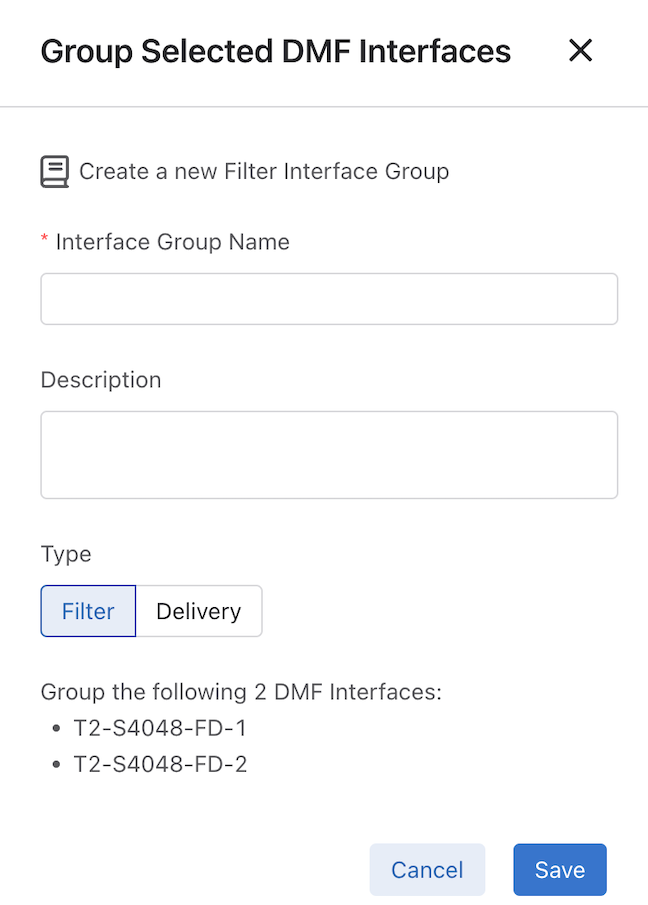
Group Interfaces opens the Group Selected DMF Interfaces configuration window, which is pre-populated with the selected interfaces.

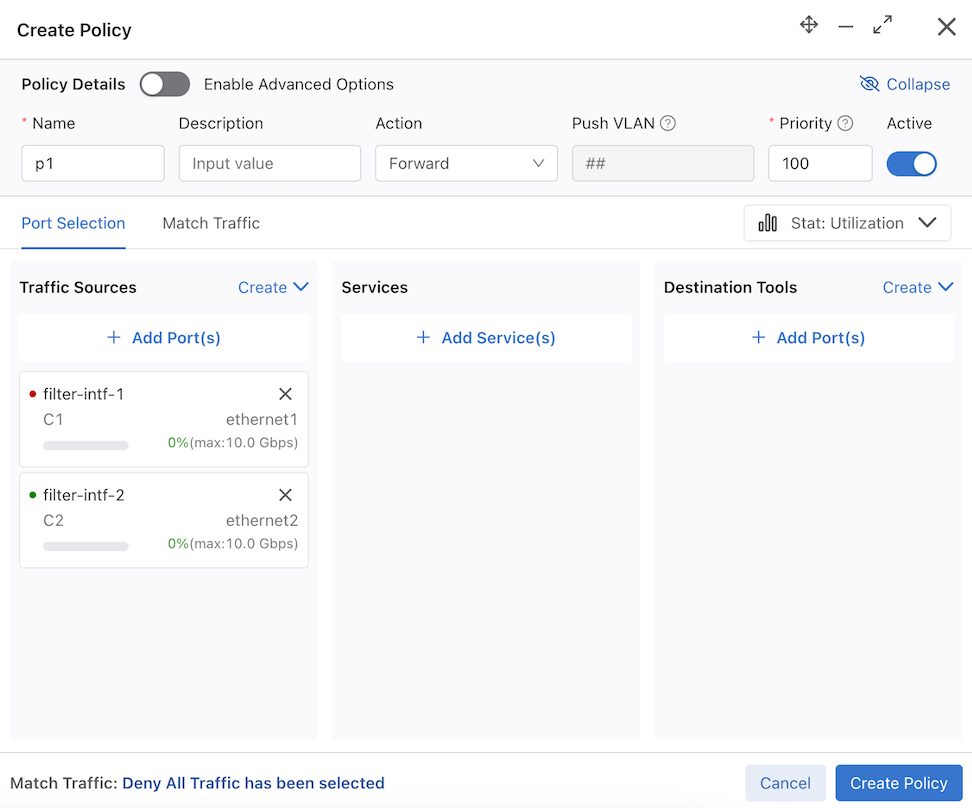
Create Policy opens the Create Policy configuration window for the selected interfaces.
Group Interfaces opens the Group Selected DMF Interfaces window for the selected interfaces.
There is an option to select the type of role to assign to the Filter and Delivery interfaces.
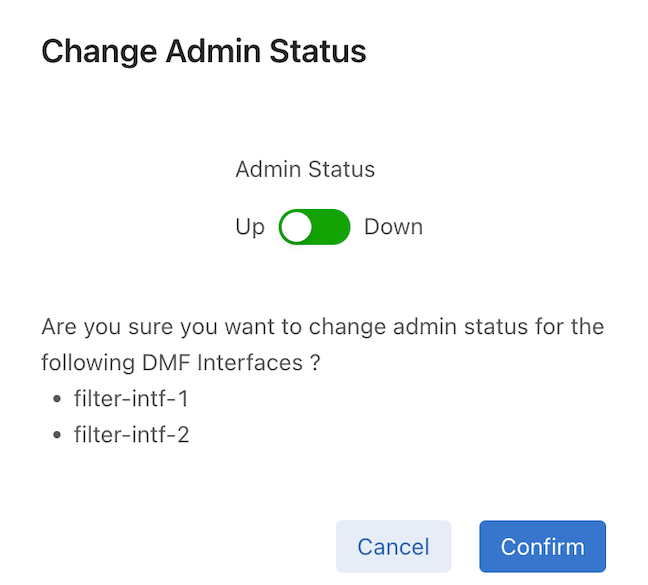
Change Admin Status changes the Admin Status (Up or Down).
Delete (Delete DMF Interface) removes a DMF Interface role-specific configuration from an interface. It does not remove the entire configuration.
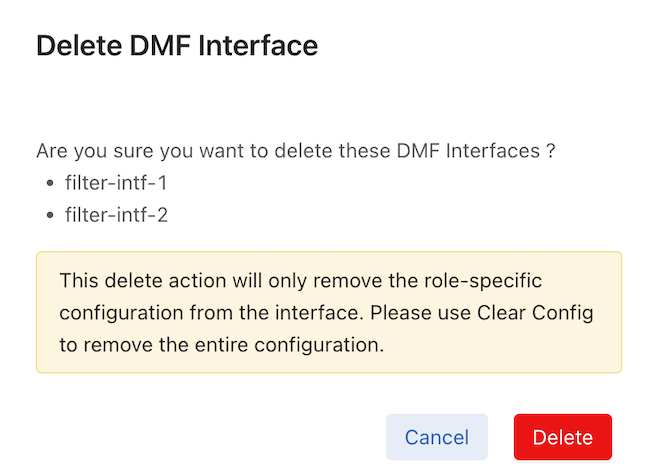
Clear Config (Clear Interface Configuration) removes the entire configuration for the DMF Interface.
Export saves interface data content in a CSV or JSON format in the browser's download folder.
Show / Hide Columns determine the information displayed in the dashboard and are user-selectable. Selections persist until changed.
Switch filters by switch name using Includes and Excludes.
Enable Search functionality by column using the search icon. Type to Search appears in each column. Enter the required search criteria.
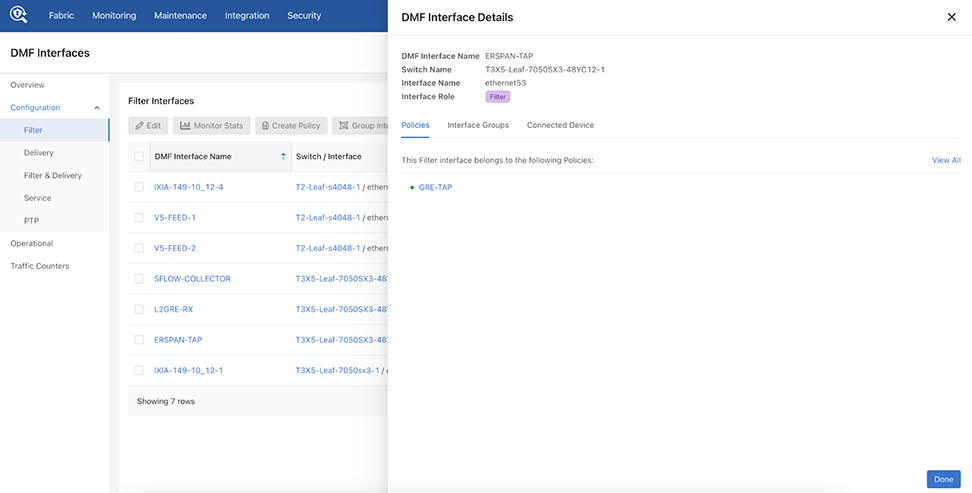
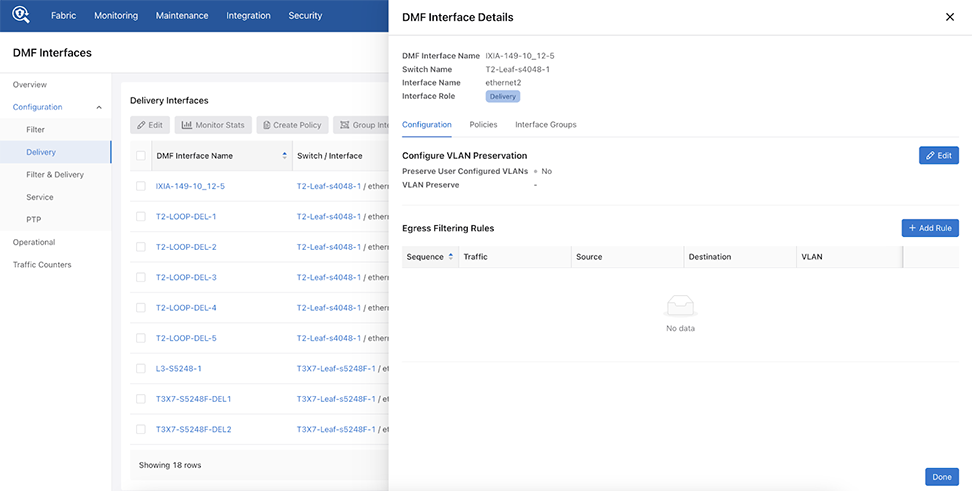
Interface Details View
Selecting a DMF Interface Name entry opens the DMF Interface Details window for the Filter, Delivery, and Filter & Delivery interfaces.
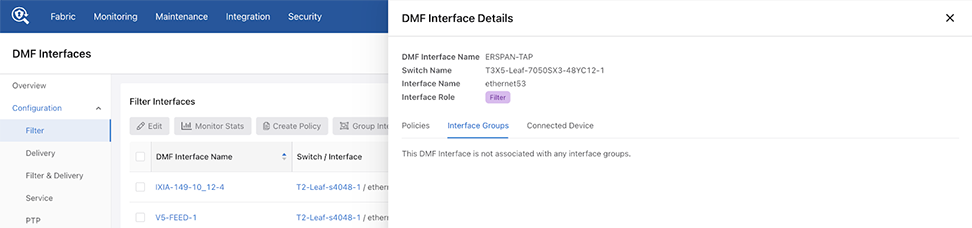
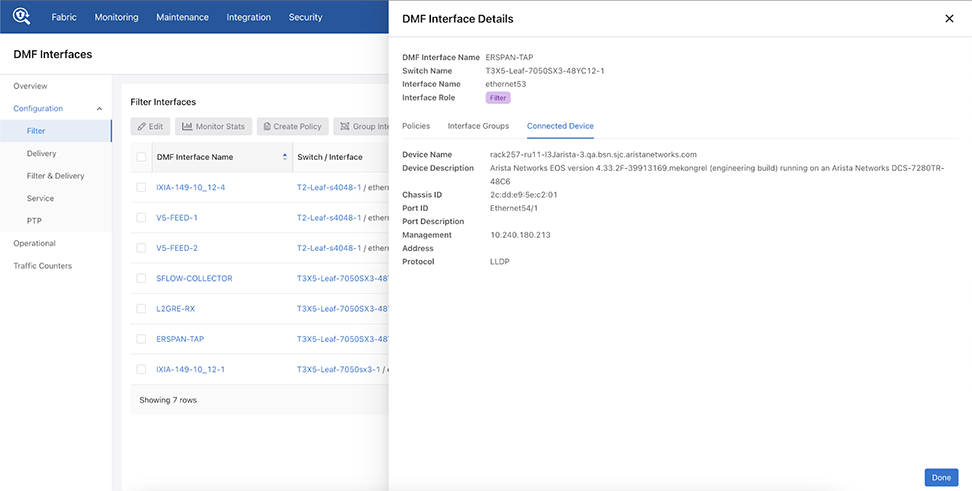
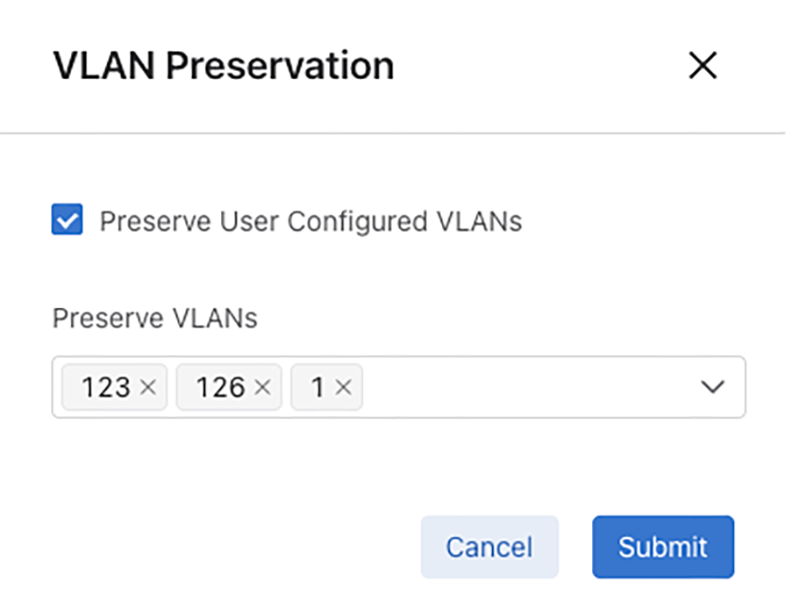
The DMF Interface Details view displays interface information associated with Policies, Interface Groups, and Connected Devices. It supports configuring VLAN Preservation and Egress Filtering Rules, as shown in the following examples:
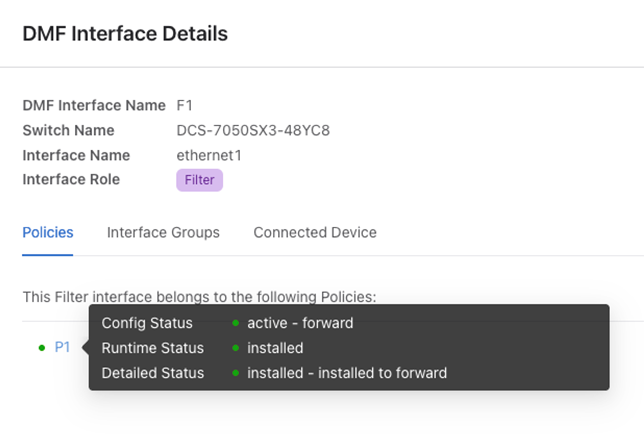
Hovering over a filter interface configured in a policy displays further status and configuration information:
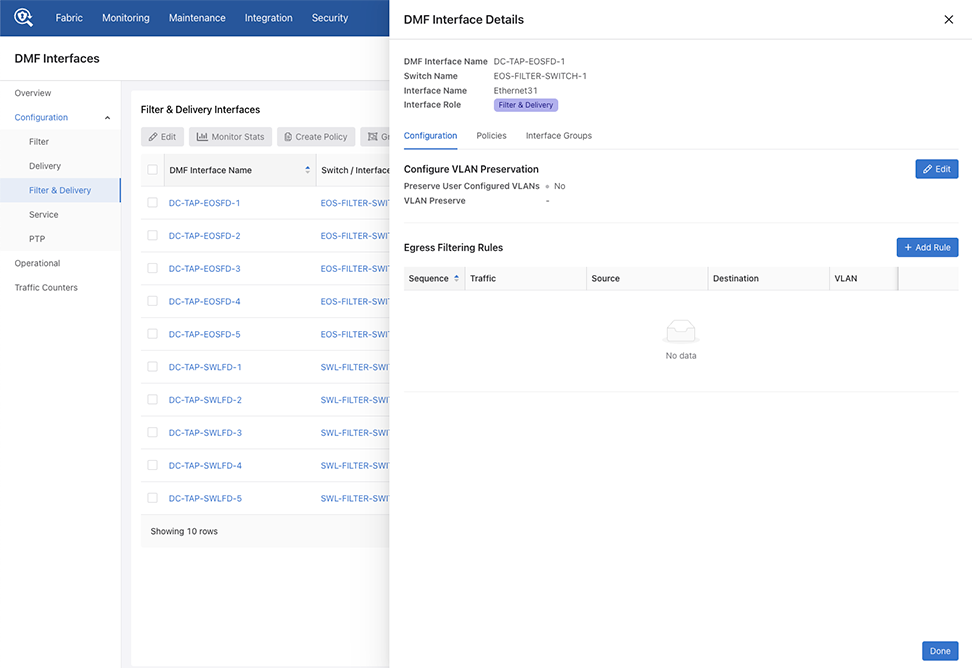
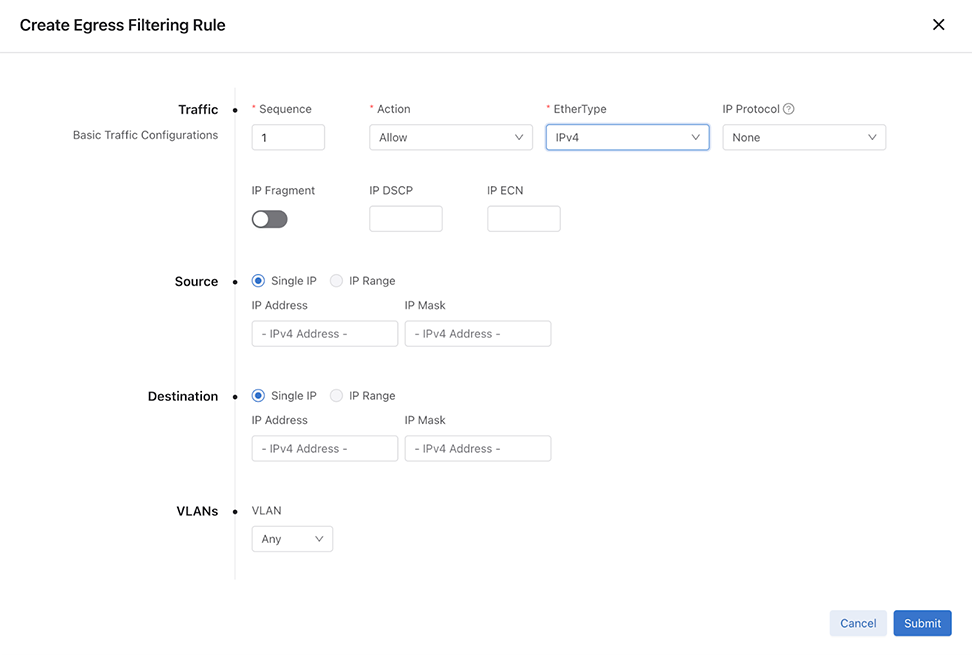
Select + Add Rule Edit to create an egress filtering rule configure egress filtering. Enter the required information in the Create Egress Filtering Rule configuration window.
Operational
The Operational dashboards displays functional information for each interface in tabular format.
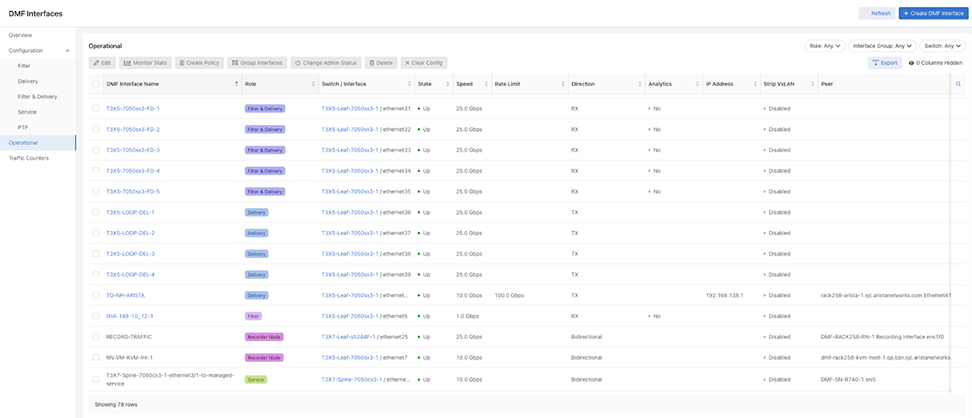
Action Buttons
These work in the same manner as the action buttons in Configuration.
-
Edit
- Monitor Stats
- Create Policy
- Group Interfaces
- Change Admin Status
- Delete
- Clear Config
- Export
- Show / Hide Columns
Search
The Search function works in the same manner as the search function in Configuration.
Filters
- Filter by Role - Search or select from the list and filter by Includes or Excludes.
Figure 67. Filter by Role 
- Filter by Interface Groups - Search or select from the list.
Figure 68. Filter by Interface Groups 
-
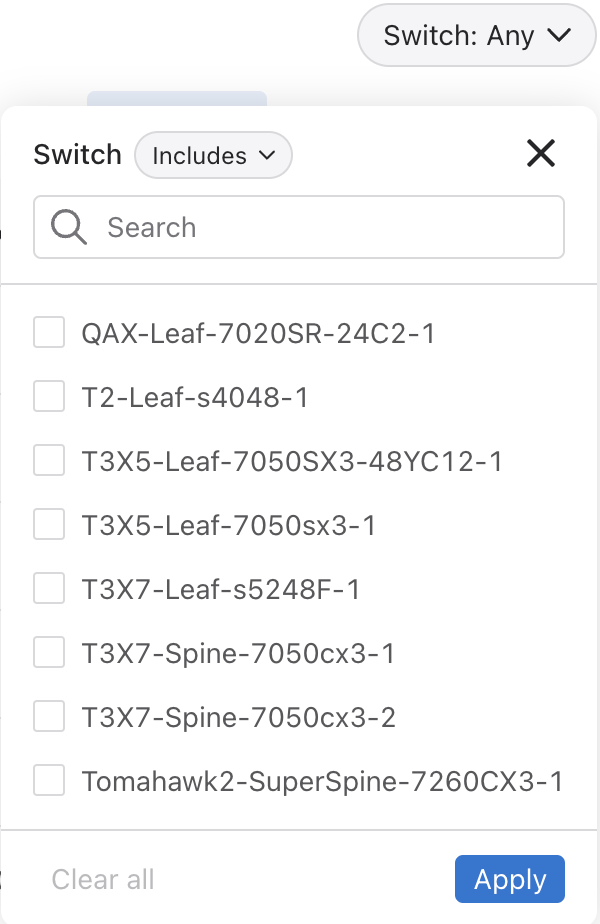
Filter by Switch Name - Search or select from the list and filter by Includes or Excludes.
Figure 69. Filter by Switch Name 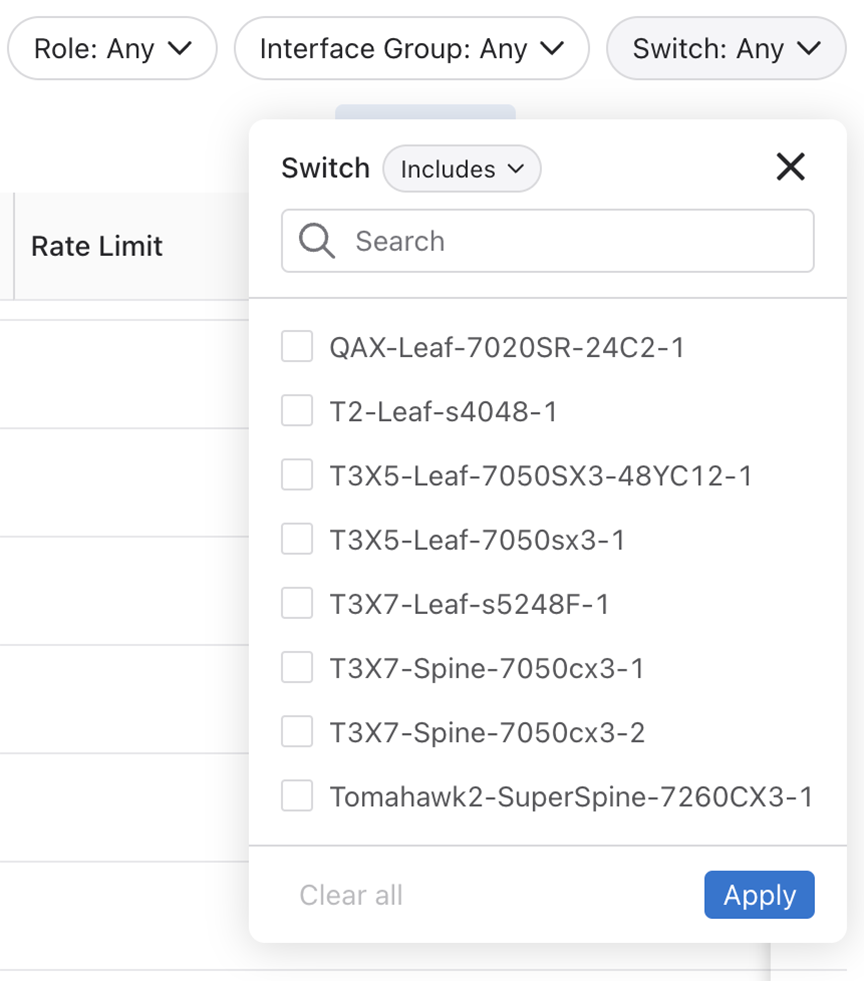
Select Apply to begin filtering.
Traffic Counters
The Traffic Counters dashboard display the utilization statistics for the interfaces. Six time-series charts display the following stats:
- RX Bit Rate
- TX Bit Rate
- RX Packet Rate
- TX Packet Rate
- TX Dropped Rate
- TX Dropped Count
The charts are updated every 10 seconds and display each interface’s utilization.
You can select up to 10 interfaces at a time, and selecting a new interface re-initializes the charts, and polling begins for new interface utilization data.
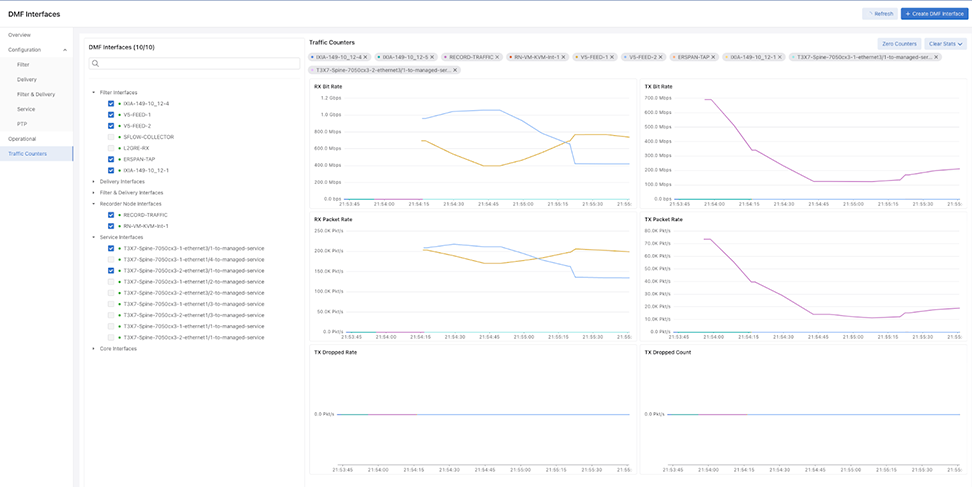
Hovering over and selecting graph plot displays bit rate information.
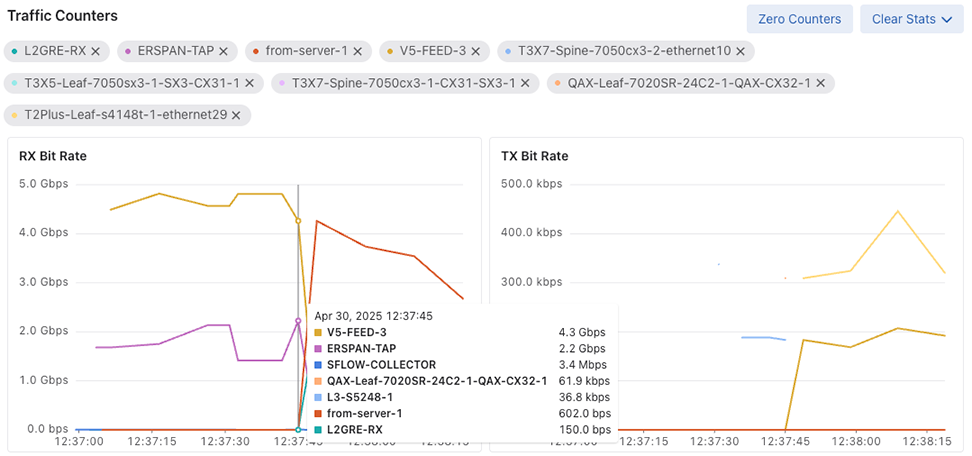
Action Controls
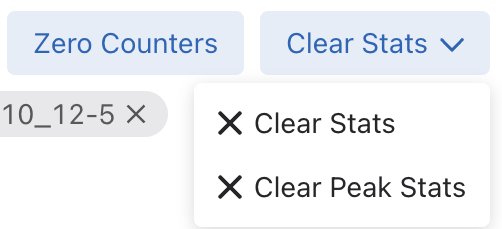
- Zero Counters: Resets counters for the selected Interfaces in this UI session.
- Clear Stats: Clear stats for the selected Interfaces.
- Clear Peak Stats: Clear peak stats for the selected Interfaces.
Configure a DMF Interface
- Select from the main menu to display the DMF interfaces.
Figure 72. DMF Interfaces 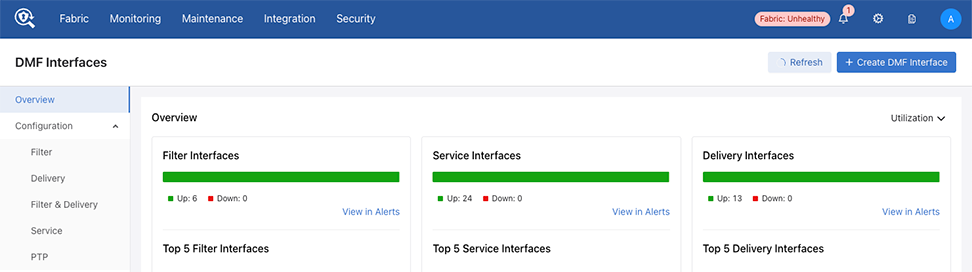
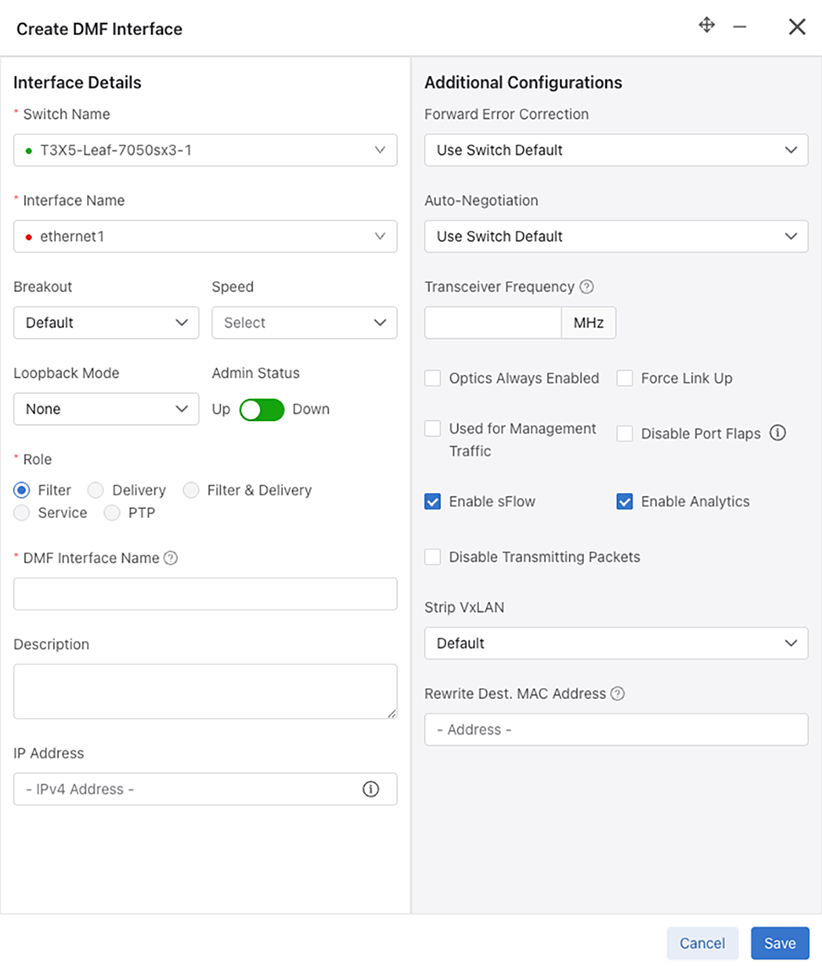
- Select the + Create DMF Interface to configure a new interface.
Figure 73. Create Interface 
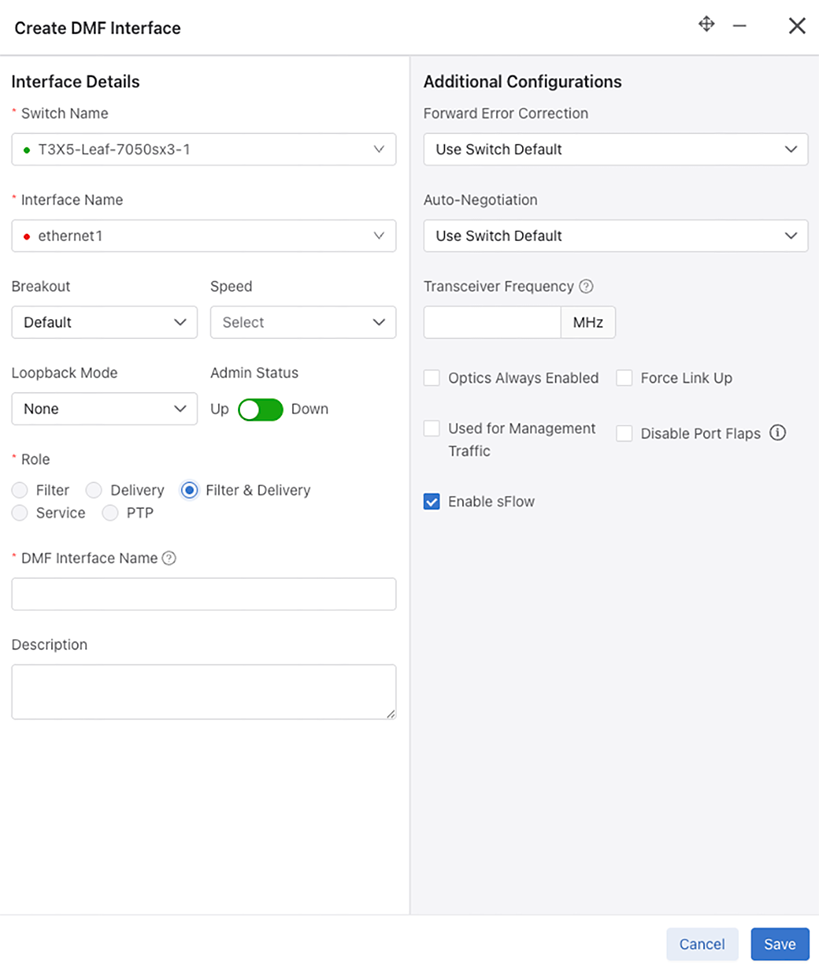
Filter Interface Role
Additional configuration settings for the Filter role include:
- Enable sFlow (checkbox) - Enabled by default.
- Enable Analytics (checkbox) - Enabled by default. For information about Analytics, refer to the Analytics Node User Guide.
- Disable Transmitting Packets (checkbox)
- Strip VXLAN - Enable or Disable
- Rewrite Dest. MAC Address - The provided MAC address will overwrite the destination MAC address of packets received on this interface.
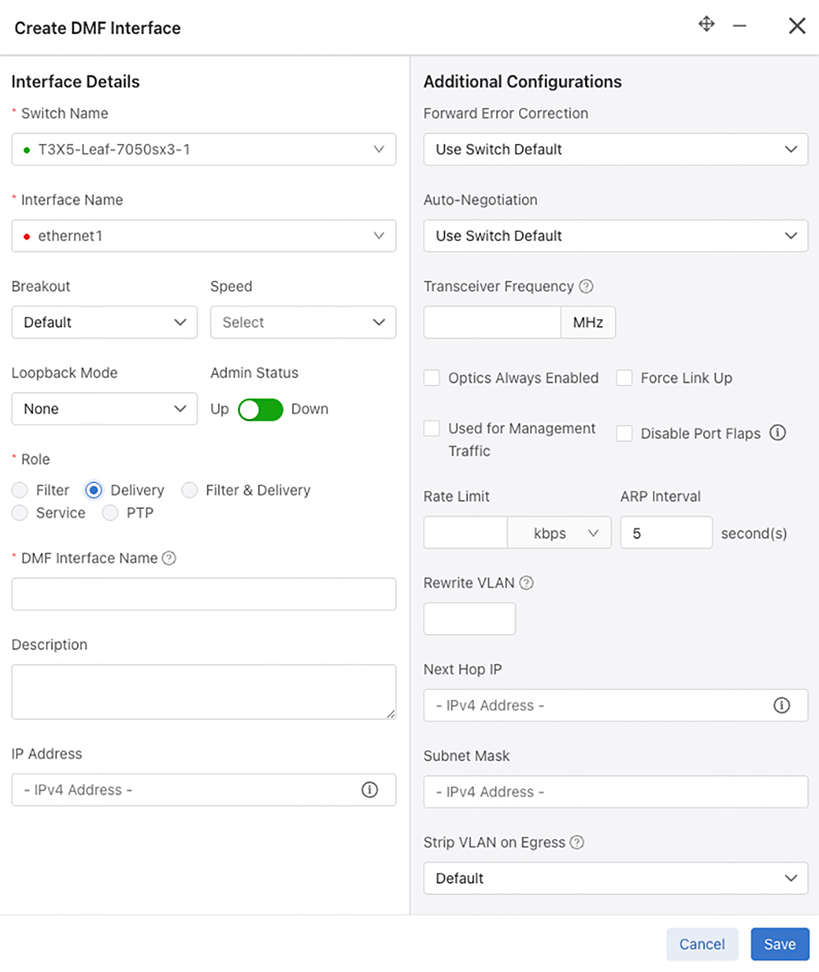
Delivery Interface Role
Additional configuration settings for the Delivery role include:
- Rate Limit - Enter a value and select bit rate kbps, Mbps, or Gbps.
- ARP Interval - Default is 5 seconds.
- Rewrite VLAN - The vlan tag to push/rewrite for this interface.
- Next Hop ID - IPv4 Address. Next hop IP that is reachable via delivery interface with local mask.
- Subnet Mask - IPv4 Address
- Strip VLAN on Egress - Default, None, One, Two, or Second.
- VLAN Preservation (checkbox) - Enabled by default.
Filter & Delivery Interface Role
Additional configuration settings for the Filter & Delivery role include:
- Enable sFlow (checkbox) - Enabled by default.
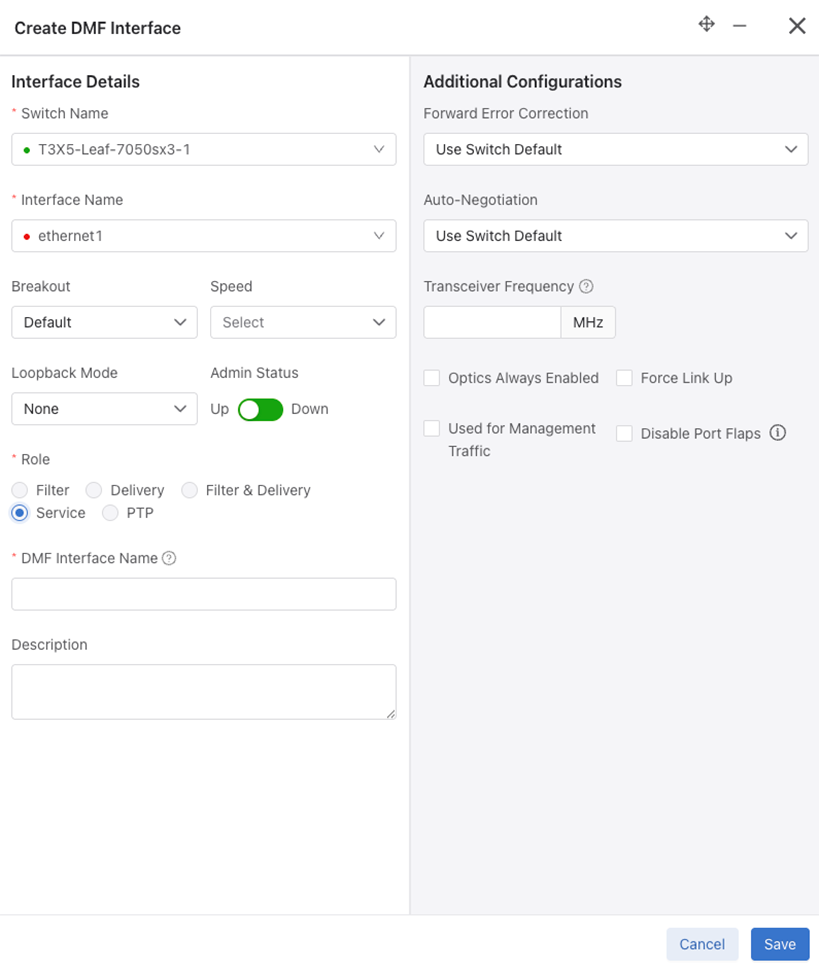
Service Interface Role
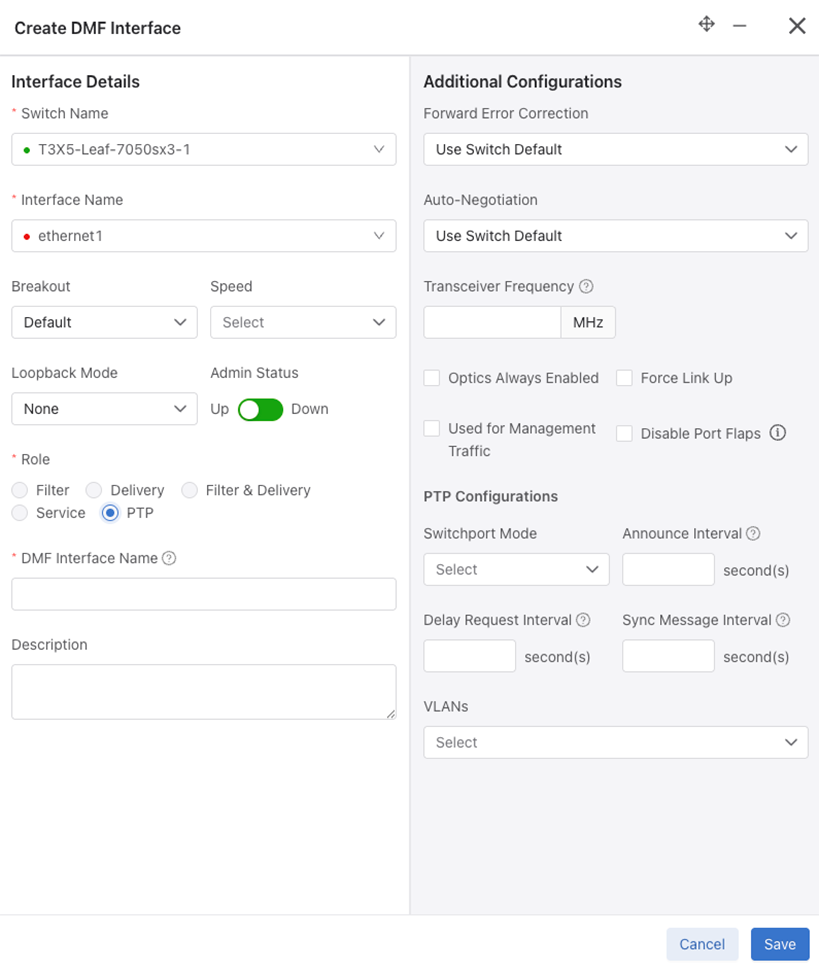
PTP Interface Role
- Switchport Mode - Access, Routed, or Trunk.
- Announce Interval - Set PTP announce interval between messages (-3 to 4).
- Delay Request Interval - Set PTP delay request interval between messages (-7 to 8).
- Sync Message Interval - Set PTP sync message interval between messages (-7 to 3).
- VLANS - Select from a drop-down list of VLANs.
Identify a Filter Interface using Destination MAC Rewrite
Workflow one uses the , while the second uses the . To use the second workflow, proceed to step 6, detailed below.
Workflow One
Navigate to .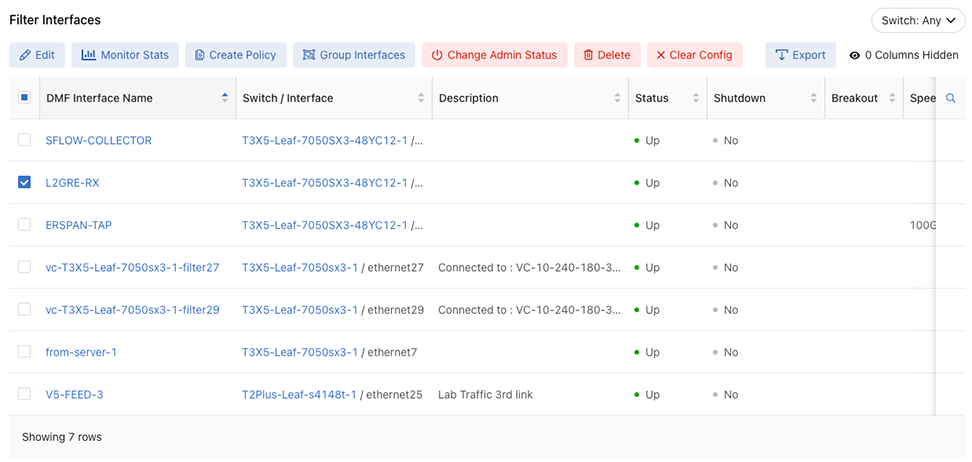
Filter Interfaces
- Select the for the desired interface and use the Rewrite Dest.MAC Address input to configure the MAC address to override.
Figure 80. Role - Filter Interface
Edit Interface
- Select the row menu of the filter interface to configure or edit, and select Edit.
Figure 81. DANZ Monitoring Fabric (DMF) Interfaces - Edit 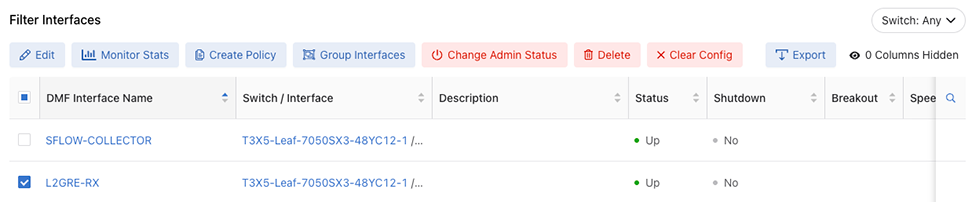
Workflow Two
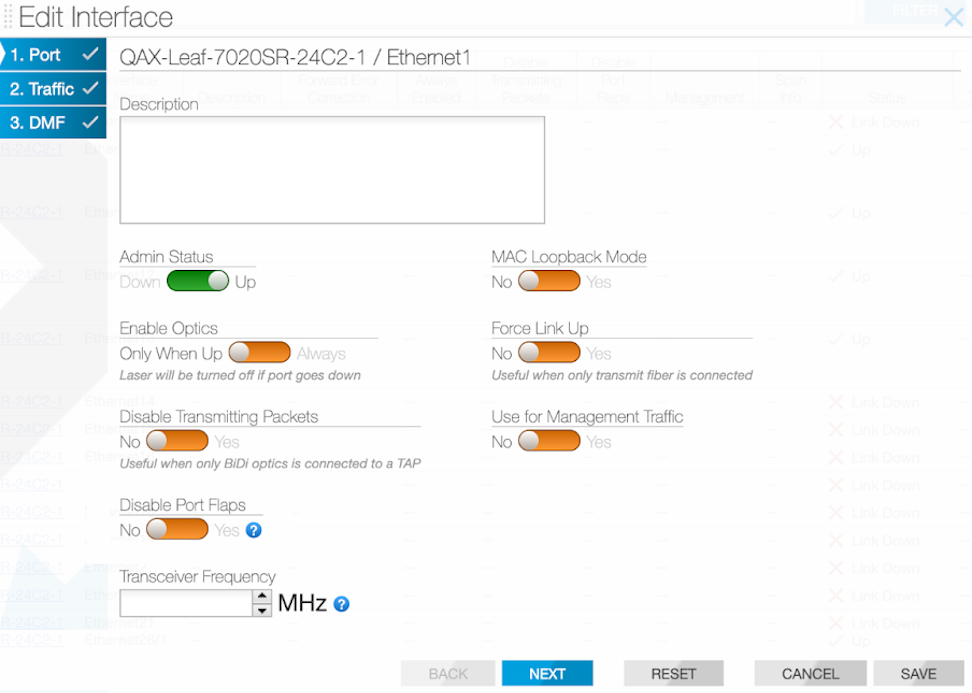
Navigate to and perform the following steps.
- Select the row menu of the switch interface associated with the filter interface and select
 followed by Configure.
Figure 82. Configure Interface 
- In the DMF tab, select the Rewrite Dest.MAC Address field to enter the MAC address to be overridden.
Figure 83. Edit Interface DMF Rewrite Dest. MAC Address 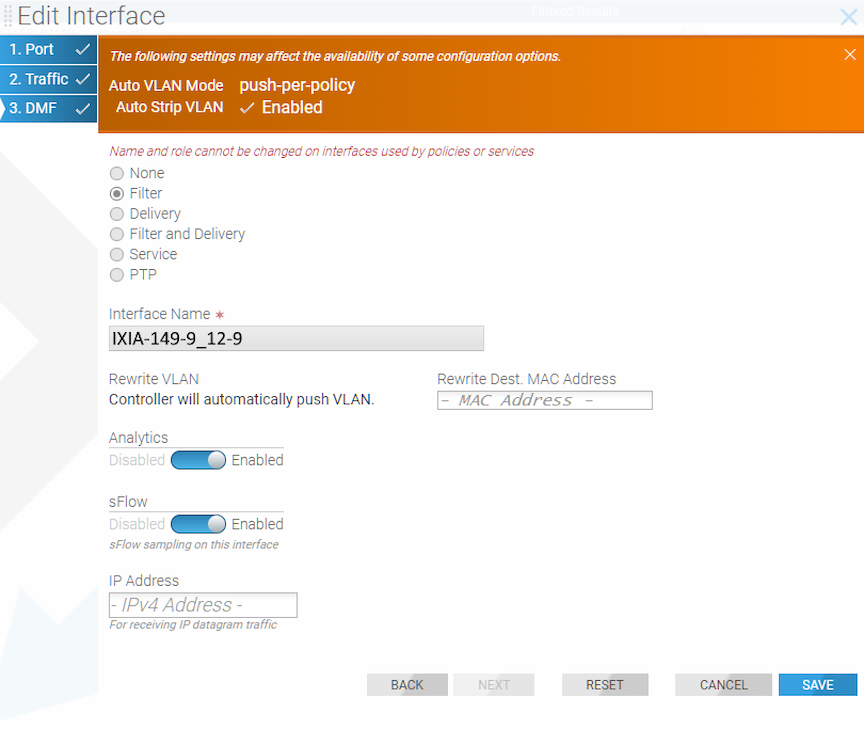
Configure sFlow® on a Filter and Delivery Interface
A DANZ Monitoring Fabric (DMF) interface used by a DMF policy as both a filter and a delivery interface is known as a filter-and-delivery interface. Filter-and-delivery interfaces support configuring sFlow®* in the DMF Controller. DMF enables sFlow by default on filter-and-delivery interfaces.
To disable sFlow on a filter-and-delivery interface, use the DMF Controller GUI.
- Navigate to .
Figure 84. DMF Interfaces 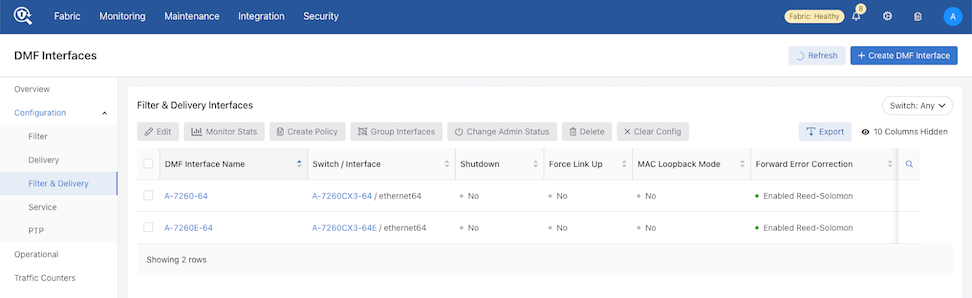
- Select an interface from the list under DMF Interface Name.
Figure 85. DMF Interface Name 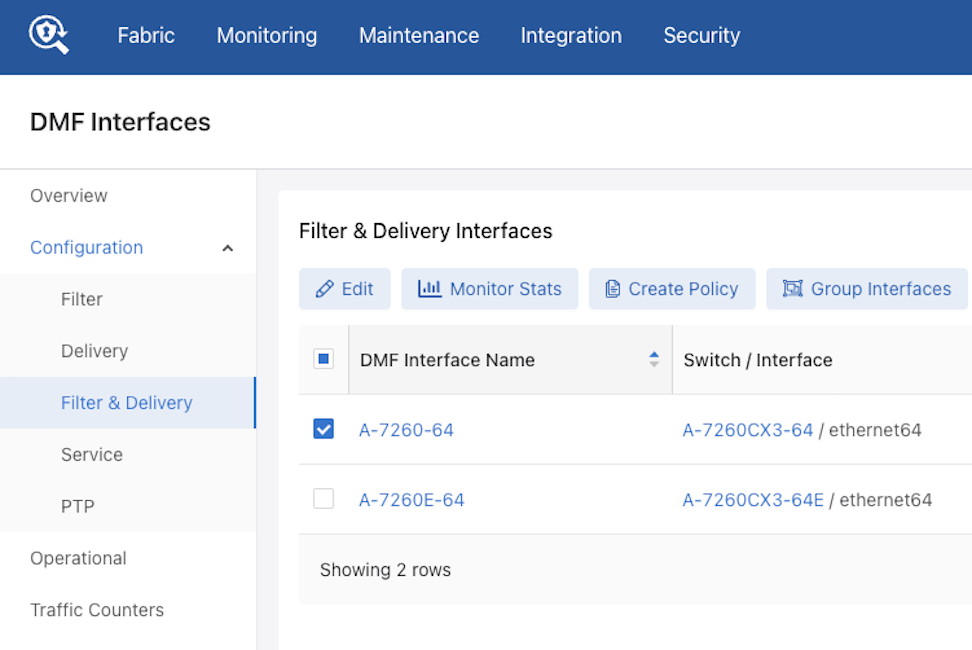
- Select Edit to open the Edit DMF Interface configuration window.
Figure 86. Edit DMF Interface 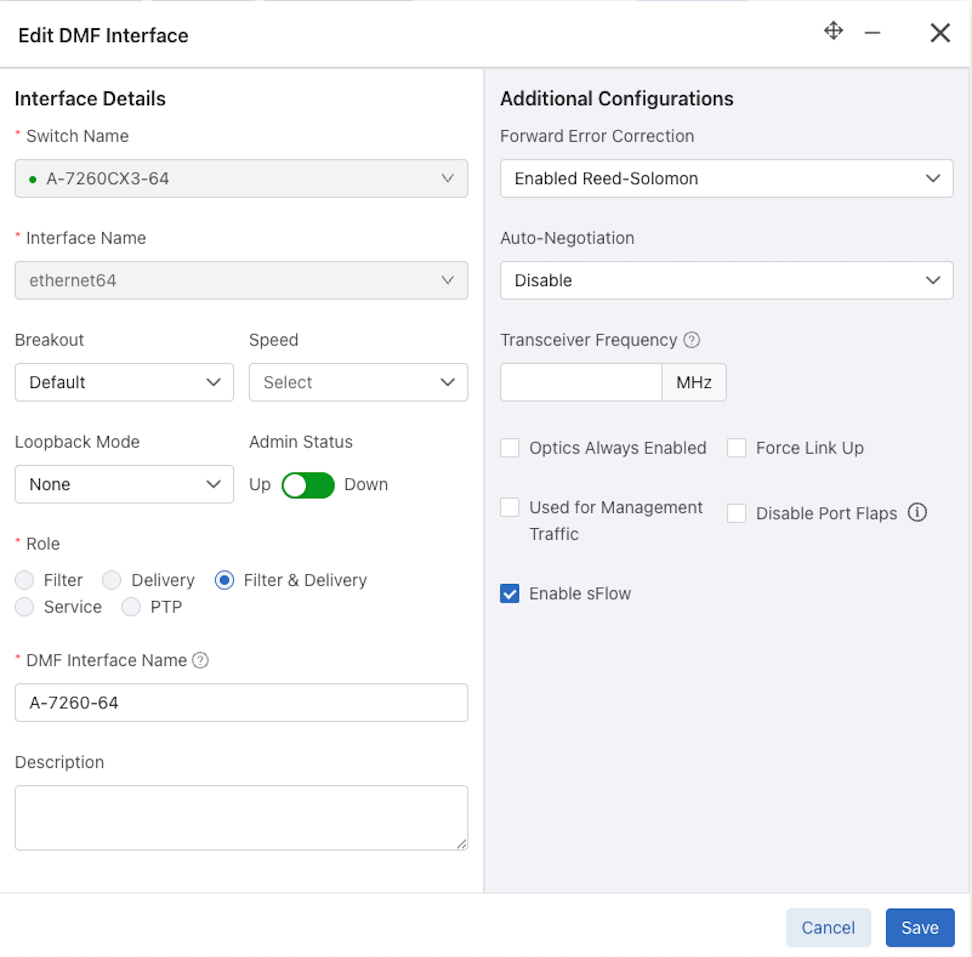
Configure Error Disable State
Error Disable State for Port Flapping prevents policy churn by automatically placing switch interfaces with frequent flapping into an error-disabled state, effectively performing an automatic administrative shutdown. The feature allows for automatically recovering these interfaces after a specified time. It reduces the risk of lost packets caused by continuous re-computation of DANZ Monitoring Fabric (DMF) policies due to flapping interfaces. By default, Error Disable State for Port Flapping is disabled.
Global Configuration
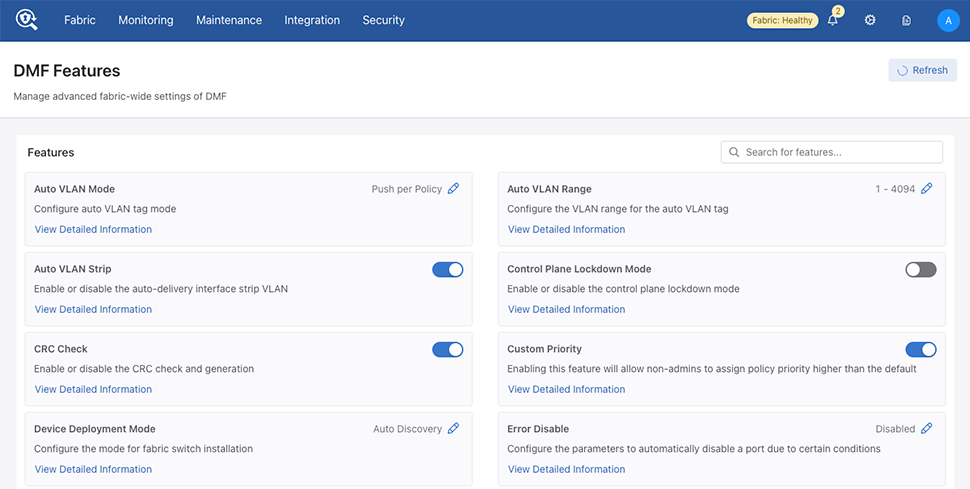
Locate the Error Disable feature card and select the pencil (edit) icon.
Select Enable Error Disable to enable or disable the feature.
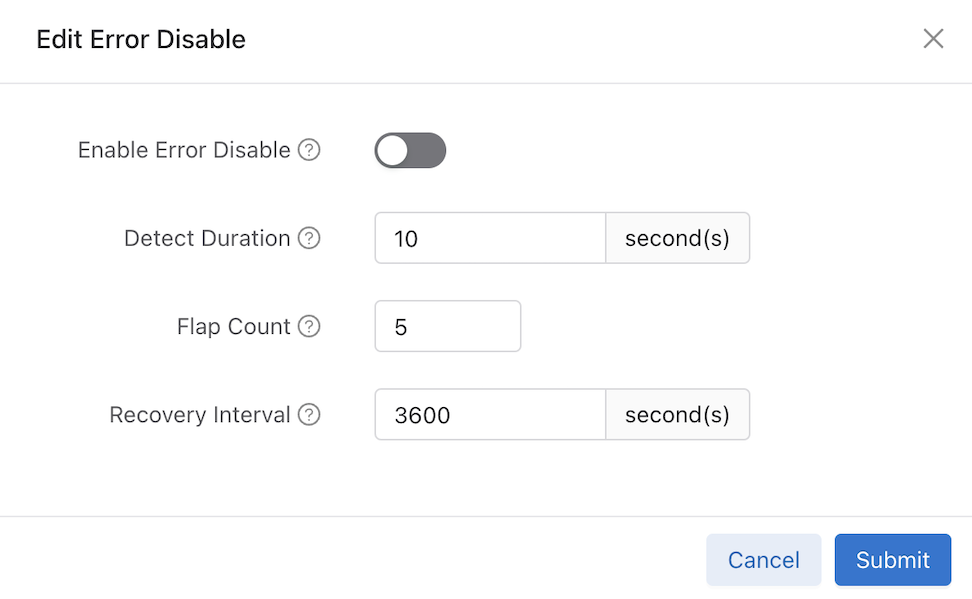
Configure the following inputs as required:
- Enable Error Disable: Enable or disable the feature.
- Detect Duration: Specifies the duration during which the required flap count must be reached to set the interface into an error-disabled state. The default is 10 seconds.
- Flap Count: Specifies the number of flaps required within the detect-duration period to set the interface into the error-disabled state. The default is 5 flaps.
- Recovery Interval: The Recovery Interval indicates how much time will pass before bringing up the interface when the automatic administrative shutdown action shuts it down. The default is 3600 seconds.
Select Submit to save the global configuration.
Configure Error Disable at the Interface Level
Use the Disable Port Flaps switch to enable or disable port flaps at the interface level on the dashboard.
Select Save.
When using the dashboard during an Edit Interface step or Create DMF Interface configuration process use the Disable Port Flaps checkbox to enable or disable port flaps on the Create DMF Interface page. If the Error Disable feature is enabled globally, checking this input will disable the Error Disable feature on this interface temporarily.
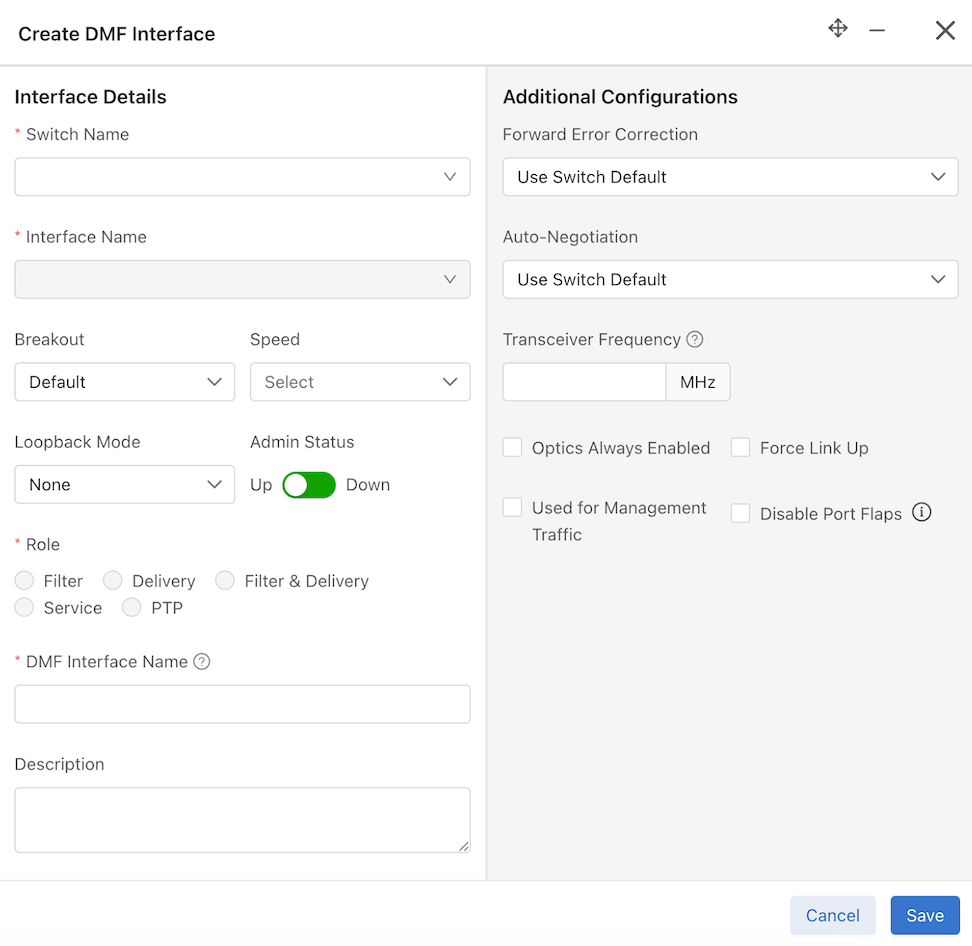
Select Save.
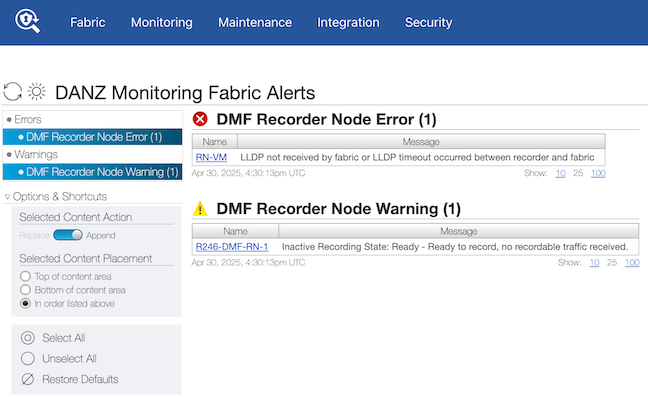
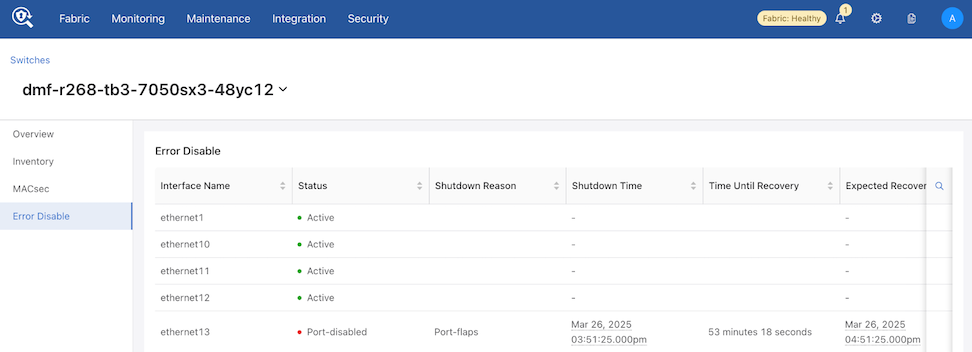
Error Disable Alerts
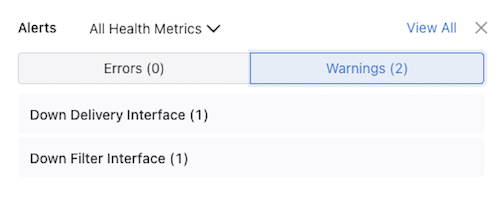
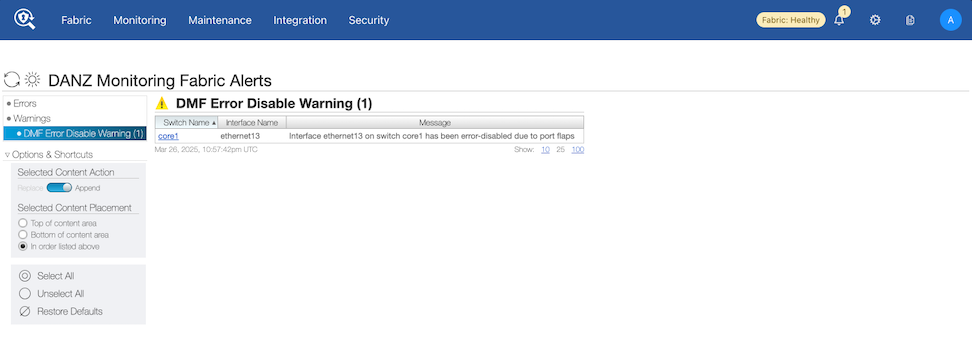
Details related to error disable appear in the Switches detail page in the Error Disable dashboard.
Navigate to and choose a switch from the inventory list.
Select Error Disable.
Configure Interface Groups
DMF version 8.8.0 introduces a redesigned workflow for Interface Groups in the DMF UI. An interface group is a collection of one or more filter or delivery interfaces, making it more convenient to create a policy. It is often easier to refer to an interface group when creating a policy than to identify every interface to which the policy applies explicitly.
Create an interface group consisting of one or more filter or delivery interfaces. Use an address group in multiple policies, referring to the IP address group by name in match rules. If no subnet mask is provided in the address group, it is assumed to be an exact match. For example, in an IPv4 address group, the absence of a mask implies a mask of /32. For an IPv6 address group, the absence of a mask implies a mask of /128. Identify only a single IP address group for a specific policy match rule. Address lists with both src-ip and dst-ip options cannot exist in the same match rule.
To access the Interface Groups workflow, and perform the following steps:
- Navigate to .
Figure 92. DMF Interfaces - Interface Groups 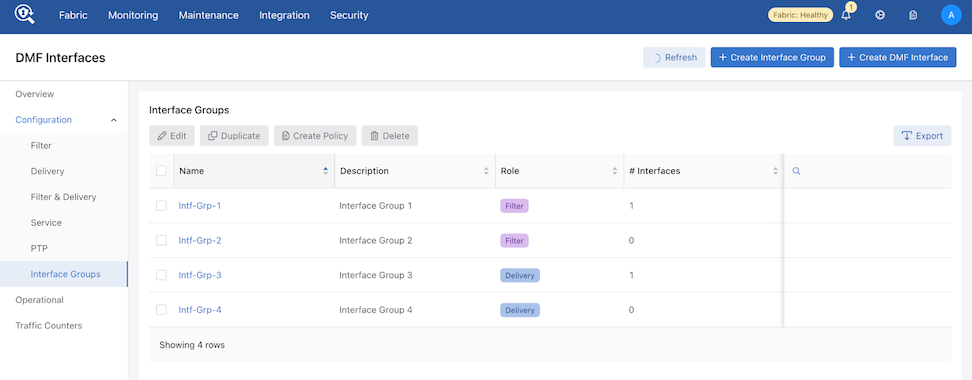 A + Create Interface Group control displays to the left of Create DMF Interface.
Figure 93. + Create Interface Group 
- Select + Create Interface Group.
The Create Interface Group workflow displays:
Figure 94. Creating Interface Group 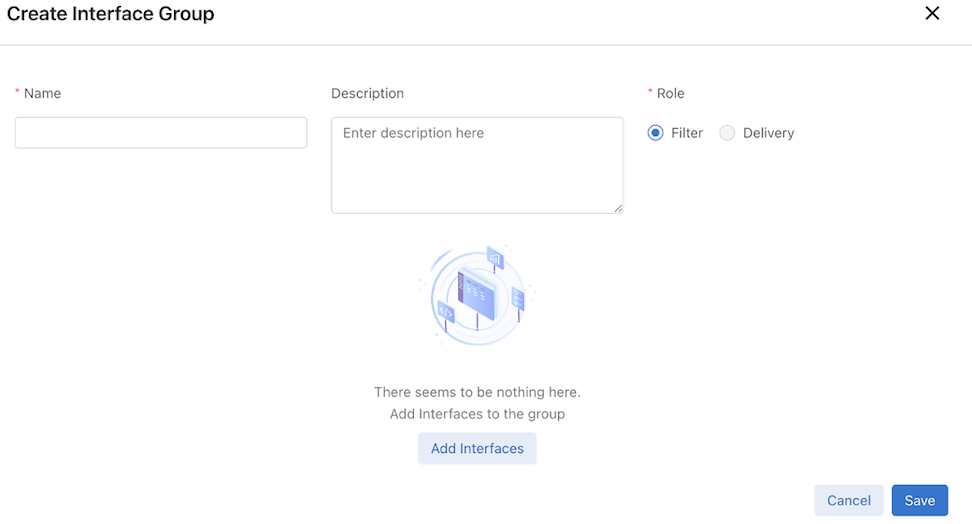
- Select Add Interfaces to display a list of available interfaces according to the selected Role, either Filter or Delivery.
- If Filter is selected, DMF displays interfaces with Filter and Filter & Delivery roles.
- If Delivery is selected, DMF displays interfaces with Delivery and Filter & Delivery roles.
These options ensure all compatible interfaces are available for selection.Figure 95. Add Filter Interfaces 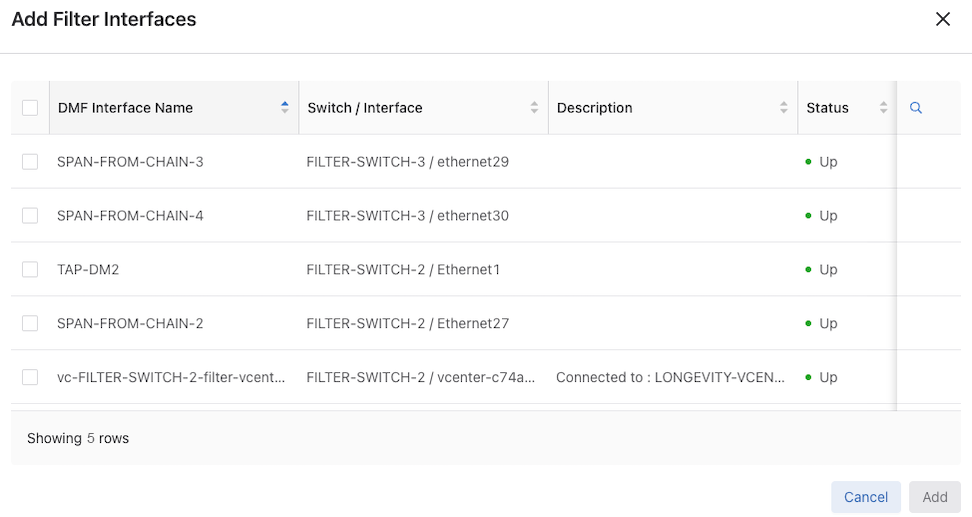
Figure 96. Add Delivery Interfaces 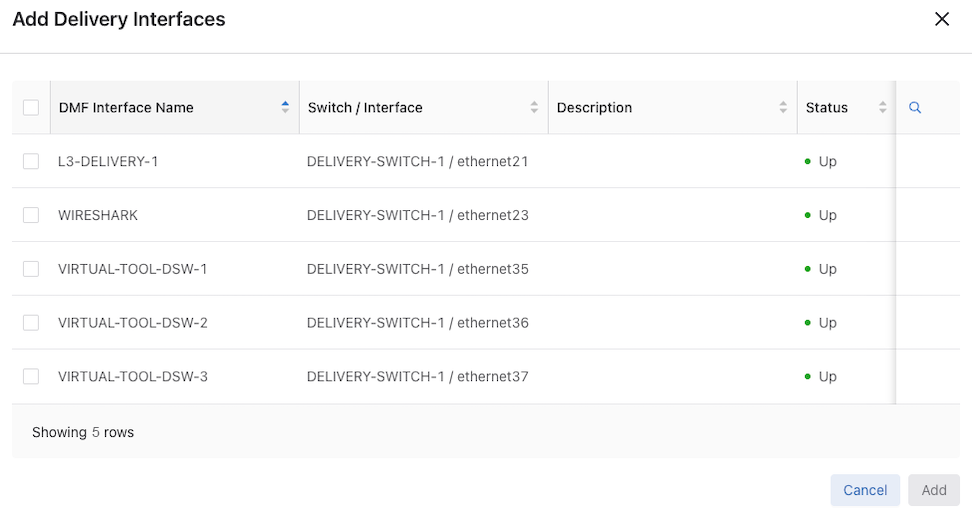
- Select Save to complete the configuration.
The new group displays in the Interface Groups dashboard.
Figure 97. New Group 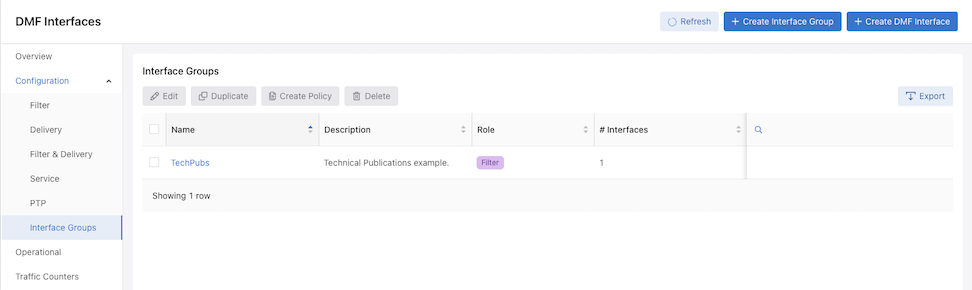
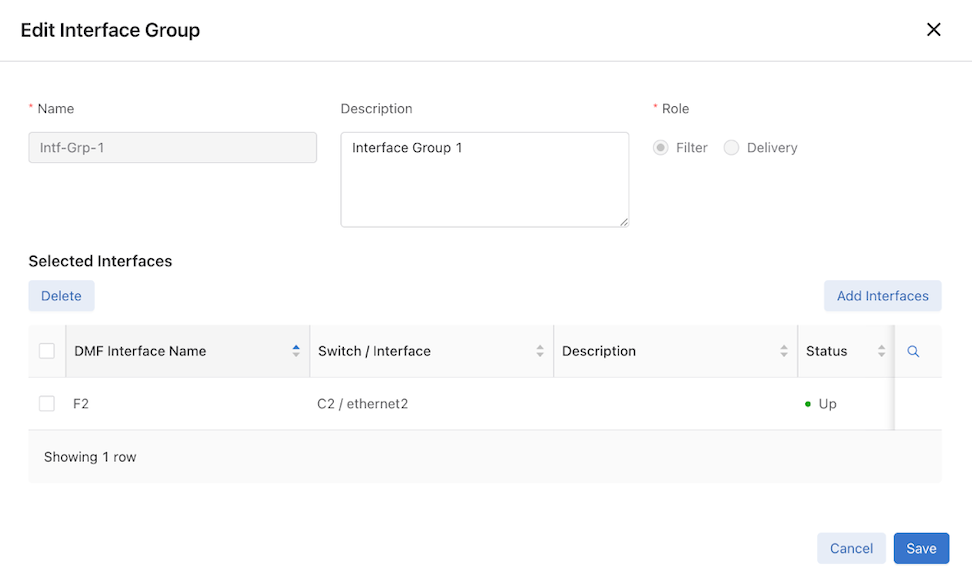
- View details for each Interface Group by selecting the corresponding group name in the table.
The following action buttons are available within the Interface Group details view:
- Edit: Enables edit mode for the selected Interface Group.
- View Interface Op State: Redirects to the Operational section with the relevant Interface Group pre-selected.
- Monitor Stats: This option allows the selection of one or more interfaces. When interfaces are selected, the Traffic Counters page opens with those pre-selected interfaces. If no interfaces are selected, the page opens with default interface selections.
Figure 98. View Interface Group 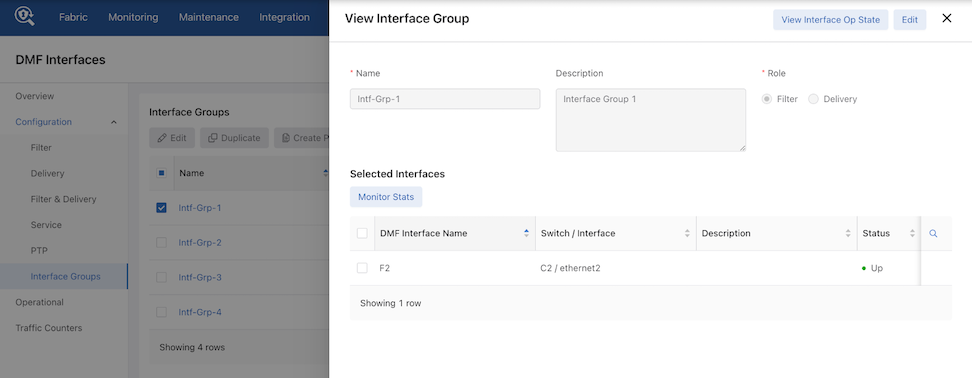
Additional Interface Controls
Action Buttons
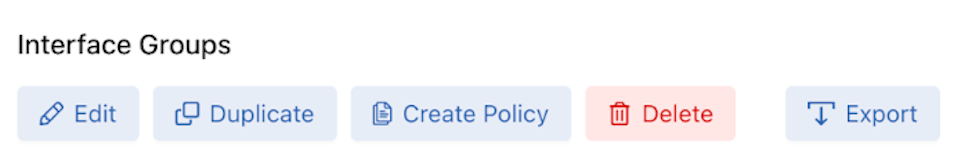
Edit - Select a single row from the list to edit an interface group.
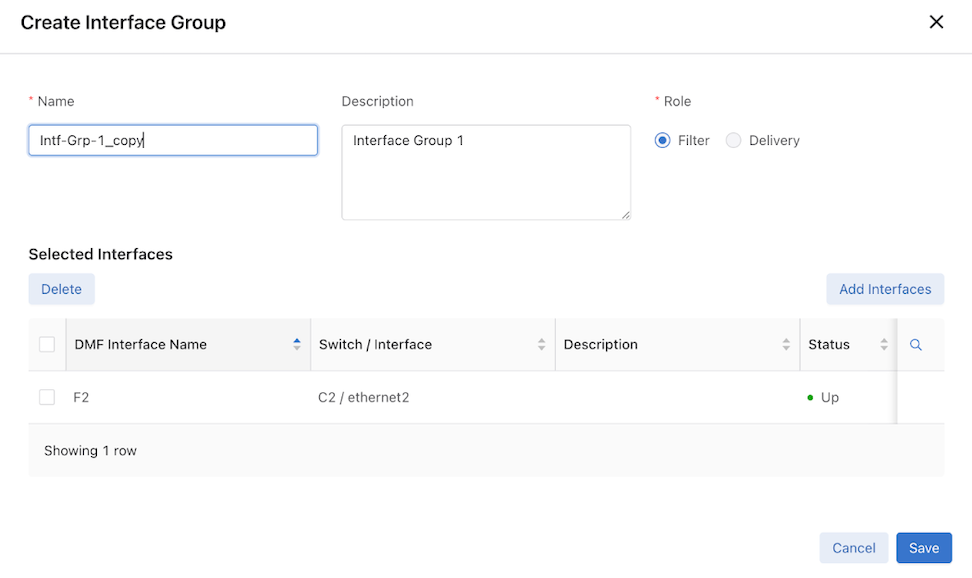
Duplicate - To duplicate an interface group, select a single row from the list that opens a copy of the selected interface group for editing.
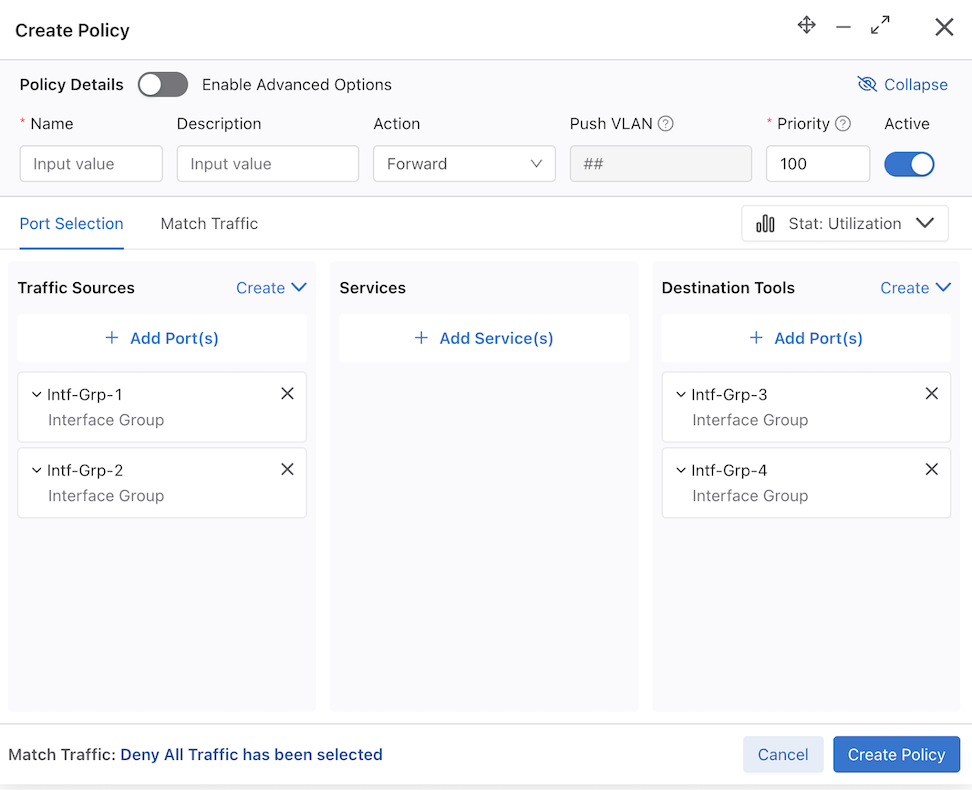
Create Policy - The Create Policy option allows the creation of policies directly from the Interface Groups page. Upon selecting Create Policy, the selected Interface Groups are automatically organized under different sources based on their Role — either Filter or Delivery.
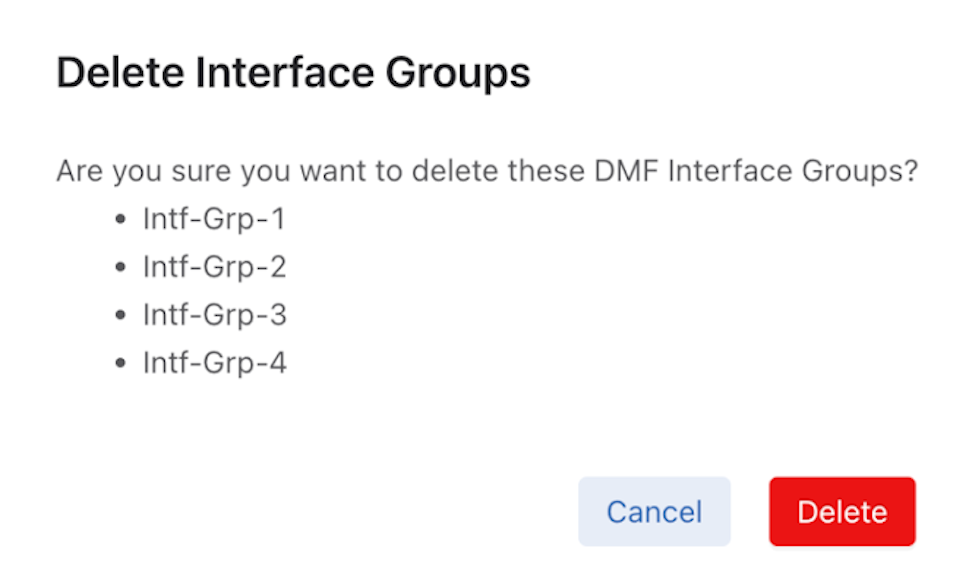
Delete - Delete interface groups by selecting one or more groups and using the Delete option.
Export - The Export option for the Interface Groups table supports both CSV and JSON formats. Export functionality is independent of any row selection and includes the complete table data.
Considerations
During Interface Group creation, interface selections are not persistent when switching between roles. When adding interfaces to one role and switching to another, the selections made for the first role are lost.
Example:
- Select the role Filter and add interfaces.
- Change the role to Delivery.
- Switch back to the Filter role — the previously selected interfaces are gone.
When deleting a previously added interface in an Interface Group, DMF does not automatically remove it from the Interface Group. The deleted interface entry must be manually removed from the Interface Group configuration.
Using the Command Line Interface
Configure a Filter or Delivery Interface
Identify a Filter Interface using Destination MAC Rewrite
Forward Slashes in Interface Names
Configure a Filter or Delivery Interface
Interface Description
The show switch <switch name/all> interface details or show switch <switch name/all> interface <interface name>
details commands in the CLI include a Description column, which provides the configured description (if any) for the corresponding interface. This is a only a CLI change.
No configuration is necessary to use this feature. However, the column remains empty for any switch interface without a configured description. Please refer to the existing user documentation to configure a description for an interface.
Show Commands
Use the following show commands for viewing an interface description.
show switch
name interface
command:
dmf-controller# show switch all interface details
#   Switch    IF Name    MAC Address                   Config State Adv. Features Curr Features Supported Features Description
---|---------|----------|-----------------------------|------|-----|-------------|-------------|------------------|------------------------------------|
1   core1     ethernet1  52:54:00:d9:58:8c (Linux KVM) up     up    10g           10g           10g
2   core1     ethernet2  52:54:00:5a:ba:93 (Linux KVM) up     up    10g           10g           10g                sample description for eth2
...
dmf-controller# show switch core1 interface details
#  IF Name    MAC Address                   Config State Adv. Features Curr Features Supported Features Description
--|----------|-----------------------------|------|-----|-------------|-------------|------------------|-------------------------------|
1  ethernet1  52:54:00:d9:58:8c (Linux KVM) up     up    10g           10g           10g
2  ethernet2  52:54:00:5a:ba:93 (Linux KVM) up     up    10g           10g           10g                sample description for eth2
3  ethernet3  5c:16:c7:10:e0:bc (Arista)    up     down  10g           10g           10g
4  ethernet4  5c:16:c7:10:e0:bd (Arista)    up     down  10g           10g           10g
5  ethernet5  5c:16:c7:10:e0:be (Arista)    up     down  10g           10g           10g                sample description for eth5
...
dmf-controller# show switch core1 interface ethernet5 details
# IF Name   MAC Address                Config State Adv. Features Curr Features Supported Features Description
-|---------|--------------------------|------|-----|-------------|-------------|------------------|--------------------------------|
1 ethernet5 5c:16:c7:10:e0:be (Arista) up     down  10g           10g           10g                sample description for eth5
Identify a Filter Interface using Destination MAC Rewrite
Global Configuration
Configure this function at the filter interface level and perform the following steps using the CLI.CLI Show Commands
The following show command displays the ingress flow for the filter switch.
In the Entry value column, the filter switch contains dst MAC tlv: EthDst(00:00:00:00:00:03).
(config-policy)# show switch filter1 table ingress-flow-2
# Ingress-flow-2 Device name Entry key                               Entry value
-|--------------|-----------|---------------------------------------|-----------------------------------|
1 0              filter1     Priority(6400), Port(5), EthType(34525) Name(p1), Data([0, 0, 0, 61]), PushVlanOnIngress(flags=[]), VlanVid(0x1), Port(1), EthDst(00:00:00:00:00:03)
2 1              filter1     Priority(6400), Port(5)                 Name(p1), Data([0, 0, 0, 62]), PushVlanOnIngress(flags=[]), VlanVid(0x1), Port(1), EthDst(00:00:00:00:00:03)
3 2              filter1     Priority(36000), EthType(35020)         Name(__System_LLDP_Flow_), Data([0, 0, 0, 56]), Port(controller), QueueId(0)
The core and delivery switch in the Entry value column doesn’t contain dst MAC tlv, as shown in the following examples.
(config-policy)# show switch core1 table ingress-flow-2
# Ingress-flow-2 Device name Entry key                                             Entry value
-|--------------|-----------|-----------------------------------------------------|----------------------------|
1 0              core1       Priority(6400), Port(1), EthType(34525), VlanVid(0x1) Name(p1), Data([0, 0, 0, 60]), Port(2)
2 1              core1       Priority(6400), Port(1), VlanVid(0x1)                 Name(p1), Data([0, 0, 0, 59]), Port(2)
3 2              core1       Priority(36000), EthType(35020)                       Name(__System_LLDP_Flow_), Data([0, 0, 0, 57]), Port(controller), QueueId(0)
(config-policy)# show switch delivery1 table ingress-flow-2
# Ingress-flow-2 Device name Entry key                                             Entry value
-|--------------|-----------|-----------------------------------------------------|----------------------------|
1 0              delivery1   Priority(6400), Port(1), EthType(34525), VlanVid(0x1) Name(p1), Data([0, 0, 0, 64]), Port(6)
2 1              delivery1   Priority(6400), Port(1), VlanVid(0x1)                 Name(p1), Data([0, 0, 0, 63]), Port(6)
3 2              delivery1   Priority(36000), EthType(35020)                       Name(__System_LLDP_Flow_), Data([0, 0, 0, 58]), Port(controller), QueueId(0)
Troubleshooting
To troubleshoot the scenario where the provided destination MAC address is attached incorrectly to the filter interface. The ingress-flow-2 table shown earlier will have a destination MAC rewrite tlv on the filter switch, but no such tlv appears on the core or delivery switch.
As an alternative, drop into the bash of the filter switch to check the flow and destination MAC rewrite.
Use the following commands for the ZTN CLI of the filter switch.
(config)# connect switch filter1
(ztn-config) debug admin
filter1> enable
filter1# debug bash
The following command prints the flow table of the filter switch.
root@filter1:~# ofad-ctl gt ING_FLOW2
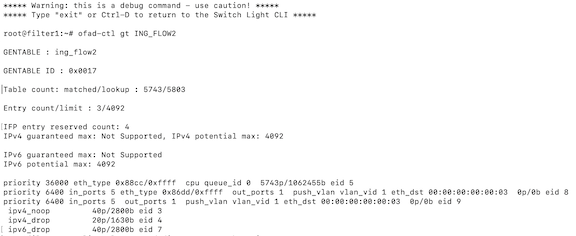
The following command shows the policy flow from the filter switch to the delivery switch. The filter switch will have the assigned destination MAC in the match-field.
(config)# show policy-flow
# Policy Name Switch                              Pkts Bytes Pri  T Match                    Instructions
-|-----------|-----------------------------------|----|-----|----|-|------------------------|------------------|
1 p1          core1 (00:00:52:54:00:15:94:88)     0    0     6400 1 eth-type ipv6,vlan-vid 1 apply: name=p1 output: max-length=65535, port=2
2 p1          core1 (00:00:52:54:00:15:94:88)     0    0     6400 1 vlan-vid 1               apply: name=p1 output: max-length=65535, port=2
3 p1          delivery1 (00:00:52:54:00:00:11:d2) 0    0     6400 1 vlan-vid 1               apply: name=p1 output: max-length=65535, port=6
4 p1          delivery1 (00:00:52:54:00:00:11:d2) 0    0     6400 1 eth-type ipv6,vlan-vid 1 apply: name=p1 output: max-length=65535, port=6
5 p1          filter1 (00:00:52:54:00:d5:2c:05)   0    0     6400 1                          apply: name=p1 push-vlan: ethertype=802.1Q (33024),set-field: match-field/type=vlan-vid, match-field/vlan-tag=1,output: max-length=65535, port=1,set-field: match-field/eth-address=00:00:00:00:00:03 (XEROX), match-field/type=eth-dst
6 p1          filter1 (00:00:52:54:00:d5:2c:05)   0    0     6400 1 eth-type ipv6            apply: name=p1 push-vlan: ethertype=802.1Q (33024),set-field: match-field/type=vlan-vid, match-field/vlan-tag=1,output: max-length=65535, port=1,set-field: match-field/eth-address=00:00:00:00:00:03 (XEROX), match-field/type=eth-dst
Considerations
- The destination MAC rewrite cannot be used on the filter interface where timestamping is enabled.
- The destination MAC rewrite will not work when the filter interface is configured as a receive-only tunnel interface.
Forward Slashes in Interface Names
DANZ Monitoring Fabric (DMF) supports using forward slashes (/) in interface names to aid in managing interfaces in the DMF fabric. For example, when:
- Defining the SPAN device name and port numbers which generally contain a forward slash (eth2/1/1) in the name for easy port identification.
- Using separate SPAN sessions for Tx and Rx traffic, when there are multiple links from a device to a filter switch.
The following is the comprehensive list of DMF interfaces supporting the use of a forward slash:
| filter interface | unmanaged service interface |
|---|---|
| filter interface group | recorder node interface |
| delivery interface | MLAG interface |
| delivery interface group | LAG interface |
| filter-and-delivery interface | GRE tunnel interface |
| PTP interface | VXLAN tunnel interface |
| managed service interface |
Configuration
The configuration of DMF filter interfaces remains unchanged. This feature relaxes the existing naming convention by allowing a forward slash to be a part of the name.
The following are several examples:
both-filter-and-delivery, delivery, filter, ptp, service
dmf-controller-1(config-switch-if)# role role interface-name a/b/c
dmf-controller-1(config)# filter-interface-group a/b/c
dmf-controller-1(config)# delivery-interface-group a/b/c
dmf-controller-1(config-policy)# filter-interface f1/a/b
dmf-controller-1(config-policy)# filter-interface-group f/a/b
dmf-controller-1(config-policy)# delivery-interface d1/a/b
dmf-controller-1(config-policy)# delivery-interface-group d/a/b
dmf-controller-1(config)# recorder-fabric interface a/b/c
dmf-controller-1(config-managed-srv-flow-diff)# l3-delivery-interface a/b/c
dmf-controller-1(config-mlag-domain)# mlag-interface a/b/c
dmf-controller-1(config-mlag-domain-if)# role delivery interface-name a/b/c
dmf-controller-1(config-switch)# lag-interface a/b/c
dmf-controller-1(config-switch)# gre-tunnel-interface a/b/c
dmf-controller-1(config-switch)# vxlan-tunnel-interface a/b/c
Show Commands
There are no new show commands. The existing show
running-config and show this commands for the configurations mentioned earlier should display the interface names without any issue.
Configure sFlow on a Filter and Delivery Interface
A DANZ Monitoring Fabric (DMF) interface used by a DMF policy as both a filter and a delivery interface is known as a filter-and-delivery interface. Filter-and-delivery interfaces support configuring sFlow®* in the DMF Controller. DMF enables sFlow by default on filter-and-delivery interfaces.
Perform the following steps using the CLI:
If sFlow is disabled, apply the role command without the optional no-flow token to enable it and restore the default sFlow behavior on the filter-and-delivery interface.
role command replaces the role config for the interface.dmf-controller(config-switch-if)# role both-filter-and-delivery interface-name fd1
Configure Interface Groups
Create an interface group consisting of one or more filter or delivery interfaces. It is often easier to refer to an interface group when creating a policy than to identify every interface to which the policy applies explicitly.
Use an address group in multiple policies, referring to the IP address group by name in match rules. If no subnet mask is provided in the address group, it is assumed to be an exact match. For example, in an IPv4 address group, the absence of a mask implies a mask of /32. For an IPv6 address group, the absence of a mask implies a mask of /128.
Identify only a single IP address group for a specific policy match rule. Address lists with both src-ip and dst-ip options cannot exist in the same match rule.
controller-1(config-switch)# filter-interface-group TAP-PORT-GRP
controller-1(config-filter-interface-group)# filter-interface TAP-PORT-1
controller-1(config-filter-interface-group)# filter-interface TAP-PORT-2
controller-1(config-switch)# delivery-interface-group TOOL-PORT-GRP
controller-1(config-delivery-interface-group)# delivery-interface TOOL-PORT-1
controller-1(config-delivery-interface-group)# delivery-interface TOOL-PORT-2
To view information about the interface groups in the DMF fabric, enter the show filter-interface-group command, as in the following examples:
Filter Interface Groups
controller-1(config-filter-interface-group)# show filter-interface-group
! show filter-interface-group TAP-PORT-GRP
# Name         Big Tap IF Name            Switch IF Name    Direction  Speed     State   VLAN  Tag
-|------------|--------------------------|-----------------|----------|---------|-------|-----|--------|
1 TAP-PORT-GRP TAP-PORT-1 DMF-CORE-SWITCH-1 ethernet17      rx         100Gbps   up      0
2 TAP-PORT-GRP TAP-PORT-2 DMF-CORE-SWITCH-1 ethernet18      rx         100Gbps   up      0
controller1(config-filter-interface-group)#
controller1(config-filter-interface-group)# show delivery-interface-group
! show delivery-interface-group DELIVERY-PORT-GRP
# Name              Big Tap IF Name Switch IF Name        Direction  Speed     Rate   limit     State Strip Forwarding Vlan
-|-----------------|---------------|---------------------|----------|---------|------|---------|-----|---------------------|
1 TOOL-PORT-GRP TOOL-PORT-1 DMF-DELIVERY-SWITCH-1 ethernet15 tx      10Gbps                     up    True
2 TOOL-PORT-GRP TOOL-PORT-2 DMF-DELIVERY-SWITCH-1 ethernet16 tx      10Gbps                     up    True
controller-1(config-filter-interface-group)#
Configure Error Disable State
Error Disable State for Port Flapping prevents policy churn by automatically placing switch interfaces with frequent flapping into an error-disabled state, effectively performing an automatic administrative shutdown. The feature allows for automatically recovering these interfaces after a specified time. It reduces the risk of lost packets caused by continuous re-computation of DANZ Monitoring Fabric (DMF) policies due to flapping interfaces. By default, Error Disable State for Port Flapping is disabled.
Global Configuration
This feature is configurable at the global level.
To configure it, run the errdisable command from the config submode.
dmf-controller(config)# errdisable
dmf-controller(config-errdisable)#
detect-duration    enable-feature     flap-count         recovery-interval
By default, this feature is disabled; use the enable-feature command to enable it under the config-errdisable submode.
dmf-controller(config-errdisable)# enable-feature
Conversely, to deactivate it, use the no option of enable-feature.
dmf-controller(config-errdisable)# no enable-feature
Flap-count: Specifies the number of flaps required within the detect-duration period to set the interface into the error-disabled state. The default is 5 flaps.
dmf-controller(config-errdisable)# flap-count
Flap count     Configure flap count. Range 1..1000 (default 5)
dmf-controller(config-errdisable)# flap-count 20
Detect-duration: Specifies the duration during which the required flap count must be reached to set the interface into an error-disabled state. The default is 10 seconds.
dmf-controller(config-errdisable)# detect-duration
Detect duration (secs)     Configure detect duration in seconds. Range 1..1800 (default 10s)
dmf-controller(config-errdisable)# detect-duration 30
Recovery-interval: The recovery-interval indicates how much time will pass before bringing up the interface when the automatic administrative shutdown action shuts it down. The default is 3600 seconds.
dmf-controller(config-errdisable)# recovery-interval
Recovery interval (secs)     Configure the recovery interval in seconds. Range 30..86400 (default 3600s)
dmf-controller(config-errdisable)# recovery-interval 1200
Use the show this command to review the settings:
dmf-controller(config-errdisable)# show this
! errdisable
errdisable
  detect-duration 30
  enable-feature
  flap-count 20
  recovery-interval 1200
Local Configuration
This feature allows disabling the Error Disable feature on a per-interface basis. This prevents a specific interface from being automatically error-disabled due to port flapping.
To disable Error Disable for an interface:
Enter the interface configuration mode config-switch-if using the following commands:
dmf-controller(config)# switch switch-name
dmf-controller(config-switch)# interface interface-name
dmf-controller(config-switch-if)#
Use the errdisable command to access the interface's Error Disable settings which enters into errdisable submode.
Execute the disable command.
Disable the feature on the interface level using the disable option under config-switch-if-errdisable.
dmf-controller(config-switch-if)# errdisable
dmf-controller(config-switch-if-errdisable)# disable
Quick Interface Recovery
When an interface is in the error-disabled state, use the disable command to immediately bring the interface back up instead of waiting for the recovery action to be initiated. This action overrides the configured recovery interval and restores the interface's functionality.
Show Commands - Error State
When an interface is in error-disabled state, view the details using the show
fabric warnings errdisable-warning command. The output lists the switch and the error-disabled interface name with a detailed message.
dmf-controller# show fabric warnings errdisable-warning
~~~~~~~~~~~~~~~~~~~~~~~~~~~~~~~~~~~~~ Error disable warnings  ~~~~~~~~~~~~~~~~~~~~~~~~~~~~~~~~~~~~~
# Switch IF Name    Warning message
-|------|----------|------------------------------------------------------------------------------|
1 core1  ethernet12 Interface ethernet12 on switch core1 has been error-disabled due to port flaps
Use the show errdisable command to obtain the following details:
- Global settings for the error-disable port flapping feature, including the maximum flap count, monitor duration, recovery interval, and status.
- A list of currently error-disabled interfaces and their switch and interface names.
- A list of interfaces where the error-disable feature has been specifically disabled.
dmf-controller# show errdisable
Max flap count                      : 20
Duration to monitor max flaps (sec) : 30
Recovery interval (sec)             : 1200
Status                              : enabled
~ Interfaces in Error-Disable State ~
# Switch IF Name
-|------|----------|
1 core1  ethernet12
~ Excluded Interfaces from Error-Disable ~
# Switch IF Name
-|------|----------|
1 core1  ethernet14
Use the show switch switch-name interface
interface-name errdisable command to view more details related to the error-disable interface. The output lists the switch name, interface name, state, the reason for the port shutdown, shutdown time, time remaining until its recovery, and expected recovery time.
dmf-controller# show switch core1 interface ethernet12 errdisable
# Switch IF Name    State         Shutdown Reason Shutdown Time           Time Until Recovery(sec) Expected Recovery Time
-|------|----------|-------------|---------------|-----------------------|------------------------|-----------------------|
1 core1  ethernet12 port-disabled port-flaps      2025-02-26 20:46:29 UTC 973                      2025-02-26 21:46:29 UTC
Troubleshooting
For troubleshooting scenarios where errdisable is configured but an interface has not been disabled despite flapping, the show flaps port
switch-name
interface-name command is useful. This command provides the following information:
- Total Flap Count: The cumulative number of detected flap events for the specified interface.
- Recent Flap History: The last 10 flap events detail the precise start and end timestamps of the interface’s down and up transitions.
show flaps port
switch-name
interface-name
command registers and displays actual flapping events only after establishing this baseline.# show flaps port core1 ethernet12 ~~~~~~~~ Selected Port ~~~~~~~~ Port Name : ethernet12 Switch Name : core1 Total Flaps on Port : 3 ~~~~~~~~~~~~~~~~ Port Flap Events ~~~~~~~~~~~~~~~~ # Start Time of Flap End Time of Flap -|-----------------------|-----------------------| 1 2025-02-27 19:00:33 UTC 2025-02-27 19:00:34 UTC 2 2025-02-27 19:00:30 UTC 2025-02-27 19:00:31 UTC 3 2025-02-27 19:00:28 UTC 2025-02-27 19:00:29 UTC
Overriding the Default Configuration for a Switch
- Info
- Clock
- SNMP
- SNMP traps
- Logging
- TACACS
- sFlow®*
- LAG enhanced hash
CLI Configuration
config-switch submode.
controller-1(config)# switch switch-name
controller-1(config)# switch DMF-SWITCH-1
controller-1(config-switch)#
From this submode, configure the specific switch and override the default configuration pushed from the DANZ Monitoring Fabric (DMF) Controller to the switch.
The DANZ Monitoring Fabric Deployment Guide provides detailed instructions on overriding the switch's default configuration.
Switch Light CLI Operational Commands
As a result of upgrading the Debian distribution to Bookworm, the original Python CLI (based on python2) was removed, as the interaction with the DANZ Monitoring Fabric (DMF) is performed mainly from the Controller.
However, several user operations involve some of the commands used on the switch. These commands are implemented in the new CLI (based on python3) in Switch Light in the Bookworm Debian distribution.
The Zero-Trust Network (ZTN) Security CLI is the default shell when logged into the switch.
Operational Commands
After connecting to the switch and from the DMF Controller, use the debug admin command to enter the switch admin CLI from the ZTN CLI.
DMF-CONTROLLER# connect switch dmf-sw-7050sx3-1
Switch Light OS SWL-OS-DMF-8.6.x(0), 2024-05-16.08:26-17f56f6
Linux dmf-sw-7050sx3-1 4.19.296-OpenNetworkLinux #1 SMP Thu May 16 08:35:25 UTC 2024 x86_64
Last login: Tue May 21 10:39:05 2024 from 10.240.141.151

Switch Light ZTN Manual Configuration. Type help or ? to list commands.

(ztn-config) debug admin
(admin)
(admin) exit

(ztn-config)
Help
(admin) help

Documented commands (type help <topic>):
========================================
EOF  copy  exit  help  ping  ping6  quit  reboot  reload  show
Ping
(admin) ping 10.240.141.151
PING 10.240.141.151 (10.240.141.151) 56(84) bytes of data.
64 bytes from 10.240.141.151: icmp_seq=1 ttl=64 time=0.238 ms
64 bytes from 10.240.141.151: icmp_seq=2 ttl=64 time=0.206 ms
64 bytes from 10.240.141.151: icmp_seq=3 ttl=64 time=0.221 ms
64 bytes from 10.240.141.151: icmp_seq=4 ttl=64 time=0.161 ms

--- 10.240.141.151 ping statistics ---
4 packets transmitted, 4 received, 0% packet loss, time 3049ms
rtt min/avg/max/mdev = 0.161/0.206/0.238/0.028 ms
Ping6
(admin) ping6 fe80::3673:5aff:fefb:9dec
PING fe80::3673:5aff:fefb:9dec(fe80::3673:5aff:fefb:9dec) 56 data bytes
64 bytes from fe80::3673:5aff:fefb:9dec%ma1: icmp_seq=1 ttl=64 time=0.490 ms
64 bytes from fe80::3673:5aff:fefb:9dec%ma1: icmp_seq=2 ttl=64 time=0.232 ms
64 bytes from fe80::3673:5aff:fefb:9dec%ma1: icmp_seq=3 ttl=64 time=0.218 ms
64 bytes from fe80::3673:5aff:fefb:9dec%ma1: icmp_seq=4 ttl=64 time=0.238 ms

--- fe80::3673:5aff:fefb:9dec ping statistics ---
4 packets transmitted, 4 received, 0% packet loss, time 3069ms
rtt min/avg/max/mdev = 0.218/0.294/0.490/0.113 ms
Copy Tech-Support Data
Use the copy tech-support data command to collect the switch support bundle. The tech support command executed from the Controller collects support bundles from all the switches in the fabric.
To collect tech support data for an individual switch, only run the copy tech-support data command from that switch. Perform this action when the switch isn't accessible from the Controller or when collecting a support bundle only for that switch.(admin) copy tech-support data Writing /mnt/onl/data/tech-support_240521104337.txt.gz... tech-support_240521104337.txt.gz created in /mnt/onl/data/ (admin)
Show Commands
The following show commands are available under the admin shell.
(admin) show clock
Tue May 21 10:46:20 2024
(admin)
(admin) show ntp
remote                                   refid           st t when poll  reach delay    offset   jitter
=======================================================================================================
 10.130.234.12                           .STEP.          16 u    - 1024    0   0.0000   0.0000   0.0002
*time2.google.com                        .GOOG.           1 u  649 1024  377  40.0469   1.6957   0.4640
+40.119.6.228                            25.66.230.1      3 u  601 1024  377  50.6083  -0.5323   7.8069
(admin)
Show Controller
(admin) show controller
IP:Port              Proto State          Role     #Aux
10.240.141.151:6653  tcp   CONNECTED      ACTIVE      2
10.240.189.233:6653  tcp   CONNECTED      STANDBY     2
     127.0.0.1:6653  tcp   CONNECTED      STANDBY     1
(admin)
history and statistics options in the show controller command to obtain additional information.
(admin) show controller history | statistics
(admin)
(admin) show controller history
Mon May 20 15:53:42 2024 tcp:127.0.0.1:6653:0 - Connected
Mon May 20 15:53:43 2024 tcp:127.0.0.1:6653:1 - Connected
Mon May 20 15:54:46 2024 tcp:127.0.0.1:6653:1 - Disconnected
Mon May 20 15:54:46 2024 tcp:127.0.0.1:6653:0 - Disconnected
Mon May 20 08:57:07 2024 tcp:127.0.0.1:6653:0 - Connected
Mon May 20 08:57:07 2024 tcp:127.0.0.1:6653:1 - Connected
Mon May 20 08:57:07 2024 tcp:10.240.141.151:6653:0 - Connected
Mon May 20 08:57:07 2024 tcp:10.240.141.151:6653:1 - Connected
Mon May 20 08:57:07 2024 tcp:10.240.141.151:6653:2 - Connected
Mon May 20 11:16:07 2024 tcp:10.240.189.233:6653:0 - Connected
Mon May 20 11:16:19 2024 tcp:10.240.189.233:6653:1 - Connected
Mon May 20 11:16:19 2024 tcp:10.240.189.233:6653:2 - Connected
(admin)
show controller statistics command displays connection statistics, including keep-alive timeout, timeout threshold count, and other important information, as shown in the following example.
(admin) show controller statistics
Connection statistics report
Outstanding async op count from previous connections: 0
Stats for connection tcp:10.240.141.151:6653:0:
    Id: 131072
    Auxiliary Id: 0
    Controller Id: 0
    State: Connected
    Keepalive timeout: 2000 ms
    Threshold: 3
    Outstanding Echo Count: 0
    Tx Echo Count: 46438
    Messages in, current connection: 52887
    Cumulative messages in: 52887
    Messages out, current connection: 52961
    Cumulative messages out: 52961
    Dropped outgoing messages: 0
    Outstanding Async Operations: 0
Stats for connection tcp:10.240.189.233:6653:0:
    Id: 112066561
    Auxiliary Id: 0
    Controller Id: 1
    State: Connected
    Keepalive timeout: 2000 ms
    Threshold: 3
    Outstanding Echo Count: 0
    Tx Echo Count: 42269
    Messages in, current connection: 43108
    Cumulative messages in: 43108
    Messages out, current connection: 43114
    Cumulative messages out: 43114
    Dropped outgoing messages: 0
    Outstanding Async Operations: 0
(admin)
(admin) show log
2024-05-20T15:53:04+00:00 localhost syslog-ng[3787]: NOTICE syslog-ng starting up; version='3.38.1'
2024-05-20T15:52:51+00:00 localhost kernel: NOTICE Linux version 4.19.296-OpenNetworkLinux (bsn@sbs3) (gcc version 12.2.0 (Debian 12.2.0-14)) #1 SMP Thu May 16 08:35:25 UTC 2024
2024-05-20T15:52:51+00:00 localhost kernel: INFO Command line:  reboot=p acpi=on Aboot=Aboot-norcal6-6.1.10-14653765 platform=magpie sid=Calpella console=ttyS0,9600n8 tsc=reliable pcie_ports=native pti=off reassign_prefmem amd_iommu=off onl_mnt=/dev/mmcblk0p1 quiet=1 onl_platform=x86-64-arista-7050sx3-48yc12-r0 onl_sku=DCS-7050SX3-48YC12
2024-05-20T15:52:51+00:00 localhost kernel: INFO BIOS-provided physical RAM map:
….
….
2024-05-21T10:40:31-07:00 dmf-sw-7050sx3-1 systemd[1]: INFO Starting logrotate.service - Rotate log files...
2024-05-21T10:40:32-07:00 dmf-sw-7050sx3-1 systemd[1]: INFO logrotate.service: Deactivated successfully.
2024-05-21T10:40:32-07:00 dmf-sw-7050sx3-1 systemd[1]: INFO Finished logrotate.service - Rotate log files.
2024-05-21T10:45:32-07:00 dmf-sw-7050sx3-1 systemd[1]: INFO Starting logrotate.service - Rotate log files...
2024-05-21T10:45:33-07:00 dmf-sw-7050sx3-1 systemd[1]: INFO logrotate.service: Deactivated successfully.
2024-05-21T10:45:33-07:00 dmf-sw-7050sx3-1 systemd[1]: INFO Finished logrotate.service - Rotate log files.
(admin)
Reboot and Reload
(admin) help reboot

Reboot the switch.

(admin) help reload

Reload the switch.

(admin) reboot
Proceed with reboot [confirm]?

(admin) reload
Proceed with reload [confirm]?
(admin)