References
Related Documents
The following documentation is available for DANZ Monitoring Fabric 8.7.0:
This chapter describes the hardware available from Arista to use with the current release of DANZ Monitoring Fabric.
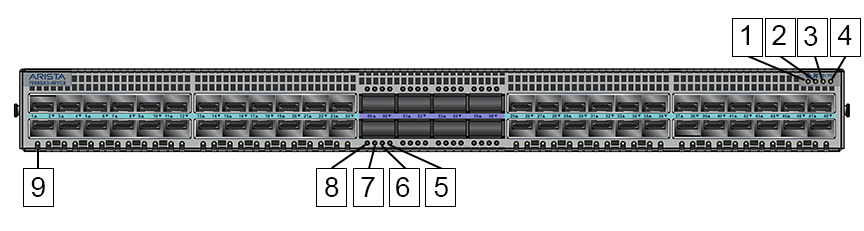
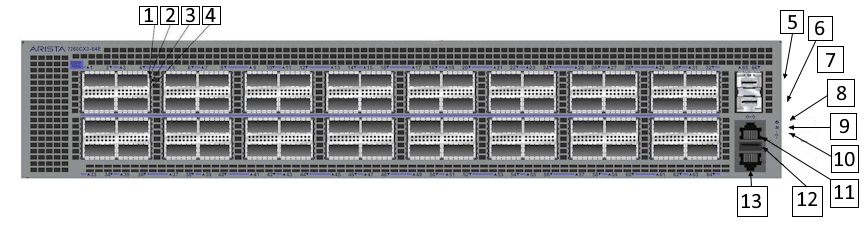
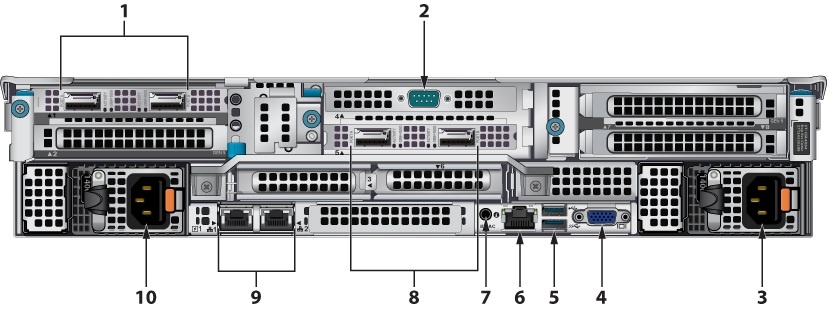
This section describes the LEDs for monitoring environmental and switch port status on the Arista 7050CX3-32C/32S switches.
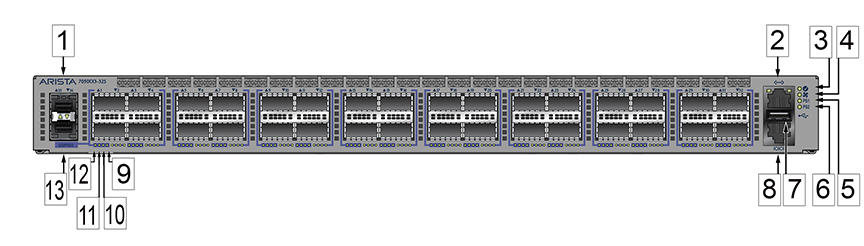
| 1 | Port 33 1/10GbE | 8 | Console port (default baud rate 9600) |
| 2 | Management port | 9 | Port X:4 Breakout 10/25GbE Link/Activity LED |
| 3 | System status/locator LED | 10 | Port X:3 Breakout 10/25GbE Link/Activity LED |
| 4 | Fan status LED | 11 | Port X:2 Breakout 10/25GbE Link/Activity LED |
| 5 | Power supply 1 status LED | 12 | 40/100GbE or Port X:1 Breakout 10/25GbE Link/Activity LED |
| 6 | Power supply 2 status LED | 13 | Port 34 1/10GbE (Not supported) |
| 7 | USB port |
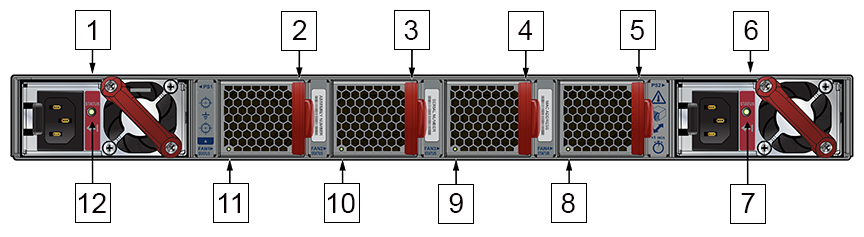
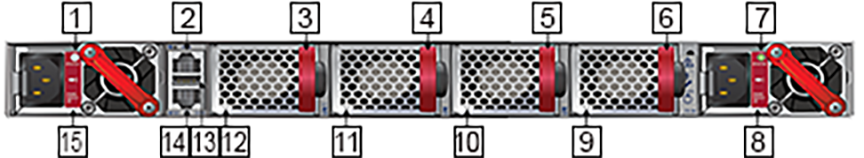
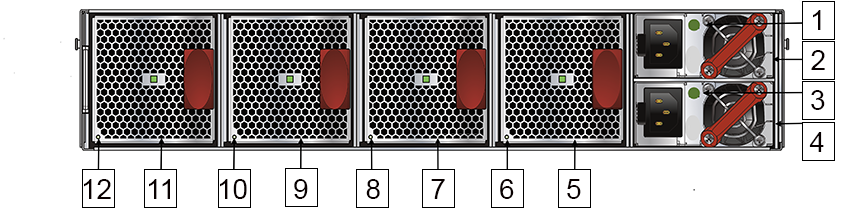
| 1 | PS1 module | 7 | PS2 status LED |
| 2 | Fan1 module | 8 | Fan4 status LED |
| 3 | Fan2 module | 9 | Fan3 status LED |
| 4 | Fan3 module | 10 | Fan2 status LED |
| 5 | Fan4 module | 11 | Fan1 status LED |
| 6 | PS2 module | 12 | PS1 status LED |
| LED | Description |
|---|---|
| System status | Green: Normal operation |
| Green blinking: The system is powering up. | |
| Amber: Two or more fans (any combination of fan modules or PSU fans) are disconnected, malfunctioning, or incompatible. | |
| Blue/Blinking Blue: The locater function is active. | |
| PSU[1:2] status | Green: Normal operation |
| Red: One of the power supplies has failed or is missing. | |
| Off: No power | |
| Fan status | Green: Fan modules are powered and running at the expected rpm. |
| Amber blinking: One or more fan trays failed. | |
| Status LED on power supply | Green: Input power present - Normal operation |
| Amber: Input power present - Power supply fault. | |
| Off: No input power supply installed in chassis. | |
| Status LED on fan tray | Green: The fan is operating normally. This LED state is exclusive to its fan module and independent of the states of its neighboring fans and power supplies. |
| Red: The fan has failed. | |
| Off: Detects no fan module. If the fan is there, it may not be seated properly. |
| Port | LED | Description |
|---|---|---|
| 1GbE SFP
10GbE SFP+ |
Link status | Green: Establishes a valid 1/10GbE network link |
| Amber: The link is disabled. | ||
| Off: Link is down. | ||
| 40GbE QSFP+
100GbE QSFP28 |
Link status | Green: Establishes a valid 40/100GbE network link |
| Amber: The link is disabled. | ||
| Off: Link is down. | ||
| 4X10G QSFP+ breakout
4X25G QSFP28 breakout |
Link status | Green: Establishes a valid 10/25GbE network link |
| Amber: The link is disabled. | ||
| Off: Link is down. | ||
| Management port | Link /Activity | Green: Establishes a valid network link. |
| Green blinking: Network activity in progress. | ||
| Off: Link is down. | ||
| Speed | Green: Establishes a valid 10/100/1000Mb/s network link. | |
| Off: Link is down. |
This section describes the LEDs for monitoring environmental and switch port status on the Arista 7050SX3-48C8/48C8C switches.
| 1 | System status LED | 4 | Power supply 2 status LED |
| 2 | Fan status LED | 5 | Port numbers |
| 3 | Power supply 1 status LED |
| 1 | PS1 status LED | 7 | Fan2 status LED |
| 2 | Management port | 8 | Fan1 status LED |
| 3 | Fan1 module | 9 | USB port |
| 4 | Fan2 module | 10 | Console port (default baud rate 9600) |
| 5 | PS2 status LED | 11 | PS1 module |
| 6 | PS2 module |
| LED | Description |
|---|---|
| System status | Green: Normal operation |
| Green blinking: The system is powering up. | |
| Amber: Two or more fans (any combination of fan modules or PSU fans) are disconnected, malfunctioning, or incompatible. | |
| Blue/Blinking Blue: The locater function is active. | |
| PSU[1:2] status | Green: Normal operation |
| Red: One of the power supplies has failed or is missing. | |
| Off: No power | |
| Fan status | Green: Fan modules are powered and running at the expected rpm. |
| Amber blinking: One or more fan trays failed. | |
| Status LED on power supply | Green: Input power present - Normal operation |
| Amber: Input power present - Power supply fault. | |
| Off: No input power supply installed in chassis. | |
| Status LED on fan tray | Green: The fan is operating normally. This LED state is exclusive to its fan module and independent of the states of its neighboring fans and power supplies. |
| Red: The fan has failed. | |
| Off: Detects no fan module. If the fan is there, it may not be seated properly. |
| Port | LED | Description |
|---|---|---|
| 1GbE SFP
10GbE SFP+ |
Link status | Green: Establishes a valid 1/10GbE network link |
| Amber: The link is disabled. | ||
| Off: Link is down. | ||
| 40GbE QSFP+
100GbE QSFP28 |
Link status | Green: Establishes a valid 40/100GbE network link |
| Amber: The link is disabled. | ||
| Off: Link is down. | ||
| 4X10G QSFP+ breakout
4X25G QSFP28 breakout |
Link status | Green: Establishes a valid 10/25GbE network link |
| Amber: The link is disabled. | ||
| Off: Link is down. | ||
| Management port | Link /Activity | Green: Establishes a valid network link. |
| Green blinking: Network activity in progress. | ||
| Off: Link is down. | ||
| Speed | Green: Establishes a valid 10/100/1000Mb/s network link. | |
| Off: Link is down. |
This section describes the LEDs for monitoring environmental and switch port status on the Arista 7050SX3-48YC8/48YC8C switches.
| 1 | System status/locator LED | 6 | Port X:3 Breakout 10/25GbE Link/Activity LED |
| 2 | Fan status LED | 7 | Port X:2 Breakout 10/25GbE Link/Activity LED |
| 3 | Power supply 1 status LED | 8 | 40/100GbE or Port X:1 Breakout 10/25GbE Link/Activity LED |
| 4 | Power supply 2 status LED | 9 | 1/10/25GbE Link LED |
| 5 | Port X:4 Breakout 10/25GbE Link/Activity LED |
| 1 | PS1 status LED | 7 | Fan2 status LED |
| 2 | Management port | 8 | Fan1 status LED |
| 3 | Fan1 module | 9 | USB port |
| 4 | Fan2 module | 10 | Console port (default baud rate 9600) |
| 5 | PS2 status LED | 11 | PS1 module |
| 6 | PS2 module |
| LED | Description |
|---|---|
| System status | Green: Normal operation |
| Green blinking: The system is powering up. | |
| Amber: Two or more fans (any combination of fan modules or PSU fans) are disconnected, malfunctioning, or incompatible. | |
| Blue/Blinking Blue: The locater function is active. | |
| PSU[1:2] status | Green: Normal operation |
| Red: One of the power supplies has failed or is missing. | |
| Off: No power | |
| Fan status | Green: Fan modules are powered and running at the expected rpm. |
| Amber blinking: One or more fan trays failed. | |
| Status LED on power supply | Green: Input power present - Normal operation |
| Amber: Input power present - Power supply fault. | |
| Off: No input power supply installed in chassis. | |
| Status LED on fan tray | Green: The fan is operating normally. This LED state is exclusive to its fan module and independent of the states of its neighboring fans and power supplies. |
| Red: The fan has failed. | |
| Off: Detects no fan module. If the fan is there, it may not be seated properly. |
| Port | LED | Description |
|---|---|---|
| 1GbE SFP
10GbE SFP+ 25GbE SFP28 |
Link status | Green: Establishes a valid 1/10/25GbE network link |
| Amber: The link is disabled. | ||
| Off: Link is down. | ||
| 40GbE QSFP+
100GbE QSFP28 |
Link status | Green: Establishes a valid 40/100GbE network link |
| Amber: The link is disabled. | ||
| Off: Link is down. | ||
| 4X10G QSFP+ breakout
4X25G QSFP28 breakout |
Link status | Green: Establishes a valid 10/25GbE network link |
| Amber: The link is disabled. | ||
| Off: Link is down. | ||
| Management port | Link /Activity | Green: Establishes a valid network link. |
| Green blinking: Network activity in progress. | ||
| Off: Link is down. | ||
| Speed | Green: Establishes a valid 10/100/1000Mb/s network link. | |
| Off: Link is down. |
This section describes the LEDs for monitoring environmental and switch port status on the Arista 7050SX3-48YC12 switch.
The speed of the first optical cable inserted into a group is automatically detected, which sets the speed for all the interfaces in the group.
For example, if the first group (interface 1-4) is empty and when inserting a 25G cable into Interface 2, interfaces 1 to 4 are all automatically set to 25G, and no other speed is allowed in the group.
If you later insert a 10G cable into any interface in the group, the system does not bring up the 10G interface. You can bring up the 10G interface only if no cable of a different speed is present in any interface in the group.
Only the first interface connected is enabled when cables of different speeds are present in interfaces within a single group. However, when the switch restarts later with the cables inserted, the first interface in the group numerically is enabled. For example, with a 25G cable in Interface 2 and a 10G cable in Interface 1, interface 1 is enabled at 10G when the switch restarts and all the interfaces are at 10.
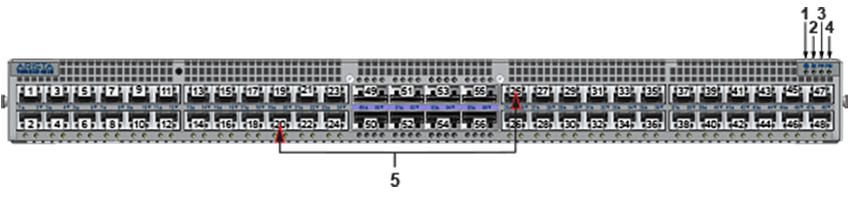
| 1 | 1/10/25GbE Link LED | 6 | System status/locator LED |
| 2 | 40/100GbE or Port X:1 Breakout 10/25GbE Link/Activity LED | 7 | Fan status LED |
| 3 | Port X:2 Breakout 10/25GbE Link/Activity LED | 8 | Power supply 1 status LED |
| 4 | Port X:3 Breakout 10/25GbE Link/Activity LED | 9 | Power supply 2 status LED |
| 5 | Port X:4 Breakout 10/25GbE Link/Activity LED |
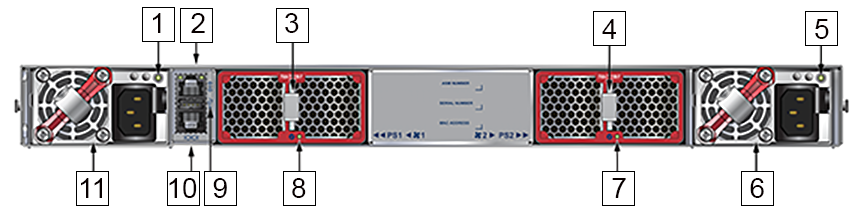
| 1 | PS1 status LED | 9 | Fan4 status LED |
| 2 | Management port | 10 | Fan3 status LED |
| 3 | Fan1 module | 11 | Fan2 status LED |
| 4 | Fan2 module | 12 | Fan1 status LED |
| 5 | Fan3 module | 13 | USB port |
| 6 | Fan4 module | 14 | Console port (default baud rate 9600) |
| 7 | PS2 status LED | 15 | PS1 module |
| 8 | PS2 module |
| LED | Description |
|---|---|
| System status | Green: Normal operation |
| Green blinking: The system is powering up. | |
| Amber: Two or more fans (any combination of fan modules or PSU fans) are disconnected, malfunctioning, or incompatible. | |
| Blue/Blinking Blue: The locater function is active. | |
| PSU[1:2] status | Green: Normal operation |
| Red: One of the power supplies has failed or is missing. | |
| Off: No power | |
| Fan status | Green: Fan modules are powered and running at the expected rpm. |
| Amber blinking: One or more fan trays failed. | |
| Status LED on power supply | Green: Input power present - Normal operation |
| Amber: Input power present - Power supply fault. | |
| Off: No input power supply installed in chassis. | |
| Status LED on fan tray | Green: The fan is operating normally. This LED state is exclusive to its fan module and independent of the states of its neighboring fans and power supplies. |
| Red: The fan has failed. | |
| Off: Detects no fan module. If the fan is there, it may not be seated properly. |
| Port | LED | Description |
|---|---|---|
| 1GbE SFP
10GbE SFP+ 25GbE SFP28 |
Link status | Green: Establishes a valid 1/10/25GbE network link |
| Amber: The link is disabled. | ||
| Off: Link is down. | ||
| 40GbE QSFP+
100GbE QSFP28 |
Link status | Green: Establishes a valid 40/100GbE network link |
| Amber: The link is disabled. | ||
| Off: Link is down. | ||
| 4X10G QSFP+ breakout
4X25G QSFP28 breakout |
Link status | Green: Establishes a valid 10/25GbE network link |
| Amber: The link is disabled. | ||
| Off: Link is down. | ||
| Management port | Link /Activity | Green: Establishes a valid network link. |
| Green blinking: Network activity in progress. | ||
| Off: Link is down. | ||
| Speed | Green: Establishes a valid 10/100/1000Mb/s network link. | |
| Off: Link is down. |
This section describes the LEDs for monitoring environmental and switch port status on the Arista 7050SX3-96YC8 switch.
The speed of the first optical cable inserted into a group is automatically detected, which sets the speed for all the interfaces in the group.
For example, if the first group (interface 1-4) is empty and when inserting a 25G cable into Interface 2, interfaces 1 to 4 are all automatically set to 25G, and no other speed is allowed in the group.
If you later insert a 10G cable into any interface in the group, the system does not bring up the 10G interface. You can bring up the 10G interface only if no cable of a different speed is present in any interface in the group.
Only the first interface connected is enabled when cables of different speeds are present in interfaces within a single group. However, when the switch restarts later with the cables inserted, the first interface in the group numerically is enabled. For example, with a 25G cable in Interface 2 and a 10G cable in Interface 1, interface 1 is enabled at 10G when the switch restarts and all the interfaces are at 10.
| 1 | 1/10/25GbE Link LED | 6 | System status/locator LED |
| 2 | 40/100GbE or Port X:1 Breakout 10/25GbE Link/Activity LED | 7 | Fan status LED |
| 3 | Port X:2 Breakout 10/25GbE Link/Activity LED | 8 | Power supply 1 status LED |
| 4 | Port X:3 Breakout 10/25GbE Link/Activity LED | 9 | Power supply 2 status LED |
| 5 | Port X:4 Breakout 10/25GbE Link/Activity LED |
| 1 | Fan1 module | 4 | Fan4 module |
| 2 | Fan2 module | 5 | Power supply module 1 |
| 3 | Fan3 module | 6 | Power supply module 2 |
| LED | Description |
|---|---|
| System status | Green: Normal operation |
| Green blinking: The system is powering up. | |
| Amber: Two or more fans (any combination of fan modules or PSU fans) are disconnected, malfunctioning, or incompatible. | |
| Blue/Blinking Blue: The locater function is active. | |
| PSU[1:2] status | Green: Normal operation |
| Red: One of the power supplies has failed or is missing. | |
| Off: No power | |
| Fan status | Green: Fan modules are powered and running at the expected rpm. |
| Amber blinking: One or more fan trays failed. | |
| Status LED on power supply | Green: Input power present - Normal operation |
| Amber: Input power present - Power supply fault. | |
| Off: No input power supply installed in chassis. | |
| Status LED on fan tray | Green: The fan is operating normally. This LED state is exclusive to its fan module and independent of the states of its neighboring fans and power supplies. |
| Red: The fan has failed. | |
| Off: Detects no fan module. If the fan is there, it may not be seated properly. |
| Port | LED | Description |
|---|---|---|
| 1GbE SFP
10GbE SFP+ 25GbE SFP28 |
Link status | Green: Establishes a valid 1/10/25GbE network link |
| Amber: The link is disabled. | ||
| Off: Link is down. | ||
| 40GbE QSFP+
100GbE QSFP28 |
Link status | Green: Establishes a valid 40/100GbE network link |
| Amber: The link is disabled. | ||
| Off: Link is down. | ||
| 4X10G QSFP+ breakout
4X25G QSFP28 breakout |
Link status | Green: Establishes a valid 10/25GbE network link |
| Amber: The link is disabled. | ||
| Off: Link is down. | ||
| Management port | Link /Activity | Green: Establishes a valid network link. |
| Green blinking: Network activity in progress. | ||
| Off: Link is down. | ||
| Speed | Green: Establishes a valid 10/100/1000Mb/s network link. | |
| Off: Link is down. |
This section describes the LEDs for monitoring environmental and switch port status on the Arista 7050TX3-48C8 switch.
| 1 | System status LED | 4 | Power supply 2 status LED |
| 2 | Fan status LED | 5 | Port numbers |
| 3 | Power supply 1 status LED |
| 1 | PS1 status LED | 7 | Fan2 status LED |
| 2 | Management port | 8 | Fan1 status LED |
| 3 | Fan1 module | 9 | USB port |
| 4 | Fan2 module | 10 | Console port (default baud rate 9600) |
| 5 | PS2 status LED | 11 | PS1 module |
| 6 | PS2 module |
| LED | Description |
|---|---|
| System status | Green: Normal operation |
| Green blinking: The system is powering up. | |
| Amber: Two or more fans (any combination of fan modules or PSU fans) are disconnected, malfunctioning, or incompatible. | |
| Blue/Blinking Blue: The locater function is active. | |
| PSU[1:2] status | Green: Normal operation |
| Red: One of the power supplies has failed or is missing. | |
| Off: No power | |
| Fan status | Green: Fan modules are powered and running at the expected rpm. |
| Amber blinking: One or more fan trays failed. | |
| Status LED on power supply | Green: Input power present - Normal operation |
| Amber: Input power present - Power supply fault. | |
| Off: No input power supply installed in chassis. | |
| Status LED on fan tray | Green: The fan is operating normally. This LED state is exclusive to its fan module and independent of the states of its neighboring fans and power supplies. |
| Red: The fan has failed. | |
| Off: Detects no fan module. If the fan is there, it may not be seated properly. |
| Port | LED | Description |
|---|---|---|
| 1GBase-T
10GBase-T |
Link status | Green: Establishes a valid 1/10GbE network link |
| Amber: The link is disabled. | ||
| Off: Link is down. | ||
| 40GbE QSFP+
100GbE QSFP28 |
Link status | Green: Establishes a valid 40/100GbE network link |
| Amber: The link is disabled. | ||
| Off: Link is down. | ||
| 4X10G QSFP+ breakout
4X25G QSFP28 breakout |
Link status | Green: Establishes a valid 10/25GbE network link |
| Amber: The link is disabled. | ||
| Off: Link is down. | ||
| Management port | Link /Activity | Green: Establishes a valid network link. |
| Green blinking: Network activity in progress. | ||
| Off: Link is down. | ||
| Speed | Green: Establishes a valid 10/100/1000Mb/s network link. | |
| Off: Link is down. |
This section describes the LEDs for monitoring environmental and switch port status on the Arista 7260CX3-64 switch.
| 1 | 40/100GbE or Port X:1 Breakout 10/25GbE Link/Activity LED | 8 | Fan status LED |
| 2 | Port X:2 Breakout 10/25GbE Link/Activity LED | 9 | Power supply 1 status LED |
| 3 | Port X:3 Breakout 10/25GbE Link/Activity LED | 10 | Power supply 2 status LED |
| 4 | Port X:4 Breakout 10/25GbE Link/Activity LED | 11 | Management port |
| 5 | Port 65 1/10GbE | 12 | USB port |
| 6 | Port 66 1/10GbE | 13 | Console port (default baud rate 9600) |
| 7 | System status/locator LED |
| 1 | PS1 status LED | 7 | Fan3 module |
| 2 | PS1 module | 8 | Fan3 status LED |
| 3 | PS2 status LED | 9 | Fan2 module |
| 4 | PS2 module | 10 | Fan2 status LED |
| 5 | Fan4 module | 11 | Fan1 module |
| 6 | Fan4 status LED | 12 | Fan1 status LED |
| LED | Description |
|---|---|
| System status | Green: Normal operation |
| Green blinking: The system is powering up. | |
| Amber: Two or more fans (any combination of fan modules or PSU fans) are disconnected, malfunctioning, or incompatible. | |
| Blue/Blinking Blue: The locater function is active. | |
| PSU[1:2] status | Green: Normal operation |
| Red: One of the power supplies has failed or is missing. | |
| Off: No power | |
| Fan status | Green: Fan modules are powered and running at the expected rpm. |
| Amber blinking: One or more fan trays failed. | |
| Status LED on power supply | Green: Input power present - Normal operation |
| Amber: Input power present - Power supply fault. | |
| Off: No input power supply installed in chassis. | |
| Status LED on fan tray | Green: The fan is operating normally. This LED state is exclusive to its fan module and independent of the states of its neighboring fans and power supplies. |
| Red: The fan has failed. | |
| Off: Detects no fan module. If the fan is there, it may not be seated properly. |
| Port | LED | Description |
|---|---|---|
| 1GBase-T
10GBase-T |
Link status | Green: Establishes a valid 1/10GbE network link |
| Amber: The link is disabled. | ||
| Off: Link is down. | ||
| 40GbE QSFP+
100GbE QSFP28 |
Link status | Green: Establishes a valid 40/100GbE network link |
| Amber: The link is disabled. | ||
| Off: Link is down. | ||
| 4X10G QSFP+ breakout
4X25G QSFP28 breakout |
Link status | Green: Establishes a valid 10/25GbE network link |
| Amber: The link is disabled. | ||
| Off: Link is down. | ||
| Management port | Link /Activity | Green: Establishes a valid network link. |
| Green blinking: Network activity in progress. | ||
| Off: Link is down. | ||
| Speed | Green: Establishes a valid 10/100/1000Mb/s network link. | |
| Off: Link is down. |
This section describes the LEDs for monitoring environmental and switch port status on the Arista 7260CX3-64E switch.
| 1 | 40/100GbE or Port X:1 Breakout 10/25GbE Link/Activity LED | 8 | Fan status LED |
| 2 | Port X:2 Breakout 10/25GbE Link/Activity LED | 9 | Power supply 1 status LED |
| 3 | Port X:3 Breakout 10/25GbE Link/Activity LED | 10 | Power supply 2 status LED |
| 4 | Port X:4 Breakout 10/25GbE Link/Activity LED | 11 | Management port |
| 5 | Port 65 1/10GbE | 12 | USB port |
| 6 | Port 66 1/10GbE | 13 | Console port (default baud rate 9600) |
| 7 | System status/locator LED |
| 1 | PS2 module | 7 | Fan3 module |
| 2 | PS2 status LED | 8 | Fan3 status LED |
| 3 | PS1 module | 9 | Fan2 module |
| 4 | PS1 status LED | 10 | Fan2 status LED |
| 5 | Fan4 module | 11 | Fan1 module |
| 6 | Fan4 status LED | 12 | Fan1 status LED |
| LED | Description |
|---|---|
| System status | Green: Normal operation |
| Green blinking: The system is powering up. | |
| Amber: Two or more fans (any combination of fan modules or PSU fans) are disconnected, malfunctioning, or incompatible. | |
| Blue/Blinking Blue: The locater function is active. | |
| PSU[1:2] status | Green: Normal operation |
| Red: One of the power supplies has failed or is missing. | |
| Off: No power | |
| Fan status | Green: Fan modules are powered and running at the expected rpm. |
| Amber blinking: One or more fan trays failed. | |
| Status LED on power supply | Green: Input power present - Normal operation |
| Amber: Input power present - Power supply fault. | |
| Off: No input power supply installed in chassis. | |
| Status LED on fan tray | Green: The fan is operating normally. This LED state is exclusive to its fan module and independent of the states of its neighboring fans and power supplies. |
| Red: The fan has failed. | |
| Off: Detects no fan module. If the fan is there, it may not be seated properly. |
| Port | LED | Description |
|---|---|---|
| 1GBase-T
10GBase-T |
Link status | Green: Establishes a valid 1/10GbE network link |
| Amber: The link is disabled. | ||
| Off: Link is down. | ||
| 40GbE QSFP+
100GbE QSFP28 |
Link status | Green: Establishes a valid 40/100GbE network link |
| Amber: The link is disabled. | ||
| Off: Link is down. | ||
| 4X10G QSFP+ breakout
4X25G QSFP28 breakout |
Link status | Green: Establishes a valid 10/25GbE network link |
| Amber: The link is disabled. | ||
| Off: Link is down. | ||
| Management port | Link /Activity | Green: Establishes a valid network link. |
| Green blinking: Network activity in progress. | ||
| Off: Link is down. | ||
| Speed | Green: Establishes a valid 10/100/1000Mb/s network link. | |
| Off: Link is down. |
The Arista 7050X4 are a member of the Arista 7050X series and a key components of the Arista portfolio of data center switches. Given that the 7050X4 series switch runs EOS, for a description of LEDs provided for monitoring environmental and switch port status on the switch, refer to the Quick Start Guide and other related info for the 7050X4 series of switches as follows:
The Arista 7280 Series of fixed and modular switches runs EOS. For a description of LEDs provided for monitoring environmental and switch port status on the switch, refer to the Quick Start Guide and other related info for the 7280 series of switches as follows:
https://www.arista.com/en/qsg-7280-series-1ru-gen3
https://www.arista.com/en/products/7280r3-series
https://www.arista.com/en/products/7280r-series
https://www.arista.com/en/products/7280r-series-network-switch-datasheet
The 7289 and 7800 series modular switches run on EOS. For a description of LEDs provided for monitoring environmental and switch port status on the switch, refer to the Quick Start Guide and other related info for the 7289 and 7800 series of switches as follows:
https://www.arista.com/en/qsg-7368x-series
https://www.arista.com/en/qsg-7800-series
This chapter describes the DMF Recorder Nodes available from Arista Networks.
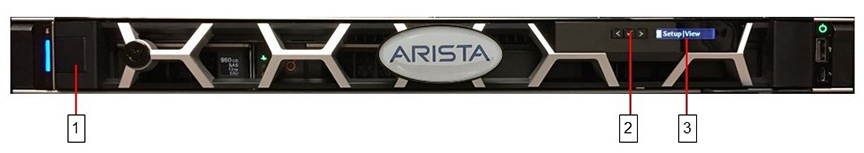
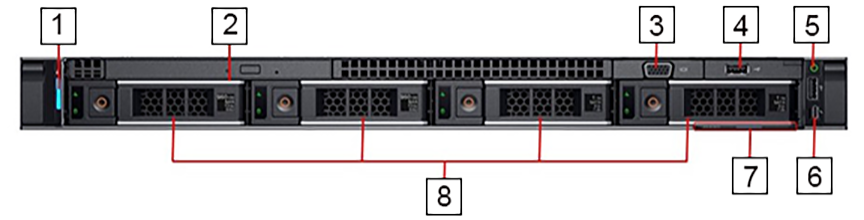
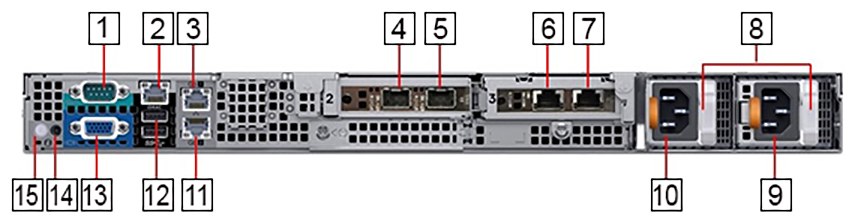
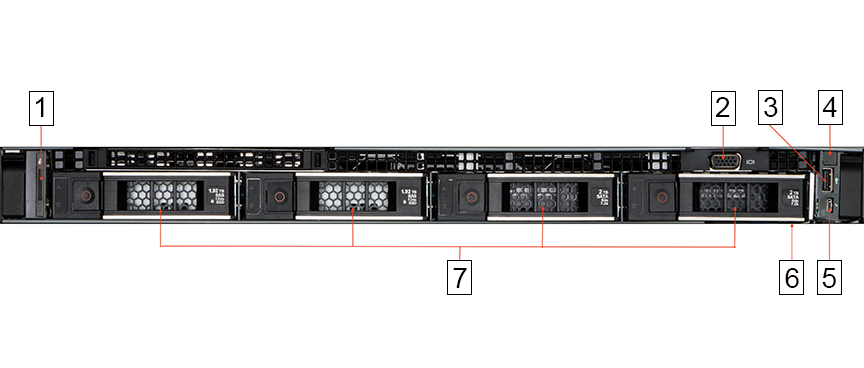
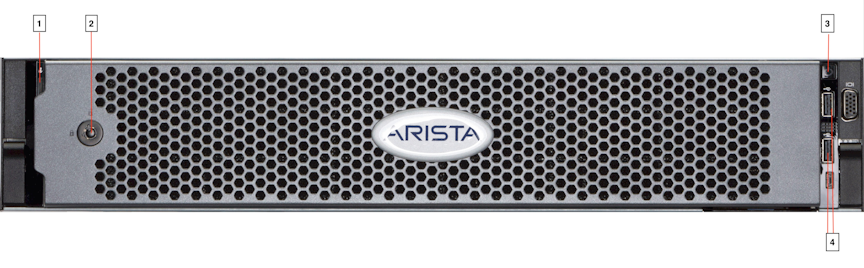
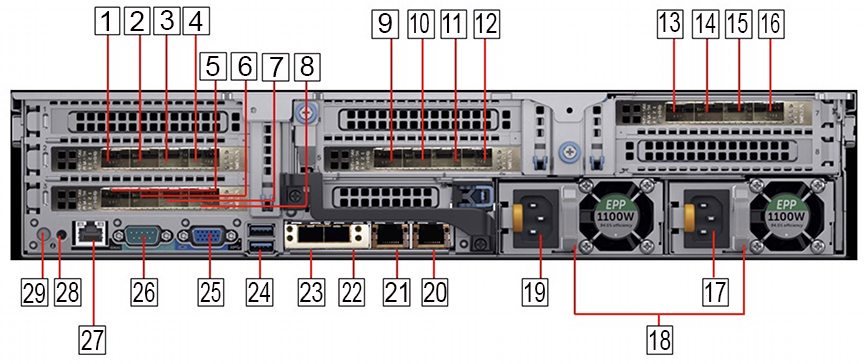
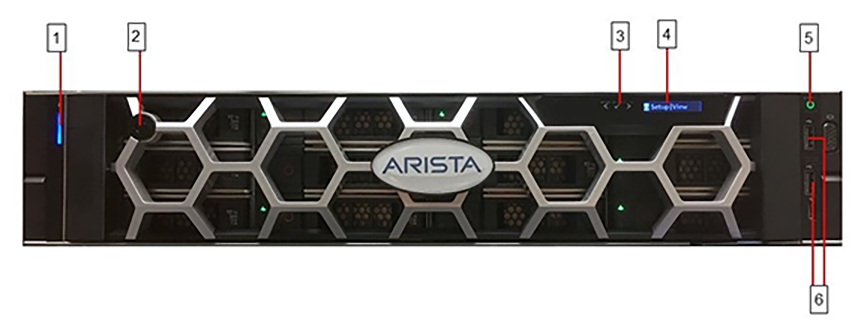
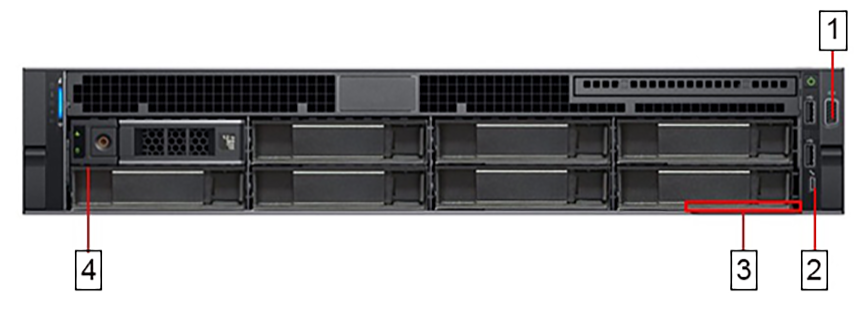
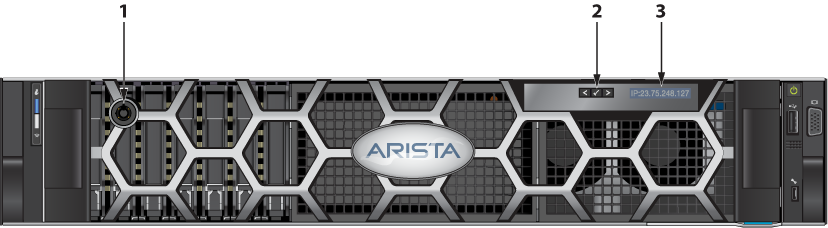
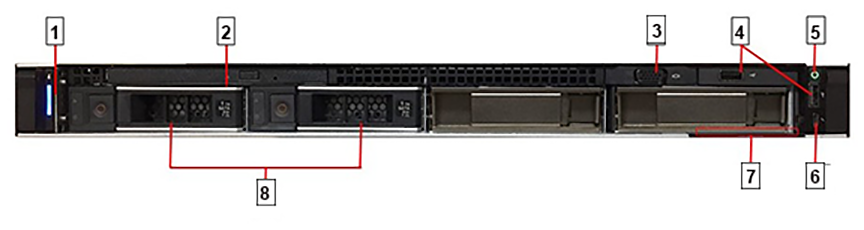
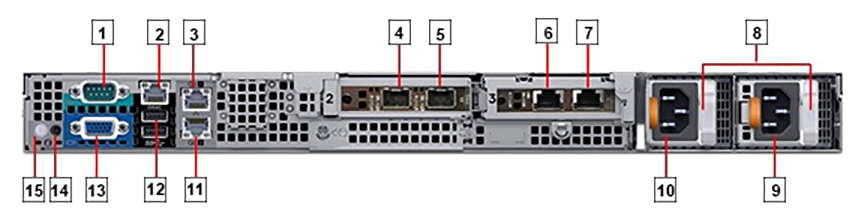
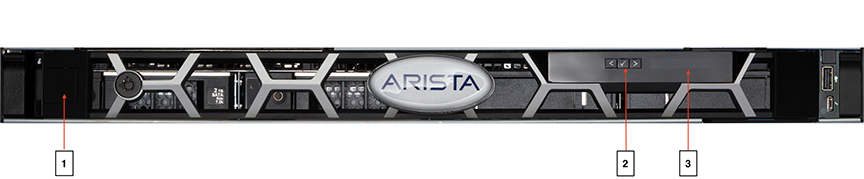
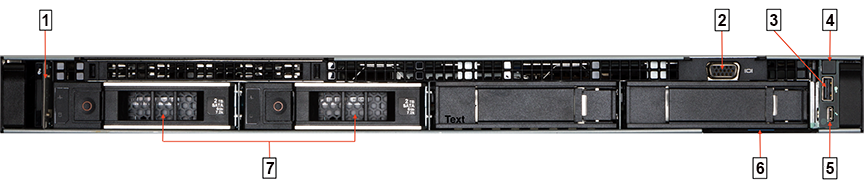
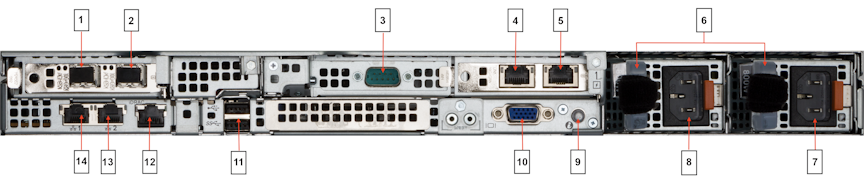
This section describes the LEDs for monitoring environmental and port status on the DMF Recorder Node (DCA-DM-RA3).
| 1 | System identification button / indicator | 4 | LCD panel |
| 2 | Recorder Node security bezel | 5 | Power-on indicator / Power button |
| 3 | LCD menu buttons | 6 | USB port |
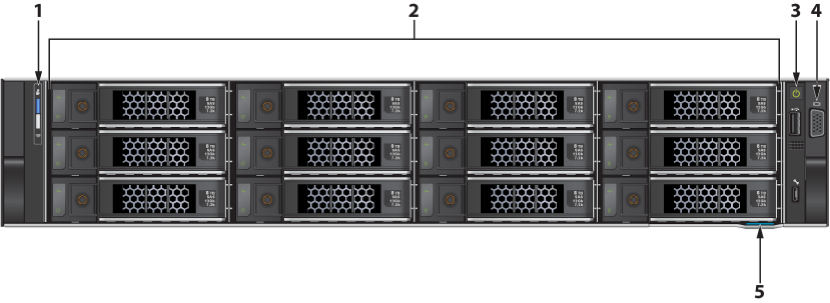
| 1 | Information tag | 3 | Micro USB (not supported) |
| 2 | Video connector | 4 | Hard drives |
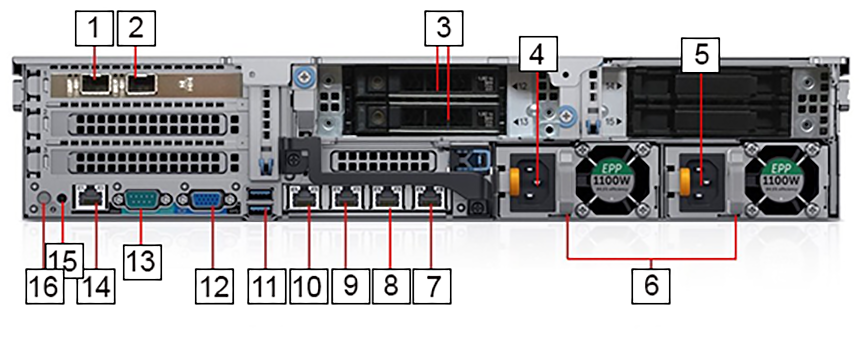
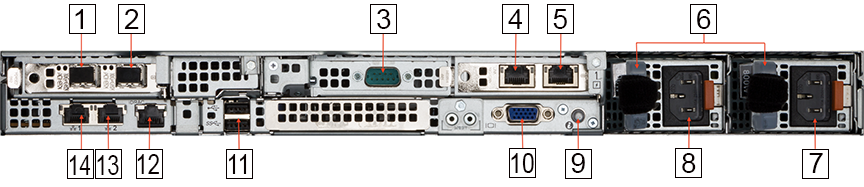
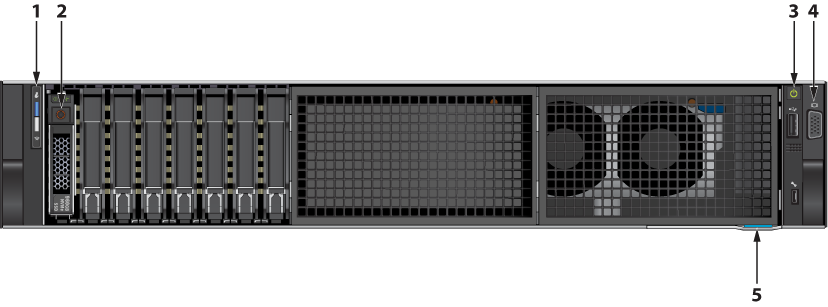
| 1 | Ethernet connector 1 – Not supported | 9 | Ethernet connector 4 – Recorder Node management port 2, backup (10/100/1000Mb/s) |
| 2 | Ethernet connector 2 – 10/25GbE SFP28 Recorder Interface | 10 | Ethernet connector 3 – Recorder Node management port 1, active (10/100/1000Mb/s) |
| 3 | SSD drives | 11 | USB ports |
| 4 | Power supply 1 | 12 | Video connector |
| 5 | Power supply 2 | 13 | Serial connector (default baud rate 115200) |
| 6 | PSU status indicators | 14 | iDRAC Ethernet interface |
| 7 | Ethernet connector 6 – Not supported | 15 | System identification button |
| 8 | Ethernet connector 5 – Not supported | 16 | System identification indicator |
| Indicator, Button, or Connector | Description | |
|---|---|---|
| Power-on indicator | Green: System power is on | |
| Off: System power is off | ||
| System identification indicator in front panel | Off: Normal operating conditions | |
| Blue blinking: Activates system identification | ||
| System identification indicator in rear panel | Blue: Normal operation condition | |
| Blue blinking: Activates system identification | ||
| Amber blinking: Fault detected with error code followed by descriptive text in LCD panel | ||
| 10/100/1000Mbps Ethernet connector 3, 4 | Link indicator | Green: Establishes a valid 1000Mb/s network link |
| Amber: Establishes a valid 10/100Mb/s network link | ||
| Off: Link is down | ||
| Activity indicator | Green blinking: Sends or receives Network data | |
| Off: No link activity | ||
| 10G/25G SFP28 Ethernet connector 2 | Link indicator | Green: Establishes a valid 25G network link |
| Amber: Establishes a valid 10G network link | ||
| Green blinking: Recorder port indicator - detects no transceiveror link is down | ||
| Activity indicator | Green blinking: Sends or receives Network data | |
| Off: No link activity | ||
| Power supply status | Green: The power supply has a valid power source andis operational. | |
| Amber blinking: Indicates a problem with the power supply | ||
| Off: Power is off | ||
| Recorder Node | DCA-DM-RA3 |
|---|---|
| Processor | 2 x Intel Xeon Gold 6248 2.5GHz, 20 cores, 40 threads, 10.4GT/s, 27.5M cache, turbo, HT, 150W, DDR4-2933 |
| Form Factor (H X W X D) | 2-RU Rack server (8.68cm x 43.4cm x 71.6cm) |
| Memory | 16 X 16GB RDIMM, 2933MT/s, dual rank |
| Hard drive | 12 X 12TB 7.2K RPM NLSAS 12Gbps 512e 3.5in hot-plug hard drives
4 X 12TB 7.2K RPM NLSAS 12Gbps 512e 3.5in Internal hard drives 2 X 7.68TB SSD SAS read intensive 12Gb 512e 2.5in Flex Bay drives |
| Networking | Embedded NIC: Intel X550 dual port 10Gb Base-T + I350 dual port 1Gb Base-T rNDC adapter
Network adapter 1: Intel XXV710 dual port 10/25GbE SFP28 PCIe server adapter, full height |
| Power | 2 X Hot-plug power supplies 1100W |
| Additional features | Fan fault tolerance; ECC memory; interactive LCD screen; ENERGY STAR® compliant |
| Environment | Specification |
|---|---|
| Temperature – Continuous | 10°C to 35°C (50°F to 95°F) with no direct sunlight on the equipment |
| Temperature - Storage | -40°C to 65°C (-40°F to 149°F) with a maximum temperature gradation of 20°C per hour |
| Relative humidity – Continuous | 10% to 80% with 29°C (84.2°F) maximum dew point |
| Relative humidity – Storage | 5% to 95% RH with 33°C (91°F) maximum dew point, atmosphere must be non-condensing at all times |
| Altitude – Continuous | 3048m (10,000ft) |
| Altitude – Storage | 12,000m (39,370ft) |
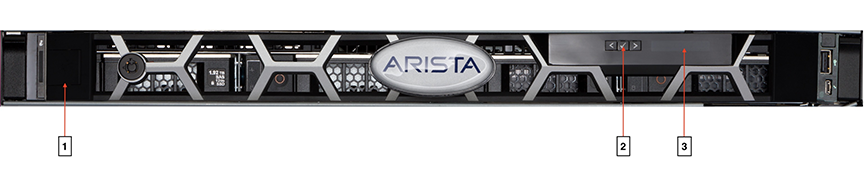
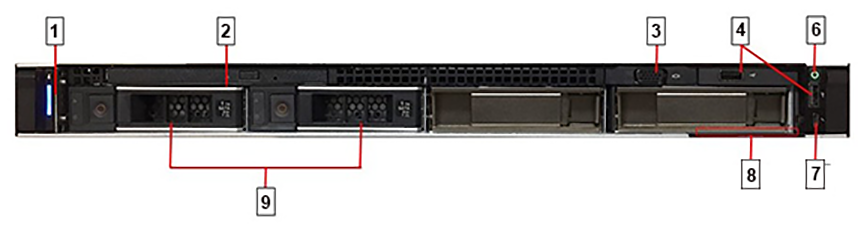
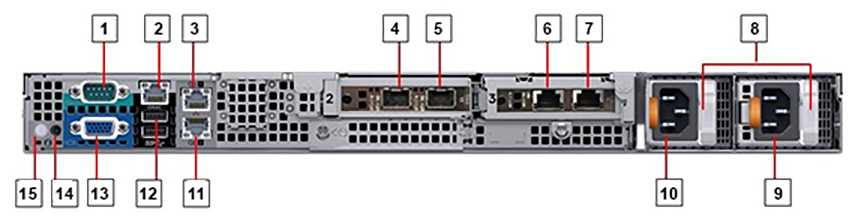
This section describes the LEDs for monitoring environmental and port status on the DMF Recorder Node (DCA-DM-RN760).
| 1 | Recorder Node security bezel | 3 | LCD panel |
| 2 | LCD menu button |
| 1 | System identification button / indicator | 4 | Video connector |
| 2 | Hard drives | 5 | Information tag |
| 3 | Power Button |
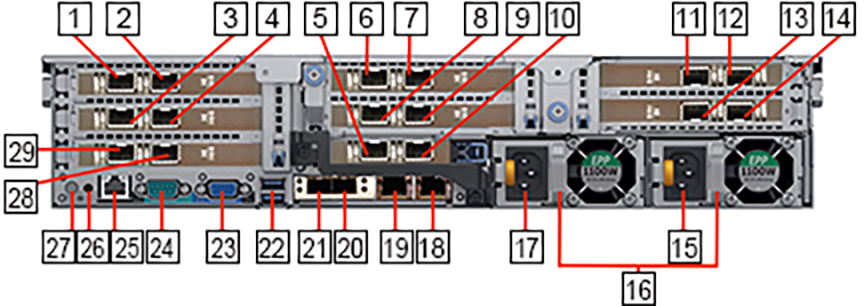
| 1 | Serial Connector | 7 | Video connector |
| 2 | System identification indicator | 8 | 10/25GbE SFP28 Recorder Interfaces |
| 3 | NVMe drives | 9 | USB ports |
| 4 | SSD drives | 10 | iDRAC Connector |
| 5 | Power supply 2 | 11 | Ethernet connectors 1, 2 – Recorder Node management port, active (10/100/1000Mb/s) |
| 6 | Power supply 1 |
| Indicator, Button, or Connector | Description | |
|---|---|---|
| Power-on indicator | Green: System power is on | |
| Off: System power is off | ||
| System identification indicator in front panel | Off: Normal operating conditions | |
| Blue blinking: Activates system identification | ||
| System identification indicator in rear panel | Blue: Normal operation condition | |
| Blue blinking: Activates system identification | ||
| Amber blinking: Fault detected with error code followed by descriptive text in LCD panel | ||
| 10/100/1000Mbps Ethernet connector 3, 4 | Link indicator | Green: Establishes a valid 1000Mb/s network link |
| Amber: Establishes a valid 10/100Mb/s network link | ||
| Off: Link is down | ||
| Activity indicator | Green blinking: Sends or receives Network data | |
| Off: No link activity | ||
| 10G/25G SFP28 Ethernet connector 2 | Link indicator | Green: Establishes a valid 25G network link |
| Amber: Establishes a valid 10G network link | ||
| Green blinking: Recorder port indicator - detects no transceiveror link is down | ||
| Activity indicator | Green blinking: Sends or receives Network data | |
| Off: No link activity | ||
| Power supply status | Green: The power supply has a valid power source andis operational. | |
| Amber blinking: Indicates a problem with the power supply | ||
| Off: Power is off | ||
| Recorder Node | DCA-DM-RN760 |
|---|---|
| Processor | 2 x Intel Xeon Gold 6442Y 2.6GHz, 24 cores, 48 threads, 16GT/s, 60M cache, turbo, HT, 225W, DDR5-4800 |
| Form Factor (H X W X D) | 2-RU Rack server (86.8cm x 43.40cm x 68.58cm) |
| Memory | 8 X 16GB RDIMM, 5600MT/s, single rank |
| Hard drive | 12 X 8TB 7.2K SAS ISE 12Gbps 512e 3.5in hot-plug AG drives
2 X 1.92TB SSD vSAS read intensive, 12Gbps 512e 2.5in Flex Bay AG drives SED 1DWPD 2 X 480GB NVMe Drive |
| Networking | Embedded NIC: Broadcom 5720 Dual Port 1Gb On-Board LOM adapter
Network adapter 1: Intel E810-XXV dual port 10/25GbE, SFP28, OCP NIC 3.0 adapter iDRAC9, Enterprise 16G |
| Power | Dual, Redundant(1+1), Hot-Plug Power Supply,1100MM (100-240Vac) Titanium |
| Additional features | Fan fault tolerance; ECC memory; interactive LCD screen; ENERGY STAR® compliant |
| Environment | Specification |
|---|---|
| Temperature – Continuous | 10°C to 35°C (50°F to 95°F) with no direct sunlight on the equipment |
| Temperature - Storage | -40°C to 65°C (-40°F to 149°F) with a maximum temperature gradation of 20°C per hour |
| Relative humidity – Continuous | 10% to 80% with 29°C (84.2°F) maximum dew point |
| Relative humidity – Storage | 5% to 95% RH with 33°C (91°F) maximum dew point, atmosphere must be non-condensing at all times |
| Altitude – Continuous | 3048m (10,000ft) |
| Altitude – Storage | 12,000m (39,370ft) |
This chapter describes the Arista Analytics Nodes available from Arista Networks.
This section describes the LEDs for monitoring environmental and port status on the Arista Analytics Node (DCA-DM-AA3).
| 1 | Analytics Node security bezel |
| 2 | LCD menu buttons |
| 3 | LCD panel |
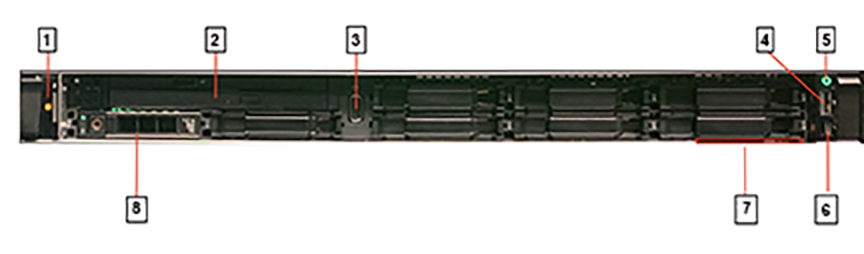
| 1 | System identification button / indicator | 5 | Power-on indicator / Power button |
| 2 | Optical drive | 6 | Micro USB (not supported) |
| 3 | Video connector | 7 | Information tag |
| 4 | USB ports | 8 | Hard drives |
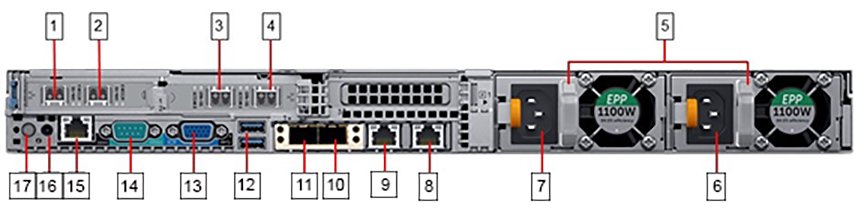
| 1 | Serial connector (default baud rate 115200) | 9 | Power supply 2 |
| 2 | iDRAC Ethernet interface | 10 | Power supply 1 |
| 3 | Ethernet connector 1 – Analytics Node management port 1, active (10/100/1000Mb/s) | 11 | Ethernet connector 2 – Analytics Node management port 2, backup (10/100/1000Mb/s) |
| 4 | Ethernet connector 3 – Analytics Node 10GbE SFP+ Collector Interface 1, active | 12 | USB ports |
| 5 | Ethernet connector 4 – Analytics Node 10GbE SFP+ Collector Interface 2, backup | 13 | Video connector |
| 6 | Ethernet connector 5 – Not supported | 14 | System identification button |
| 7 | Ethernet connector 6 – Not supported | 15 | System identification indicator |
| 8 | PSU status indicators |
| Indicator, Button, or Connector | Description | |
|---|---|---|
| Power-on indicator | Green: System power is on | |
| Off: System power is off | ||
| System identification indicator in front panel | Off: Normal operating conditions | |
| Blue blinking: Activates system identification | ||
| System identification indicator in rear panel | Blue: Normal operation condition | |
| Blue blinking: Activates system identification | ||
| Amber blinking: Fault detected with error code followed by descriptive text in LCD panel | ||
| 10/100/1000Mbps Ethernet connector 1, 2 | Link indicator | Green: Establishes a valid 1000Mb/s network link |
| Amber: Establishes a valid 10/100Mb/s network link | ||
| Off: Link is down | ||
| Activity indicator | Green blinking: Sends or receives Network data | |
| Off: No link activity | ||
| 10G SFP+ Ethernet connector 3, 4 | Link indicator | Green: Establishes a valid 10G network link |
| Off: Link is down | ||
| Activity indicator | Green blinking: Sends or receives Network data | |
| Off: No link activity | ||
| Power supply status | Green: The power supply has a valid power source andis operational. | |
| Amber blinking: Indicates a problem with the power supply | ||
| Off: Power is off | ||
| Analytics Node | DCA-DM-AA3 |
|---|---|
| Processor | 2 x Intel Xeon Silver 4114 2.20GHz, 10 cores, 20 threads, 9.6GT/s 2UPI, 14M cache, turbo, HT, 85W, DDR4-2400 |
| Form Factor (H X W X D) | 1-RU Rack server (4.28cm x 43.4cm x 69.3cm) |
| Memory | 8 X 16GB RDIMM, 2666MT/s |
| Hard drive | 2 X 960GB SSD SAS hot-plug drive
2 X 1TB 7.2K RPM SATA 6Gbps 3.5in hot-plug hard drives; no RAID, PERC H330+ |
| Networking | Embedded NIC: 2 X 1GbE LOM
Network adapter 1: Intel X710 dual port 10Gb DA/SFP+ server adapter Network adapter 2: Intel X550 dual port 10Gb Base-T server adapter |
| Power | 2 X Hot-plug power supplies 550W |
| Additional features | Fan fault tolerance; ECC memory; interactive LCD screen; ENERGY STAR® compliant |
| Environment | Specification |
|---|---|
| Temperature – Continuous | 5°C to 40°C (41°F to 104°F) with no direct sunlight on the equipment |
| Temperature - Storage | -40°C to 65°C (-40°F to 149°F) with a maximum temperature gradation of 20°C per hour |
| Relative humidity – Continuous | 5% to 85% with 29°C (84.2°F) maximum dew point |
| Relative humidity – Storage | 5% to 95% at a maximum wet bulb temperature of 33°C (91°F), atmosphere must be non-condensing at all times |
| Altitude – Continuous | 3048m (10,000ft) |
| Altitude – Storage | 12,000m (39,370ft) |
This section describes the LEDs or monitoring environmental and port status on the Arista Analytics Node (DCA-DM- AN450).
| 1 | Controller Node security bezel |
| 2 | LCD menu buttons |
| 3 | LCD panel |
| 1 | System identification button / indicator | 5 | Micro USB (not supported) |
| 2 | Video connector | 6 | Information tag |
| 3 | USB ports | 7 | Hard drives |
| 4 | Power-on indicator / Power button |
| 1 | Ethernet connector 3 – Analytics Node 10GbE SFP+ Collector Interface 1, active | 8 | Power supply 1 |
| 2 | Ethernet connector 4 – Analytics Node 10GbE SFP+ Collector Interface 2, backup | 9 | System identification indicator/button |
| 3 | Serial connector (default baud rate 115200) | 10 | Video connector |
| 4 | Ethernet connector 5 – Not supported | 11 | USB ports |
| 5 | Ethernet connector 6 – Not supported | 12 | iDRAC Ethernet interface |
| 6 | PSU status indicators | 13 | Ethernet connector 2 – Analytics Node management port 2 (10/100/1000Mb/s) |
| 7 | Power supply 2 | 14 | Ethernet connector 1 – Analytics Node management port 1 (10/100/1000Mb/s) |
| Indicator, Button, or Connector | Description | |
|---|---|---|
| Power-on indicator | Green: System power is on | |
| Off: System power is off | ||
| System identification indicator in front panel | Off: Normal operating conditions | |
| Blue blinking: Activates system identification | ||
| System identification indicator in rear panel | Blue: Normal operation condition | |
| Blue blinking: Activates system identification | ||
| Amber blinking: Fault detected with error code followed by descriptive text in LCD panel | ||
| 10/100/1000Mbps Ethernet connector 1, 2 | Link indicator | Green: Establishes a valid 1000Mb/s network link |
| Amber: Establishes a valid 10/100Mb/s network link | ||
| Off: Link is down | ||
| Activity indicator | Green blinking: Sends or receives Network data | |
| Off: No link activity | ||
| 10G SFP+ Ethernet connector 4 | Link indicator | Green: Establishes a valid 10G network link |
| Off: Link is down | ||
| Activity indicator | Green blinking: Sends or receives Network data | |
| Off: No link activity | ||
| Power supply status | Green: The power supply has a valid power source andis operational. | |
| Amber blinking: Indicates a problem with the power supply | ||
| Off: Power is off | ||
| Analytics Node | DCA-DM-AN450 |
|---|---|
| Processor | 2 x Intel Xeon Silver 4310 2.10GHz, 12 cores, 24 threads, 10.4GT/s 2UPI, 18M cache, turbo, HT, 120W, DDR4-2666 |
| Form Factor (H X W X D) | 1-RU Rack server (4.28cm x 43.4cm x 69.3cm) |
| Memory | 8 X 16GB RDIMM, 3200MT/s |
| Hard drive | 2 X 1.92TB SSD vSAS mixed use 12Gbps 3.5in; AG drive SED, 3DWPD
2 X 2TB 7.2K RPM SATA 6Gbps 3.5in hot-plug hard drives; No RAID, PERC H355 |
| Networking | Embedded NIC: 2 X 1GbE LOM (BCM5720)
Network adapter 1: Intel X710 dual port 10Gb SFP+ adapter Network adapter 2: Intel X710-T2L dual port 10Gb Base-T adapter |
| Power | 2 X Hot-plug power supplies 800W |
| Additional features | Fan fault tolerance; ECC memory; interactive LCD screen; ENERGY STAR® compliant |
| Environment | Specification |
|---|---|
| Temperature – Continuous | 5°C to 40°C (41°F to 104°F) with no direct sunlight on the equipment |
| Temperature - Storage | -40°C to 65°C (-40°F to 149°F) with a maximum temperature gradation of 20°C per hour |
| Relative humidity – Continuous | 5% to 85% with 29°C (84.2°F) maximum dew point |
| Relative humidity – Storage | 5% to 95% at a maximum wet bulb temperature of 33°C (91°F), atmosphere must be non-condensing at all times |
| Altitude – Continuous | 3048m (10,000ft) |
| Altitude – Storage | 12,000m (39,370ft) |
This chapter describes the DMF Service Nodes available from Arista Networks.
This section describes the LEDs for monitoring environmental and port status on the DMF Service Node (DCA-DM-SC 960GB and1.2TB, DCA-DM-SC2, 960GB, currently shipped appliances will have 960GB SSD).

| 1 | Controller Node security bezel |
| 2 | LCD menu buttons |
| 3 | LCD panel |
| 1 | System identification button / indicator | 5 | Power-on indicator / Power button |
| 2 | Optical drive | 6 | Micro USB (not supported) |
| 3 | Video connector | 7 | Information tag |
| 4 | USB ports | 8 | Hard drive |
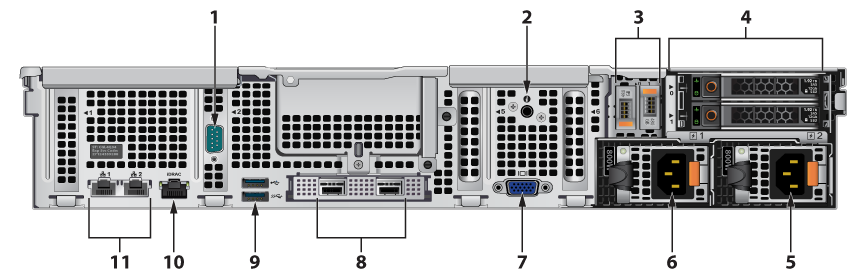
| 1 | Ethernet connector 5 – 10GbE SFP+ Service interfaces SNI1 | 10 | Ethernet connector 2 – Not supported |
| 2 | Ethernet connector 6 – 10GbE SFP+ Service interfaces SNI2 | 11 | Ethernet connector 1 – Not supported |
| 3 | Ethernet connector 7 – 10GbE SFP+ Service interfaces SNI4 | 12 | USB ports |
| 4 | Ethernet connector 8 – 10GbE SFP+ Service interfaces SNI3 | 13 | Video connector |
| 5 | PSU status indicators | 14 | Serial connector (default baud rate 115200) |
| 6 | Power supply 2 | 15 | iDRAC Ethernet interface |
| 7 | Power supply 1 | 16 | System identification button |
| 8 | Ethernet connector 4 – Service Node management port 2 (10/100/1000Mb/s) | 17 | System identification indicator |
| 9 | Ethernet connector 3 – Service Node management port 1 (10/100/1000Mb/s) |
The DMF Service Node (DCA-DM-SDL/DCA-DM-SDL2) is an enterprise-class, 2-socket, 2RU rack-mount hardware appliance designed for high density, performance, redundancy, and value. It has 16 SNIs.
| 1 | System identification button / indicator | 3 | Power-on indicator / Power button |
| 2 | Service Node security bezel | 4 | USB ports |
| 1 | Front video connector | 3 | Information tag |
| 2 | Micro USB (not supported) | 4 | Hard drive |
| 1 | System identification button / indicator | 4 | LCD panel |
| 2 | Service Node security bezel | 5 | Power-on indicator / Power button |
| 3 | LCD menu buttons | 6 | USB ports |
| 1 | Front video connector | 3 | Information tag |
| 2 | Micro USB (not supported) | 4 | Hard drive |
| 1 | Service interfaces SNI8 | 16 | Service interfaces SNI16 |
| 2 | Service interfaces SNI7 | 17 | Power supply 2 |
| 3 | Service interfaces SNI6 | 18 | PSU status indicator |
| 4 | Service interfaces SNI5 | 19 | Power supply 1 |
| 5 | Service interfaces SNI4 | 20 | Ethernet connector 4 – Service Node management port 2 (10/100/1000Mb/s) |
| 6 | Service interfaces SNI3 | 21 | Ethernet connector 3 – Service Node management port 1 (10/100/1000Mb/s) |
| 7 | Service interfaces SNI2 | 22 | Ethernet connector 2 – Not supported |
| 8 | Service interfaces SNI1 | 23 | Ethernet connector 1 – Not supported |
| 9 | Service interfaces SNI12 | 24 | USB ports |
| 10 | Service interfaces SNI11 | 25 | Rear video connector |
| 11 | Service interfaces SNI10 | 26 | Serial connector (default baud rate 115200) |
| 12 | Service interfaces SNI9 | 27 | iDRAC Ethernet interface |
| 13 | Service interfaces SNI13 | 28 | System identification button |
| 14 | Service interfaces SNI14 | 29 | System identification indicator |
| 15 | Service interfaces SNI15 |
| 1 | Service interfaces SNI4 | 16 | PSU status indicator |
| 2 | Service interfaces SNI3 | 17 | Power supply 1 |
| 3 | Service interfaces SNI8 | 18 | Ethernet connector 4 – Service Node management port 2 (10/100/1000Mb/s) |
| 4 | Service interfaces SNI7 | 19 | Ethernet connector 3 – Service Node management port 1 (10/100/1000Mb/s) |
| 5 | Service interfaces SNI2 | 20 | Ethernet connector 2 – Not supported |
| 6 | Service interfaces SNI14 | 21 | Ethernet connector 1 – Not supported |
| 7 | Service interfaces SNI13 | 22 | USB ports |
| 8 | Service interfaces SNI10 | 23 | Rear video connector |
| 9 | Service interfaces SNI9 | 24 | Serial connector (default baud rate 115200) |
| 10 | Service interfaces SNI1 | 25 | iDRAC Ethernet interface |
| 11 | Service interfaces SNI11 | 26 | System identification button |
| 12 | Service interfaces SNI12 | 27 | System identification indicator |
| 13 | Service interfaces SNI15 | 28 | Service interfaces SNI5 |
| 14 | Service interfaces SNI16 | 29 | Service interfaces SNI6 |
| 15 | Power supply 2 |
This section describes the LEDs for monitoring environmental and port status on the DMF Service Node (DCA-DM-SEL 960GB and 1.2TB, currently shipped appliances will have 960GB SSD).
| 1 | System identification button / indicator | 3 | Power-on indicator / Power button |
| 2 | Service Node security bezel | 4 | USB ports |
| 1 | Front video connector | 3 | Information tag |
| 2 | Micro USB (not supported) | 4 | Hard drive |
| 1 | System identification button / indicator | 4 | LCD panel |
| 2 | Service Node security bezel | 5 | Power-on indicator / Power button |
| 3 | LCD menu buttons | 6 | USB ports |
| 1 | Front video connector | 3 | Micro USB (not supported) |
| 2 | Micro USB (not supported) | 4 | Hard drive |
| 1 | Service interfaces SNI4 | 16 | PSU status indicator |
| 2 | Service interfaces SNI3 | 17 | Power supply 1 |
| 3 | Service interfaces SNI8 | 18 | Ethernet connector 4 – Service Node management port 2 (10/100/1000Mb/s) |
| 4 | Service interfaces SNI7 | 19 | Ethernet connector 3 – Service Node management port 1 (10/100/1000Mb/s) |
| 5 | Service interfaces SNI2 | 20 | Ethernet connector 2 – Not supported |
| 6 | Service interfaces SNI14 | 21 | Ethernet connector 1 – Not supported |
| 7 | Service interfaces SNI13 | 22 | USB ports |
| 8 | Service interfaces SNI10 | 23 | Rear video connector |
| 9 | Service interfaces SNI9 | 24 | Serial connector (default baud rate 115200) |
| 10 | Service interfaces SNI1 | 25 | iDRAC Ethernet interface |
| 11 | Service interfaces SNI11 | 26 | System identification button |
| 12 | Service interfaces SNI12 | 27 | System identification indicator |
| 13 | Service interfaces SNI15 | 28 | Service interfaces SNI5 |
| 14 | Service interfaces SNI16 | 29 | Service interfaces SNI6 |
| 15 | Power supply 2 |
This section describes the LEDs for monitoring environmental and port status on the DMF Service Node (DCA-DM-SN760L.
| 1 | Service Node security bezel | 3 | LCD panel |
| 2 | LCD menu buttons |
| 1 | System identification button / indicator | 4 | Video connector |
| 2 | SSD drive | 5 | Information tag |
| 3 | Power button |
| 1 | 100GbE SFP28 Service interface SNI1, 100GbE SFP28 Service interface SNI2 | 6 | iDRAC Connector |
| 2 | Serial connector | 7 | iDRAC Indicator |
| 3 | Power supply 2 | 8 | 100GbE SFP28 Service interface SNI3, 100GbE SFP28 Service interface SNI4 |
| 4 | Video connector | 9 | Ethernet connectors 1,2 – Service Node management port (10/100/1000Mb/s) |
| 5 | USB ports | 10 | Power supply 1 |
| Indicator, Button, or Connector | Description | |
|---|---|---|
| Power-on indicator | Green: System power is on | |
| Off: System power is off | ||
| LED panel | Blue background: Normal operating conditions | |
| Amber background: Fault detected with error code followed by descriptive text | ||
| System identification indicator in front panel | Off: Normal operating conditions | |
| Blue blinking: Activates system identification | ||
| System identification indicator in rear panel | Blue: Normal operation condition | |
| Blue blinking: Activates system identification | ||
| Amber blinking: Fault detected with error code followed by descriptive text in LCD panel | ||
| 10/100/1000Mbps Ethernet connector 1, 2 | Link indicator | Green: Establishes a valid 1000Mb/s network link |
| Amber: Establishes a valid 10/100Mb/s network link | ||
| Off: Link is down | ||
| Activity indicator | Green blinking: Sends or receives Network data | |
| Off: No link activity | ||
| 100G SFP28 Service node Ethernet connectors | Link indicator | Green: Establishes a valid 100G network link |
| Off: Link is down | ||
| Activity indicator | Green blinking: Sends or receives Network data | |
| Off: No link activity | ||
| Power supply status | Green: The power supply has a valid power source andis operational. | |
| Amber blinking: Indicates a problem with the power supply | ||
| Off: Power is off | ||
| Service Node | DCA-DM-SN760L with 960GB NVMe Drive |
|---|---|
| Processor | 2 X Intel Xeon Platinum 8452Y 2GHz, 67.5M cache, 16GT/s, turbo, HT, 36C/72T, 300W, DDR5-4800, OEM XL |
| Form Factor (H X W X D) | 2U Rack server (86.80cm x 43.40cm x 73.75cm) |
| Memory | 16 X 32GB RDIMM, 5600MT/s, dual rank |
| Hard drive | 960GB Data Center NVMe Read Intensive AG Drive U2 Gen4 with carrier |
| Networking | Embedded NIC: Broadcom 5720 Dual Port 1GbE Optional LOM No OCP 3.0 mezzanine
Network adapter: 2 X Intel E810-2CQDA2 dual port 100GbE QSFP28 PCIe adapters iDRAC9, Enterprise 16G |
| Power | Dual, hot-plug, redundant power supplies (1+1) 1400W 2U |
| Additional features | Fan fault tolerance; ECC memory; interactive LCD screen; ENERGY STAR® compliant |
| Environment | Specification |
|---|---|
| Temperature – Continuous | 10°C to 35°C (50°F to 95°F) with no direct sunlight on the equipment |
| Temperature - Storage | -40°C to 65°C (-40°F to 149°F) with a maximum temperature gradation of 20°C per hour |
| Relative humidity – Continuous | 10% to 80% with 29°C (84.2°F) maximum dew point |
| Relative humidity – Storage | 5% to 95% relative humidity with 33°C (91°F) maximum dew point, atmosphere must be non-condensing at all times |
| Altitude – Continuous | 3048m (10,000ft) |
| Altitude – Storage | 12,000m (39,370ft) |
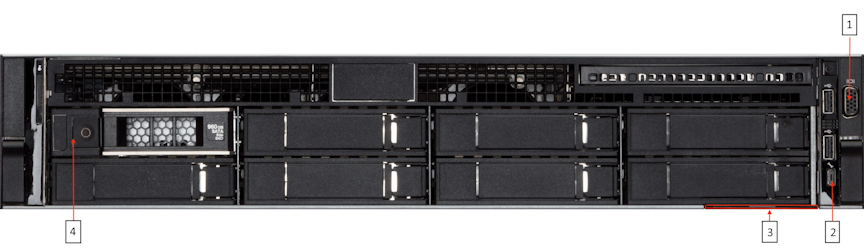
This section describes the LEDs for monitoring environmental and port status on the DMF Service Node (DCA-DM-SNR660 (4 X 8TB Hard Drives).
| 1 | Security bezel | 2 | LCD Menu button |
| 1 | System identification button / indicator | 4 | Information tag |
| 2 | Video connector | 5 | Hard drives |
| 3 | Power Button |
| 1 | 10/25GbE SFP28 Service interface SNI1, 10/25GbE SFP28 Service interface SNI2 | 6 | Video Connector |
| 2 | SSD Drives | 7 | 10/25GbE SFP28 Service interface SNI3, 10/25GbE SFP28 Service interface SNI4 |
| 3 | Power supply 1 | 8 | USB ports |
| 4 | Power supply 2 | 9 | iDRAC Connector |
| 5 | System identification indicator | 10 | Ethernet connectors 1, 2 – Service Node Management port (10/100/1000Mb/s) |
| Indicator, Button, or Connector | Description | |
|---|---|---|
| Power-on indicator | Green: System power is on | |
| Off: System power is off | ||
| LED panel | Blue background: Normal operating conditions | |
| Amber background: Fault detected with error code followed by descriptive text | ||
| System identification indicator in front panel | Off: Normal operating conditions | |
| Blue blinking: Activates system identification | ||
| System identification indicator in rear panel | Blue: Normal operation condition | |
| Blue blinking: Activates system identification | ||
| Amber blinking: Fault detected with error code followed by descriptive text in LCD panel | ||
| 10/100/1000Mbps Ethernet connector 1, 2 | Link indicator | Green: Establishes a valid 1000Mb/s network link |
| Amber: Establishes a valid 10/100Mb/s network link | ||
| Off: Link is down | ||
| Activity indicator | Green blinking: Sends or receives Network data | |
| Off: No link activity | ||
| 10/25G SFP28 Service node Ethernet connectors | Link indicator | Green: Establishes a valid 10/25G network link |
| Off: Link is down | ||
| Activity indicator | Green blinking: Sends or receives Network data | |
| Off: No link activity | ||
| Power supply status | Green: The power supply has a valid power source andis operational. | |
| Amber blinking: Indicates a problem with the power supply | ||
| Off: Power is off | ||
| Service Node | DCA-DM-SNR660 |
|---|---|
| Processor | 1 X Intel Xeon Gold 5418Y 2GHz, 45M cache, 16GT/s, turbo, HT, 24C/48T, 185W, DDR5-4400, OEM XL |
| Form Factor (H X W X D) | 1RU Rack server (42.80cm x 43.40cm x 71.30cm) |
| Memory | 8 X 16GB RDIMM, 5600MT/s, single rank |
| Hard drive | 2X 960GB SSD SATA Mix Use 6Gbps 512 2.5in Flex Bay AG Drive, 3 DWPD
4X 8TB Hard Drive SAS ISE 12Gbps 7.2K 512e 3.5in Hot-Plug, AGDrive 1 X 480GB NVMe Drive |
| Networking | Embedded NIC: Intel E810-XXV dual port 10/25GbE SFP28 OCP 3.0 mezzanine Daughter card
Network adapter: Intel E810-XXV dual port 10/25GbE SFP28 PCIe adapters iDRAC9, Enterprise 16G |
| Power | Dual, hot-plug, redundant power supplies (1+1) 1100W MM (100-240Vac) Titanium |
| Additional features | Fan fault tolerance; ECC memory; interactive LCD screen; ENERGY STAR® compliant |
| Environment | Specification |
|---|---|
| Temperature – Continuous | 10°C to 35°C (50°F to 95°F) with no direct sunlight on the equipment |
| Temperature - Storage | -40°C to 65°C (-40°F to 149°F) with a maximum temperature gradation of 20°C per hour |
| Relative humidity – Continuous | 10% to 80% with 29°C (84.2°F) maximum dew point |
| Relative humidity – Storage | 5% to 95% relative humidity with 33°C (91°F) maximum dew point, atmosphere must be non-condensing at all times |
| Altitude – Continuous | 3048m (10,000ft) |
| Altitude – Storage | 12,000m (39,370ft) |
This chapter describes the DMF Controller Nodes available from Arista Networks.
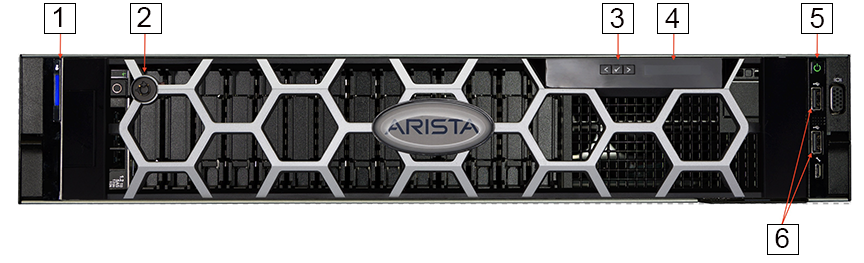
This section describes the LEDs for monitoring environmental and port status on the DMF Controller Node (DCA-DM-CDL).
The DMF Controller Node (DCA-DM-CDL) is an enterprise-class, 2-socket, 1-RU rack-mounted hardware appliance designed to deliver the right combination of performance, redundancy, and value in a high-density chassis.

| 1 | Controller Node security bezel |
| 2 | LCD menu buttons |
| 3 | LCD panel |
| 1 | System identification button / indicator | 5 | Power-on indicator / Power button |
| 2 | Optical drive | 6 | Micro USB (not supported) |
| 3 | Video connector | 7 | Information tag |
| 4 | USB ports | 8 | Hard drives |
| 1 | Serial connector (default baud rate 115200) | 9 | Power supply 2 |
| 2 | iDRAC Ethernet interface | 10 | Power supply 1 |
| 3 | Ethernet connector 1 – Controller Node management port 1 (10/100/1000Mb/s) | 11 | Ethernet connector 2 – Controller Node management port 2 (10/100/1000Mb/s) |
| 4 | Ethernet connector 3 – Not supported | 12 | USB ports |
| 5 | Ethernet connector 4 – 10GbE SFP+ packet capture port | 13 | Video connector |
| 6 | Ethernet connector 5 – Not supported | 14 | System identification button |
| 7 | Ethernet connector 6 – Not supported | 15 | System identification indicator |
| 8 | PSU status indicators |
This section describes the LEDs for monitoring environmental and port status on the DMF Controller Node (DCA-DM- CDL(HWDL2)).
The DMF Controller Node (DCA-DM-CDL(HWDL2)) is an enterprise-class, 2-socket, 1-RU rack-mounted hardware appliance designed to deliver the right combination of performance, redundancy, and value in a high-density chassis.

| 1 | Controller Node security bezel |
| 2 | LCD menu buttons |
| 3 | LCD panel |
| 1 | System identification button / indicator | 5 | Power-on indicator / Power button |
| 2 | Optical drive | 6 | Micro USB (not supported) |
| 3 | Video connector | 7 | Information tag |
| 4 | USB ports | 8 | Hard drives |
| 1 | Serial connector (default baud rate 115200) | 9 | Power supply 2 |
| 2 | iDRAC Ethernet interface | 10 | Power supply 1 |
| 3 | Ethernet connector 1 – Controller Node management port 1 (10/100/1000Mb/s) | 11 | Ethernet connector 2 – Controller Node management port 2 (10/100/1000Mb/s) |
| 4 | Ethernet connector 3 – Not supported | 12 | USB ports |
| 5 | Ethernet connector 4 – 10GbE SFP+ packet capture port | 13 | Video connector |
| 6 | Ethernet connector 5 – Not supported | 14 | System identification button |
| 7 | Ethernet connector 6 – Not supported | 15 | System identification indicator |
| 8 | PSU status indicators |
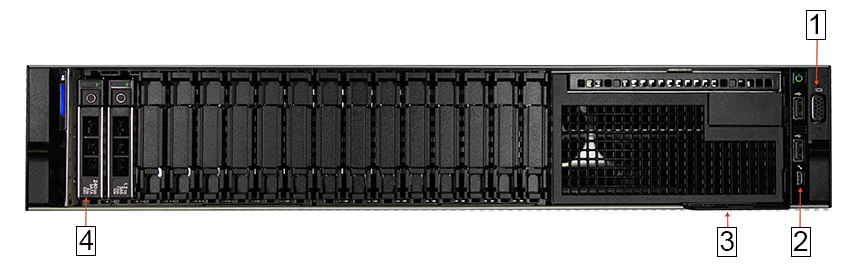
This section describes the LEDs for monitoring environmental and port status on the DMF Controller Node (DCA-DM-C450).
The DMF Controller Node (DCA-DM-C450) is an enterprise-class, 2-socket, 1-RU rack-mounted hardware appliance designed to deliver the right combination of performance, redundancy, and value in a high-density chassis.
| 1 | Controller Node security bezel |
| 2 | LCD menu buttons |
| 3 | LCD panel |
| 1 | System identification button / indicator | 5 | Micro USB (not supported) |
| 2 | Video connector | 6 | Information tag |
| 3 | USB ports | 7 | Hard drives |
| 4 | Power-on indicator / Power button |
| 1 | Ethernet connector 3 – Not supported | 8 | Power supply 1 |
| 2 | Ethernet connector 4 – 10GbE SFP+ packet capture port | 9 | System identification indicator/button |
| 3 | Serial connector (default baud rate 115200) | 10 | Video connector |
| 4 | Ethernet connector 5 – Not supported | 11 | USB ports |
| 5 | Ethernet connector 6 – Not supported | 12 | iDRAC Ethernet interface |
| 6 | PSU status indicators | 13 | Ethernet connector 2 – Controller Node management port 2 (10/100/1000Mb/s) |
| 7 | Power supply 2 | 14 | Ethernet connector 1 – Controller Node management port 1 (10/100/1000Mb/s) |
www.arista.com
DANZ Monitoring Fabric Hardware Guide
DOC-07578-01
|
Headquarters
5453 Great America Parkway
Santa Clara, CA 95054, USA +1-408 547-5500 www.arista.com
|
Support
+1-408 547-5502
+1-866 476-0000 This email address is being protected from spambots. You need JavaScript enabled to view it.
|
Sales
+1-408 547-5501
+1-866 497-0000 This email address is being protected from spambots. You need JavaScript enabled to view it.
|