Troubleshooting Orchestrator
This section discusses Orchestrator troubleshooting.
Orchestrator Diagnostics Overview
The Orchestrator Diagnostics bundle is a collection of diagnostic information that is required for Support and Engineering to troubleshoot the Orchestrator. For Orchestrator on-premises installation, Operators can collect the Orchestrator Diagnostic bundle from the Orchestrator UI and provide it to the Arista Support team for offline analysis and troubleshooting.
- Diagnostic Bundles Tab: Request and download a diagnostic bundle. This information can be found in the Arista SD-WAN Orchestrator Deployment and Monitoring Guide. See the section titled, "Diagnostic Bundle Tab."
- Database Statistics Tab: Provides a read-only access view of some of the information from a diagnostic bundle. This information can be found in the Arista SD-WAN Orchestrator Deployment and Monitoring Guide. See the section titled, Database Statistics Tab.
Diagnostics Bundle Tab
Users can request and download a diagnostic bundle in the Diagnostics Bundle tab.
Columns in the Diagnostics Bundle Tab
The Orchestrator Diagnostics table grid includes the following columns:
| Column Name | Description |
|---|---|
| Request Status | There are two types of status requests:
|
| Reason for Generation | The specific reason given for generating a diagnostic bundle. Select the Request Diagnostic Bundle button to include a description of the bundle. |
| User | The individual logged into the Orchestrator. |
| Generated | The date and time when the diagnostic bundle request was sent. |
| Cleanup Date | The default Cleanup Date is three months after the generated date, when the bundle will be automatically deleted. If you need to extend the Cleanup date period, select the Cleanup Date link located under the Cleanup Date column. For additional information, see Updating Cleanup Date. |
Request a Diagnostic Bundle
To request a diagnostic bundle:
- From the Orchestrator navigation panel, select Diagnostics.
Figure 1. Diagnostics Screen 
- From the Request Diagnostic Bundle tab, select the Request Diagnostic Bundle button.
- In the Request Diagnostic Bundle dialog, enter the reason for the request in the appropriate area.
Figure 2. Request Diagnostic Bundle 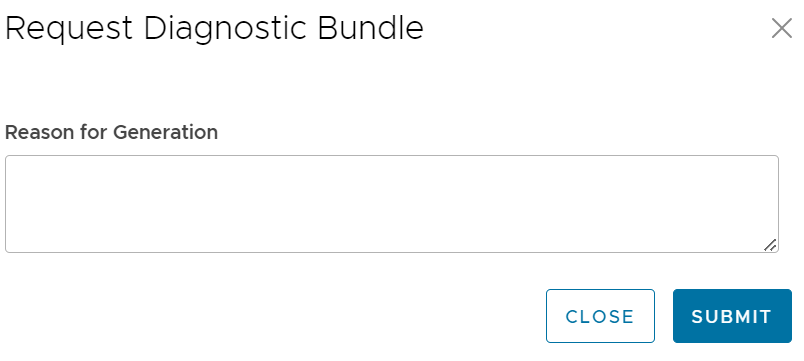
- Select Submit. The bundle request you created displays in the grid area of the Diagnostic Bundle screen with an In Progress status.
- Refresh your screen to check the status of diagnostic bundle request. When the bundle is ready for download, a Complete status appears.
Download a Diagnostic Bundle
To download a diagnostic bundle:
- Select a diagnostic bundle you want to download.
- Select the Actions button, and choose Download Diagnostic Bundle. You can also select the Complete link to download the diagnostics bundle.
The diagnostics bundle downloads.
Update the Cleanup Date
The Cleanup date represents the date when the generated bundle will be automatically deleted, which by default is three months after the Generated date. You can change the Cleanup date or choose to keep the bundle indefinitely.
To update the Cleanup date:
- From the Cleanup Date column, select the Cleanup Date link of your chosen Diagnostic Bundle.
- From the Update Cleanup Date dialog, select the Calendar icon to change the date.
Figure 3. Calendar Settings 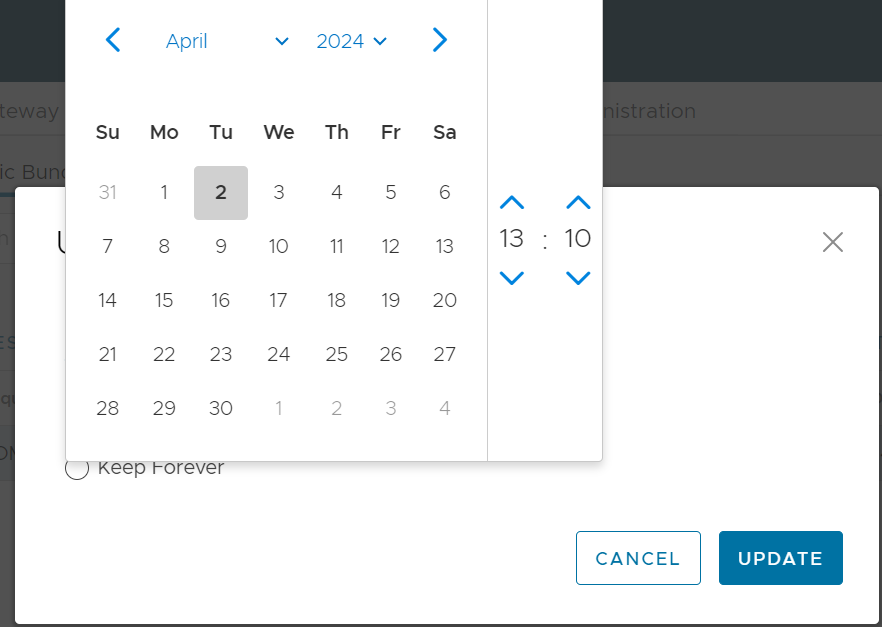
- You can also choose to keep the bundle indefinitely by checking the Keep Forever check box.
Figure 4. Update Cleanup Date 
- Select OK.
The Orchestrator Diagnostics table grid updates to reflect the changes to the Cleanup Date.
Figure 5. Table Grid Updates 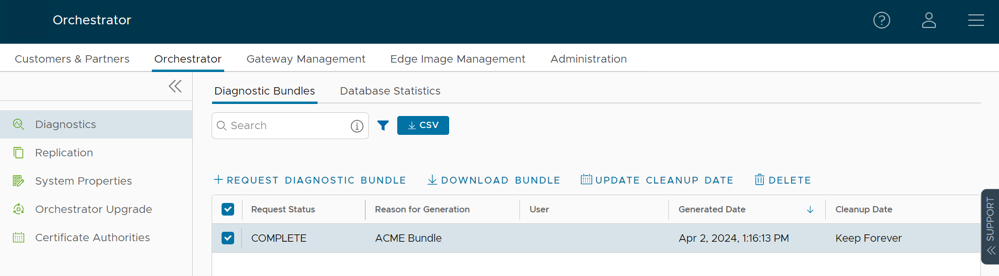
Database Statistics Tab
The Database Statistics tab provides a read-only access view of some of the information from a diagnostic bundle.
If you require additional information, go to the Diagnostic Bundles tab, request a diagnostic bundle, and download it locally. For additional information, see Request Diagnostic Bundle.

| Field | Description |
|---|---|
| Database Sizes | Sizes of the Orchestrator databases. |
| Database Table Statistics | Statistical details of all tables in the Orchestrator database. |
| Database Storage Info | Storage details of the mounted locations. |
| Database Process List | The top 20 records of long-running SQL queries. |
| Database Status Variable | The status variables of the MySQL server. |
| Database System Variable | System variables of the MySQL server. |
| Database Engine Status | The InnoDB engine status of the MySQL server. |
System Metrics Monitoring
This section discusses System Metrics Monitoring on the Orchestrator.
Orchestrator System Metrics Monitoring Overview
The Orchestrator comes with a built-in system metrics monitoring stack, which includes a metrics collector and a time-series database. With the monitoring stack, you can easily check the health condition and the system load for the Orchestrator.
To enable the monitoring stack, run the following command on the orchestrator:
sudo /opt/vc/scripts/vco_observability_manager.sh enableTo check the status of the monitoring stack, run:
sudo /opt/vc/scripts/vco_observability_manager.sh statusTo deactivate the monitoring stack, run:
sudo /opt/vc/scripts/vco_observability_manager.sh disableThe Metrics Collector
Telegraf is used as the Orchestrator system metrics collector, which includes plugins to collect system metrics. The following metrics are enabled by default.
| Metric Name | Description |
|---|---|
| inputs.cpu | Metrics about CPU usage. |
| inputs.mem | Metrics about memory usage. |
| inputs.net | Metrics about network interfaces. |
| inputs.system | Metrics about system load and uptime. |
| inputs.processes | The number of processes grouped by status. |
| inputs.disk | Metrics about disk usage. |
| inputs.diskio | Metrics about disk IO by device. |
| inputs.procstat | CPU and memory usage for specific processes. |
| inputs.nginx | Nginx's basic status information (ngx_http_stub_status_module). |
| inputs.mysql | Statistic data from the MySQL server. |
| inputs.clickhouse | Metrics from one or many ClickHouse servers. |
| inputs.redis | Metrics from one or many redis servers. |
| inputs.filecount | The number and total size of files in specified directories. |
| inputs.ntpq | Standard NTP query metrics (requires ntpq executable). |
| Inputs.x509_cert | Metrics from a SSL certificate. |
- sudo vi /etc/telegraf/telegraf.d/system_metrics_input.conf
- sudo systemctl restart telegraf
The Time-series Database
Prometheus is used to store the system metrics collected by Telegraf. The metrics data will be kept in the database for three weeks at the most. By default, Prometheus listens on port 9090. If you have an external monitoring tool, provide the Prometheus database as a source, so that you can view the Orchestrator system metrics on your monitoring UI.
Rate Limiting API Requests
When there are too many API requests sent at a time, it affects the performance of the system. You can enable Rate Limiting, which enforces a limit on the number of API requests sent by each user.
The Orchestrator makes use of certain defence mechanisms that curb API abuse and provides system stability. API requests that exceed the allowed request limits are blocked and returned with HTTP 429 (Too many Requests). The system needs to go through a cool down period before making the requests again.
- Leaky bucket limiter – Smooths the burst of requests and only allows a pre-defined number of requests. This limiter takes care of limiting the number of requests allowed in a given time window.
- Concurrency limiter – Limits the number of requests that occur in parallel which leads to concurrent requests fighting for resources and may result in long running queries.
- Large number of active or concurrent requests.
- Sudden spikes in request volume.
- Requests resulting in long running queries on the Orchestrator holding system resources for long being dropped.
- Handle HTTP 429 response code when requests exceed rate limits.
- The penalty time duration is 5000 ms when the rate limiter reaches the maximum allowed requests in a given period. If blocked, the clients are expected to have a cool down period of 5000 ms before making requests again. The requests made during the cool down period of 5000 ms will still be rate limited.
- Use shorter time intervals for time series APIs which will not let the request to expire due to long running queries.
- Prefer batch query methods to those that query individual Customers or Edges whenever possible.
Configure Rate Limiting Policies using System Properties
vco.api.rateLimit.enabledvco.api.rateLimit.mode.logOnlyvco.api.rateLimit.rules.globalvco.api.rateLimit.rules.enterprise.defaultvco.api.rateLimit.rules.enterpriseProxy.default
For additional information on the system properties, see List of System Properties.
Configure Rate Limiting Policies using APIs
- enterpriseProxy/insertOrUpdateEnterpriseProxyRateLimits – Used to configure Partner-specific policies.
- enterprise/insertOrUpdateEnterpriseRateLimits – Used to configure Customer-specific policies.
For additional information on the APIs, see VeloCloud API Guide.