Viewing Information about Monitoring Fabric and Production Networks
This chapter describes to view information about the DANZ Monitoring Fabric (DMF) and connected production networks.
Monitoring DMF Interfaces
Monitoring DANZ Monitoring Fabric (DMF) Interfaces
Using the GUI to Monitor DMF Interfaces
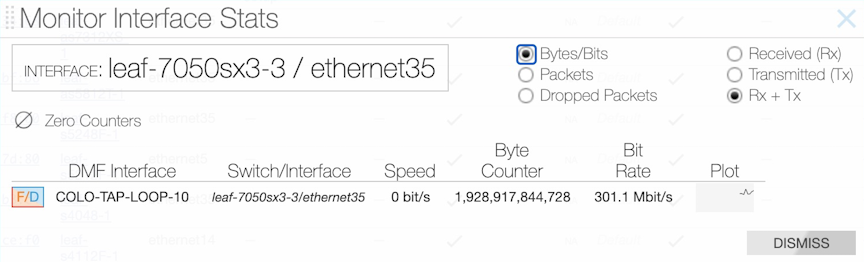
This window displays statistics for up to four selected interfaces and provides a line graph (sparkline) that indicates changes in packet rate or bandwidth utilization. The auto-refresh rate for these statistics is ten seconds—mouse over the sparkline to view the range of values represented. To clear statistics for an interface, click the Menu control and select Clear Stats.
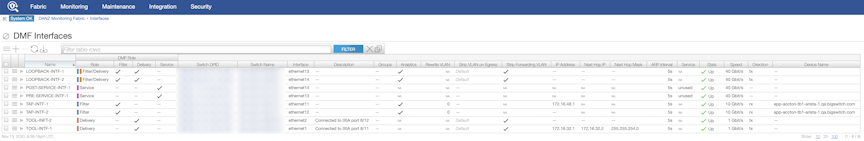
To view the interfaces assigned a specific role, use the command and select the Filter, Delivery, or Service sub-option from the menu.
Viewing Oversubscription Statistics
To view peak bit rate statistics used to monitor bandwidth utilization due to oversubscription, click the Menu in the Interfaces table, select Show/Hide Columns, and enable the Peak Bit Rate checkbox on the dialog box that appears.
After enabling the Peak Bit Rate column, a column appears in the Interfaces table that indicates the relative bandwidth utilization of each interface. When using less than 50% of the bandwidth, the bar appears in green; 50-75% changes the bar to yellow, and over 75% switches the bar color to red.
To display statistics for a specific interface, select Monitor Stats from the Menu control to the left of the row.
To reset the statistics counters, select Clear Stats from the Menu control.
Using the CLI to Monitor Interface Configuration
Ctrl-2> show interface-names

~~~~~~~~~~~~~~~~~~~~~~~~~~~~~~~~~~~~~~~~~~~ Filter Interface(s)~~~~~~~~~~~~~~~~~~~~~~~~~~~~~~~~~~~~~~~~~~~
# DMF IFSwitchIF Name Dir State SpeedVLAN Tag Analytics Ip address Connected Device
-|-----------|-------------------|---------|---|-----|------|--------|---------|----------|----------------|
1 Lab-traffic Arista-7050SX3-T3X5 ethernet7 rxup10Gbps 0True

~ Delivery Interface(s) ~
None.


~ Service Interface(s) ~
None.

~~~~~~~~~~~~~~~~~~~~~~~~~~~~~~~~ Recorder Fabric Interface(s)~~~~~~~~~~~~~~~~~~~~~~~~~~~~~~~~
# DMF IFSwitchIF NameDir State SpeedConnected Device
-|---------------|-------------------|----------|-------------|-----|------|------------------|
1 PR-NewHW-Intf Arista-7050SX3-T3X5 ethernet25 bidirectional up25Gbps PR-NewHW ens1f0
2 RMA-CNrail-intf Arista-7050SX3-T3X5 ethernet35 bidirectional up25Gbps RMA-CNrail ens1f0
controller-1# show fabric
~~~~~~~~~~~~~~~~~~~~~ Aggregate Network State ~~~~~~~~~~~~~~~~~~~~~
Number of switches : 3
Inport masking : False
Start time : 2018-03-16 15:42:43.322000 PDT
Number of unmanaged services : 0
Filter efficiency : 0:1
Number of switches with service interfaces : 0
Total delivery traffic (bps) : 168bps
Number of managed service instances : 2
Number of service interfaces : 0
Match mode : l3-l4-offset-match
Number of delivery interfaces : 6
Max pre-service BW (bps) : 20Gbps
Auto VLAN mode : push-per-policy
Number of switches with delivery interfaces : 2
Number of managed devices : 1
Uptime : 5 hours, 4 minutes
Total ingress traffic (bps) : 160bps
Max filter BW (bps) : 221Gbps
Auto Delivery Interface Strip VLAN : True
Number of core interfaces : 12
Overlap : True
Number of switches with filter interfaces : 2
State : Enabled
Max delivery BW (bps) : 231Gbps
Total pre-service traffic (bps) : 200bps
Track hosts : True
Number of filter interfaces : 5
Number of active policies : 2
Number of policies : 5
~~~~~~~~~~~~~ Aggregate Interface Statistics ~~~~~~~~~~~~~
# Interface Type Dir Packets BytesPkt Rate Bit Rate
-|------------------|---|-------|------|--------|--------|
1 Filter Interface rx2444455611 0160bps
2 Delivery Interface tx4050421227 0168bps
---------------------example truncated--------------------
controller-1#
Viewing Devices Connected to the Monitoring Fabric
Using the GUI to View Fabric-Connected Devices
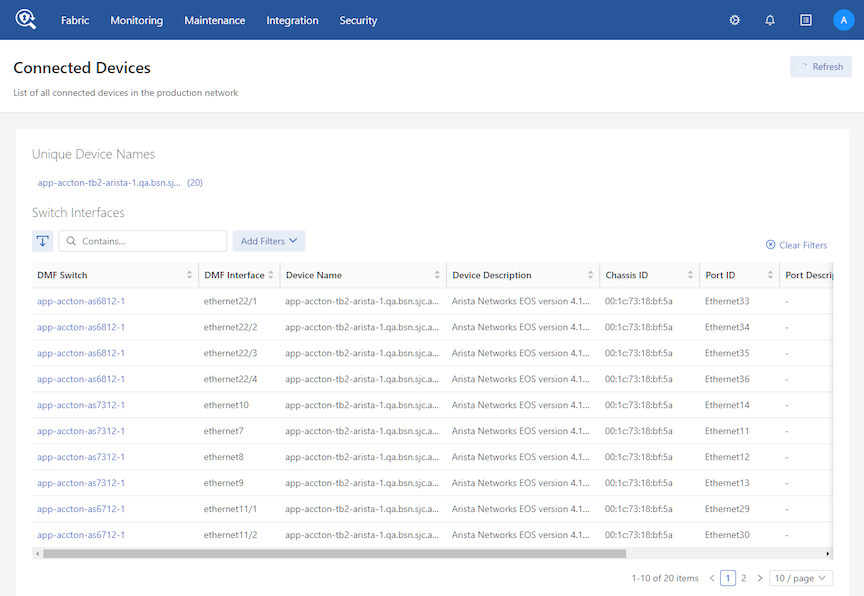
The Switch Interfaces table displays the unique devices connected to each out-of-band filter or delivery switch.It lists each interface's MAC address (Chassis ID) on every device connected to the fabric as a separate device.
The Unique Device Names table lists all unique device names with a count of interfaces in parentheses. Clicking a row in this list filters the contents of the Switch Interfaces table.
To view a display of the devices discovered by the Controller through the Link Aggregation Control Protocol (LACP), select from the main menu.
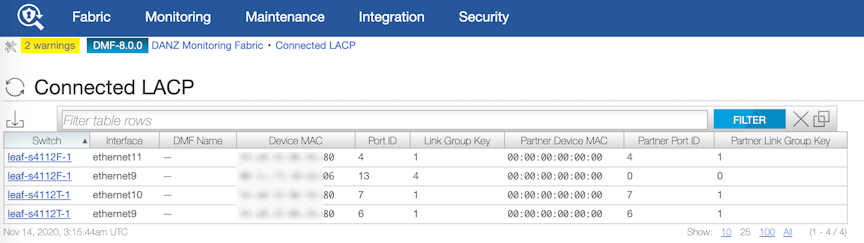
This page displays the devices discovered by the Controller through LACP.
Using the CLI to View Switch Configuration
controller> show topology
~~~~~~~~~~~~~~~~~~~~~ Filter Interface(s) ~~~~~~~~~~~~~~~~~~~~~
# DMF IFSwitch IF Name state speed Connected Device
-|---------|-----------|--------|-----|-------|----------------|
1 f1filter-sw-1 s11-eth1 up10 Gbps
2 f2filter-sw-1 s11-eth2 up10 Gbps
~~~~~~~~~~~~~~~~~~~~ Delivery Interface(s) ~~~~~~~~~~~~~~~~~~~~
# DMF IFSwitch IF Name state speed Connected Device
-|---------|-----------|--------|-----|-------|----------------|
1 d1filter-sw-2 s12-eth1 up10 Gbps
2 d2filter-sw-2 s12-eth2 up10 Gbps
~~~~~~~~~~~~~~~~~~~~~~~~~ Service Interface(s) ~~~~~~~~~~~~~~~~~~~~~~~~~
# DMF IF Switch IF NameDir state speed Connected Device
-|----------------|---------|-------|---|-----|-------|----------------|
1 post-serv-intf-1 core-sw-1 s9-eth2 up10 Gbps
2 pre-serv-intf-1core-sw-1 s9-eth1 up10 Gbps
~~~~~~~~~~~~~~~~~~~~~~~~ Core Interface(s) ~~~~~~~~~~~~~~~~~~~~~~~~
# Src SwitchSrc IF Src Speed Dst SwitchDst IF Dst Speed
-|-------------|--------|---------|-------------|--------|---------|
1 core-sw-3 s13-eth2 10 Gbps delivery-sw-2 s15-eth3 10 Gbps
2 core-sw-3 s13-eth1 10 Gbps delivery-sw-1 s14-eth3 10 Gbps
3 filter-sw-1 s11-eth3 10 Gbps core-sw-2 s10-eth1 10 Gbps
4 core-sw-2 s10-eth1 10 Gbps filter-sw-1 s11-eth3 10 Gbps
5 delivery-sw-2 s15-eth3 10 Gbps core-sw-3 s13-eth2 10 Gbps
6 core-sw-2 s10-eth2 10 Gbps filter-sw-2 s12-eth3 10 Gbps
7 filter-sw-2 s12-eth3 10 Gbps core-sw-2 s10-eth2 10 Gbps
8 delivery-sw-1 s14-eth3 10 Gbps core-sw-3 s13-eth1 10 Gbps
~~~~~~~~~~~~~~~~~~~~~~~~~~~~~~~~~~~~ Statistics ~~~~~~~~~~~~~~~~~~~~~~~~~~~~~~~~~~~~
#DMF IFSwitch IF Role State PacketsBytesPkt Rate Bit Rate
--|---------|-------------|--------|--------|-----|-------|------|--------|--------|
1 f1 filter-sw-1 s11-eth1 filter up0 00-
2 f2 filter-sw-1 s11-eth2 filter up0 00-
3 d1 filter-sw-2 s12-eth1 delivery up8 6000-
4 d2 filter-sw-2 s12-eth2 delivery up8 600032 bps
6 -core-sw-3 s13-eth1 core up3432257400 032 bps
7 -delivery-sw-2 s15-eth3 core up3431257325 032 bps
8 -delivery-sw-1 s14-eth3 core up3430257250 032 bps
9 -core-sw-2 s10-eth1 core up3429257175 032 bps
10 - filter-sw-1 s11-eth3 core up3431257325 032 bps
11 - core-sw-3 s13-eth2 core up3432257400 032 bps
12 - filter-sw-2 s12-eth3 core up3429257175 032 bps
Viewing Information about a Connected Production Network
# show tracked-hosts
# IP AddressMAC AddressHost name Filter interfacesVLANs Last seen Extra info
---|---------------|--------------------------------------------------------|-----------------------------------|------------------------|-------|---------|
1 10.0.0.340:a6:d9:7c:9f:9fApple wireless-poe-1 0 1 hours
2 10.0.0.698:fe:94:1c:37:06Apple wireless-poe-1 0 42 min
3 10.0.0.6dc:2b:61:81:64:45Apple wireless-poe-1 0 3 hours
4 10.0.0.720:c9:d0:48:f3:3dApple wireless-poe-1 0 2 hours
5 10.0.0.11 60:03:08:9b:4f:48Apple wireless-poe-1 0 13 min
6 10.0.1.314:10:9f:e4:e6:bfApple wireless-poe-1 0 51 min
--------------------------------------------------------------------output truncated----------------------------------------------------------------------
DMF also tracks the DNS names of hosts by capturing and analyzing packets using several different protocols. To manage host-name tracking, from config-analytics mode, use the track command, which has the following syntax:
[no] track { arp | dns | dhcp | icmp }
controller-1(config)# analytics
controller-1(config-analytics)# track dnscontroller-1(config)# switch DMF-FILTER-SWITCH-1
controller-1(config-switch)# interface ethernet20
controller-1(config-switch-if)# role filter interface-name TAP-PORT-01 no-analyticsThis command disables all host tracking on interface TAP-PORT-01.
Using the CLI to View Connected Devices and LAGs
Some information on devices in the production network, discovered using LLDP and CDP, can be seen using the show connected-devices command. The data helps determine if filter interfaces are connected to the intended production device.
The show connected-devicescommand from login mode displays the devices connected to the DANZ Monitoring Fabric (DMF). This command displays information about devices connected to DMF switch interfaces. DMF extracts the information from link-level protocol packets such as LLDP, CDP, and UDLD and ignores expired link-level data.

Users can see the most recent events related to particular connected devices via the CLI command show connected-devices history device_alias.
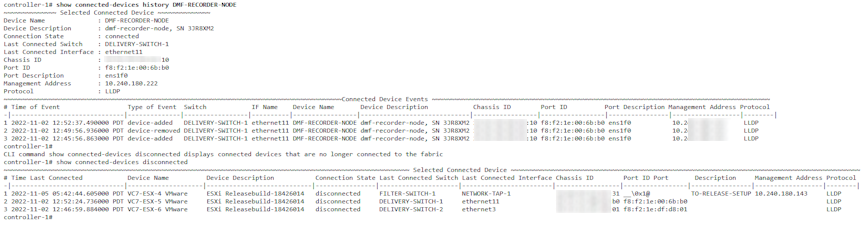
Connecting a DMF switch interface to a SPAN port may result in inaccurate information because some vendor devices mirror link-level packets to the SPAN port.
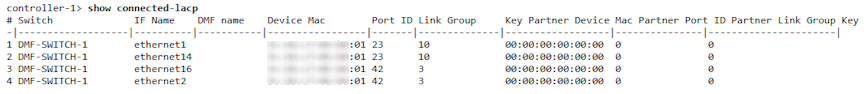
To display details about the link aggregation groups connected to the DMF switch interfaces use the show connected-lacp command. DMF extracts the information from LACP protocol packets and expired LACP information is ignored as illustrated in the following.