Using the DMF Recorder Node
- Installing and configuring DMF Recorder Node: DANZ Monitoring Fabric Deployment Guide
- Integrating DMF Recorder Node with Analytics: Arista Analytics User Guide
- Stenographer Queries: Stenographer Reference for DMF Recorder Node
- DMF Recorder Node REST API: DMF Recorder Node REST APIs
Overview
The DANZ Monitoring Fabric (DMF) Recorder Node (RN) integrates with the DMF for single-pane-of-glass monitoring. A single DMF Controller can manage multiple RNs, delivering packets for recording through Out-of-Band policies. The DMF Controller also provides central APIs for packet queries across one or multiple RNs and for viewing errors, warnings, statistics, and the status of connected RNs.
A DMF out-of-band policy directs matching packets for recording to one or more RNs. An RN interface identifies the switch and port used to attach the RN to the fabric. A DMF policy treats these as delivery interfaces and adds them to the policy so that flows matching the policy are delivered to the specified RN interfaces.
Configuration Summary
At a high level, follow the below three steps to use the Recorder Node (RN).
Step 1: Define the RN.
Step 2: Define a DANZ Monitoring Fabric (DMF) policy to select the traffic to forward to the RN.
Step 3: View and analyze the recorded traffic.
- Name: Each RN requires a unique name among recorder nodes in the connected fabric. Removing the name removes the entire configuration for the given RN.
- Management MAC address: Each RN must have a unique management interface MAC address in the connected fabric.
- Packet removal policy: Defines the behavior when the RN disks reach capacity. The default policy causes the overwriting of the earliest recorded packets by the most recent packets. The other option is to stop recording and wait until space is available.
- Record enable, or Record disable: DMF enables packet recording by default but can be enabled or disabled for a specific RN.
- Static auth tokens: Static auth tokens are pushed to each RN as an alternative form of authentication in headless mode when the DMF Controller is unreachable or by third-party applications that do not have or do not need DMF Controller credentials.
- Controller auth token: The RN treats the controller as an ordinary client and requires it to present valid credentials as an authentication token. The DMF Controller authentication token is automatically generated and resettable upon request.
- Pre-buffer: This buffer, defined in minutes, is used for proactive network monitoring without recording and retaining unnecessary packets. Once the buffer is full, DMF deletes the oldest packets.
- Maximum disk utilization: This defines the maximum disk utilization as a percentage between 5% and 95%. After reaching the configured utilization, DMF enforces the packet removal policy. The default maximum disk utilization is 95%.
- Maximum packet age: This defines the maximum age in minutes of any packet in the RN. Use it with the packet removal policy to control when packets are deleted based on age rather than disk utilization alone. When not set, DMF does not enforce the maximum packet age and keeps packets until the maximum disk utilization is reached.
Indexing Configuration
The Recorder Node (RN) indexing configuration defines the fields used to query packets on the RN. By default, DMF enables all indexing fields in the indexing configuration. Selectively disable the specific indexing fields not required in RN queries.
Disabling indexing fields has two advantages. First, it reduces the index space required for each packet recorded. Second, it improves query performance by reducing unnecessary overhead. Arista recommends disabling unnecessary indexing fields.
- MAC Source
- MAC Destination
- VLAN 1: Outer VLAN ID
- VLAN 2: Inner/Middle VLAN ID
- VLAN 3: Innermost VLAN ID
- IPv4 Source
- IPv4 Destination
- IPv6 Source
- IPv6 Destination
- IP protocol
- Port Source
- Port Destination
- MPLS
- Community ID
- MetaWatch Device ID
- MetaWatch Port ID
To understand leveraging an indexing configuration, consider the following examples:
Example 1: To query packets based on applications defined by unique transport ports, disable all indexing fields except source and destination transport ports, saving only transport ports as metadata for each packet recorded. This technique greatly reduces per-packet index space consumption and increases RN query speed.
However, this will impact an effective query on any other indexing field because that metadata was not saved when the packets were recorded.
Example 2: The RN supports community ID indexing, a hash of IP addresses, IP protocol, and transport ports that identify a flow of interest. Suppose the RN use case is to query based on community ID. In that case, indexing on IPv4 source and destination addresses, IPv6 source and destination addresses, IP protocol, and transport port source and destination addresses might be redundant.
Pre-buffer Configuration and Events
The Recorder Node (RN) pre-buffer is a circular buffer recording received packets. When enabled, the pre-buffer feature allows for the retention of the packets received by the RN for a specified length of time prior to an event that triggers the recording of buffered and future packets to disk. Without an event, the RN will record into this buffer, deleting the oldest packets when the buffer reaches capacity.
When an RN event is triggered, DMF saves packets in the pre-buffer to disk. The packets received from the time of the event trigger to the time of the event termination are saved directly to disk upon termination of the event. However, the received packets are also retained in the pre-buffer until the next event is triggered. By default, the pre-buffer feature is disabled, indicated by a value of zero minutes.
For example, when configuring the pre-buffer to thirty minutes, the buffer will receive up to thirty minutes of packets. When triggering an event, DMF records the packets currently in the buffer to disk, and packets newly received by the RN bypass the buffer and are written directly to disk until the termination of the event. When terminating the event, the pre-buffer resets, accumulating received packets for up to the defined thirty-minute pre-buffer size.
The packets affiliated with an event can be queried, replayed, or analyzed using any RN query. Each triggered event is identified by a unique, user-supplied name, used in the query to reference packets recorded in the pre-buffer before and during the event.
Using an Authentication Token
When using a DANZ Monitoring Fabric (DMF) Controller authentication token, the Recorder Node (RN) treats the DMF Controller as an ordinary client, requiring it to present valid credentials either in the form of an HTTP basic username and password or an authentication token.
Static authentication tokens are pushed to each RN as an alternative form of authentication in headless mode when the DMF Controller is unreachable or by third-party applications that do not have or do not need Controller credentials.
Using the GUI to Add a Recorder Device
- Select from the main menu bar of the DANZ Monitoring Fabric (DMF) GUI.
The system displays the page shown below.
Figure 1. Recorder Nodes 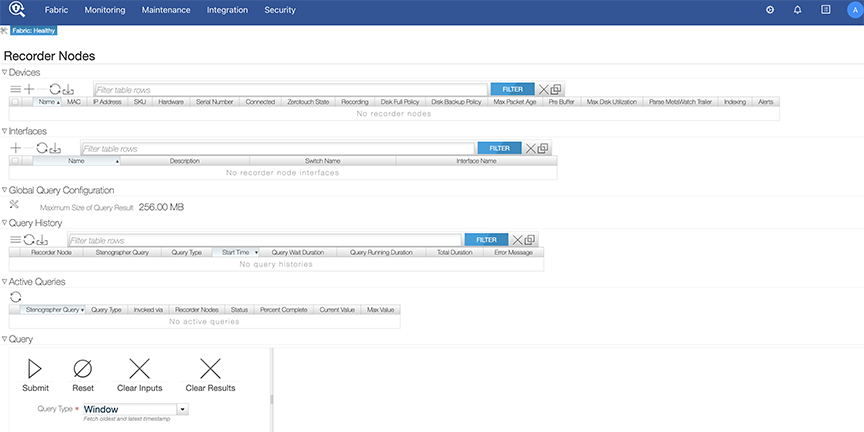
- To add a new RN, click the provision control (+) in the Recorder Nodes Devices table.
Figure 2. Provision Recorder Node 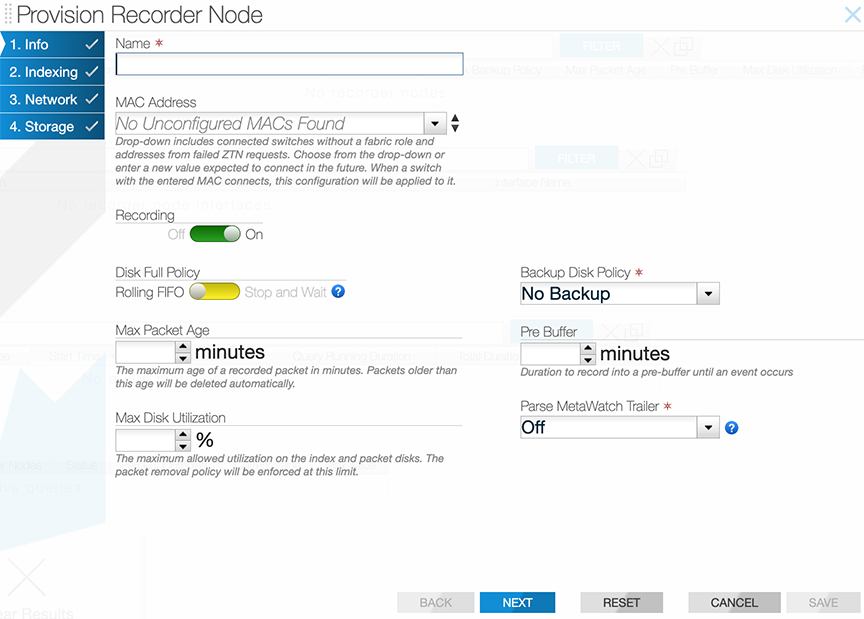
- Click Save to save and close the configuration page or click NEXT to continue with the configuration. Displays the Indexing tab of the Provision Recorder Node page.
Figure 3. Provision Recorder Node-Indexing 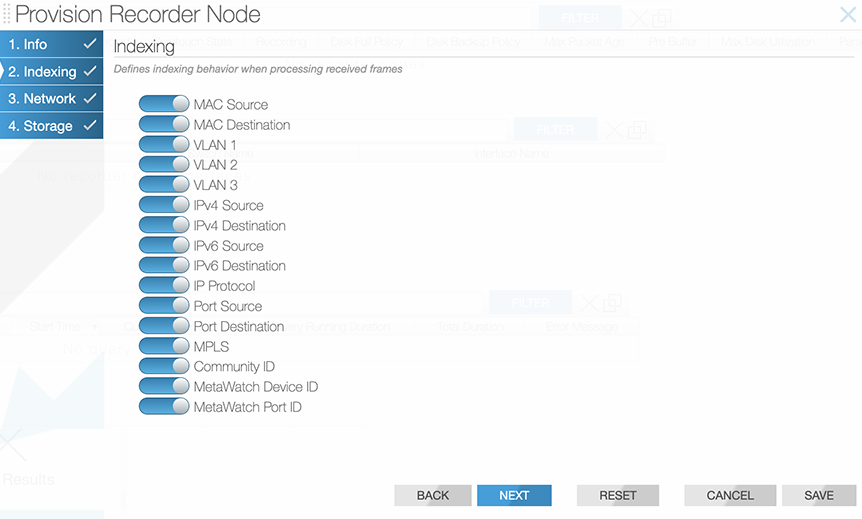
- Click Save to save and close the configuration page or click NEXT to continue with the configuration. Displays the Network tab of the Provision Recorder Node page.
Figure 4. Provision Recorder Node 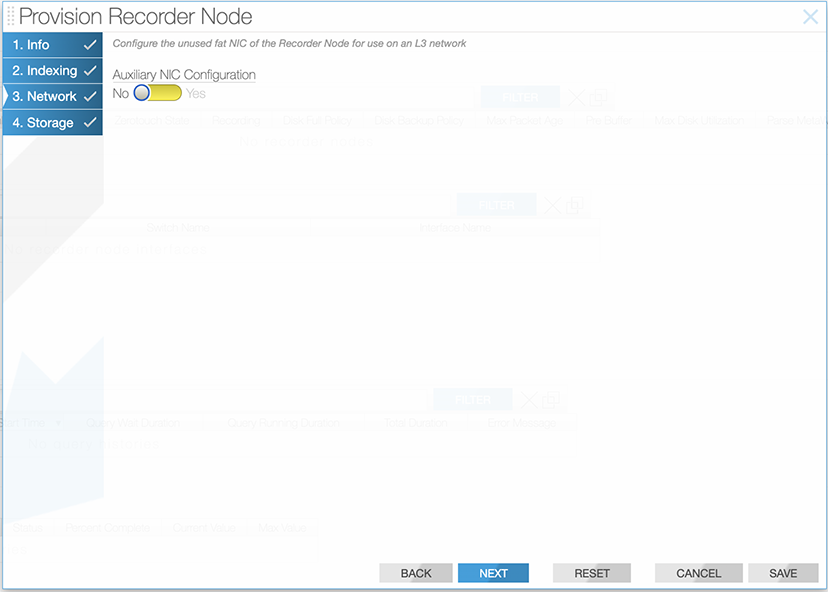
- By default, the Auxiliary NIC Configuration is set to No. This option is selected while configuring a node for local storage. For details, see the Configuring a Node to Use Local Storage section. Move the toggle switch to Yes when configuring a node for external storage. For details, see the Configuring a Node to Use External Storage section.
Configuring a Node to Use Local Storage
- Network: To use local storage, set the Auxiliary NIC Configuration to default (No) as shown in the figure below.
Figure 5. Network Provisioning 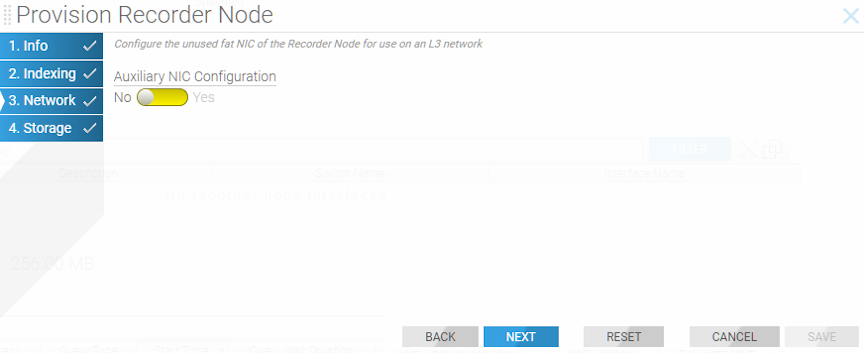
- Storage: To use local storage, set the Index Disk Configuration and Packet Disk Configuration to default (No) as shown in the figure below.
Figure 6. Configure to Use Local Storage 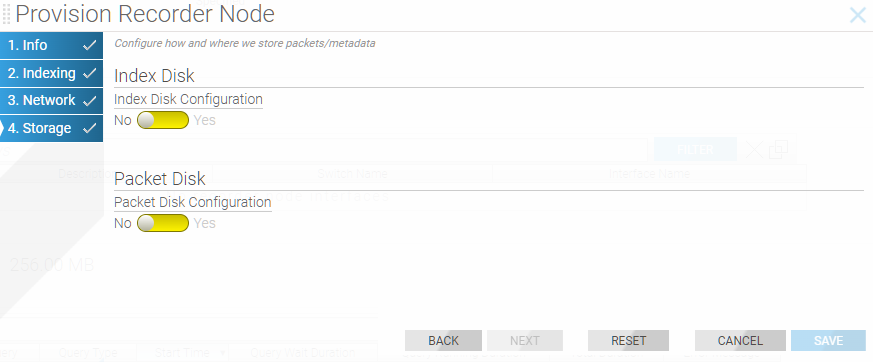
Configuring a Node to Use External Storage
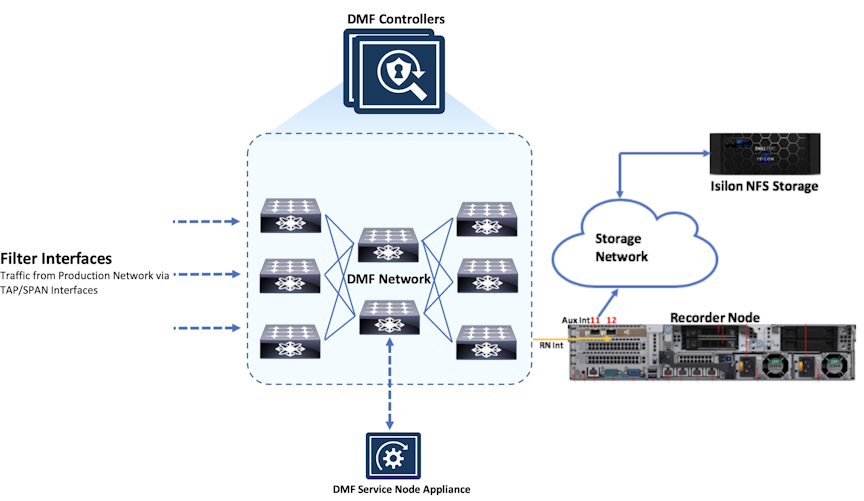
- Network: For external NFS storage, such as Isilon, connect the auxiliary interface of the RN to a network and subnet that is reachable to Isilon NFS storage. Set the Auxiliary NIC Configuration toggle switch to YES and assign an IP address to the auxiliary interface, as shown in the figure below. Ensure the IP address for the auxiliary interface is not in the same subnet as the RN management IP address.
Figure 8. Provision External Storage 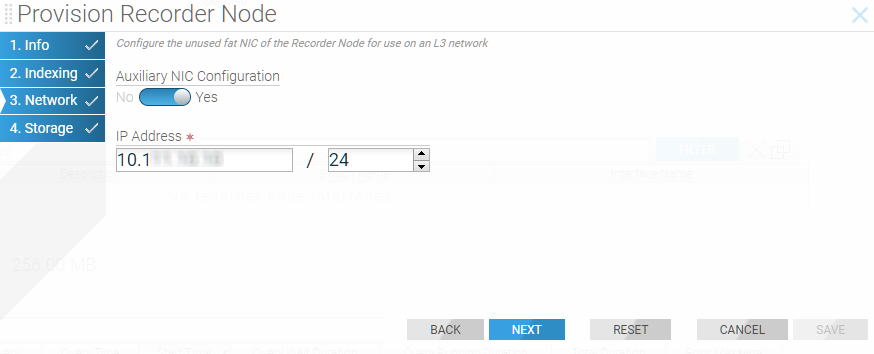
- Storage: To specify the location of the external NFS storage, configure the following options:
- Index Disk Configuration and Packet Disk Configuration are disabled by default (toggle switch set to No). Set the toggle switch for both Index Disk Configuration and Packet Disk Configuration to Yes.
- NFS Server [Index Disk Configuration and Packet Disk Configuration]: assign the IP address or hostname for the NFS Server (e.g., Isilon Smart Connect hostname).
- Transport Port of NFS Service [Index Disk Configuration and Packet Disk Configuration]: DMF uses the default value if no value is specified (2049). Specify a value if the NFS storage has been configured to use something other than the default value.
- Transport Port of Mounted Service [Index Disk Configuration and Packet Disk Configuration]: if no value is specified, DMF uses the default value. Specify a value for this if the NFS storage-mounted service has been configured to use something other than the default value.
- Volume: [Index Disk Configuration and Packet Disk Configuration] - Specify the storage location or path on the NFS server for the index and packets.
Figure 9. Provision External Storage 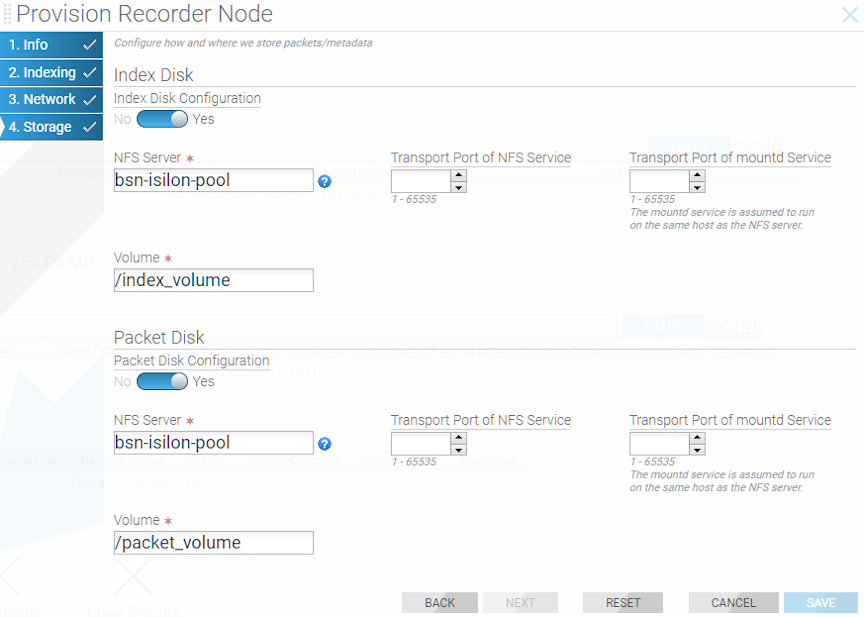
Configuring a Recorder Node Interface
- Click the provision control (+) at the top of the Recorder Node Interfaces table. The system displays the following page:
Figure 10. Create DMF Recorder Node Interface 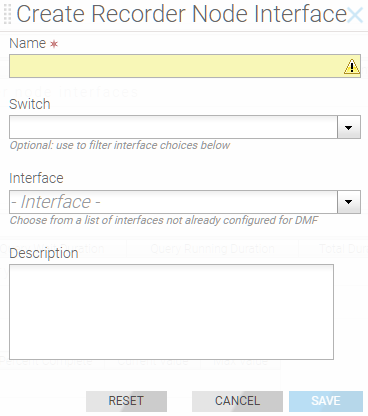
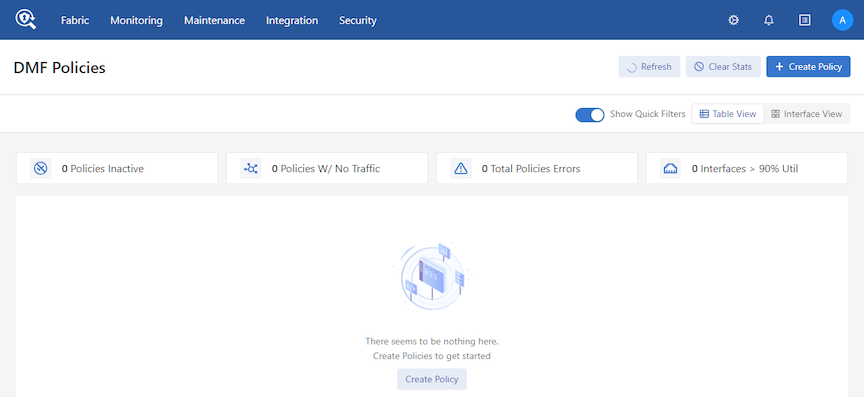
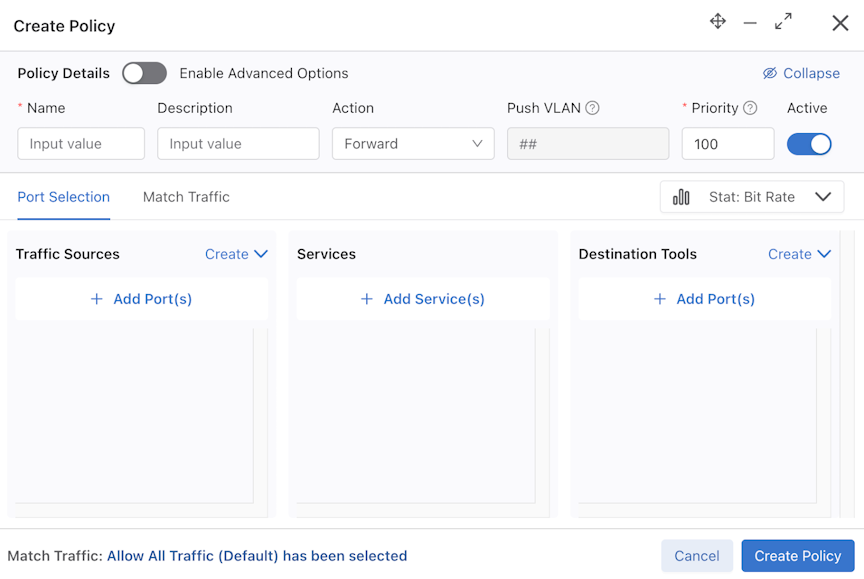
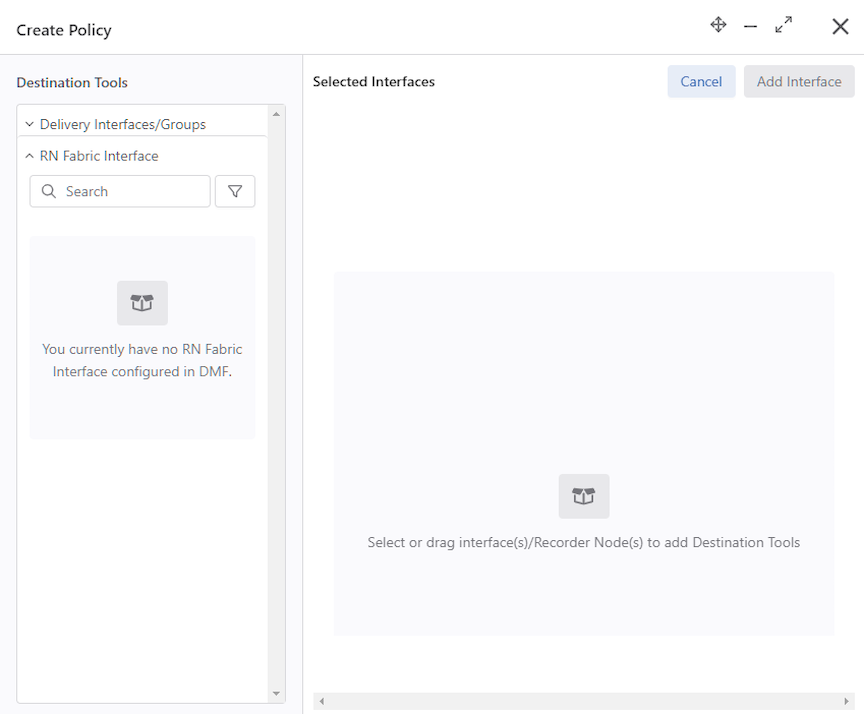
Using the GUI to Assign a Recorder Interface to a Policy
To forward traffic to a Recorder Node (RN), include one or more RN interfaces as a delivery interface in a DANZ Monitoring Fabric (DMF) policy.
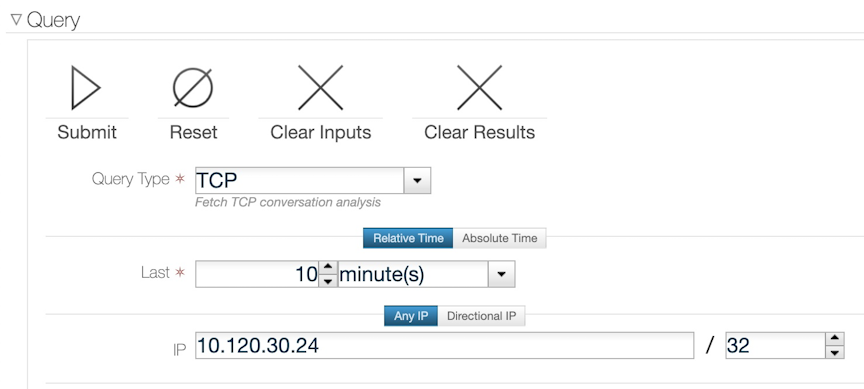
Using the GUI to Define a Recorder Query
- Window: Retrieves the timestamps of the oldest and most recent packets recorded on the recorder.
- Size: Provides the number of packets and their aggregate size in bytes that match the filter criteria specified.
- Application: Performs deep packet inspection to identify applications communicating with the packets recorded and that match the filter criteria specified.
- Packet-data: Retrieves all the packets that match the filter criteria specified.
- Packet-object: The packet object query extracts unencrypted HTTP objects from packets matching the given stenographer filter.
- HTTP, HTTP Request, and HTTP Stat: Analyzes HTTP packets, extracting request URLs, response codes, and statistics.
- DNS: Analyzes any DNS packets, extracting query and response metadata.
- Replay: Replays selected packets and transmits them to the specified delivery interface.
- IPv4: Identifies and dissects distinct IPv4 flows.
- IPv6: Identifies and dissects distinct IPv6 flows.
- TCP: Identifies and dissects distinct TCP flows.
- TCP Flow Health: Analyzes TCP flows for information such as maximum RTT, retransmissions, throughput, etc.
- UDP: Identifies and dissects distinct UDP flows.
- Hosts: Identifies all the unique hosts that match the filter criteria specified.
- RTP Stream: Characterizes the performance of Real Time Protocol streaming packets.
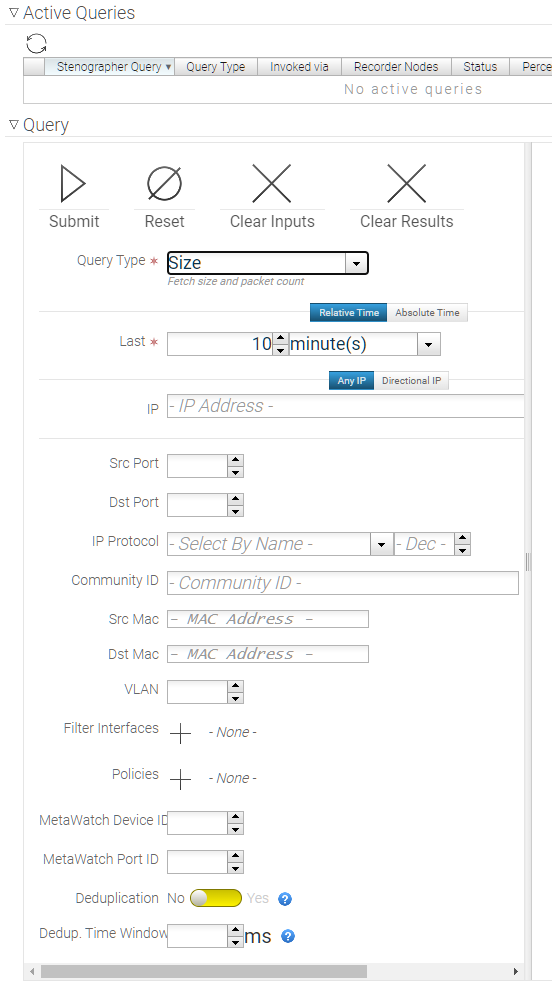
- Relative Time: A time range relative to the current time in which look for packets.
- Absolute Time: A specific time range in which to look for packets.
- Any IP: Include packets with the specified IP address in the IP header (either source or destination).
- Directional IP: Include packets with the specified source and/or destination IP address in the IP header.
- Src Port: Include packets with the specified protocol port number in the Src Port field in the IP header.
- Dst Port: Include packets with the specified protocol port number in the Dst Port field in the IP header.
- IP Protocol: Select the IP protocol from the selection list or specify the numeric identifier of the protocol.
- Community ID:Select packets with a specific BRO community ID string.
- Src Mac: Select packets with a specific source MAC address.
- Dst Mac: Select packets with a specific destination MAC address.
- VLAN: Select packets with a specific VLAN ID.
- Filter Interfaces: Click the provision (+) control and, in the dialog that appears, enable the checkbox for one or more filter interfaces to restrict the query to those interfaces. To add interfaces to the dialog, click the provision (+) control on the dialog and select the interfaces from the list that is displayed.
- Policies: Click the provision (+) control and, in the dialog that appears, enable the checkbox for one or more policies to restrict the query to those policies. To add policies to the dialog, click the provision (+) control on the dialog and select the policies from the list that is displayed.
- Max Bytes: This option is only available for packet queries. Specify the maximum number of bytes returned by a packet query in a PCAP file.
- Max Packets: This option is only available for packet queries. Specify the maximum number of packets returned by a packet query in a PCAP file.
- MetaWatch Device ID: Filter packets with the specified MetaWatch device ID.
- MetaWatch Port ID: Filter packets with the specified MetaWatch port ID.
Viewing Query History
View Recorder Node (RN) submitted queries using the GUI or CLI.
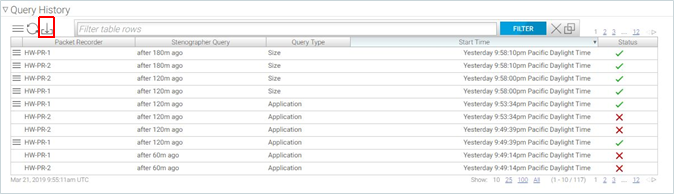
The Query History section displays the queries submitted to each RN and the query status.
To download the query results, select Download Results from the Menu control for a specific query. To export the query history, click the Export control at the top of the table (highlighted in the figure above, to the right of the Refresh control).
controller-1> show recorder-node query-history
# Packet Recorder Query Type StartDuration
---|---------------|-----------------------------------------------------------------------|------------------------|----------------------------|--------|
1 HW-PR-2 after 10m ago analysis-hosts 2019-03-20 09:52:38.021000 PDT 3428
2 HW-PR-1 after 10m ago analysis-hosts 2019-03-20 09:52:38.021000 PDT 3428
3 HW-PR-2 after 10m ago abort2019-03-20 09:52:40.439000 PDT 711
4 HW-PR-1 after 10m ago abort2019-03-20 09:52:40.439000 PDT 711
---------------------------------------------------------------------output truncated---------------------------------------------------------------------
Using the CLI to Manage the DMF Recorder Node
Basic Configuration
- Set the MAC address of the RN.
controller-1(config-recorder-node)# mac 18:66:da:fb:6d:b4Determine from the chassis ID of connected devices if the management MAC is unknown.

Authentication Token Configuration
Static authentication tokens are pushed to each Recorder Node (RN) as an alternative form of authentication in headless mode when the DANZ Monitoring Fabric (DMF) Controller is unreachable or by third-party applications that do not have or do not need DMF controller credentials to query the RN.
controller-1(config)# recorder-node auth token mytoken
Auth : mytoken
Token : some_secret_string <--- secret plaintext token displayed once here
controller-1 (config)# show running-config recorder-node auth token
! recorder-node
recorder-node auth token mytoken $2a$12$cwt4PvsPySXrmMLYA.Mnyus9DpQ/bydGWD4LEhNL6xhPpkKNLzqWS <---hashed token shows in running configcontroller-1(config)# recorder-node auth generate-controller-tokenConfiguring the Pre-buffer
controller-1(config)# recorder-node device <name>
controller-1(config-recorder-node)# pre-buffer <minutes>
Replace name with the recorder node name. Replace minutes with the number of minutes to allocate to the pre-buffer.
Triggering a Recorder Node Event
To trigger an event for a specific Recorder Node (RN), enter the following command from enable mode:
controller-1# trigger recorder-node <name> event <event-name>Replace name with the RN name and replace event-name with the name to assign to the current event.
Terminating a Recorder Node Event
controller-1# terminate recorder-node <name> event <event-name>Replace name with the RN name and replace event-name with the RN event name to terminate.
Viewing Recorder Node Events
controller-1# show recorder-node events
# Packet Recorder Time Event
-|---------------|------------------------------|-------------------------------------------------------------------|
1 pkt-rec-740 2018-02-06 16:21:37.289000 UTC Pre-buffer event my-event1 complete. Duration 3 minute(s)
2 pkt-rec-740 2018-02-06 20:23:59.758000 UTC Pre-buffer event event2 complete. Duration 73 minute(s)
3 pkt-rec-740 2018-02-07 22:39:15.036000 UTC Pre-buffer event event-02-7/event3 complete. Duration 183 minute(s)
4 pkt-rec-740 2018-02-07 22:40:15.856000 UTC Pre-buffer event event5 triggered
5 pkt-rec-740 2018-02-07 22:40:16.125000 UTC Pre-buffer event event4/event-02-7 complete. Duration 1 minute(s)
6 pkt-rec-740 2018-02-22 06:53:10.216000 UTC Pre-buffer event triggered
Using the CLI to Run Recorder Node Queries
Packet Replay
replay recorder-node command from enable mode to replay the packets recorded by a Recorder Node (RN).
controller-1# replay recorder-node <name> to-delivery <interface> filter <stenographer-query>
[realtime | replay-rate <bps> ]- name: Specify the RN from which to replay the recorded packets.
- interface: The DMF delivery interface name receiving the packets.
- stenographer-query: The filter used to look up desired packets.
- (Optional) real-time: Replay the packets at the original rate recorded by the specified RN. The absence of this parameter will result in a replay up to the line rate of the RN interface.
- (Optional) replay-rate bps: Specify the number of bits per second used for replaying the packets recorded by the specified RN. The absence of this parameter will result in a replay up to the line rate of the RN interface.
controller-1# replay recorder-node packet-rec-740 to-delivery eth26-del filter 'after 1m ago'
controller-1#
Replay policy details:
controller-1# show policy-flow | grep replay
1 __replay_131809296636625 packet-as5710-2 (00:00:70:72:cf:c7:cd:7d) 0 0 6400 1
in-port 47 apply: name=__replay_131809296636625 output: max-length=65535, port=26
Packet Data Query
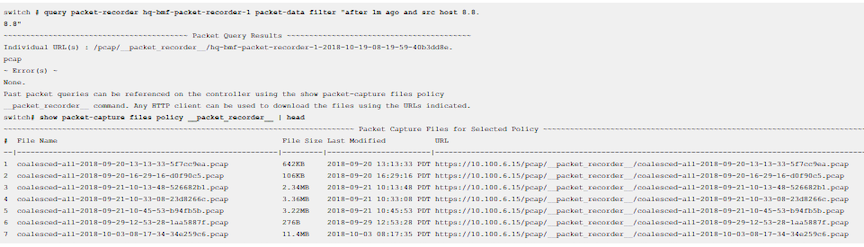
Use a packet query to search the packets recorded by a specific Recorder Node (RN). The operation uses a Stenographer query string to filter only the interesting traffic. The query returns a URL to download and analyze the packets using Wireshark or other packet-analysis tools.
switch # query recorder-node <name> packet-data filter <stenographer-query>- name: Identify the RN.
- packet-data filter stenographer-query: Look up only the packets that match the specified Stenographer query.
Packet Object Query
switch# query recorder-node bmf-integrations-pr-1 packet-object filter 'after 5m ago'switch# query recorder-node bmf-integrations-pr-1 packet-object filter 'after 1m ago'
~~~~~~~~~~~~~~~~~~~~~~~~~~~~~~~~~~~ Packet Object Query Results ~~~~~~~~~~~~~~~~~~~~~~~~~~~~~~~~~~~
Coalesced URL : /pcap/__packet_recorder__/coalesced-bmf-2022-11-21-14-27-56-67a73ea9.tgz
Individual URL(s) : /pcap/__packet_recorder__/bmf-integrations-pr-1-2022-11-21-14-27-55-598f5ae7.tgzUntar the folder to extract the HTTP objects.
Size Query
Use a size query to analyze the number of packets and the total size recorded by a specific Recorder Node (RN). The operation uses a Stenographer query string to filter only the interesting traffic.
# query recorder-node <name> size filter <stenographer_query>- name: Identify the RN.
- size filter stenographer-query: Analyze only the packets that match the specified Stenographer query.
switch# query recorder-node <hq-bmf-packet-recorder-1> size filter "after 1m ago and src host 8.8.8.8"
~ Summary Query Results ~
# Packets : 66
Size: 7.64KB
~ Error(s) ~
None.
Window Query
Use a window query to analyze the oldest and most recent available packets recorded by a specific Recorder Node (RN).
Enter the query recorder-node command from enable mode to run a window query.
switch# query recorder-node <name> window- name: Identify the RN.
switch# query recorder-node hq-bmf-packet-recorder-1 window
~~~~~~~~~~~~~ Window Query Results ~~~~~~~~~~~~~
Oldest Packet Available : 2020-07-30 05:01:08 PDT
Newest Packet Available : 2020-10-19 08:14:21 PDT
~ Error(s) ~
None.
Stopping a Query
controller-1# abort recorder-node <name> filter <string>controller-1# abort recorder-node hq-bmf-packet-recorder-1 filter ""
Abort any request with the specified filter? This cannot be undone. enter "yes" (or "y") to
continue:
yes
Result : Success
~ Error(s) ~
None.Using RBAC to Manage Access to the DMF Recorder Node
Use Role-Based Access Control (RBAC) to manage access to the DANZ Monitoring Fabric (DMF) Recorder Node (RN) by associating the RN with an RBAC group.
To restrict access for a specific RN to a specific RBAC group, use the CLI or GUI as described below.
RBAC Configuration Using the CLI
RBAC Configuration Using the GUI
- Select , and select Edit from the Actions and click + Create Group.
Figure 17. Create Security Group 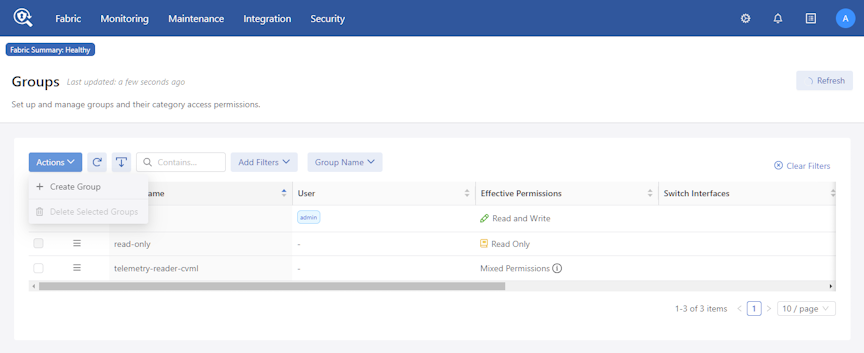
- Enter a Group Name.
Figure 18. Create Group 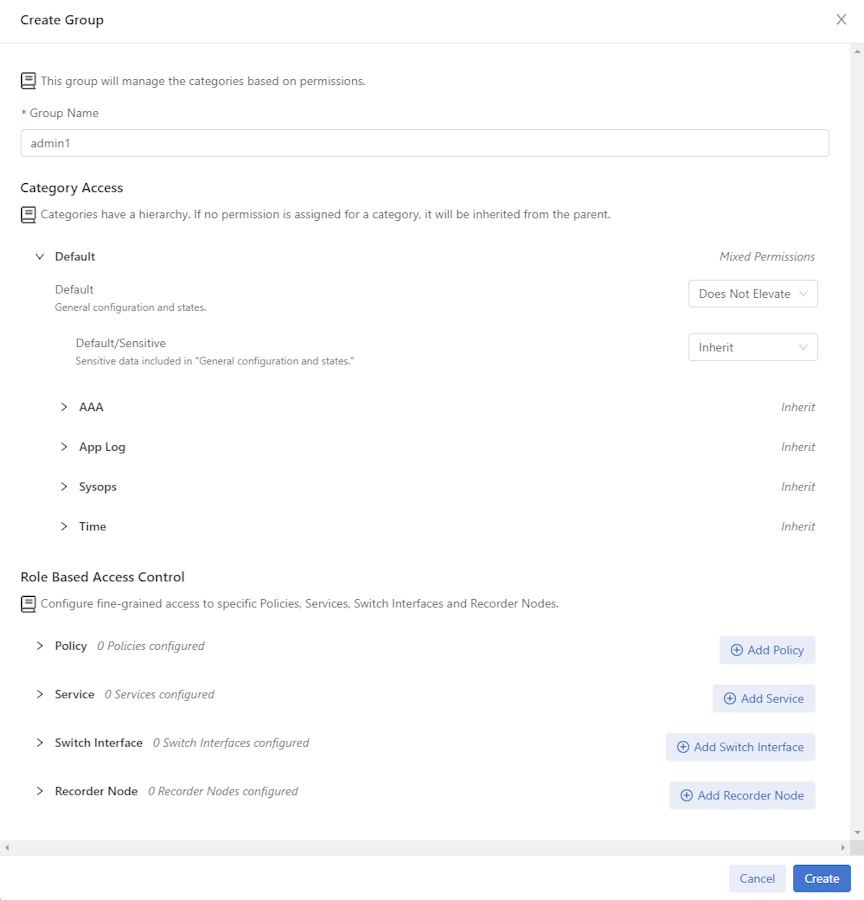
- Select the Recorder Node from the selection list, and assign the permissions required.
- Read: The user can view recorded packets.
- Use: The user can define and run queries.
- Configure: The user can configure packet recorder instances and interfaces.
- Export: The user can export packets to a different device.
Figure 19. Associate Recorder Node 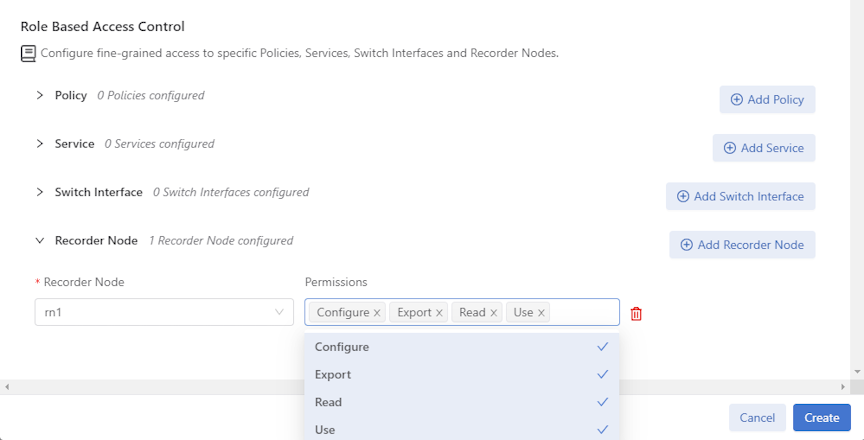
Using the CLI to View Information About a Recorder Node
This section describes monitoring and troubleshooting the Recorder Node (RN) status and operation. The RN stores packets on the main hard disk and the indices on the SSD volumes.
Viewing the Recorder Node Interface
controller-1(config)# show topology recorder-node
# DMF IF Switch IFName State SpeedRate Limit
-|------------|----------|----------|-----|------|----------|
1 RecNode-Intf Arista7050 ethernet1up25Gbps -
Viewing Recorder Node Operation
controller-1# show recorder-node device packet-rec-740 interfaces stats
Packet Recorder Name Rx Pkts Rx BytesRx DropRx Errors Tx PktsTx Bytes Tx Drop Tx Errors
---------------|----|-------------|---------------|--------|---------|--------|----------|-------|---------|
packet-rec-740pri1 2640908588614 172081747460802 84204084 0 24630503 3053932660 0 0Ctrl-2(config)# show policy PR-policy
Policy Name : PR-policy
Config Status : active - forward
Runtime Status : installed
Detailed Status : installed - installed to forward
Priority : 100
Overlap Priority : 0
# of switches with filter interfaces : 1
# of switches with delivery interfaces : 1
# of switches with service interfaces : 0
# of filter interfaces : 1
# of delivery interfaces : 1
# of core interfaces : 0
# of services : 0
# of pre service interfaces : 0
# of post service interfaces : 0
Push VLAN : 1
Post Match Filter Traffic : 1.51Gbps
Total Delivery Rate : 1.51Gbps
Total Pre Service Rate : -
Total Post Service Rate : -
Overlapping Policies : none
Component Policies : none
Installed Time : 2023-09-22 12:16:55 UTC
Installed Duration : 3 days, 4 hours
~ Match Rules ~
# Rule
-|-----------|
1 1 match any
~~~~~~~~~~~~~~~~~~~~~~~~~~~~~~~~~~~~~~~~~~~~~~~~~~~~~~ Filter Interface(s) ~~~~~~~~~~~~~~~~~~~~~~~~~~~~~~~~~~~~~~~~~~~~~~~~~~~~~~
# DMF IF Switch IF Name State Dir Packets Bytes Pkt Rate Bit Rate Counter Reset Time
-|-----------|-------------------|---------|-----|---|-----------|--------------|--------|--------|------------------------------|
1 Lab-traffic Arista-7050SX3-T3X5 ethernet7 up rx 97831460642 51981008309480 382563 1.51Gbps 2023-09-22 12:16:55.738000 UTC
~~~~~~~~~~~~~~~~~~~~~~~~~~~~~~~~~~~~~~~~~~~~~~~~~~~~~~~~ Delivery Interface(s) ~~~~~~~~~~~~~~~~~~~~~~~~~~~~~~~~~~~~~~~~~~~~~~~~~~~~~~~~
# DMF IF Switch IF Name State Dir Packets Bytes Pkt Rate Bit Rate Counter Reset Time
-|---------------|-------------------|----------|-----|---|-----------|--------------|--------|--------|------------------------------|
1 PR-intf Arista-7050SX3-T3X5 ethernet35 up tx 97831460642 51981008309480 382563 1.51Gbps 2023-09-22 12:16:55.738000 UTC
~ Service Interface(s) ~
None.
~ Core Interface(s) ~
None.
~ Failed Path(s) ~
None.
Ctrl-2(config)# Viewing Errors and Warnings
- show fabric errors
- show fabric warnings
- show recorder-node errors
- show recorder-node warnings
| Type | Condition | Cause | Resolution |
|---|---|---|---|
| Error | Recorder Node (RN) management link down. | RN has not received controller LLDP. | Wait 30s if the recorder node is newly configured. Verify it is not connected to a switch port that is a DANZ Monitoring Fabric (DMF) interface. |
| Error | RN fabric link down. | Controller has not received RN LLDP. | Wait 30s if recorder node is newly configured. Check it is online otherwise. |
| Warning | Disk/RAID health degraded. | Possible hardware degradation. | Investigate specific warning reported. Could be temperature issue. Possibly replace indicated disk soon. |
| Warning | Low disk space. | Packet or index disk space has risen above threshold. | Prepare for disk full soon. |
| Warning | Disk full. | Packet or index disk space is full. Packets are being dropped or rotated depending on removal policy. | Do nothing if removal policy is rolling-FIFO. Consider erasing packets to free up space otherwise. |
| Warning | Recorder misconfiguration on a DMF interface. | A recorder node has been detected in the fabric on a switch interface that is configured as a filter or delivery interface. | Remove the conflicting interface configuration, or re-cable the recorder node to a switch interface not defined as a filter or delivery interface. |
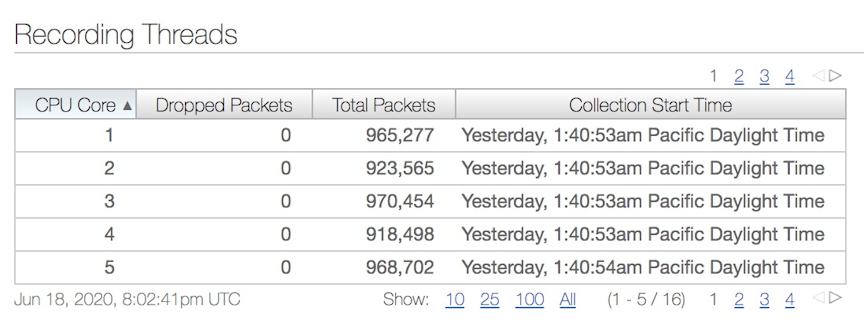
Using the GUI to View Recorder Node Statistics
View Recorder Node (RN) statistics by clicking the RN alias from the page.

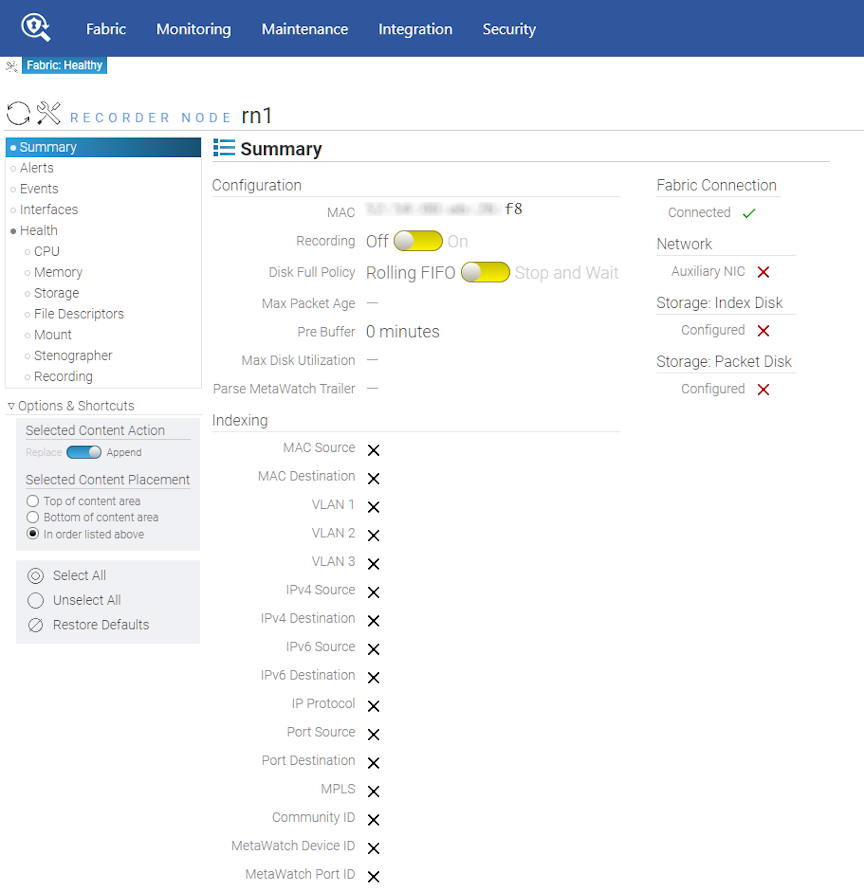
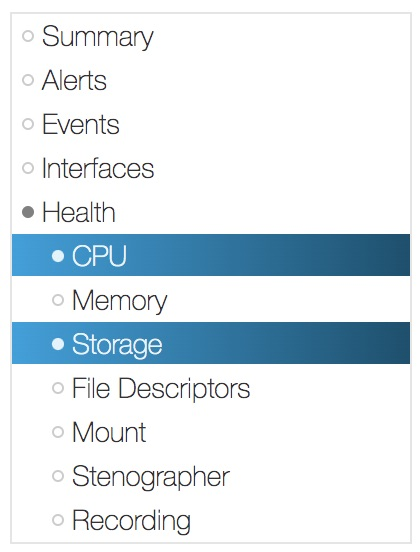
The RN shows health statistics for the following:
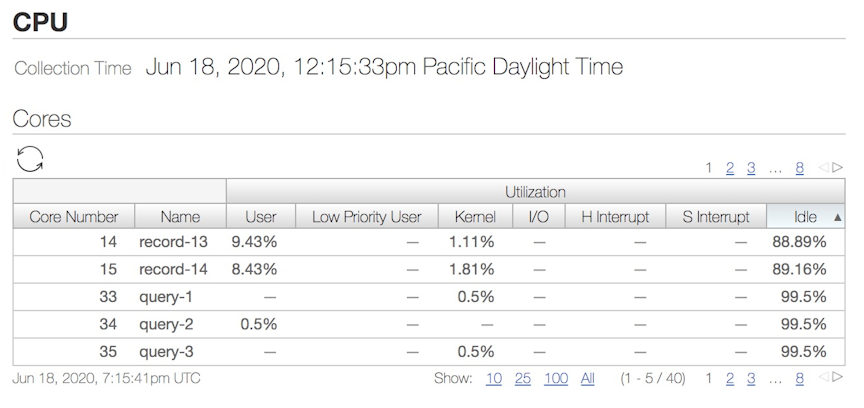
CPU: CPU health displays the compute resource utilization of the recorder node.
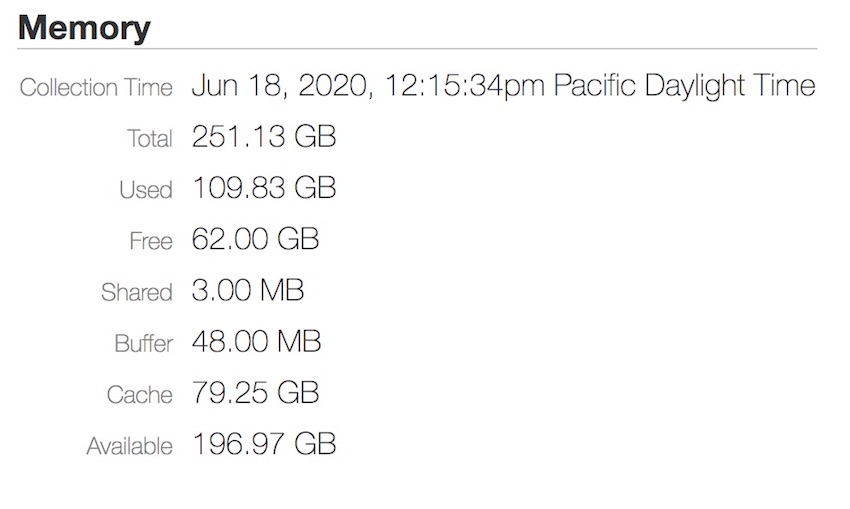
Memory: DMF displays memory-related stats such as total memory, used, free, available, etc.
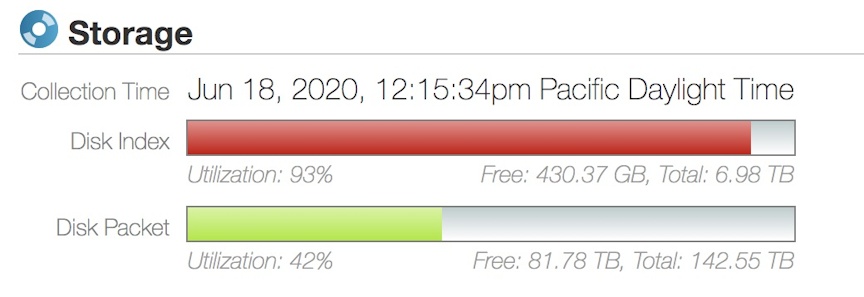
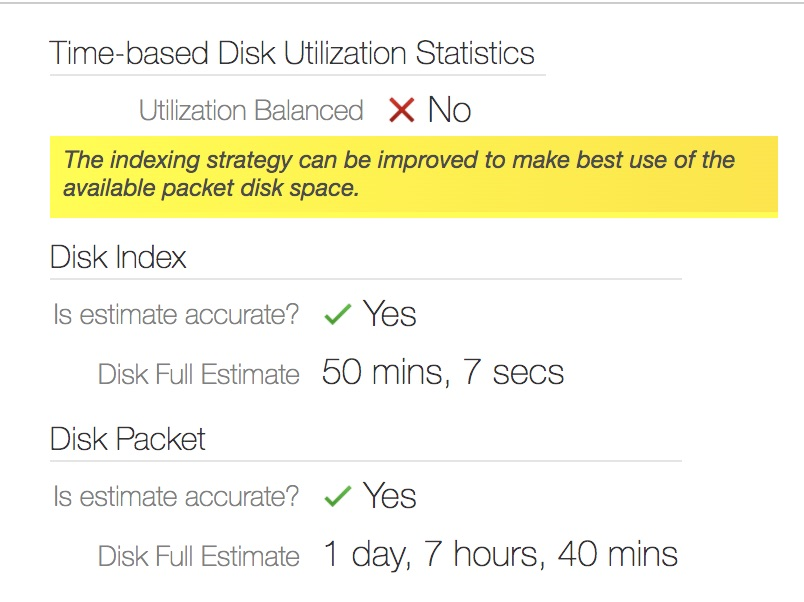
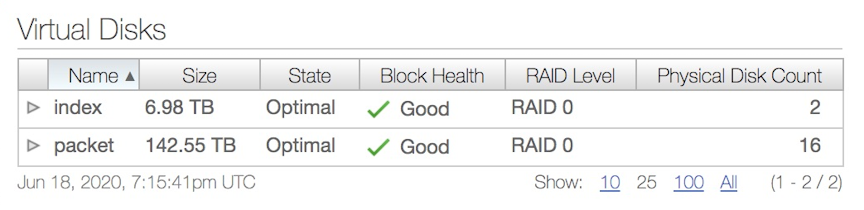
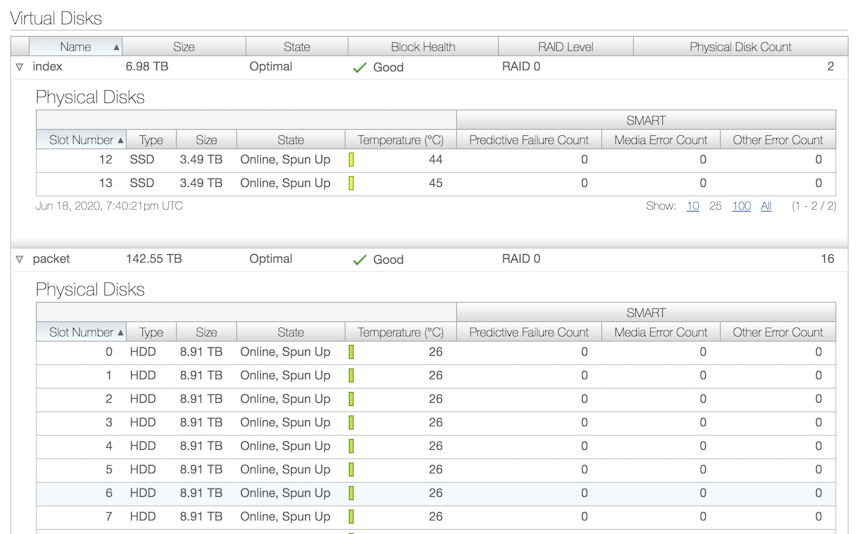
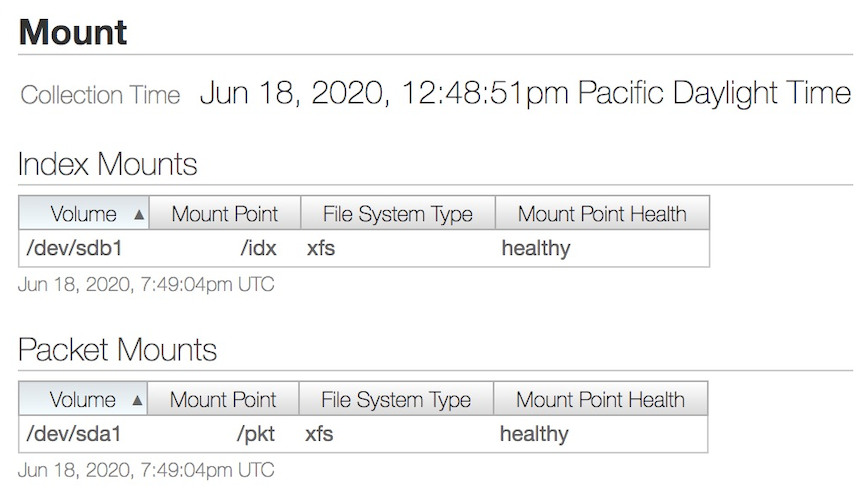
Virtual Disks: Virtual Disk's health stats display the Index and Packet virtual disks' size, state, health, and RAID level configuration.
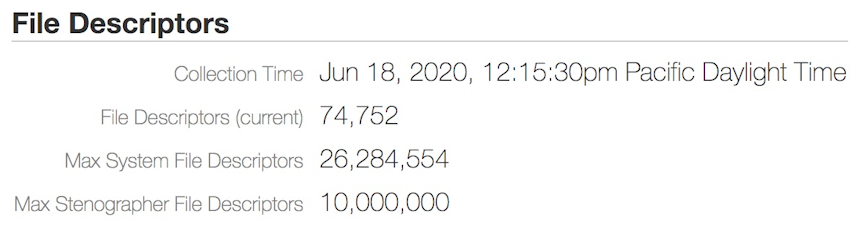
- File Descriptors (current): Current number of files open in the entire system.
- Max System File Descriptors: Highest number of open files allowed on the entire system.
- Max Stenographer File Descriptors: Highest number of open files allowed for Stenographer application.
Stenographer: Stenographer Statistics are displayed as follows:
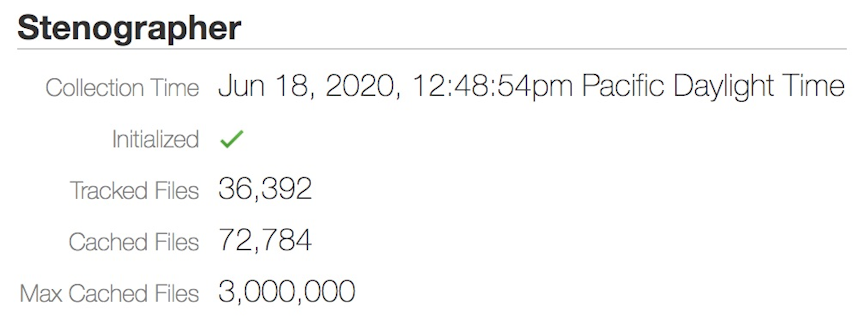
- Initialized: Displays the Stenographer application running state. A green check mark indicates the application was successfully initialized. When the Stenographer application starts, a red x mark appears and disallows recording and querying during this time, which is expected behavior.
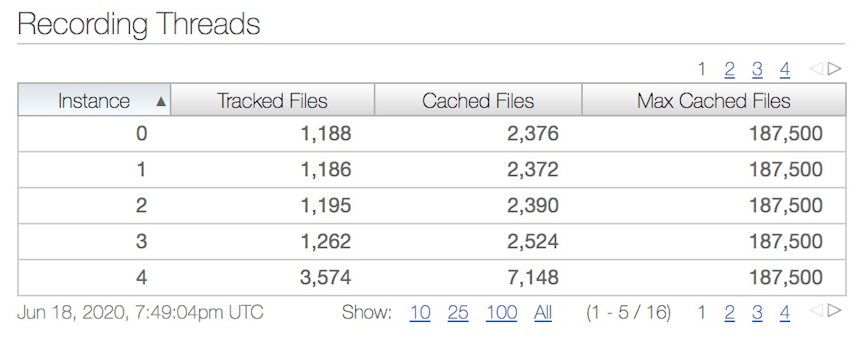
- Tracked Files: Tracked files are the total number of files stored under each CPU instance thread.
- Cached Files: Cached files are the number of open files with a file descriptor.
- Max Cached Files: The maximum cached files are the total openable files allowed.

Changing the Recorder Node Default Configuration
controller-1(config)# recorder-node device <instance>Replace instance with the alias to use for the RN. This alias is affiliated with the MAC hardware address using the mac command.
config-recorder-node submode to override the default configuration for the associated RN:
- banner: Set the RN pre-login banner message
- mac: Configure the MAC address for the RN
- ntp: Configure RN to override default timezone and NTP parameters.
- snmp-server: Configure RN SNMP parameters and traps.
- logging: Enable RN logging to Controller.
- tacacs: Set TACACS defaults, server IP address(es), timeouts and keys.
- ntp override-global: Override global time configuration with RN time configuration.
- snmp-server override-global: Override global SNMP configuration with RN SNMP configuration.
- snmp-server trap override-global: Override global SNMP trap configuration with RN SNMP trap configuration.
- logging override-global: Override global logging configuration with packet recorder logging configuration.
- tacacs override-global: Override global TACACS configuration with RN TACACS configuration.
- ntp merge-global: Merge global time configuration with RN time configuration.
- snmp-server merge-global: Merge global SNMP configuration with RN SNMP configuration.
- snmp-server trap merge-global: Merge global SNMP trap configuration with RN SNMP trap configuration.
- logging merge-global: Merge global logging configuration with RN logging configuration.
TACACS configuration does not have a merge option. It can either be inherited from the DMF Controller or overridden to use only the RN-specific configuration.
Large PCAP Queries
Access the RN via a web browser to run large PCAP queries to the Recorder Node (RN). This allows running packet queries directly to the RN without specifying the maximum byte or packet limit for the PCAP file (which is required when executing the query from the DANZ Monitoring Fabric (DMF) Controller).
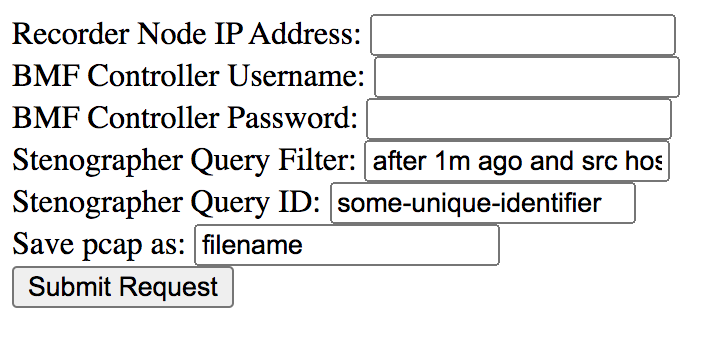
- Recorder Node IP Address: Enter the target RN IP address.
- DMF Controller Username: Provide the DMF Controller username.
- DMF Controller Password: Provide the password for authentication.
- Stenographer Query Filter: Use the query filter to filter the query results to look for specific packets. For example, to search for packets with a source IP address of 10.0.0.145 in the last 10 minutes, use the following filter:
after 10m ago and src host 10.0.0.145 - Stenographer Query ID: Starting in DMF 8.0, a Universally Unique Identifier (UUID) is required to run queries. To generate a UUID, run the following command on any Linux machine and use the result as the Stenographer query ID:
$ uuidgen b01308db-65f2-4d7c-b884-bb908d111400 - Save pcap as: Provide the file name for this PCAP query result.
- Submit Request: Sends a query to the specified RN and saves the PCAP file with the provided file name to the default download location for the browser.
Recorder Node Management Migration L3ZTN
pre-configure.To migrate management to a new Controller, follow the steps below:
- Once the RN is back online, the DMF Controller receives the ZTN request.

- Verify the addition of the RN to the new DMF Controller using the command below:
Recorder Node CLI
The following commands are available from the Recorder Node (RN):
RecNode(config)# show version
Controller Version : DMF Recorder Node 8.1.0 (bigswitch/enable/dmf-8.1.x #5)
RecNode(config)#RecNode(config)# show controllers
controllerRole State Aux
---------------------|------|---------|---|
tcp://10.106.8.2:6653 master connected 0
tcp://10.106.8.3:6653 slaveconnected 0
tcp://10.106.8.3:6653 slaveconnected 1
tcp://10.106.8.3:6653 slaveconnected 2
tcp://10.106.8.2:6653 master connected 1
tcp://10.106.8.2:6653 master connected 2
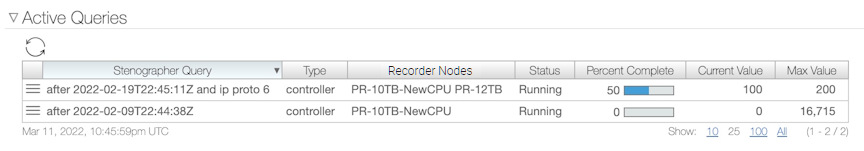
RecNode(config)#Multiple Queries
Use the GUI to run multiple Recorder Node (RN) queries.
To run queries on recorded packets by the RN, navigate to the page.

Ability to Deduplicate Packets - Query from Recorder Node
For Recorder Node queries, the recorded packets matching a specified query filter may contain duplicates when packet recording occurs at several different TAPs within the same network; i.e., as a packet moves through the network, it may be recorded multiple times. The dedup feature removes duplicate packets from the query results. By eliminating redundant information, packet deduplication improves query results' clarity, accuracy, and conciseness. Additionally, the dedup feature significantly reduces the size of query results obtained from packet query types.
Using the CLI to Deduplicate Packets
In the DANZ Monitoring Fabric (DMF) Controller CLI, packet deduplication is available for the packet data, packet object, size, and replay query types. Deduplication is off by default for these queries. Add the dedup option to the end of the query command after all optional values (if any) have been selected to enable deduplication.
The following are command examples of enabling deduplication.
Enabling deduplication for a size query:
controller# query recorder-node rn size filter “before 5s ago” dedupEnabling deduplication for a packet data query specifying a limit for the size of the PCAP file returned in bytes:
controller# query recorder-node rn packet-data filter “before 5s ago” limit-bytes 2000 dedupEnabling deduplication for a replay query:
controller# replay recorder-node rn to-delivery dintf filter “before 5s ago” dedupEnabling deduplication for a replay query specifying the replay rate:
controller# replay recorder-node rn to-delivery dintf filter “before 5s ago” replay-rate 100 dedupSpecify a time window (in milliseconds) for deduplication. The time window defines the time required between timestamps of identical packets to no longer be considered duplicates of each other. For example, for a time window of 200 ms, two identical packets with timestamps that are 200 ms (or less) apart are duplicates of each other. In contrast, if the two identical packets had timestamps more than 200 ms apart, they would not be duplicates of each other.
The time window must be an integer between 0 and 999 (inclusive) with a default time window of 200 ms when deduplication is enabled and no set time window value.
To configure a time window value, use the dedup-window option followed by an integer value for the time window after the dedup option.
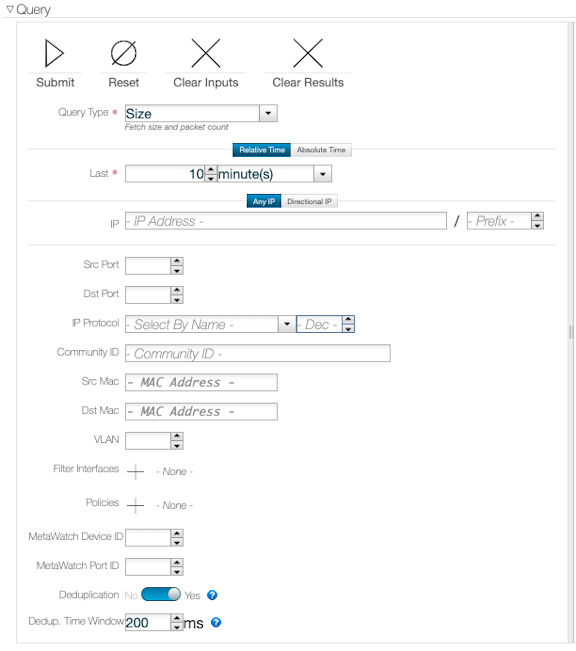
controller# query recorder-node rn size filter “before 5s ago” dedup dedup-window 150Using the GUI to Deduplicate Packets
- Set the toggle switch deduplication to Yes in the query submission window.
- Specify an optional time window (in milliseconds) as required by entering an integer between 0 and 999 (inclusive) into the Deduplication Time Window field. The time window will default to 200 ms if the time window value is unset.
- Click Submit to continue.
Limitations
Expect a query with packet deduplication enabled to take longer to complete than packet deduplication disabled. Hence, packet deduplication, by default, is off.
The maximum time window value permitted is 999 ms to ensure that TCP retransmissions are not regarded as duplicates, assuming that the receive timeout value for TCP retransmissions (of any kind) is at least 1 second. If the receive timeout value is less than 1 second (particularly, exactly 999 ms or less), then it is possible for TCP retransmissions to be regarded as duplicates when the time window value used is larger than the receive timeout value.
Due to memory constraints, removing some duplicates may not occur as expected. This scenario is likely to occur if a substantial amount of packets match the query filter, which all have timestamps within the specified time window from each other. We refer to this scenario as the query having exceeded the packet window capacity. To mitigate this from occurring, decrease the time window value or use a more specific query filter to reduce the number of packets matching the query filter at a given time.
Enabling Egress sFlow® on Recorder Node Interfaces
Enable egress sFlow®* to sample traffic sent to any DANZ Monitoring Fabric (DMF) Recorder Node (RN) attached to the fabric. Examining these sampled packets on a configured sFlow collector allows the identification of post-match-rule flows recorded by the RNs without performing a query against the RNs. While not explicitly required, Arista Networks highly recommends using the DMF Analytics Node (AN) as the configured sFlow collector, as it can automatically identify packets sampled utilizing this feature.
Platform Compatibility
All platforms apart from the following series:
- DCS-7280R
- DCS-7280R2
- DCS-7500R
- DCS-7020
- DCS-7050X4
Configuration
Using the CLI to Enable Egress sFlow
The egress sFlow feature requires a configured sFlow collector. After configuring the sFlow collector, enter the following command from the config mode to enable the feature:
Controller-1(config)# recorder-node sflowTo disable the feature, enter the command:
Controller-1(config)# no recorder-node sflowUsing the GUI to Enable Egress sFlow
Using the GUI
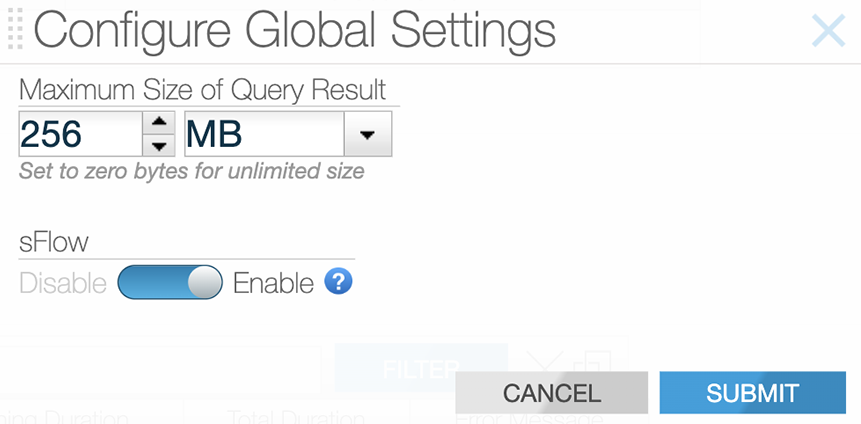
After configuring the fabric for sFlow and setting up the sFlow collector, navigate to the page. Under the Global Configuration section, click the Configure global settings button.
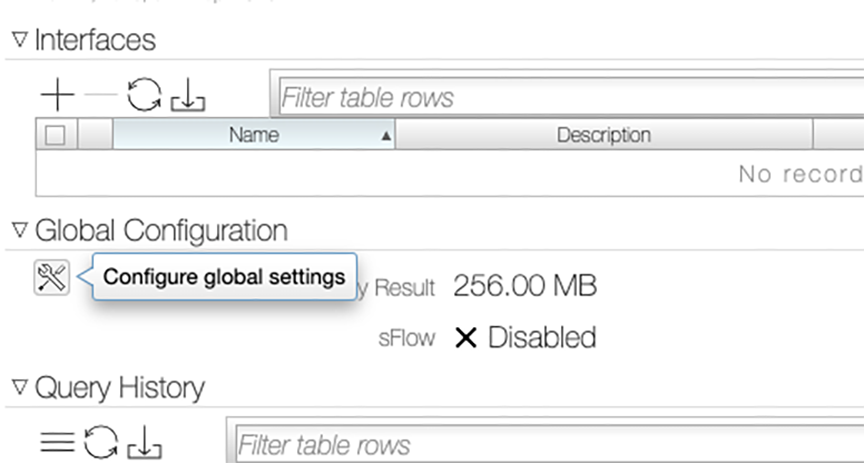
In the Configure Global Settings pop-up window, enable the sFlow setting and click Submit.
Analytics Node
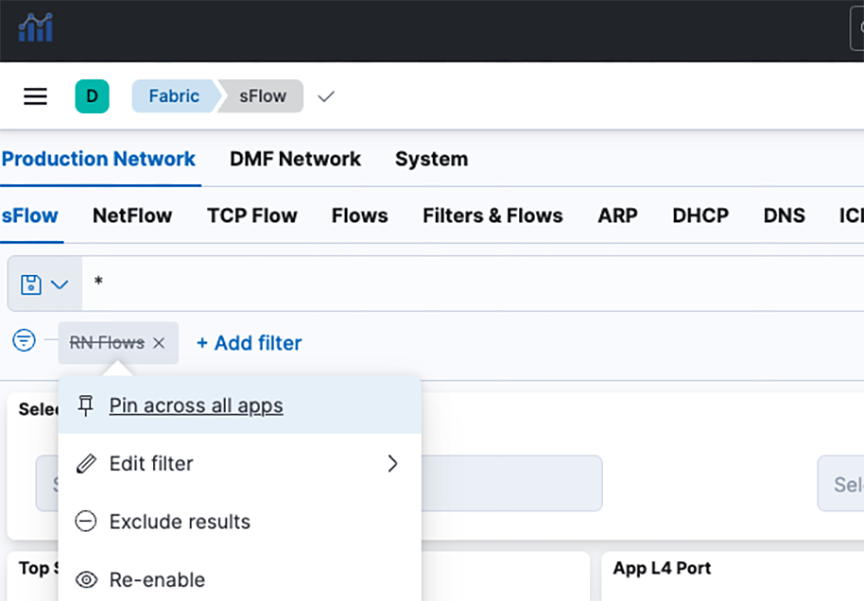
When using a DMF Analytics Node as the sFlow collector, it has a dashboard to display the results from this feature. To access the results:
- Navigate to the sFlow dashboard from the Fabric dashboard.
- Select the disabled RN Flows filter.
- Select the option to Re-enable the filter, as shown below.
Troubleshooting Egress sFlow Configurations
Switches not affiliated with a sFlow collector (either a global sFlow collector or a switch-specific sFlow collector) do not have an active feature even if the feature is enabled. Ensure the fabric is set up for sFlow and a configured sFlow collector exists. To verify that a configured global sFlow collector exists, use the command:
Controller-1# show sflow default A configured collector appears as an entry in the table under the column labeled collector. Alternatively, to verify a configured collector exists for a given switch, use the command:
Controller-1#show switch switch-name table sflow-collectorThis command displays a table with one entry per configured collector.
A feature-unsupported-on-device warning appears when connecting an unsupported switch to an RN. The feature does not sample packets passing to an RN from an unsupported switch. View any such warnings using the GUI or using the following CLI command:
Controller-1#show fabric warnings feature-unsupported-on-deviceTo verify the feature is active on a given switch, use the command:
Controller-1#show switch switch-name table sflow-sampleIf the feature is enabled, the entry values associated with the ports connected to an RN would include an EgressSamplingRate(number) with a number greater than 0. The following example illustrates Port(1) on <switch-name> connecting to an RN.
Controller-1# show switch <switch-name> table sflow-sample
#Sflow-sample Device nameEntry key Entry value
--|------------|---------------|---------|----------------------------------------------------------------------------------|
5352 <switch-name>Port(1) SamplingRate(0), EgressSamplingRate(10000), HeaderSize(128), Interval(10000)
Guidelines and Limitations for Enabling Egress sFlow
Consider the following guidelines and limitations while enabling Egress sFlow:
- The Egress sFlow support for the Recorder Nodes (RN) feature requires a configured sFlow collector in a fabric configured to allow sFlows.
- If a packet enters a switch through a filter interface with sFlow enabled and exits through a port connected to an RN while the feature is enabled, only one sFlow packet (i.e., the ingress sFlow packet) is sent to the collector.
- The Egress sFlow feature does not identify which RN has recorded a given packet in a fabric when there are multiple RNs. This is fine in a normal case as the queries are issued to the RNs in aggregate rather than to individual RNs, and hence, the information that any RN has received a packet is sufficient. In some cases, it may be possible to make that determination from the outport of the sFlow packet, but that information may not be available in all cases. This is an inherent limitation of egress sFlow.
- An enabled egress sFlow feature captures the packets sent to any RN with recording enabled, regardless of whether the RN is actively recording or not.
Recorder Node Recording State API
The Recorder Node (RN) recording statistics API on the DANZ Monitoring Fabric (DMF) Controller includes information about the operational state of the ongoing recording.
The information is available in device/state/packet-recorder/recording/recording-state where recording-state is the container holding the opstate information.
name and type to be provided at the device to select a specific RN device to display state information.Within the container, there are the following two values:
state: an enumeration describing the recording opstate that has one of the following values:initializing,ready,active, andstopped.description: a string describing the state in more detail.
The following table lists the possible recording state values and describes how to interpret each scenario.
state |
description |
Interpretation |
|---|---|---|
initializing |
Recording application syncing files, {}%
complete. |
The application is synchronizing previously recorded packets, so it cannot record yet. The formatted value is the percentage of synchronization completed so far. |
initializing |
Recording application is starting up. |
The application has finished synchronization and is now completing the setup for recording. |
ready |
Ready to record, no recordable traffic
received. |
No traffic has been received after the application completed initializing. |
active |
Recording traffic. |
Traffic is being received and recorded to disk. |
stopped |
Recording threads not running. |
Recording threads were interrupted or terminated, so recording has stopped. |
stopped |
Recording not enabled. |
Recording is not enabled, and packets are not recorded. |
stopped |
Disk space exhausted with stop-and-wait mode configured.
Awaiting user input. |
Recording has stopped as disk space has been exhausted, and the removal policy has been configured as stop-and-wait. Delete packets to resume recording. |
stopped |
Recording state not found. |
The recording application isn’t running, so there is no recording state information. |
active is considered to be inactive. This is not necessarily indicative of a problem. However, you should take action accordingly using the provided interpretations.Additionally, the type of logical disk volume used by each recording thread is part of the RN recording statistics API on the DMF Controller.
This information is available in device/state/packet-recorder/recording/recording-thread/disk where a disk is an enumeration having one of two values, primary or backup, if the thread is recording to the primary or backup configured logical disk volume, respectively. This is a simplified version of the path. The disk type does not imply whether the disk volume is local or remote, as the storage configuration determines this.
Show Commands
The show recorder-node device <rn name> recording-health command includes the state from the recording state and the disk type for each recording thread. Use the details option of this command to view the description of the recording state in addition to the previously stated information.
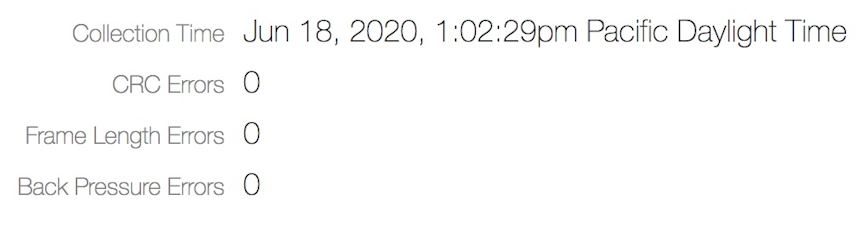
C1> show recorder-node device <rn name> recording-health
~~~~~~~~~~~~~~~~ Recording Application~~~~~~~~~~~~~~~~
Recording Collection Time: 2024-04-23 15:12:30 UTC
Recording CRC Errors : 0
Recording Frame Length Errors: 0
Recording Back Pressure Errors : 0
Recording Undersized Frames: 0
Recording Frames 64B : 0
Recording Frames 65-127B : 0
Recording Frames 128-255B: 0
Recording Frames 256-511B: 0
Recording Frames 512-1023B : 0
Recording Frames 1024-1522B: 0
Recording Frames 1523-9522B: 0
Recording Oversized Frames : 0
Recording state: Active

~~~~~~~~~~~~~~~~~~~~~~~ Recording Instance~~~~~~~~~~~~~~~~~~~~~~~
Core DiskDropped Packets Total Packets Collection Start Time
----|-------|---------------|-------------|-----------------------|
1primary 0 204 2024-04-23 15:00:34 UTC
C1> show recorder-node device <rn name> recording-health details
~~~~~~~~~~~~~~~~ Recording Application~~~~~~~~~~~~~~~~
Recording Collection Time: 2024-04-23 15:12:30 UTC
Recording CRC Errors : 0
Recording Frame Length Errors: 0
Recording Back Pressure Errors : 0
Recording Undersized Frames: 0
Recording Frames 64B : 0
Recording Frames 65-127B : 0
Recording Frames 128-255B: 0
Recording Frames 256-511B: 0
Recording Frames 512-1023B : 0
Recording Frames 1024-1522B: 0
Recording Frames 1523-9522B: 0
Recording Oversized Frames : 0
Recording state: Active
Recording state Details: Recording traffic.
~~~~~~~~~~~~~~~~~~~~~~~ Recording Instance~~~~~~~~~~~~~~~~~~~~~~~
Core DiskDropped Packets Total Packets Collection Start Time
----|-------|---------------|-------------|-----------------------|
1primary 0 204 2024-04-23 15:00:34 UTCC1> show recorder-node device <rn name> recording-health
~~~~~~~~~~~~~~~~ Recording Application~~~~~~~~~~~~~~~~
Recording Collection Time: 2024-04-23 15:12:30 UTC
Recording CRC Errors : 0
Recording Frame Length Errors: 0
Recording Back Pressure Errors : 0
Recording Undersized Frames: 0
Recording Frames 64B : 0
Recording Frames 65-127B : 0
Recording Frames 128-255B: 0
Recording Frames 256-511B: 0
Recording Frames 512-1023B : 0
Recording Frames 1024-1522B: 0
Recording Frames 1523-9522B: 0
Recording Oversized Frames : 0
Recording state: Active
~~~~~~~~~~~~~~~~~~~~~~~ Recording Instance~~~~~~~~~~~~~~~~~~~~~~~
Core DiskDropped Packets Total Packets Collection Start Time
----|-------|---------------|-------------|-----------------------|
1backup0 204 2024-04-23 15:00:34 UTCC1> show recorder-node device <rn name> recording-health details
~~~~~~~~~~~~~~~~ Recording Application~~~~~~~~~~~~~~~~
Recording Collection Time: 2024-04-23 15:12:30 UTC
Recording CRC Errors : 0
Recording Frame Length Errors: 0
Recording Back Pressure Errors : 0
Recording Undersized Frames: 0
Recording Frames 64B : 0
Recording Frames 65-127B : 0
Recording Frames 128-255B: 0
Recording Frames 256-511B: 0
Recording Frames 512-1023B : 0
Recording Frames 1024-1522B: 0
Recording Frames 1523-9522B: 0
Recording Oversized Frames : 0
Recording state: Active
Recording state Details: Recording traffic.
~~~~~~~~~~~~~~~~~~~~~~~ Recording Instance~~~~~~~~~~~~~~~~~~~~~~~
Core DiskDropped Packets Total Packets Collection Start Time
----|-------|---------------|-------------|-----------------------|
1backup0 204 2024-04-23 15:00:34 UTC
show recorder-node warnings command includes nonactive RN warnings if any exist.
C1> show recorder-node warnings

~ RAID Health Warning(s) ~
None.

~ Low Disk Space Warning(s) ~
None.

~ Full Disk Warning(s) ~
None.

~~~~~~~~~~~~~~~~~~~~~~~~~~~~~~~ Non Active Recorder Node Warning(s) ~~~~~~~~~~~~~~~~~~~~~~~~~~~~~~~
# Recorder Node Message
-|-------------|----------------------------------------------------------------------------------|
1 rn1 Inactive Recording State: Ready - Ready to record, no recordable traffic received.
Limitations
The ready state only occurs after the recording application has finished initializing if no recordable traffic has been received yet. The recording application must undergo its initialization process whenever the RN is rebooted, restarted, or after restarting the RN application from the DMF Controller. If the RN is in the active state and stops receiving packets, it will not regress into the ready state; it will remain in the active state.