Reports
- ETM Dashboard Reports
ETM Dashboard enables you to view consolidated reports from all networks managed through your account. The reporting data includes bandwidth usage and web activities.
ETM Dashboard Reports
ETM Dashboard enables you to view consolidated reports from all networks managed through your account. The reporting data includes bandwidth usage and web activities.
Viewing Reports
- Log in to ETM Dashboard.
- Navigate to the Reports tab.
- Select the report you want to view.
Filtering and sorting data
You can refine the data in the grids below the charts. For example, if you want to view reporting data only from a specific appliance. To sort columns or filter the data, click the three horizontal lines at the right-hand side of the header to expose the menu.

Report Types
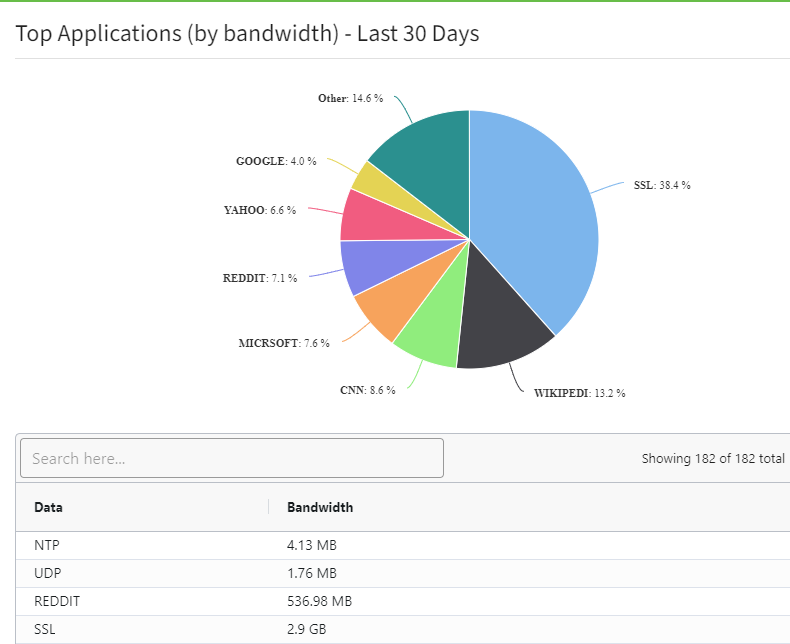
Bandwidth Control - Top Application (by bandwidth) provides you with the applications that are using the most bandwidth.
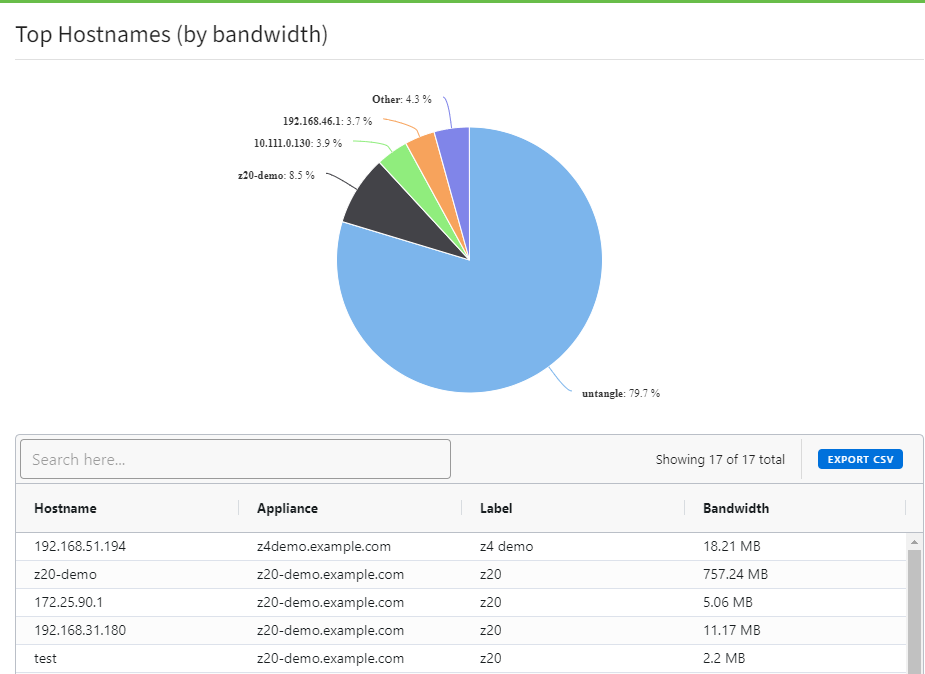
Hosts - Top Hostnames (by bandwidth) This report displays information about hostnames that are using the most bandwidth.
Network - Total Bandwidth - Last 30 Days provides you with a quick glance at the total bandwidth passing through this appliance over the last 30 days.

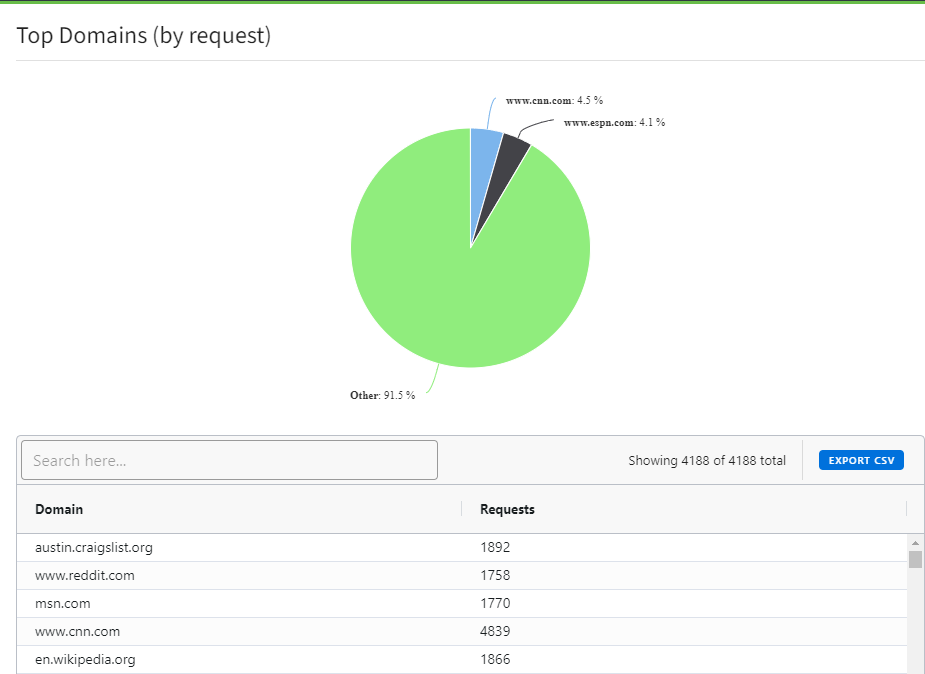
Web Filter - Top Domains (by request) provides the top requested domains, blocked categories, blocked sites, and blocked hostnames.