Setting Up the Arista Analytics Node
- Requirements
- Arista Analytics Node First Boot Configuration
- Using the Arista Analytics Server CLI
- Enabling Access Control to the Analytics Server
- Importing the Controller Private Key and Certificate
- Using Certificates Signed by a CA for GUI Access to the Controller
- Configuring sFlow®
- Managing the Arista Analytics Server Software
- Accessing and Configuring Arista Analytics
- Configuring Advanced Features
- Integrating Analytics with Infoblox
- Configuring SMTP Server to Send Email Alerts via Watcher
Requirements
- IP address and netmask to assign to the Analytics server
- Default IP gateway
- DNS server IP address (optional)
- DNS Search Domain (optional)
- Admin password for the Analytics server
- NTP server IPv4 address
- Password for Analytics GUI admin user (optional)
- TACACS+ Server IPv4 Address (optional)
- TACACS+ secret (optional)
- TACACS+ Server Service (optional)
- IP addresses for the DMF Controllers
Note: If the Arista Analytics node is deployed along with DMF, ensure that the version running on the Arista Analytics node is the same as that running on the DMF Controllers. Running different versions on the Arista Analytics node and DMF Controllers is not supported.
The ports in the following table should be open on security devices between the Controller or switches and the Arista Analytics server, as noted in the table.
| Monitoring | Port Requirement | Explanation |
|---|---|---|
| NetFlow | UDP 2055 | The production network or the DANZ Monitoring Fabric exports the Flow data to the Analytics node in NetFlow v5 format. |
| IPFIX | UDP 4739 | The production network or the DANZ Monitoring Fabric exports the Flow data to the Analytics node inIPFIX/NetFlow v10 format. |
| sFlow®* | UDP 6343 between switches and Analytics server | The filter interfaces sample packets, and the SwitchLight OS sFlow agent constructs the sFlow header and forwards it to the Analytics server and other sFlow collectors for processing. |
| Host-tracker information | UDP 6380 between switches and Analytics server | Each switch forwards the ARP, DNS, and other control traffic to the Analytics server. It prepends a private header with a timestamp in the process. The Analytics server processes packets and maintains the host tracking database. The Controller queries the Analytics server for the latest host table. |
| DMF statistics and events | UDP 9379 (Redis) between Controller and Analytics server | Redis database sends the statistics gathered by the Controller from switches and service nodes to the Analytics server. |
| DMF statistics and events (cluster) | UDP 6379 (replicated Redis) between Controller and Analytics server | Replicated Redis gathers information with a DMF Controller cluster. |
| Monitoring Active Directory or Open VPN | UDP 5043 | Analytics is used to monitor the active directory or open VPN. |
Arista Analytics Node First Boot Configuration
Complete the following steps to configure Arista Analytics.
Using the Arista Analytics Server CLI
Starting in the DMF 7.0 release, administrative access to Arista Analytics and other server-level operations, such as configuring sFlow and creating a support bundle, are completed on the DMF Active Controller. For details, refer to the latest version of the DANZ Monitoring Fabric Deployment Guide, available here: https://www.arista.com/en/support/software-download/dmf-ccf-mcd.
Using the Analytics server CLI after logging in to the Analytics server at the address assigned during the first boot configuration, you can perform operations specific to Arista Analytics.
The Analytics CLI provides a subset of the commands available on the DMF Controller. For details about any command, enter Help <command> or press the Tab to see the options available. Refer to the DANZ Fabric Command Reference Guide for information about the DMF Controller commands, which are similar to the Analytics commands.
analytics-1> Tab
debug exit logout ping6 show upload
echo help no reauth support watch
enable history ping set terminal whoamianalytics-1> enable
analytics-1# <Tab>
boot compare copy diagnose sync upgrade
clear configure delete reset systemanalytics-1# config
analytics-1(config)# <Tab>
aaa crypto local radius snmp-server version
banner end logging secure tacacs
cluster group ntp service userEnabling Access Control to the Analytics Server
- Configuring AN (Virtual IP) IP on the DMF Controller.
- Allowing DMF physical IPs under Redis/replicated ACL on the AN.
Complete the following steps to enable access to the Analytics server for Redis and replicated Redis.
Adding Access Control to GUI
This section describes adding an Access Control List (ACL) command to the DANZ Monitoring Fabric (DMF) supported commands family.
DMF-ANALYTICS-CLUSTER> enable
DMF-ANALYTICS-CLUSTER# configure
DMF-ANALYTICS-CLUSTER(config)# cluster
DMF-ANALYTICS-CLUSTER(config-cluster)# access-control
DMF-ANALYTICS-CLUSTER(config-cluster-access)# access-list
<Access list name> Enter an access list name: Enter an access list name
active-directory Configure access-list for active-directory
apiConfigure access-list for api
guiConfigure access-list for gui
ipfixConfigure access-list for ipfix
netflowConfigure access-list for netflow
redisConfigure access-list for redis
replicated-redis Configure access-list for replicated-redis
snmp Configure access-list for snmp
sshConfigure access-list for ssh
DMF-ANALYTICS-CLUSTER(config-cluster-access)#Importing the Controller Private Key and Certificate
This section describes how to import a private key and a certificate to the Controller after copying it to the Controller using the copy command.
private-key command in the config-controller submode:
[no] private-key <controller-key-name>Replace controller-key-name with the name of the private key. Use the no version of the command to remove the private-key.
[no] certificate <name>Replace the name with the name assigned to the Controller certificate. Use the no version of the command to remove the certificate.
Import the private key and certificate to the Controller using the copy command.
Using Certificates Signed by a CA for GUI Access to the Controller
Procedure
Replacing the Certificate
Scenario 1: Using the same CSR as the one used to sign the current certificate.
Obtain a newly signed certificate from CA using the same CSR and copy it to the Controller using the following command:
# copy new certificate from the source cert://# copy scp://This email address is being protected from spambots. You need JavaScript enabled to view it./root/openssl-ca/certificate.pem cert:// This email address is being protected from spambots. You need JavaScript enabled to view it. password certificate.pem
6.49KB - 00:00
# Scenario 2: The current certificate does not have the same CSR..
- Generate a new CSR and the private key.
- Sign the CSR to get the new certificate.
- Import/copy the certificate to the Controller. It overwrites the current certificate if the Common Name matches the new one.
- Import/copy the new private key to the Controller. It overwrites the private key if the file name is the same as the old one. In that case, there is no need for any config changes.
analytics-1(config)# controller
analytics-1(config-controller)# no certificate certificate name
analytics-1(config-controller)# no private-key private-key name
analytics-1(config-controller)#analytics-1(config)# controller
analytics-1(config-controller)# certificate new certificate name
analytics-1(config-controller)# private-key new private-key name
analytics-1(config-controller)#Configuring sFlow®
sFlow®* is an industry-standard technology, defined by RFC 3176, for monitoring high-speed switched networks. sFlow defines methods for sampling packets and counters in the data path and forwarding the results to a sFlow collector for analysis and display. The DANZ Monitoring Fabric (DMF) supports sFlow in capturing information about the production network and troubleshooting the monitoring fabric.
For information about advanced search and analysis of historical sFlow messages using the Arista Analytics Graphical User Interface (GUI), refer to the latest edition of the Arista Analytics User Guide.
- IP address and port number of one or more sFlow collectors: identifies one or more sFlow collectors to which to send the sFlow packets. The default UDP port number is 6343.
- Sample rate: specifies the number of packets to transmit before sending a sFlow packet. Sampling is enabled on all filter interfaces and disabled on core and delivery interfaces. The default sample is 1 packet per 10,000 packets.
If the sFlow collector is on a device external to the DANZ Monitoring Fabric, a static route to the collector must be configured on the external tenant logical router.
Using the DMF Controller GUI to Configure sFlow
To enable sFlow, add Analytics or other collectors, or change the default parameters, complete the following steps.
- To enable sFlow, select from the main menu.
Figure 1. sFlow Configuration 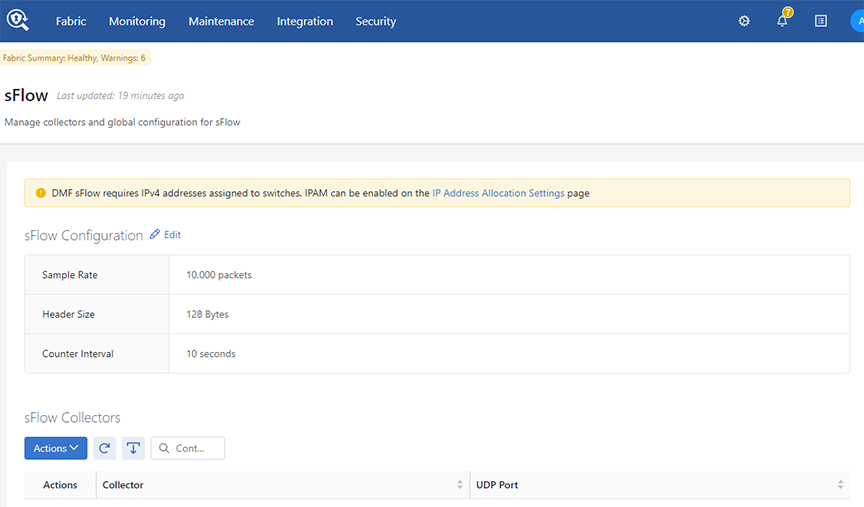
To view information about existing sFlow collectors, click the Expansion Control to the left of the entry on the Collectors table. The system displays details about the switch counters associated with the specific collector.
To activate or deactivate sFlow on a fabric-wide basis, click the Settings control to the left of the Configuration section and move the slider to Active to activate or Inactive to deactivate.
- You can add up to four sFlow collectors. To add a sFlow collector, first click the Provision control (+) in the upper left corner of the Collectors table.
Figure 2. Create sFlow Collector 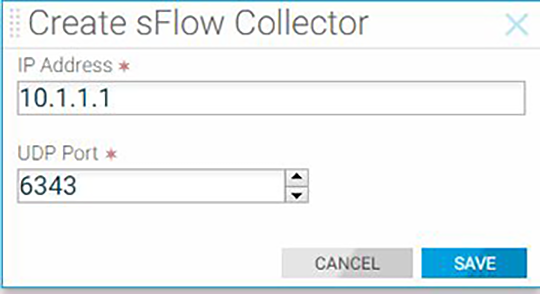
- (Optional) To view or change the default sFlow settings, select
Figure 3. Configure sFlow Settings Dialog 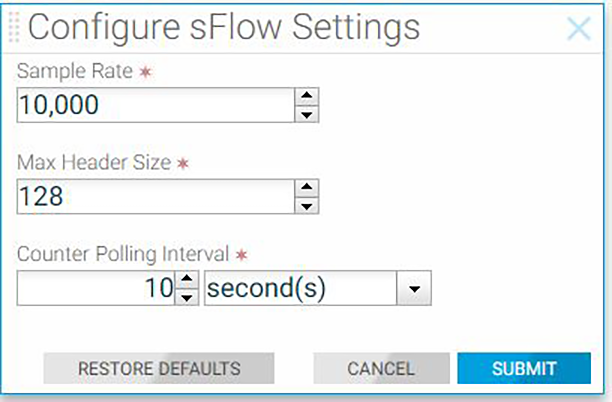
Using the DMF Controller CLI to Configure sFlow
dmf-Controller1(config)# sflow default
dmf-Controller1(config-sflow)# collector 10.106.1.57
This example configures the Analytics server with the IP address 10.106.1.57 and the default UDP port 6343 as a sFlow collector.
dmf-Controller-1(config-sflow)# collector 10.106.1.57 udp-port 6343The default UDP port is 6343. The collector command defines up to four collectors individually.
dmf-Controller-1(config)# show running-config sflow
! sflow
sflow
collector 10.106.1.57
collector 10.106.1.58
collector 10.106.1.59
counter-interval 10
header-size 128
sample-rate 100
dmf-Controller-1(config)#
Managing the Arista Analytics Server Software
This section describes operations for managing the Arista Analytics server.
Verifying the Analytics Server Version
analytics-1# show version
Controller Version : DMF Analytics Node 8.7.0 (bigswitch/analytics/dmf-8.7.0 #28)
Resetting to the Factory Default Configuration
analytics-1(config)# boot factory-default
boot factory-default: alternate partition will be overwritten
boot factory-default: proceed ("y" or "yes" to continue):
Password Reset
Resetting the Analytics Server Administrative Password
analytics-1# config
analytics-1(config)# reset user-password
Changing password for: admin
Current password:
New password:
Re-enter:
analytics-1(config)#
Resetting Password for Recovery User
To reset the recovery user's password, please follow one of the following procedures. The steps must be performed on both Controllers of the cluster, as resetting the recovery user's password on one Controller will not change it for the recovery user on the other Controller.
- Using Controller’s Bash:
- Go to Controller Bash by executing debugbash command.
- Execute sudo passwd recovery command.
admin@Controller-1:~$ sudo passwd recovery New password: Retype new password: passwd: password updated successfully admin@Controller-1:~$ - From recovery account login:
Note: The customer must know the recovery user's current password to work.
recovery@Controller-1:~$ passwd recovery Changing password for recovery. Current password: New password: Retype new password: passwd: password updated successfully recovery@Controller-1:~$ - Using the API/api/v1/rpc/Controller/os/action/system-user/reset-password:
The API call resets the recovery user’s password to AdminAdmin. The following example is using curl initiated from a Linux host, but you can use any REST client to call the API.
curl -g -H "Cookie: session_cookie=<session_cookie>" 'https://<Controller IP>:8443/api/v1/
rpc/Controller/os/action/system-user/reset-password' -d '{"user-name" : "recovery","password" : "AdminAdmin"}' -X POST
Resetting Password for Admin and Other Local Users
recovery@Controller-1:~$ floodlight-reset-password --user admin
Enter new admin password:
Re-enter new admin password:
Password updated for user admin
recovery@Controller-1:~$recovery@Controller-1:~$ floodlight-reset-password --user guest
Enter new guest password:
Re-enter new guest password:
Password updated for user guest
recovery@Controller-1:~$Restarting the Analytics Server
Checking the State of an Analytics Cluster
- Validate that the Elasticsearch and Kibana state is green. The Graphical User Interface (GUI) should display Health is green.
Figure 4. Health Monitoring 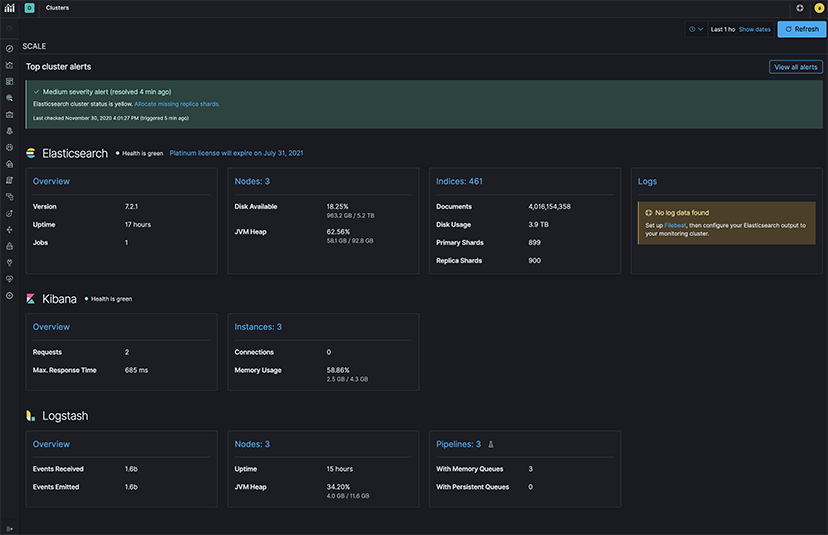
Accessing and Configuring Arista Analytics
http://<Analytics node IP address or domain name or Virtual IP in case of Analytics cluster>Using the System Tab for Analytics Configuration
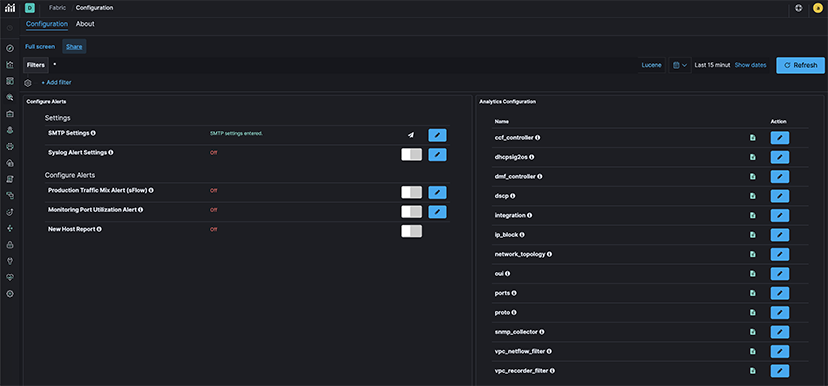
Configure the settings for sending alerts to an SMTP server, set the alert thresholds, and edit the mapping files used in the different dashboards here.
Configuring SMTP Settings
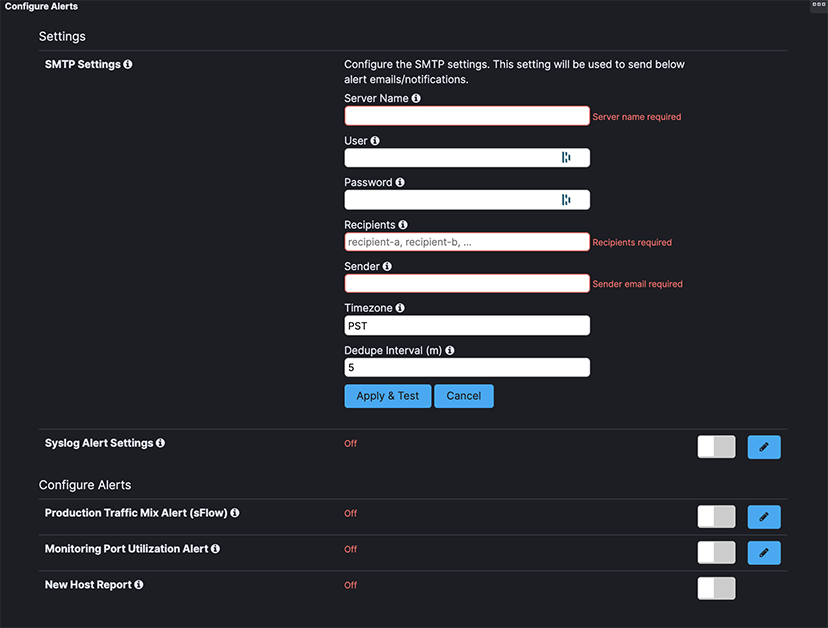
Enter the details for the SMTP server and other required information, and click Apply & Test.
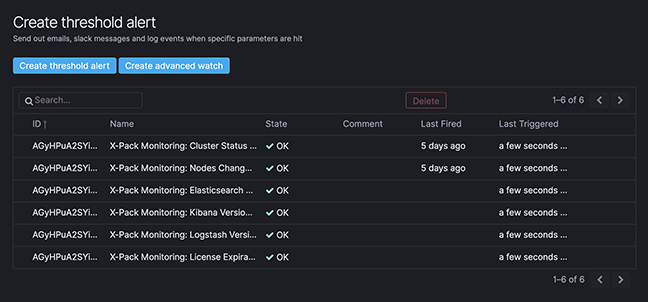
Configuring Alert Thresholds and Enabling Alerts
- Production Traffic Mix
- Monitoring Port Utilization Report
- New Host Report
The system displays the following page when you click the Edit control for the Production Traffic Mix option.
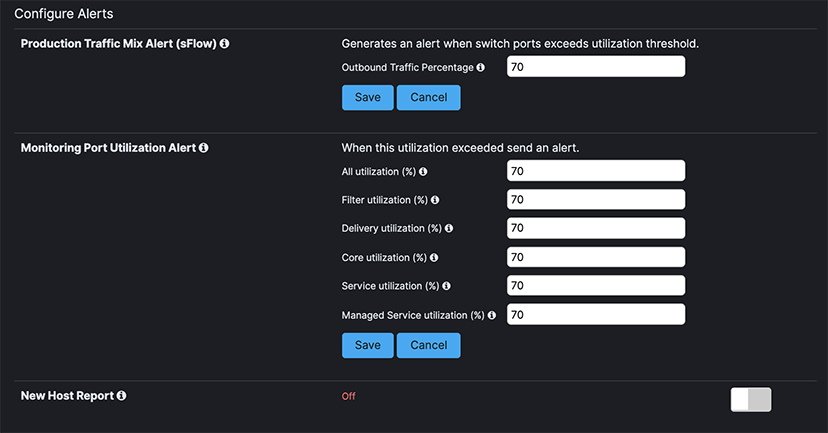
To change the threshold, edit the fields provided and click Save. To enable the alert, move the slider to the left. The system displays the following page when you click Edit control for the Monitoring Port Utilization Report option.
To change the threshold, edit the fields provided and click Save. To enable the alert, move the slider to the left. Move the slider to the left to enable the New Host Report option.
Sending Analytics SMTP Alerts to a Syslog Server
Configuring Collector Interface
analytics-1(config)# local node
analytics-1(config-local)# interface collector
analytics-1(config-local-if)# ipv4
analytics-1(config-local-if-ipv4)# ip 219.1.1.10/24
analytics-1(config-local-if-ipv4)#
In the Arista Analytics Node,two 10G interfaces in bond (bond3) act as a collector interface.
Configuring Advanced Features
Machine Learning
X-Pack machine learning specifies activities monitored over time, and it flags the changes from historical norms as discrepancies, which may indicate unauthorized network usage. For details about this feature, see the Kibana Guide: Machine learning.
To configure this feature, click the Machine Learning control in the left pane of the Kibana interface.
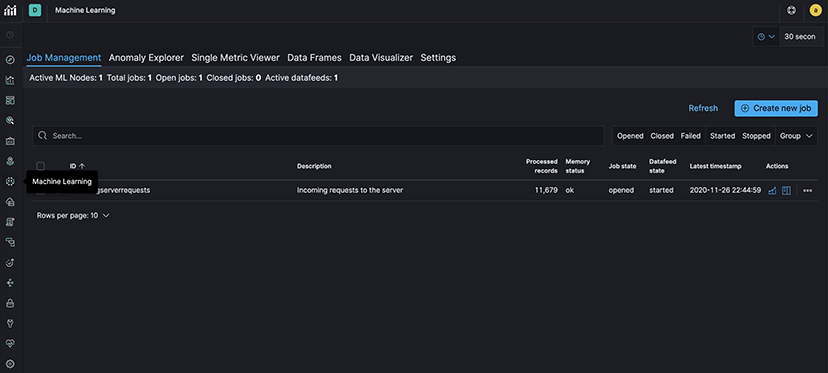
- Job Management: Create and manage jobs and associated data feeds.
- Anomaly Explorer: Display the results of machine learning jobs.
- Single Metric Viewer: Display the results of machine learning jobs.
- Settings: Add scheduled events to calendars and associate these calendars with your jobs.
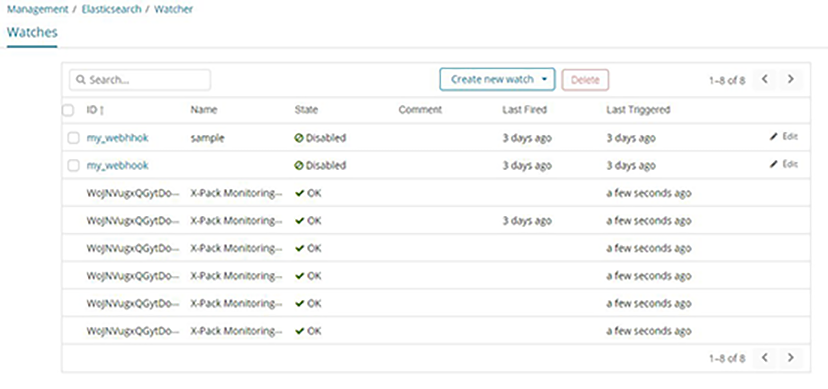
Using Watch for Alerting
Elasticsearch alerting is a set of administrative features that enable you to watch for changes or anomalies in your data and perform the necessary actions in response. The Elasticsearch watch feature generates an alert when a specific network activity occurs. For details about configuring an advanced watch, refer to the Elasticsearch Reference: Alerting.
Elasticsearch provides an API for creating, managing, and testing watches. A watch describes a single alert and can contain multiple notification actions.
- Schedule: A schedule for running a query and checking the condition.
- Query: The query to run as input to the condition. Watches support the full Elasticsearch query language, including aggregations.
- Condition: A condition that determines whether to execute the actions. It uses simple conditions (always true) or scripting for more sophisticated scenarios.
- Actions: It consists of one or more actions such as sending an email, pushing data to 3rd party systems through a webhook, or indexing the query results.
An Elasticsearch index maintains a full history of all watches. This history keeps track of each time a watch is triggered and records the results from the query for the condition and the actions taken.
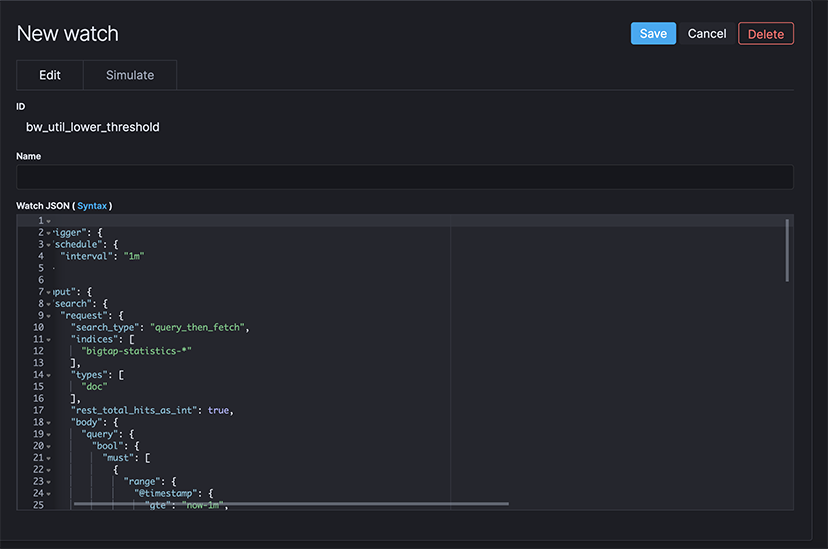
REST script in JSON format
- Trigger Schedules when the watch runs. It can be an interval, which causes the Watcher to run after the specified time elapses (for example, every 10 seconds).
- Input Identifies the information you want to evaluate. It can be a search criterion that retrieves the required input.
- Condition Identify the activity or other condition determining whether to send the alert.
- Action Identifies the text of the alert and the webhook where it sends the alert message.
{
  "trigger": {
    "schedule": {
      "interval": "5s"
    },
    "input": {
      "search": {
        "request": {
          "search_type": "query_then_fetch",
          "indices": [
            "flow-icmp*"
          ],
          "types": [],
          "body": {
            "query": {
              "match_all": {}
            }
          }
        }
      }
    },
    "condition": {
      "compare": {
        "ctx.payload.hits.total": {
          "gte": 10
        }
      }
    },
    "actions": {
      "my_webhook": {
        "webhook": {
          "scheme": "https",
          "host": "hooks.slack.com",
          "port": 443,
          "method": "post",
          "path": "/services/T029CQ2GE/B5NBNKMGR/uZjyLgVUqrQLvGl60yM9ANUP",
          "params": {},
          "headers": {
            "Content-Type": "application/json"
          },
          "body": "{\"channel\": \"#office_bmf_test\", \"username\": \"webhookbot\", \"text\": \"icmp
burst detected over the set limit \", \"icon_emoji\": \":exclamation:\"}"
        }
      }
    }
  }
}
For information about configuring the SLACK webhook, refer to the Slack documentation.
Application Dependency Mapping
This feature helps you identify how items in an Elasticsearch index are related, a process known as Application Dependency Mapping (ADM). You can explore the connections between indexed terms and see the most meaningful connections. For example, this feature maps the relationships between the Destination IP (DIP) and Source IP (SIP) for a specific application. For details about this feature, refer to the Kibana documentation.

- Can I build a map to show different client machines accessing services identified by a Layer 4 port?
- Can I build a map to view the DNS servers accessed by all the clients?
- Can I build a map to show how different servers interact?
Advanced options let you control how your data is sampled and summarized. You can also set timeouts to prevent graph queries from adversely affecting the cluster.
Using RBAC with Arista Analytics
- admin: Admin user accounts have full read and write access to the CLI and the Kibana UI.
- non-admin: Non-admin users typically have read-only access. They can be defined only by an admin user.
To create and enable new user accounts, complete the following steps.
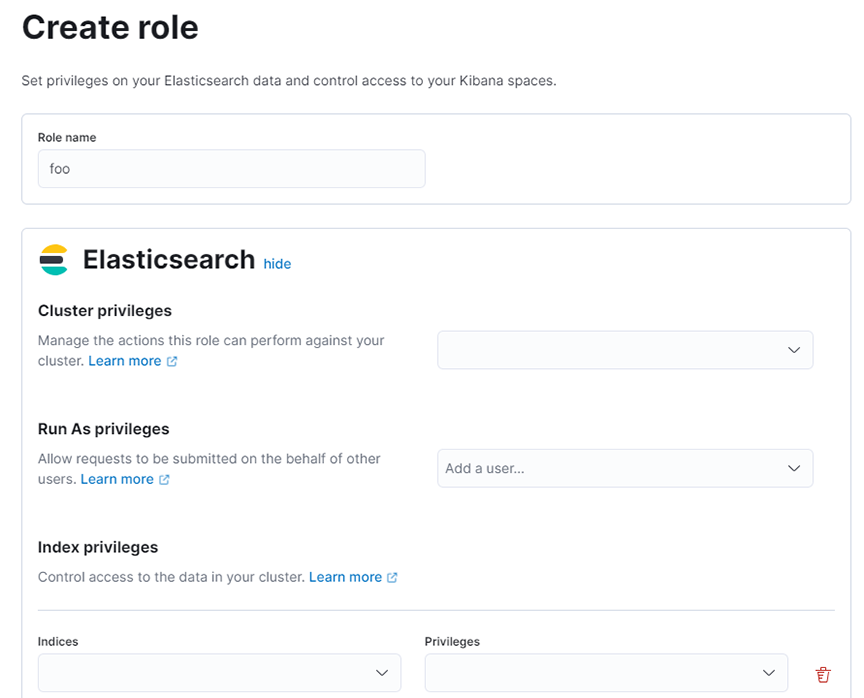
- Create Roles and privilege in the Kibana UI that matches the group created in Step 1. To set roles and privileges in the Kibana UI refer to the Elastic documentation
- Log in as admin to Kibana.
Figure 14. Kibana UI Log In 
- Go to .
Figure 15. Role Management 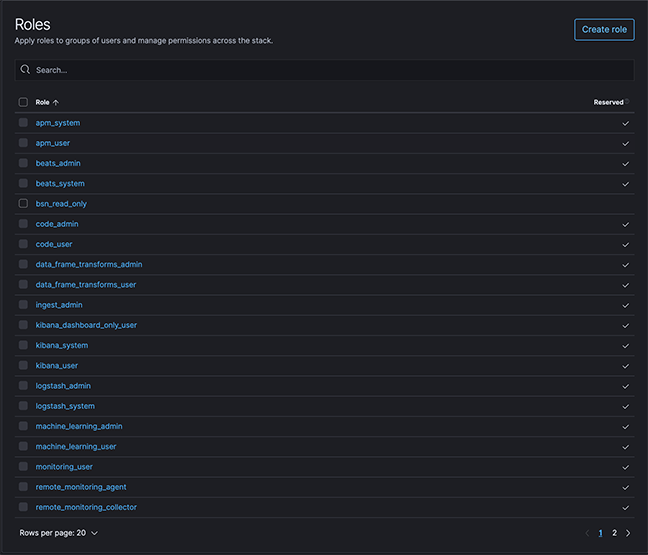
- Click Create Role and populate the respective fields as shown for read-only access.
Figure 16. Verifying New Group 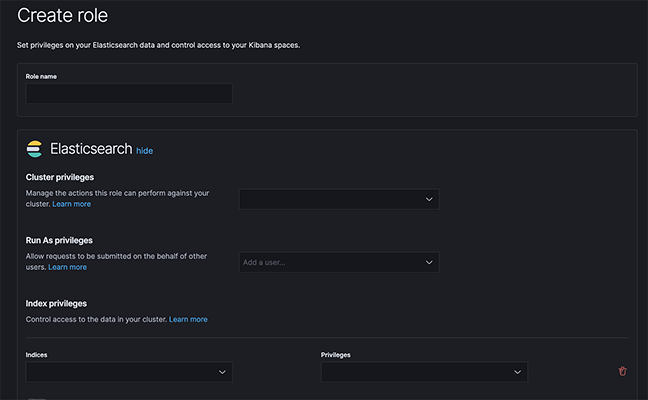
- Click Save and verify that the created group appears in the list shown.
Figure 17. Kibana Management > Roles 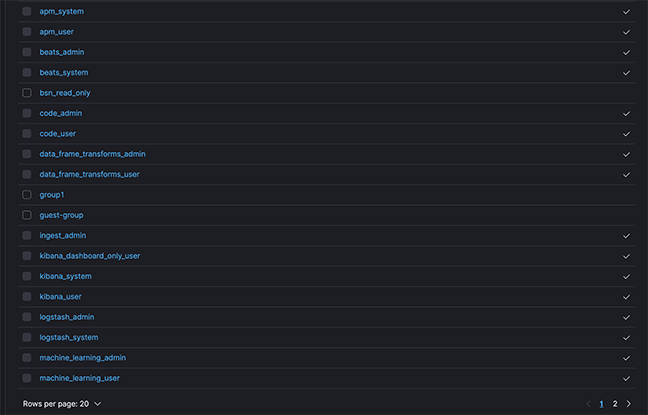
- Log in as admin to Kibana.
Time-based User Lockout
Starting in the DMF 8.0 release, DANZ Monitoring Fabric supports time-based user lockout functionality. Users will be locked out of login for t2 time when attempting with n incorrect passwords within t1 time.
Clear the locked-out users first, or wait for the lockout period to expire before attempting to log in with the correct password. By default, the feature is disabled.
Controller-1(config)# aaa authentication policy lockout failure <number of failed attempts> window <within t1 time>duration <lockout for t2 time>- Value range for failure can be from 1 to 255.
- Value range for window and duration can be from 1 to 4294967295 seconds (2^32-1).
Controller-1(config)# aaa authentication policy lockout failure 3 window 180 duration 900The feature is node-specific in terms of functionality. For example, if user1 is locked out of accessing the active Controller in the cluster, they can still log in to a standby Controller with the correct password, and vice versa. Lockout user information is also not persistent across a Controller reboot or failover.
Controller-1# show aaa authentication lockout
User name Host Failed LoginsLockout Date Lockout Expiration
---------|-------------|-------------|------------------------------|------------------------------|
admin 10.240.88.193 1 2020-09-08 16:07:36.283000 PDT 2156-10-15 22:35:51.283000 PDT
To clear the lockout for a user, admin-group users can issue the following command:
clear aaa authentication lockout user <username>To clear all the locked-out users, admin-group users can issue the following command:
clear aaa authentication lockoutThe following example shows how to clear the “admin” user who got locked out.
Controller-1# clear aaa authentication lockout user admin
Controller-1# show aaa authentication lockout
None.
The “recovery” user will also be locked out if attempting to use incorrect passwords. To check if the user is locked out, use pam_tally2 tool:
admin@Controller-1:~$ sudo pam_tally2 -u recovery
Login Failures Latest failure From
recovery 9 09/08/20 16:16:04 10.95.66.44admin@Controller-1:~$ sudo pam_tally2 --reset --user recovery
Login Failures Latest failure From
recovery 9 09/08/20 16:16:04 10.95.66.44
admin@Controller-1:~$ sudo pam_tally2 -u recovery
Login Failures Latest failure From
recoveryElasticsearch RBAC examples
Admin User and Group: The admin user is, by default, added to the admin group and the superuser role in Elasticsearch. There is no need to configure.
Read-only Access: By default, the BSN read-only role also maps to Floodlight.
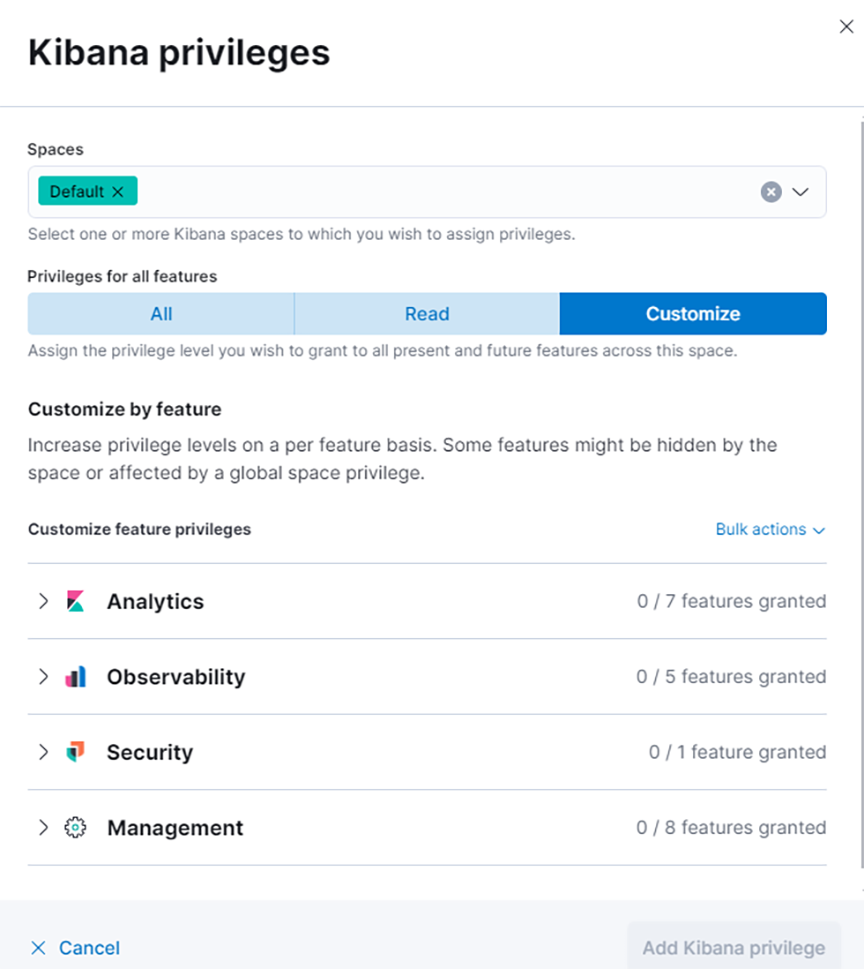
Dashboard Access Only: Create the role for dashboard access by selecting . Configure the indices to * and set the privileges under Kibana, as shown in the following image.
Integrating Analytics with Infoblox
Infoblox provides DNS and IPAM services that integrate with Arista Analytics. To use, associate a range of IP addresses in Infoblox with extensible attributes, then configure Analytics to map these attributes for the associated IP addresses. The attributes assigned in Infoblox appear in place of the IP addresses in Analytics visualizations.
Configuring Infoblox for Integration
- Use the Edit icon to Add, Modify, or Delete the Integration configuration.
Figure 20. Integration Configuration 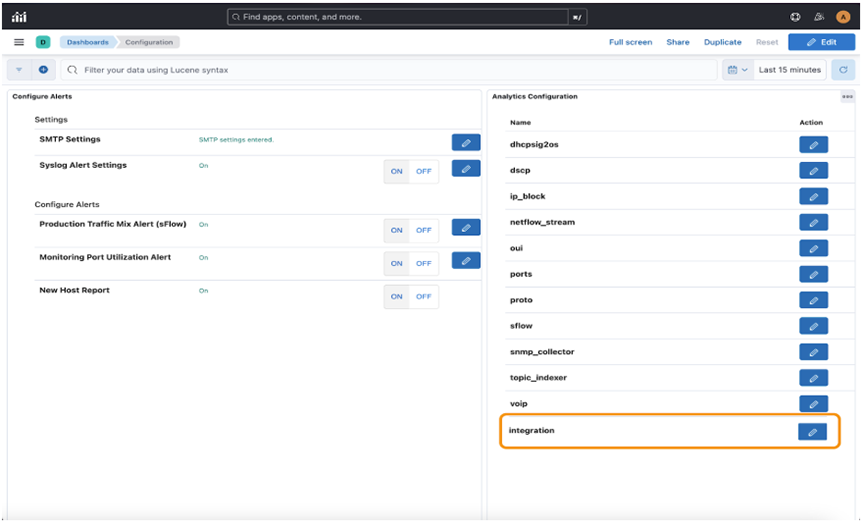 Enter the required information in the Integration input fields:
- Host: Must be a DNS-resolvable hostname or IPv4 address.
- Username: Enter the username of the Infoblox integration.
- Password: Enter the password of the Infoblox integration. When entering the password, it masks the password.
- Keys Fetched: Accepts a list of field names and field values:
- Field name
- Field value
Note: The configuration has data as a JSON object in earlier releases.Figure 21. Integration 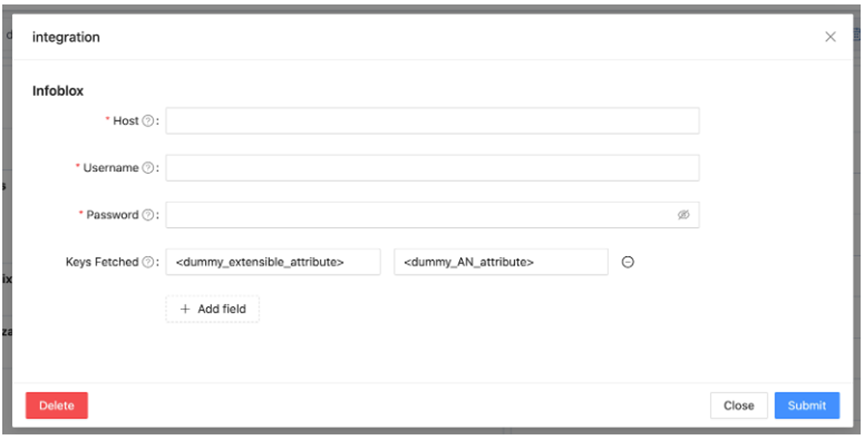
- Select +Add Field to add fields for Keys Fetched input or use to remove the corresponding field. Hovering over displays the requirements for the input field.
Figure 22. Add Field Requirement 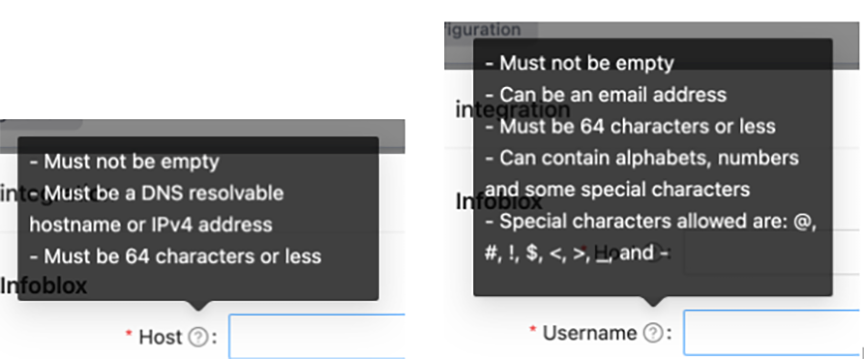 There are also validation checks when entering configuration values.
Figure 23. Validation Checks 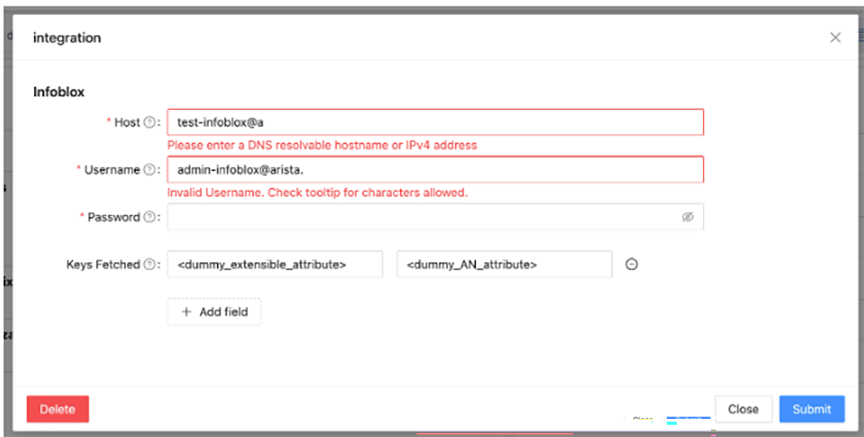
- Select Delete to delete the integration configuration; the page will refresh.
Figure 24. Delete Integration 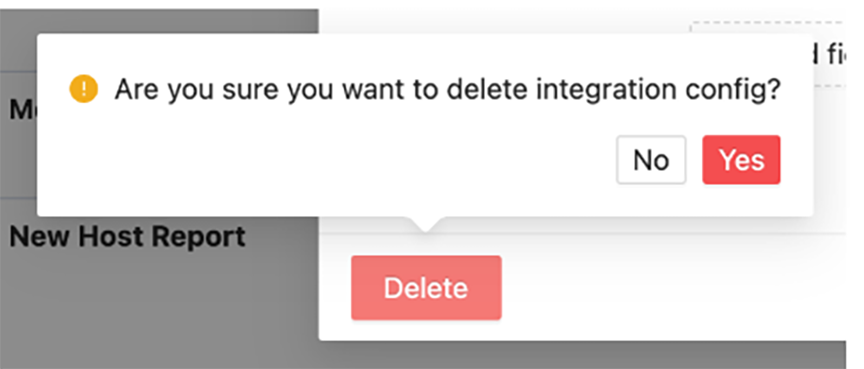
- To set the extensible attributes in Infoblox, click the Administration Extensible Attributes tab.
Figure 25. Extensible Attributes Tab 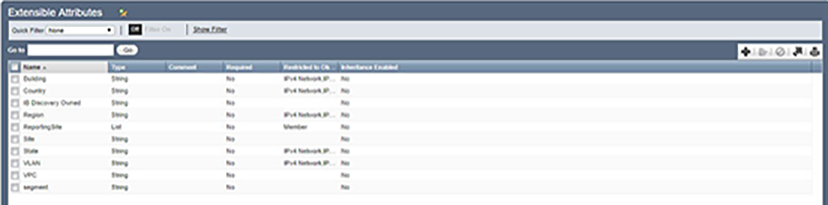 This tab defines the attributes applied to a block of IP addresses. The extensible attributes you define for integrating Infoblox with Arista Analytics are as follows:
- EVPC: Identifies the Enterprise Virtual Private Cloud (EVPC) assigned to a block of IP addresses in Infoblox.
- Segment: Identifies the specific subnet interface for an assigned IP address.
- Save the configuration.
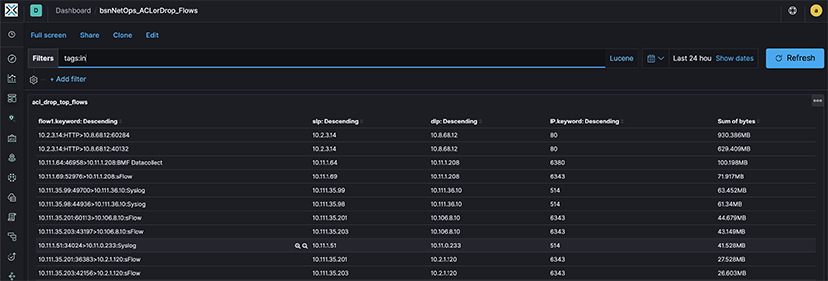
As a result of these configuration changes, view the following enhancements to the flow records in the tab and move to the Flows by Time chart.
Figure 26. Dashboard - sFlow 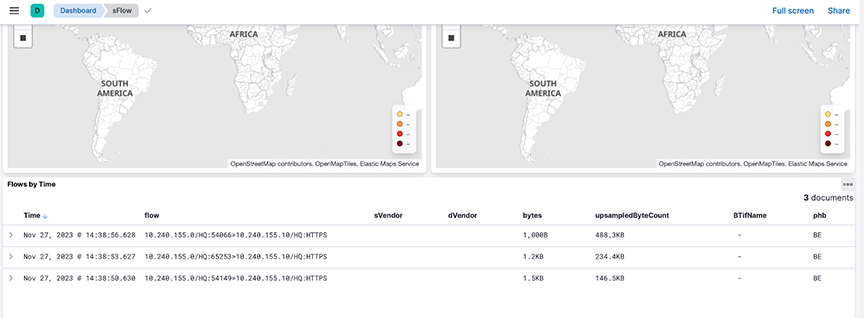
Suppose the sFlow packet source and/or destination IP addresses fall within the IP subnets in the Infoblox IPAM dashboard. In that case, their flow records will be augmented with the extensible attributes from Infoblox as specified in the integration configuration.
For example, the source and destination IP addresses of the 10.240.155.0/HQ:54149 > 10.240.155.10/HQ/HTTPS flow fall within the 10.240.155.0/24 subnet in the Infoblox IPAM dashboard.
When expanding this flow in the Flows by Time chart, since VPC is in the integration keys_fetched, the sVPC value is VPC155.
Site is in the integration keys_aliased values, and a sSite value of HQ appears. Since Desc is aliased to Site (an extensible attribute), sDesc takes on the Site's value. Segment is in the keys_aliased values; hence, sSegment with S155 appears.
Observe similar attributes for the destination IP address in the flow record. All these values come from the Infoblox IPAM dashboard shown earlier. ASNUM does not appear as a field in the flow record despite being in the integration keys_aliased values because it is not configured or associated as an extensible attribute to the subnets in the Infoblox IPAM dashboard.
Figure 27. Flow by Time 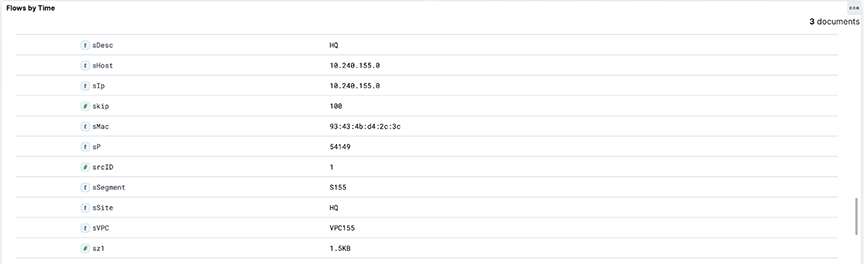 Known Issue:
- When removing a tag in the middle of the ip_block tags list and saving the configuration, the relevant flow records may have incorrect values in their attributes during the minute following this change. After this brief period, the flow records will have the correct attributes and corresponding values.
Troubleshooting
When the flow records augmented with InfoBlox extensible attributes are missing these attributes, verify that the Infoblox credentials you provided in the integration configuration are correct. After confirming the credentials and the relevant flow records are still missing the Infoblox extensible attributes, generate a support bundle and contact Arista Networks TAC.