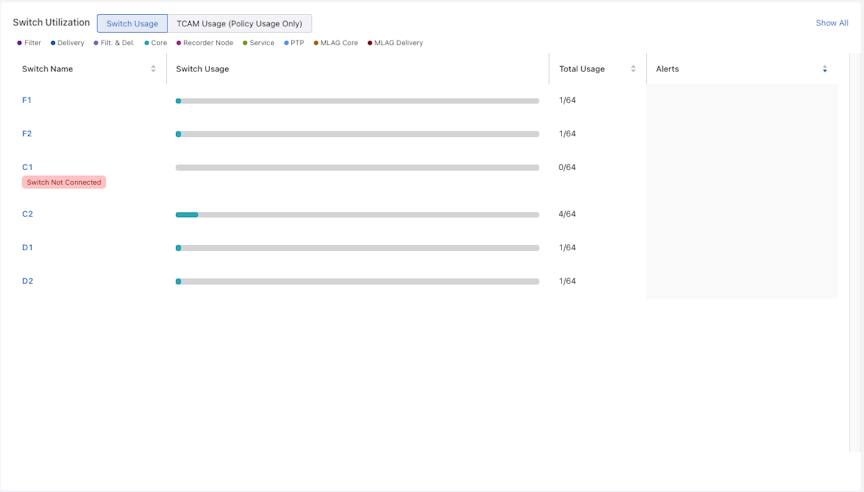
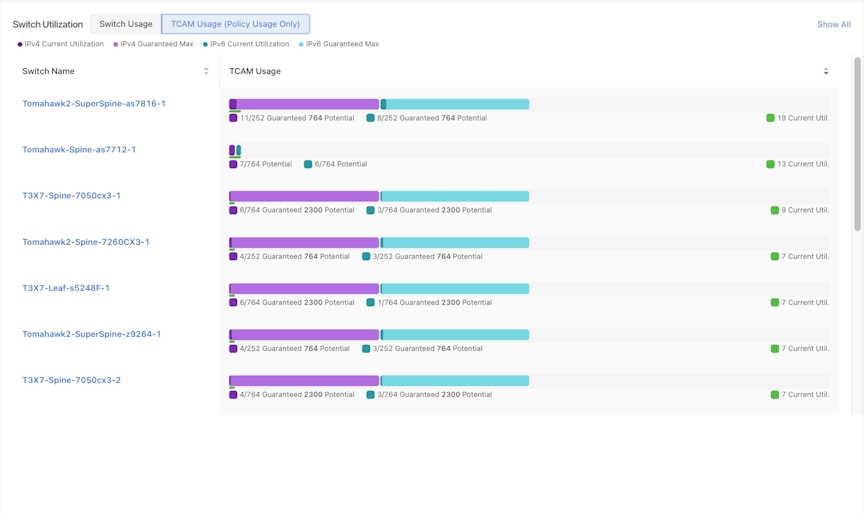
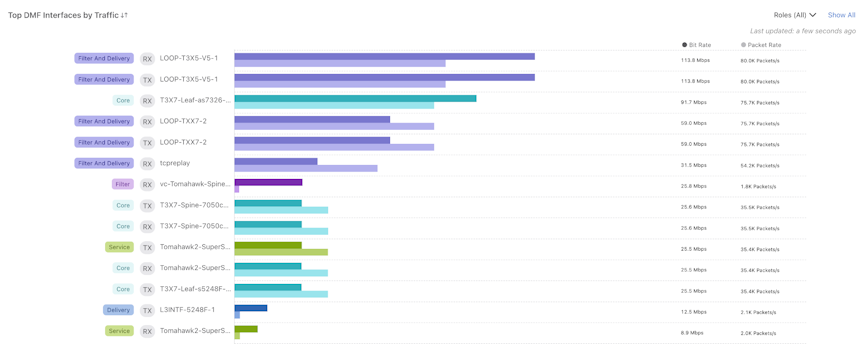
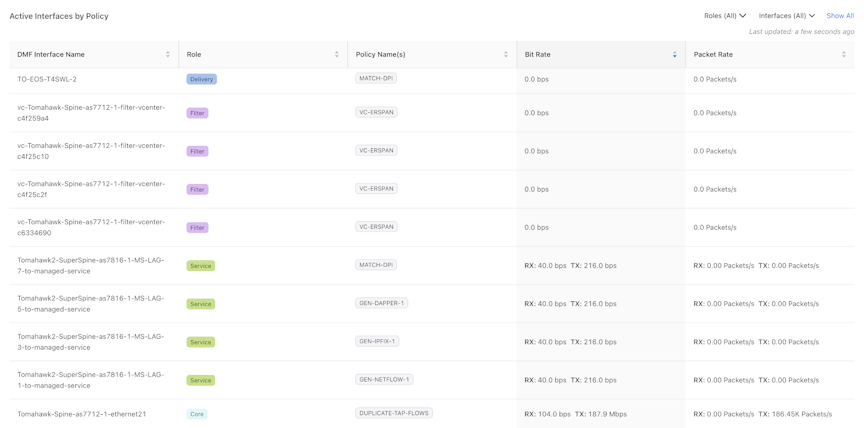
Managing DMF Switches and Interfaces

This chapter describes the basic configuration required to deploy and manage DANZ Monitoring Fabric (DMF) switches and interfaces.


DMF Switches Dashboard

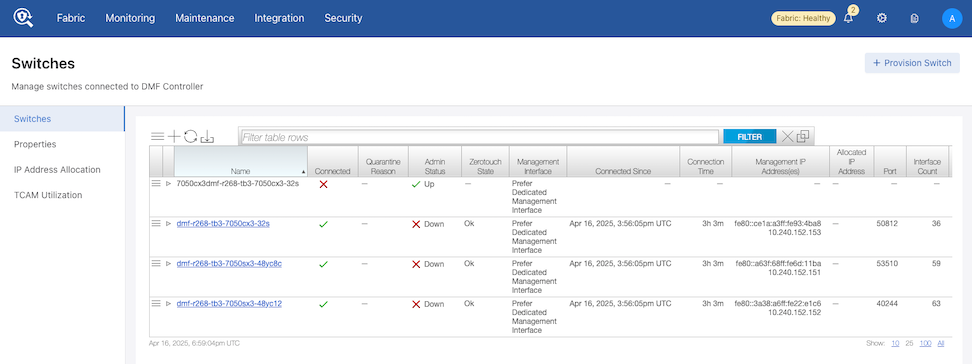
DANZ Monitoring Fabric (DMF) 8.7 introduces an updated Switches dashboard. A header and tabulated layout enable observation of different aspects of the installed switches and provisioning new switches, all within the same dashboard.

Using the DMF Switches Dashboard


Overview

Inventory

Configuration

Properties

IP Address Allocation

TCAM Utilization

Firmware

Revert Switches Dashboard

Overview

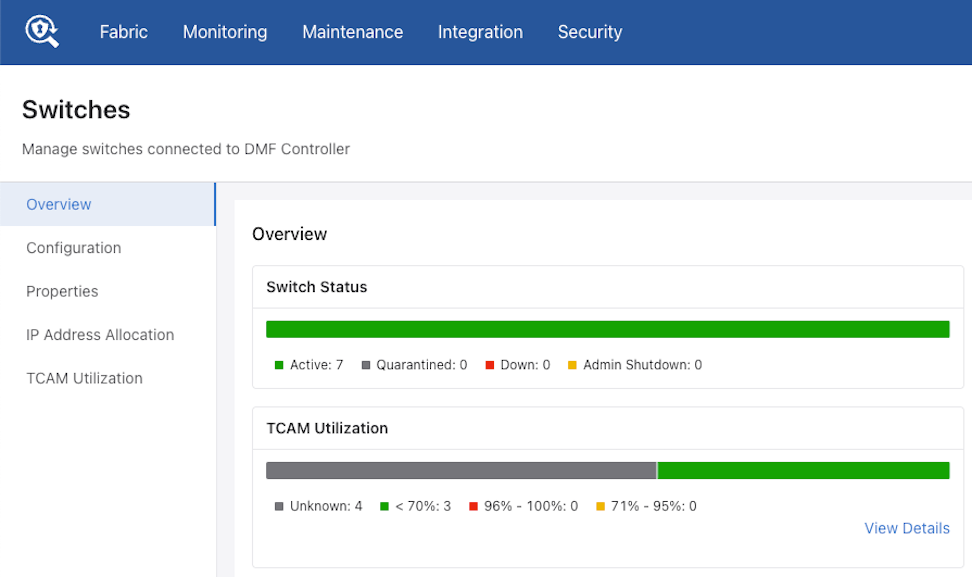
Select Fabric > Switches > Overview .

The Overview dashboard comprises two separate sections: Overview and Inventory.

Figure 1. DMF Switches Overview

The Overview section has seven charts.

  • Switch Status: Displays the summary of switch connection status.
  • Zerotouch State: Displays the summary of Zerotouch state of all switches.
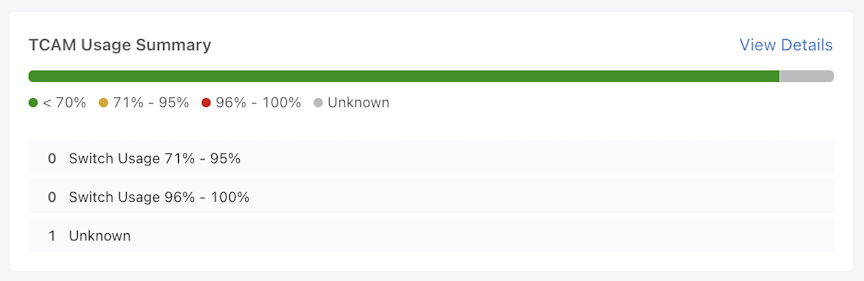
  • TCAM Utilization: Displays the TCAM usage of all switches. The View Details link navigates to the TCAM Utilization and Capacity view.
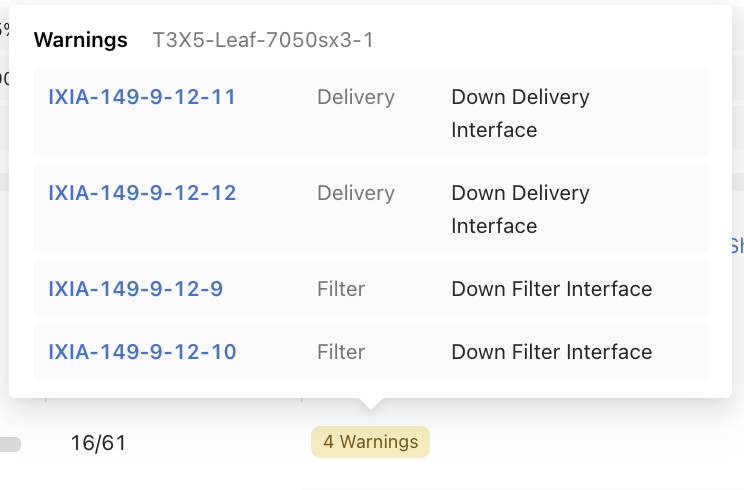
  • Alerts: Displays the count of relevant switch alerts and warnings. The View Details link navigates to the Alerts page.
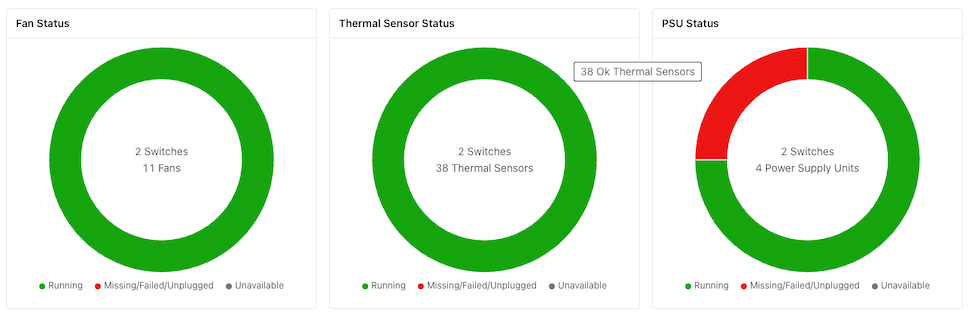
  • Fan Status: Displays the switch count, and fan count; a donut chart shows the percentage of fans with an unhealthy status.
  • Thermal Sensor Status: Displays the switches count, thermal sensors count and a donut chart showing the percentage of sensors with an unhealthy status.
  • PSU (Power Supply Unit) Status: displays the switches count, PSU count, and a donut chart showing the percentage of PSUs with unhealthy status.
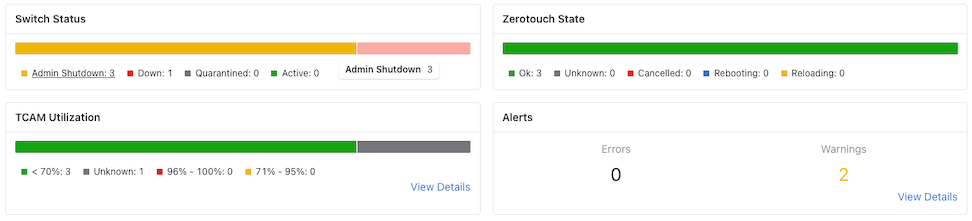
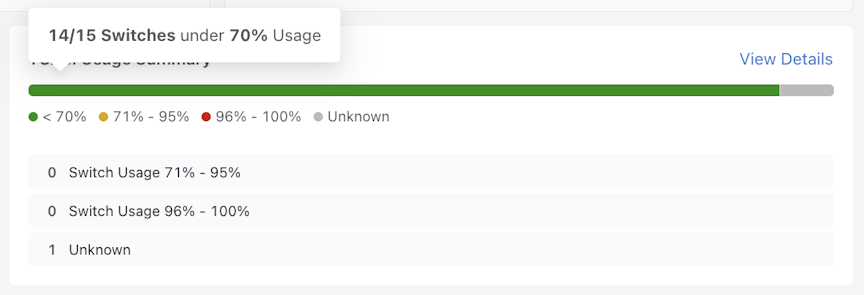
Hovering over a bar chart or an arc renders a tooltip explaining the current arc and count.
Figure 2. Hover Details Bar Chart
Figure 3. Hover Details Arc

Selecting an unhealthy arc in Fan Status, Thermal Sensor, or PSU, opens a status window listing the items with an abnormal status or if the status is unavailable.
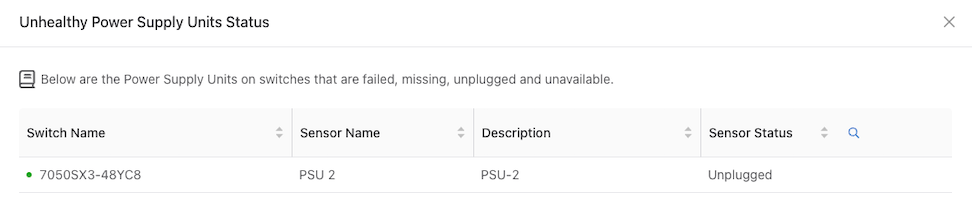
Figure 4. Status

Inventory

The Inventory section displays all inventory records configured in the switches. Table functionality includes exporting, filtering, sorting, hiding, or showing columns.
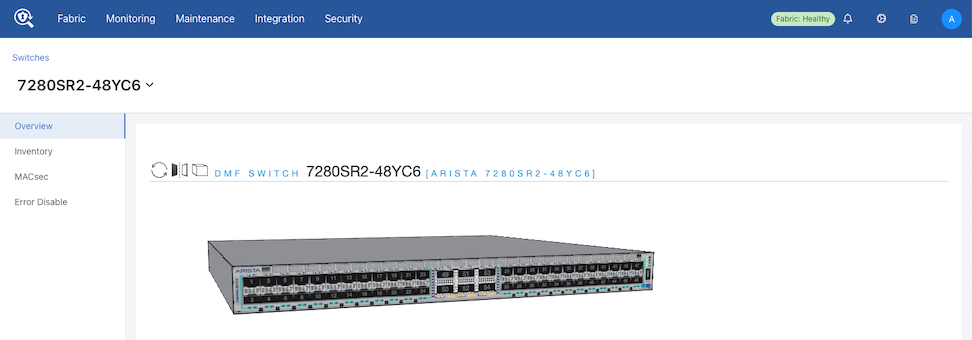
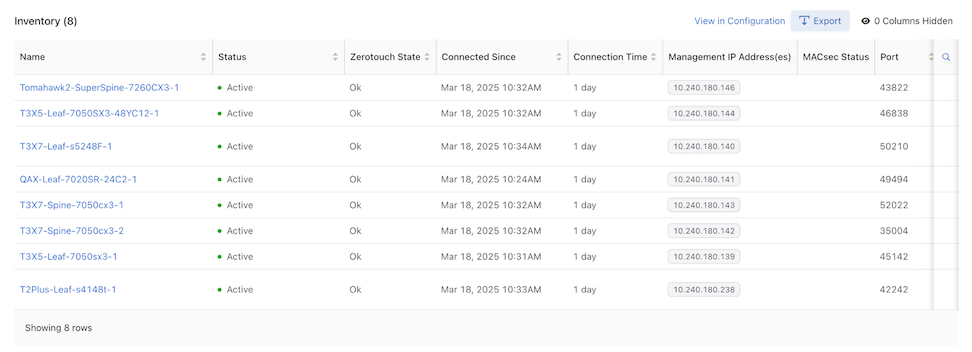
Selecting a link in the Name column opens a Switch Detail window.
Figure 5. Switch Detail
Select View in Configuration to view the switches in the Configuration mode.
Figure 6. View in Configuration

Columns include:

Name Status Zerotouch State
Connected Since Connection Time Management IP Address(es)
MACsec Status Port SKU
Platform Serial Number ASIC
Software Description Pipeline Mode  
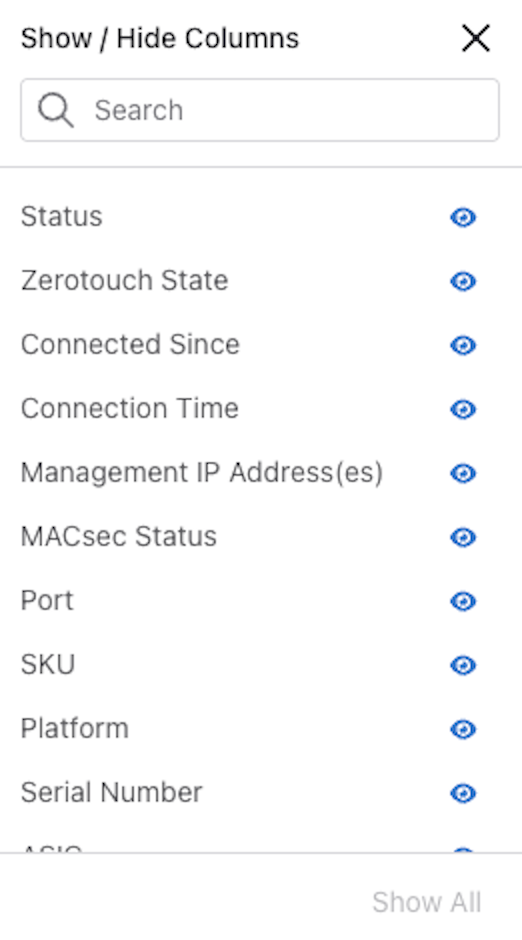
Show / Hide Columns determine the information displayed in the dashboard and are user-selectable. Selections persist until changed.
Note: The Name column cannot be hidden.
Figure 7. Show / Hide Columns

Search: Filter rows with matching text.

Optic Cable Transceiver Detail Information

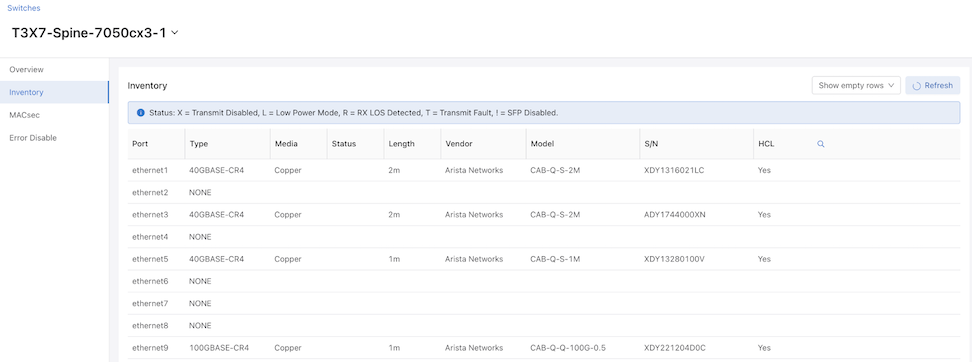
The Switch detail page in the DMF GUI has an Inventory tab displaying information about optics, cables, and transceivers.

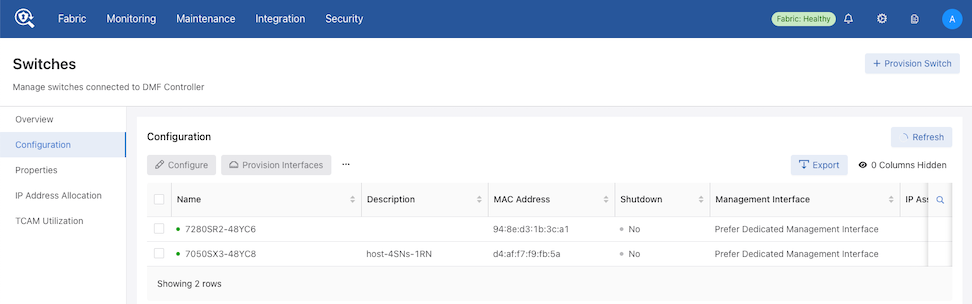
Select Fabric > Switches > Configuration to display a list of fabric switches.

Figure 8. Switches Overview

Choose a switch from the Configuration list.

Figure 9. List of Switches

Select Inventory to view the inventory details.
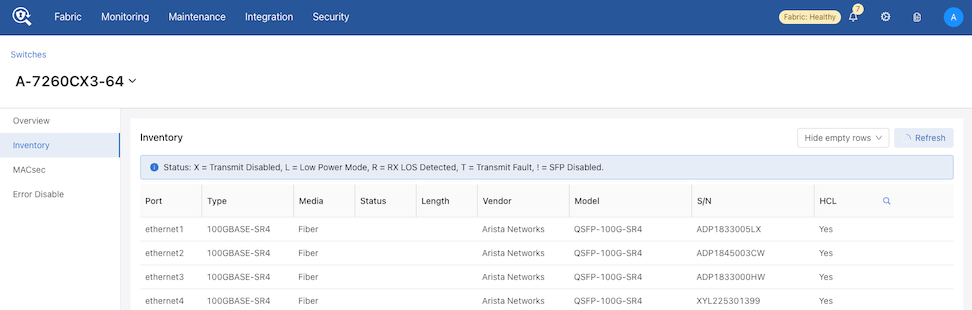
Figure 10. Inventory

Refresh Button

Figure 11. Refresh Button

The data in the Inventory tab refreshes automatically every 60 seconds. However, you can manually refresh the data by using Refresh as needed.

The inventory data for SwitchLight (SWL) and EOS switches display differently.

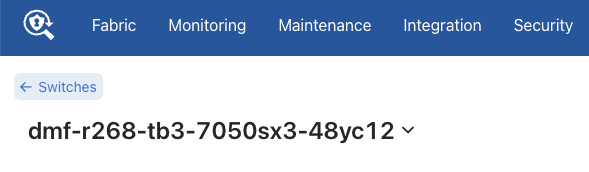
Header

The header contains two interactive components.

  • A Switches back button that returns user to the switches page or configuration table.
  • A Select drop-down to conveniently view the inventory of other switches and allows text and search.
  • Back Button & Select Drop-down.
    Figure 12. Back Button & Select Drop-down
SwitchLight (SWL) Switch

DMF displays SwitchLight switches inventory information as a table. Search functionality allows quick entry lookup.

There is an option to hide and show the table with empty rows.
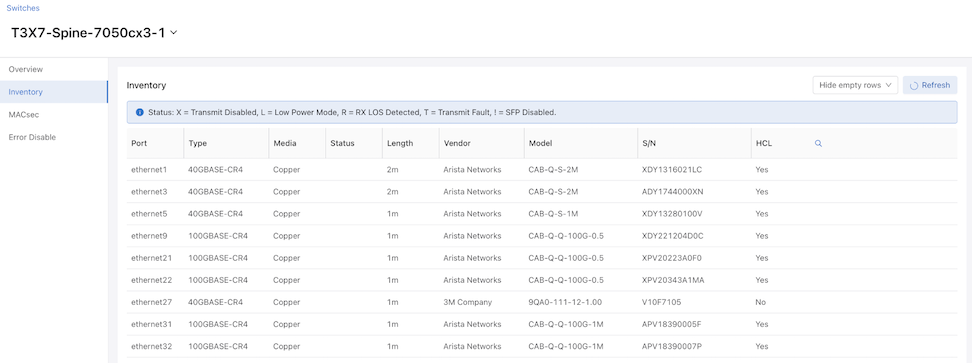
Figure 13. Example - Table with Empty Rows Hidden
Figure 14. Example - Table with Empty Rows Shown
EOS Switch

DMF displays the inventory information for EOS switches in block format. Each block displays a different aspect of the inventory and contains a copy icon enabling quick data copying.
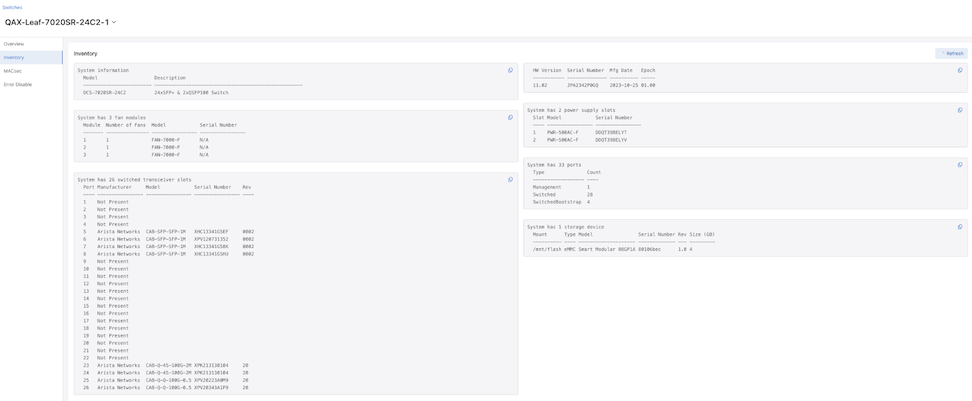
Figure 15. EOS Switch Details

Configuration

Select Fabric > Switches > Configuration .
Figure 16. Switches Configuration

Configuration Details: A sortable display of all configurations of the switches currently installed in DMF.
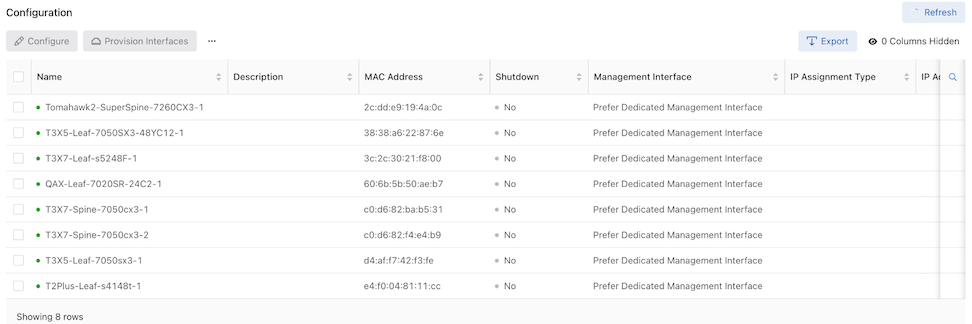
Figure 17. Configuration Details

Columns include:

 Name Description 
MAC Address Shutdown
Management Interface IP Assignment Type
IP Address Tunnel Encapsulation Type
Strip VXLAN UDP Port Password
PTP Domain PTP Priority1
PTP IPv4 Address PTP IPv6 Address

The Configuration dashboard comprises the following components and controls:

  • Refresh: By default, the system refreshes data every 60 seconds. Hovering over Refresh displays the time remaining until the next update. When required, select Refresh to update the data immediately.
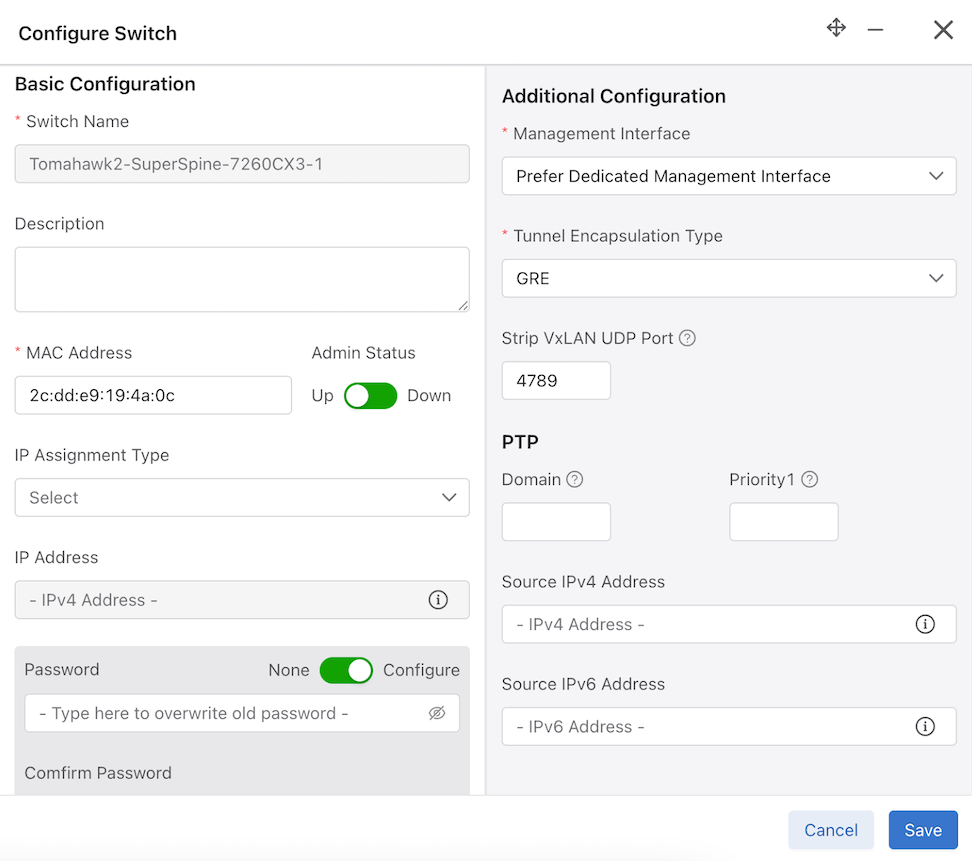
  • Configure: Opens the Configuration Switch window with pre-populated switch information. Edit the configuration as required and select Save.

    Configure is disabled unless one switch is selected.

    Figure 18. Configure Switch
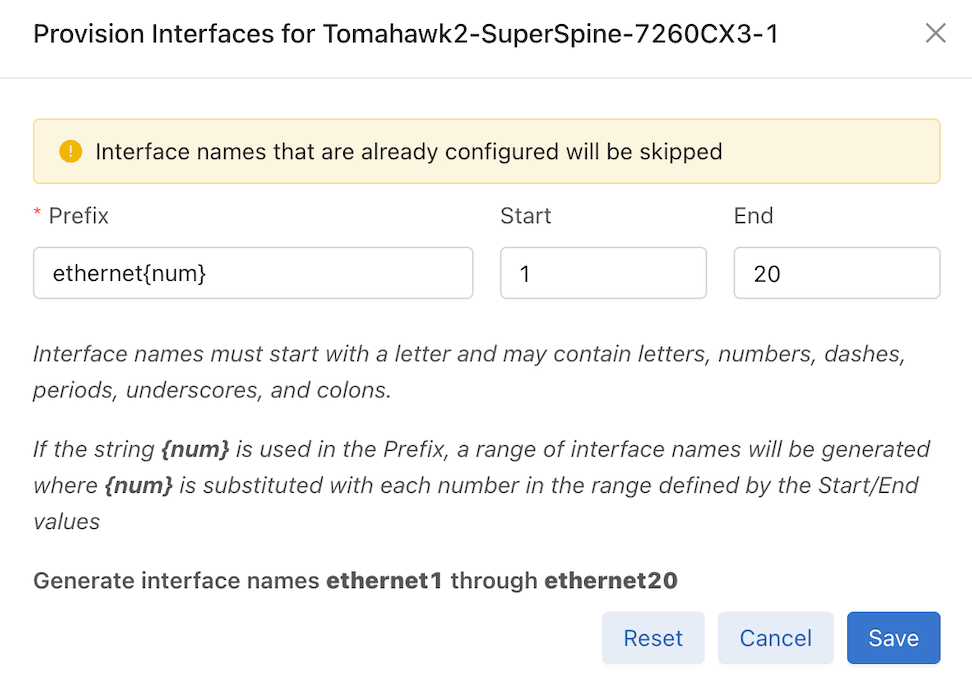
  • Provision Interfaces: Provides a fast and convenient way to populate a large number of interfaces. Prefix works similarly to template string formatting, where the {num} is replaced by a number between start and end, if present.

    Provision Interfaces is disabled unless one switch is selected.

    Figure 19. Provision Interfaces
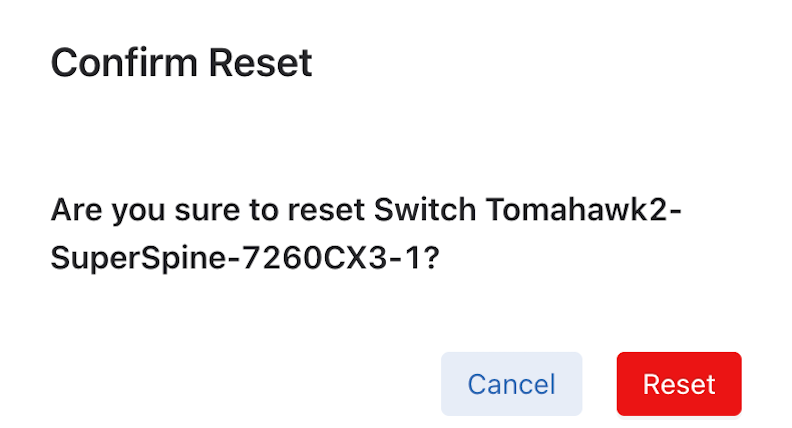
  • Reset: Disconnect and reset the connection to the switch.

    Reset is disabled unless one switch is selected.

    Figure 20. Confirm Reset
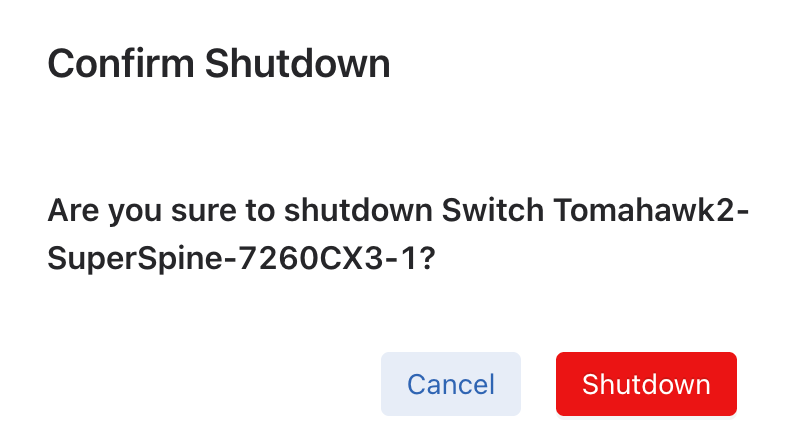
  • Shutdown: Sets shutdown property of the switch config to true, thus shutting down the switch.

    Shutdown is disabled unless one switch is selected.

    Figure 21. Confirm Shutdown
  • Reboot: Reboot the zerotouch device.

    Reboot is disabled unless one switch is selected and the selected switch is a ZTN device. For a Chassis, select the Module Type and the Slot to reboot.

  • Beacon: Beacons the LED light of the zerotouch device for a certain period.

    Beacon is disabled unless one switch is selected and the selected switch is a ZTN device.

    Figure 22. Confirm Beacon
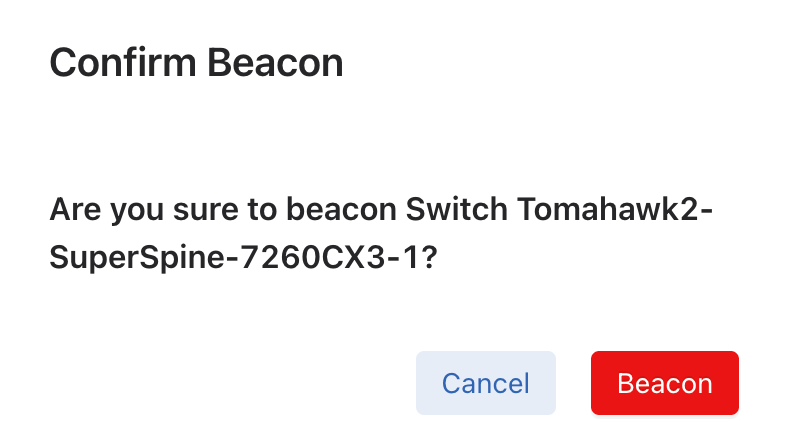
    For a Chassis, select the Module Type, Slot, and Option to beacon.

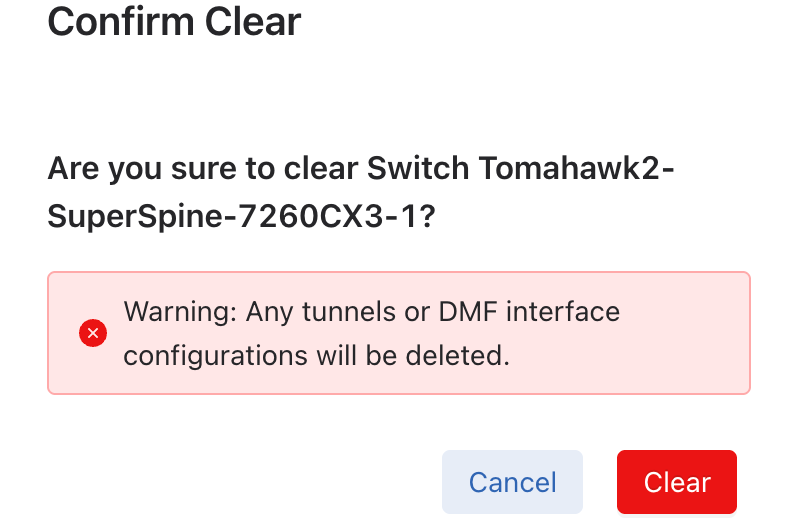
  • Clear Config: Deletes the current switch configuration.

    Clear is disabled unless one switch is selected.

    Figure 23. Config Clear
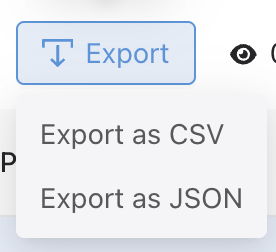
  • Export: Export the data in CSV or JSON format.
    Figure 24. Export Data
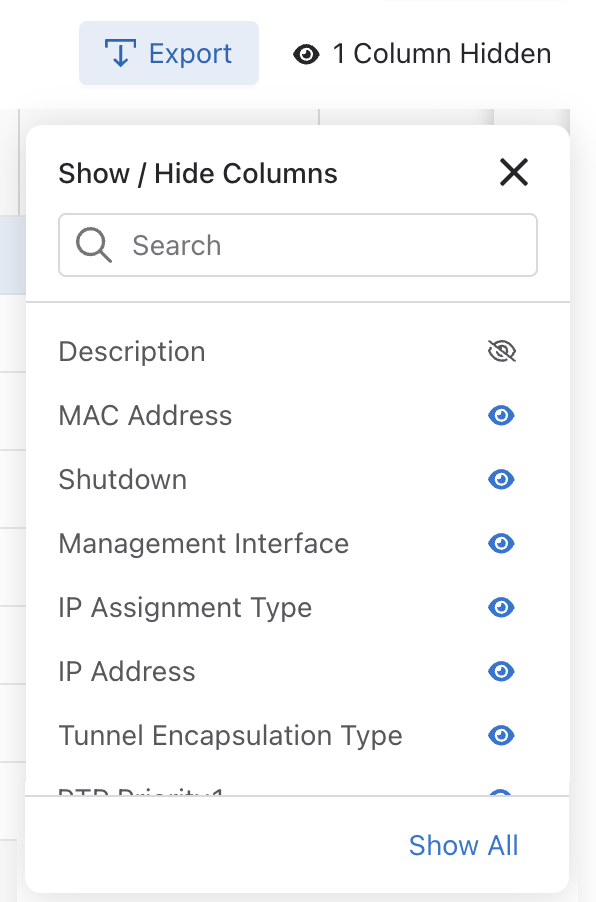
  • Show / Hide Columns determine the information displayed in the dashboard and are user-selectable. Selections persist until changed.
    Note: The Name column cannot be hidden.
    Figure 25. Show / Hide Columns
  • Search: Filter rows with matching text.


Properties

Select Fabric > Switches > Properties .

Properties Dashboard: A sortable display of all switch properties currently installed in DMF.
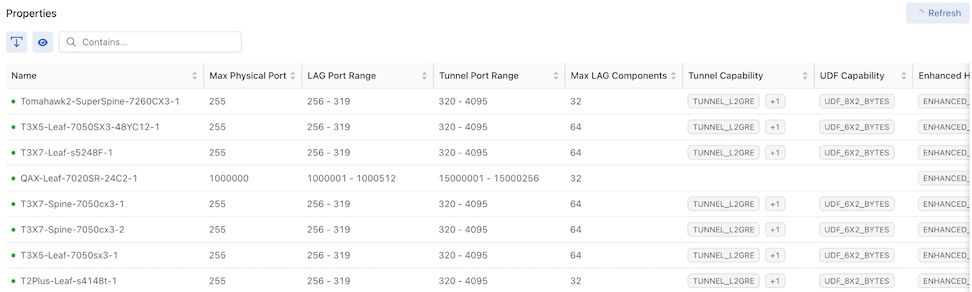
Figure 26. Properties Dashboard

Columns include:

 
Name Max Physical Port
LAG Port Range Tunnel Port Range
Max LAG Components Tunnel Capability
UDF Capability Enhanced Hash Capability
Rate Limit Range Max Multicast Replication Groups
Max Multicast Replications Supports CPU Trap Table
PTP Timestamp Capability Truncate Range
Strip Header Capability MACsec Capability
Port Count Egress Strip VLAN Capability

The Properties dashboard comprises the following components and buttons:

  • Refresh: By default, the system refreshes data every 60 seconds. Hovering over Refresh displays the time remaining until the next update. When required, select Refresh to update the data immediately.
  • Actions:

    • Export: Export data in CSV or JSON format.
    • Show / Hide Columns determine the information displayed in the dashboard and are user-selectable. Selections persist until changed.
      Figure 27. Show / Hide Columns
      Note: The Name column cannot be hidden.
  • Search: Filter rows with matching text.

IP Address Allocation

Select Fabric > Switches > IP Address Allocation .

The IP Address Allocation dashboard displays the current switches' IP Address Allocation Configuration and IP Range Allocation Status.
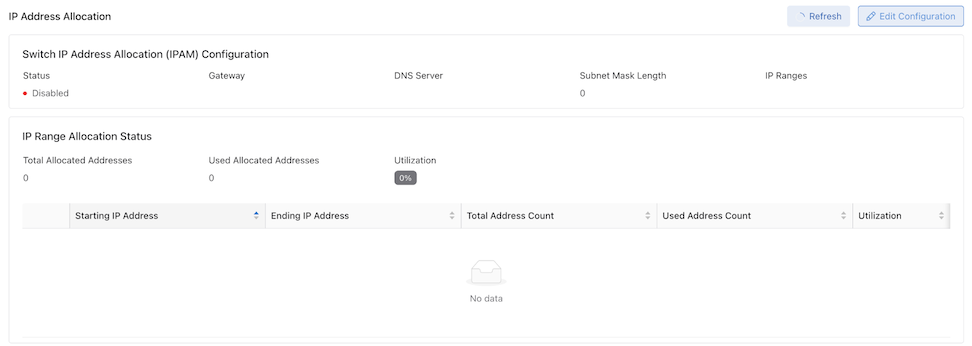
Figure 28. IP Address Allocation

Columns include:

Table 1. Columns
Starting IP Address Ending IP Address Total Address Count Used Address Count Utilization

Select Edit Configuration to configure or modify IP Address Allocation.

Use Status to enable or disable the feature.

Enter the required information and select Submit. Optionally, select Reset to clear the information and start again.
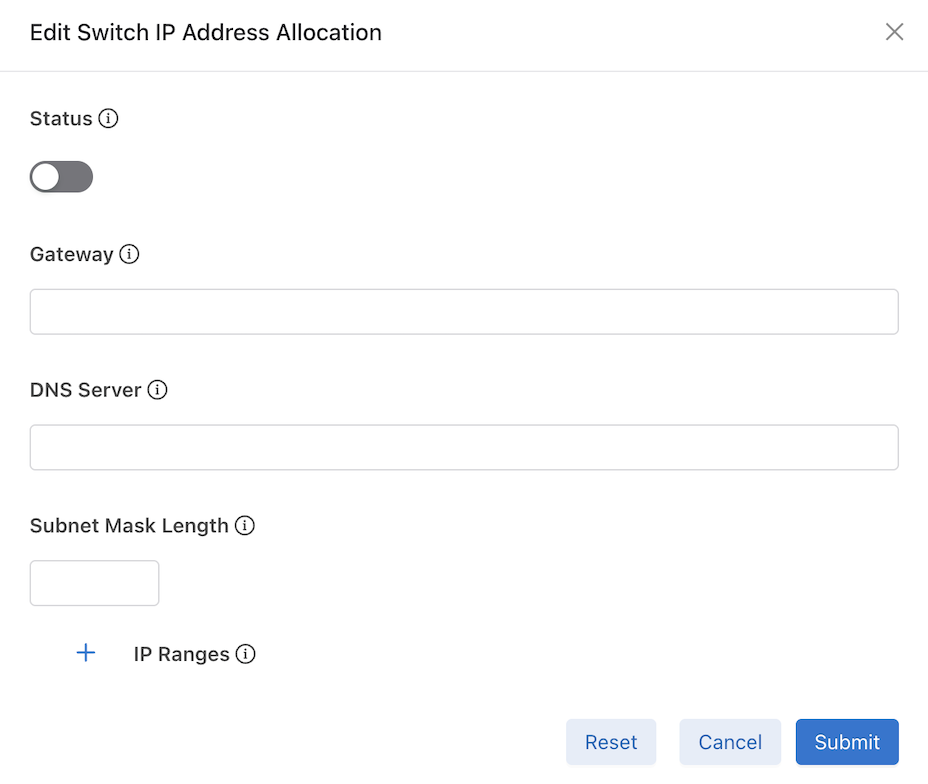
Figure 29. Edit Switch IP Address Allocation

TCAM Utilization

Select Fabric > Switches > TCAM Utilization .

The TCAM Utilization and Capacity dashboard displays the TCAM utilization and capacity of the current switches. View capacity and utilization of Ingress Flow 1 and Ingress Flow 2 TCAM tables on supported switches.
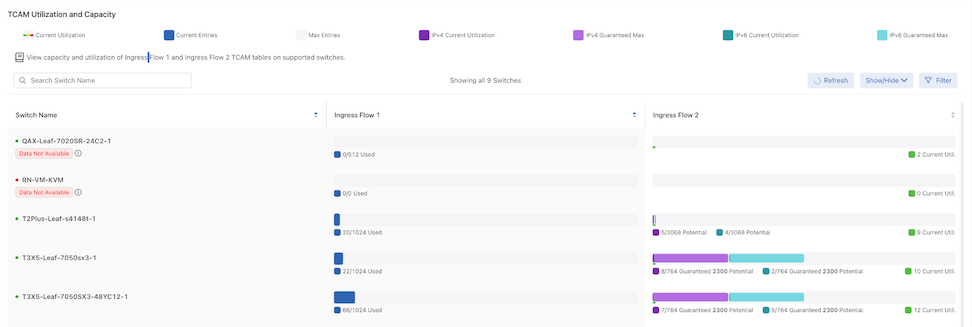
Figure 30. TCAM Utilization and Capacity

Columns include:

 
Switch Name Ingress Flow 1 Ingress Flow 2

The TCAM Utilization and Capacity dashboard comprises the following components and buttons:

  • Refresh: By default, the system refreshes data every 60 seconds. Hovering over Refresh displays the time remaining until the next update. When required, select Refresh to update the data immediately.
  • Show / Hide Columns determine the information displayed in the dashboard and are user-selectable. Selections persist until changed.
    Figure 31. Show / Hide Columns
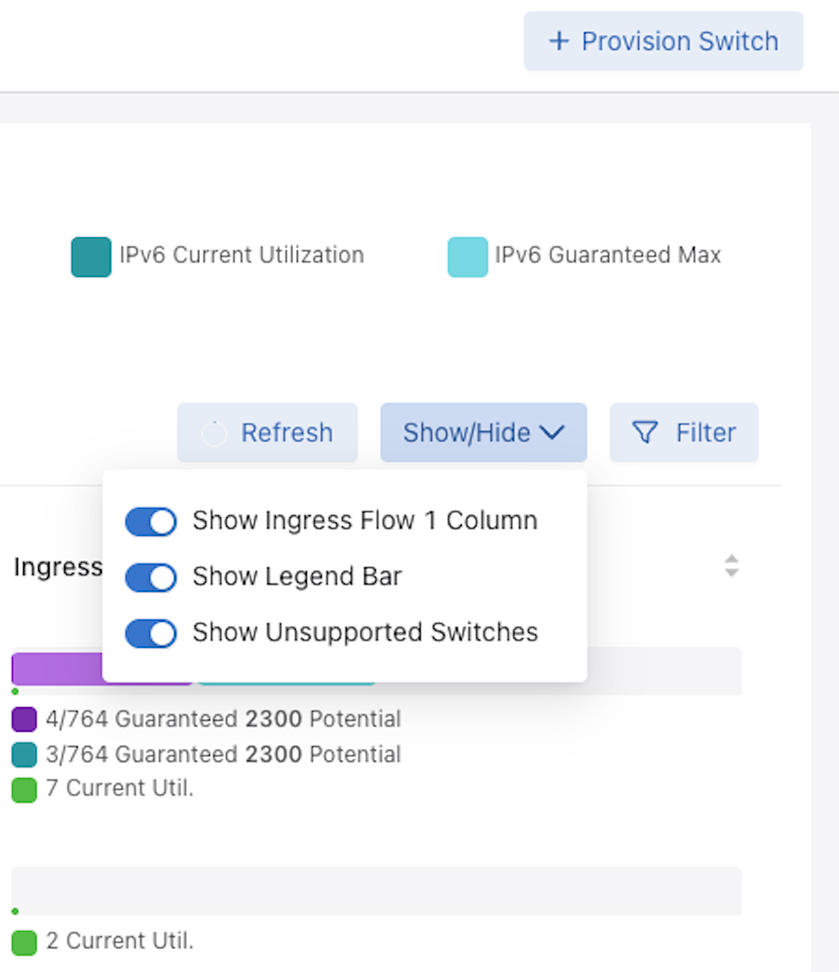
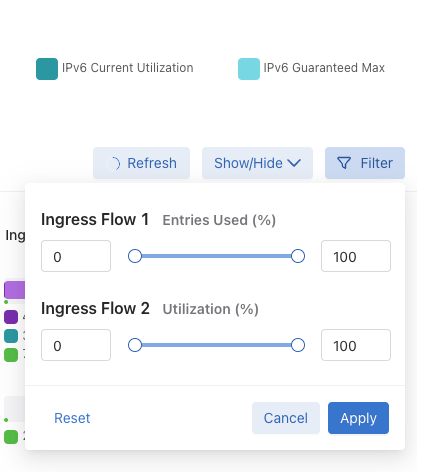
  • Filter: Filter on Ingress Flow 1 and Ingress Flow 2 by entering a value or moving the sliders and select Apply.
    Figure 32. Filter Ingress Flow
Provision Switch

Select Fabric > Switches > Provision Switch .

Figure 33. Provision Switch Control

Provision Switch opens a window to provision a single switch. The required fields are:

  • Switch Name
  • MAC Address
  • Management Interface
  • Tunnel Encapsulation Type

The remaining fields are optional.
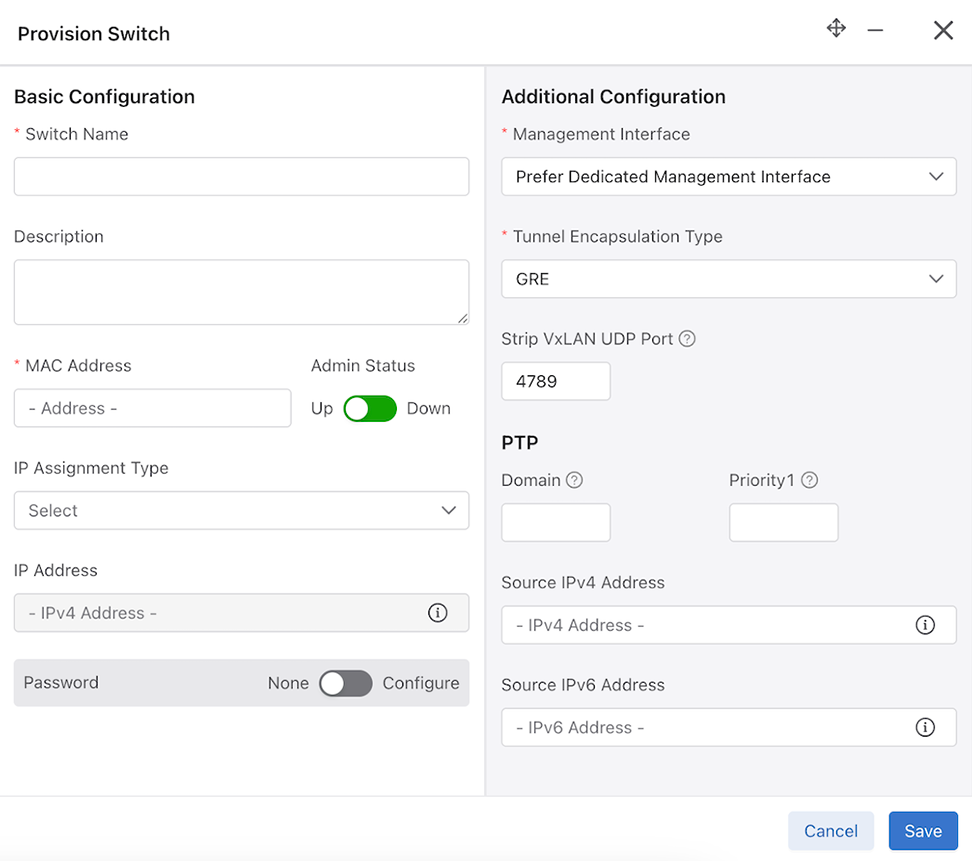
Figure 34. Provision Switch

Firmware

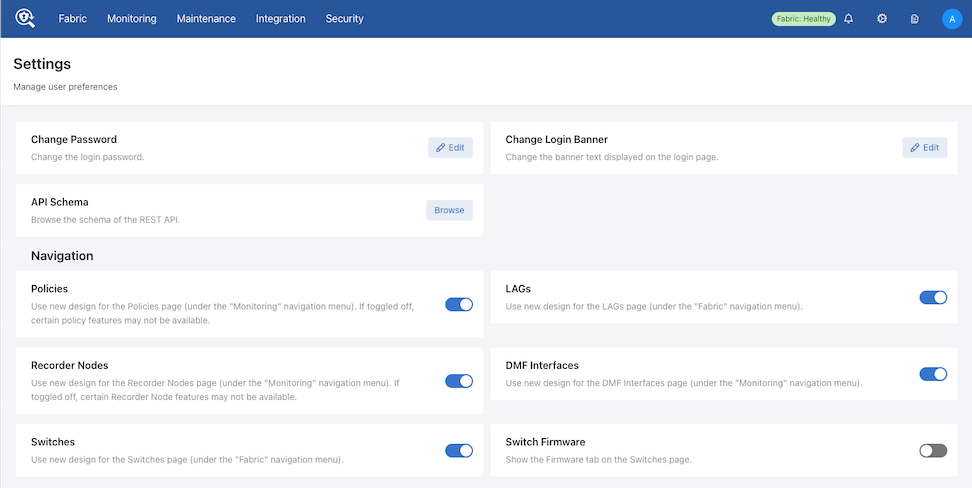
The Firmware dashboard is hidden by default (Dell switches are not supported in the DMF 8.7.0 release).

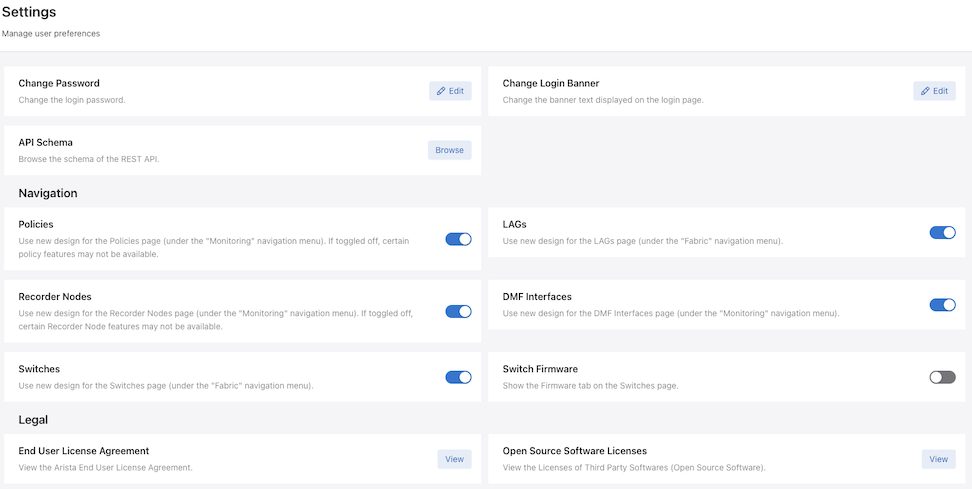
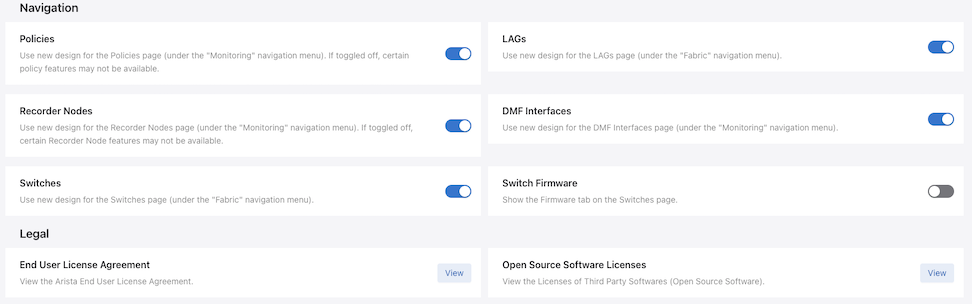
If required, enable the Firmware dashboard using Switch Firmware on the Settings page.

To access the page, select the Admin icon followed by Settings.
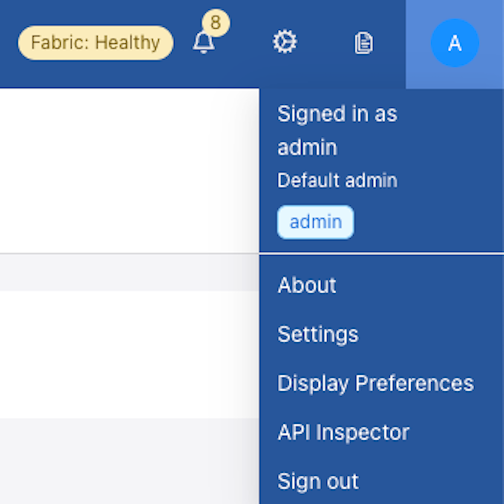
Figure 35. Admin Settings

Firmware

Select Fabric > Switches > Firmware .

Firmware Dashboard: A sortable display of all switch firmware properties currently installed in DMF.
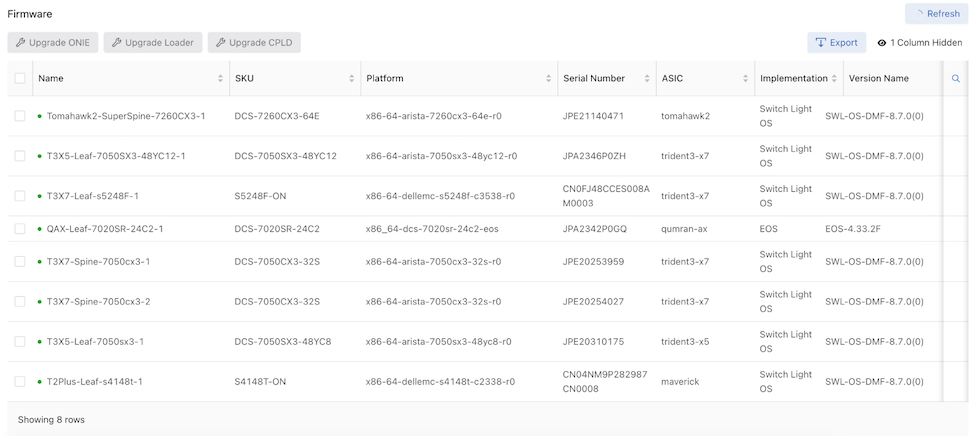
Figure 36. Firmware Dashboard

Columns include:

 
Name Manufacturer
SKU Platform
Serial Number ASIC
Implementation Version Name
Loader Version Next Loader Version
CPLD Next CPLD
ONIE Next ONIE

The Firmware dashboard comprises the following components:

  • Refresh: By default, the system refreshes data every 60 seconds. Hovering over Refresh displays the time remaining until the next update. When required, select Refresh to update the data immediately.
  • Actions:

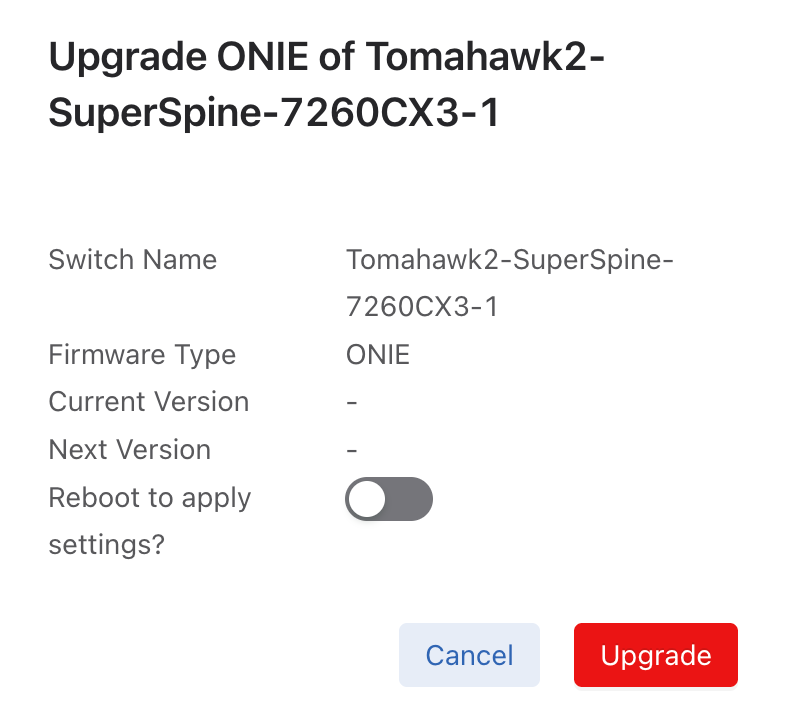
    • Upgrade ONIE: Upgrade the ONIE settings of the current switch from the Current Version to the Next Version.

      Upgrade is disabled unless one switch is selected.

      Figure 37. Upgrade ONIE
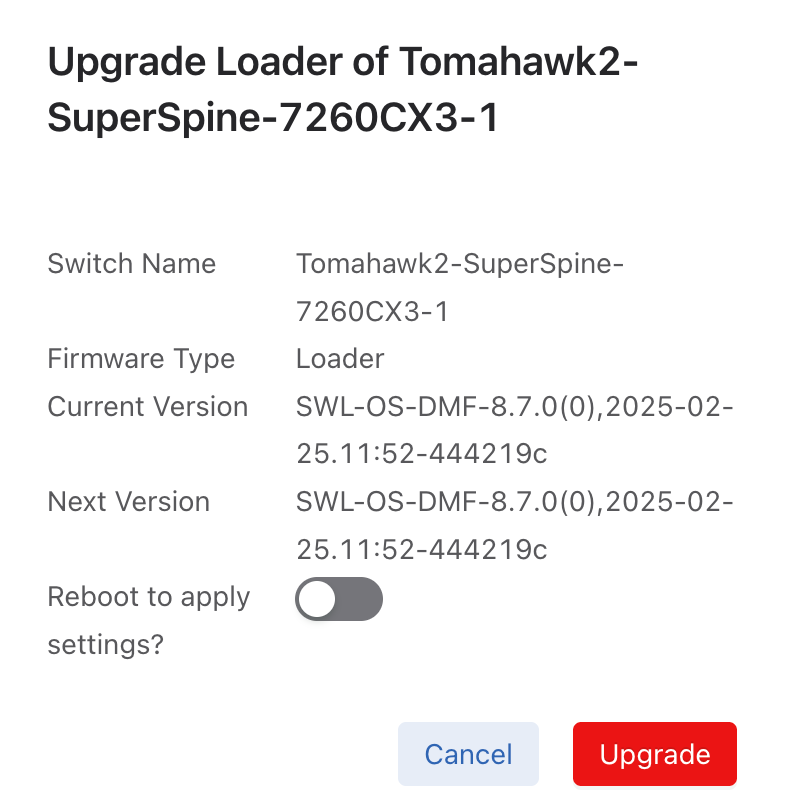
    • Upgrade Loader: Upgrade the Loader settings of the current switch from the Current Version to the Next Version.

      Upgrade is disabled unless one switch is selected.

      Figure 38. Upgrade Loader
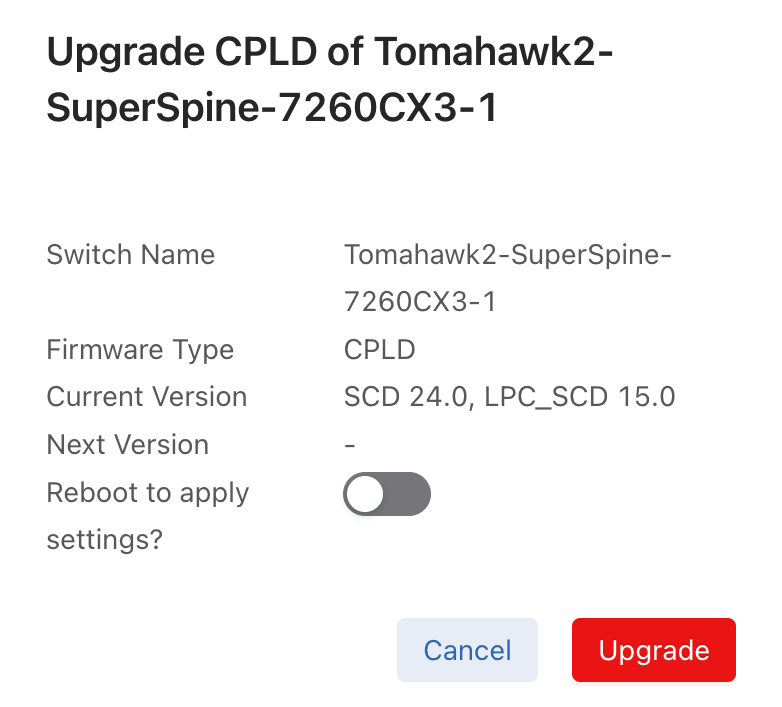
    • Upgrade CPLD: Upgrade the CPLD settings of the current switch from the Current Version to the Next Version.

      Upgrade is disabled unless one switch is selected.

      Figure 39. Upgrade CPLD
    • Export: Export data in CSV or JSON format.
      Figure 40. Export Data
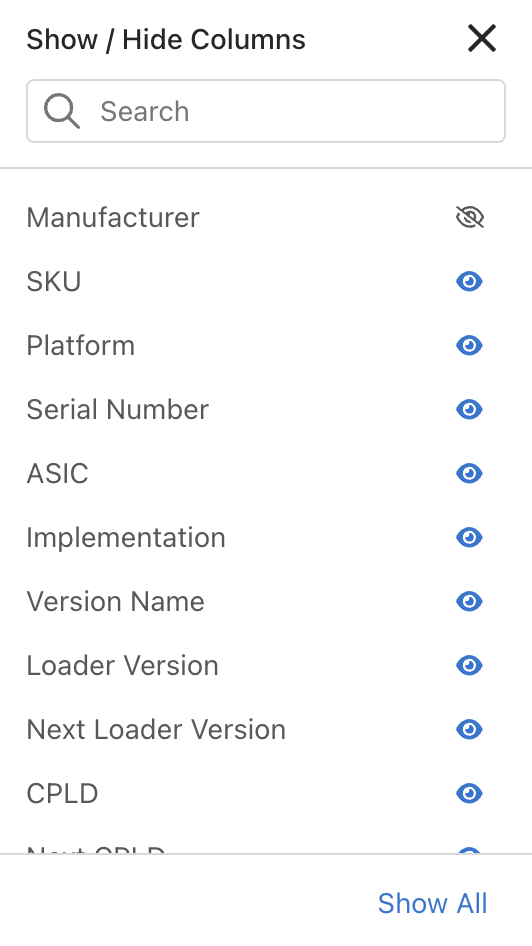
    • Show / Hide Columns determine the information displayed in the dashboard and are user-selectable. Selections persist until changed.
      Note: The Name column cannot be hidden.
      Figure 41. Show / Hide Columns
    • Search: Filter rows with matching text.

Revert to the Legacy Dashboard

You can choose to remain on the legacy dashboard by toggling the Switches setting in the Settings dashboard.

To do so, select Admin > Settings and turn off the Switches setting.

Figure 42. DMF Settings Dashboard
The Switches UI reverts to the legacy dashboard.
Figure 43. Legacy Switches Dashboard

Accept Additional MAC Address Formats

When configuring the MAC address of a switch, CLI commands and REST endpoints will accept a MAC address formatted as three groups of four hexadecimal digits separated by periods (e.g. 1122.3344.5566) in addition to the already accepted form of six hexadecimal digit pairs separated by colons (e.g. 11:22:33:44:55:66). To ensure continued compatibility for all downstream users, an address in the period-separated format is automatically translated into the colon-separated format in the configuration.

When configuring a MAC address for a switch using a method of choice (CLI, GUI, REST), enter the MAC address using the period-separated format as shown in the following example:
c1(config)# switch core1
c1(config-switch)# mac 1234.5678.9abc
c1(config-switch)# show this

! switch
switch core1
  mac 12:34:56:78:9a:bc

Considerations

The system does not maintain the format used for a given address in the configuration. Regardless of the address format entered in the configuration, it is stored and presented in the colon-separated format.

DMF Interfaces

To monitor traffic, assign a role to each of the DANZ Monitoring Fabric (DMF) interfaces, which can be of the following four types:
  • Filter Interfaces: ports where traffic enters the DMF. Use filter interfaces to TAP or SPAN ports from production networks.
  • Delivery Interfaces: ports where traffic leaves the DMF. Use delivery interfaces to connect to troubleshooting, monitoring, and compliance tools. These include Network Performance Monitoring (NPM), Application Performance Monitoring (APM), data recorders, security (DDoS, Advanced Threat Protection, Intrusion Detection, etc.), and SLA measurement tools.
  • Filter and Delivery interfaces: ports with both incoming and outgoing traffic. When placing the port in loopback mode, use a filter and delivery interface to send outgoing traffic back into the switch for further processing. To reduce cost, use a filter and delivery interface when transmit and receive cables are connected to two separate devices.
  • Service interfaces: interfaces connected to third-party services or network packet brokers, including any interface that sends or receives traffic to or from an NPB.

In addition, interfaces connected to managed service nodes and DANZ recorder nodes can be referenced in the configuration directly without assigning a role explicitly. Also, Inter-Switch Links (ISLs), which interconnect DANZ monitoring switches, are automatically detected and referred to as core interfaces.

This chapter describes configuring DMF interfaces.

Overview

While preserving the information from the previous DMF version, the updated DMF Interfaces user interface introduces a new layout, design, and enhanced functionalities for improved interface viewing and monitoring for easy troubleshooting.

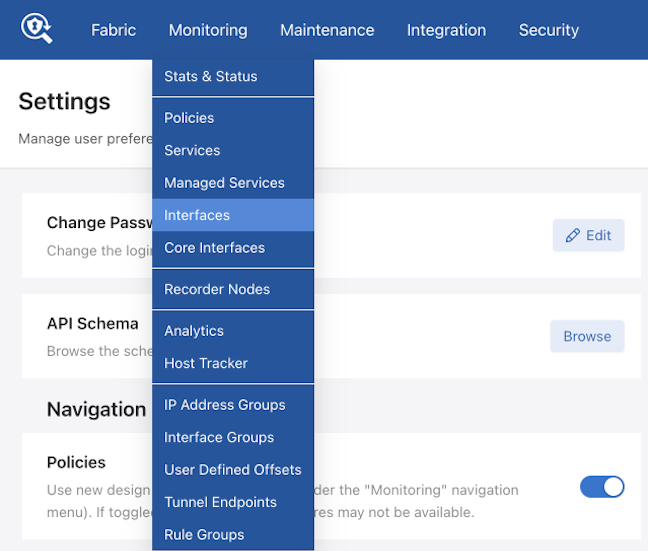
Select Monitoring > Interfaces to access DMF Interfaces.

Figure 44. Monitoring Interfaces

Overview Dashboard

Overview is the default landing page for DMF Interfaces.
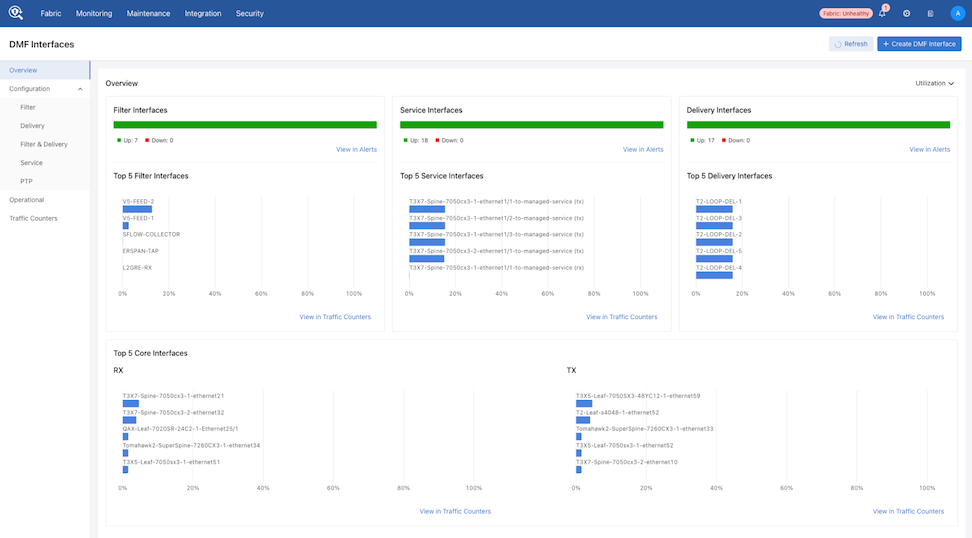
Figure 45. Overview Dashboard

DMF displays interface status in:

  • Filter Interfaces
  • Service Interfaces
  • Delivery Interfaces

Each interface displays an Up and Down count.

Select View Alerts to navigate to the Alerts dashboard for more details on the down interfaces.
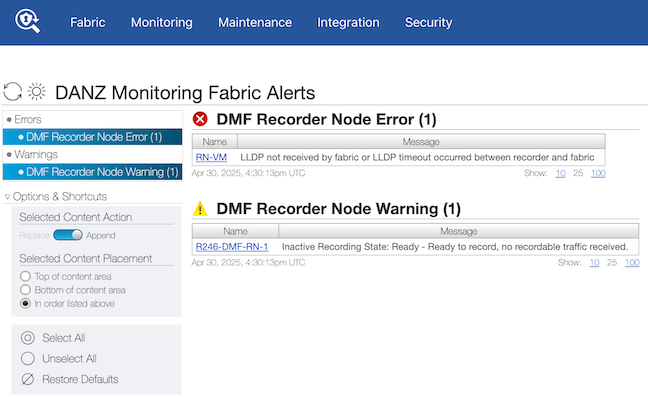
Figure 46. Interface Alerts

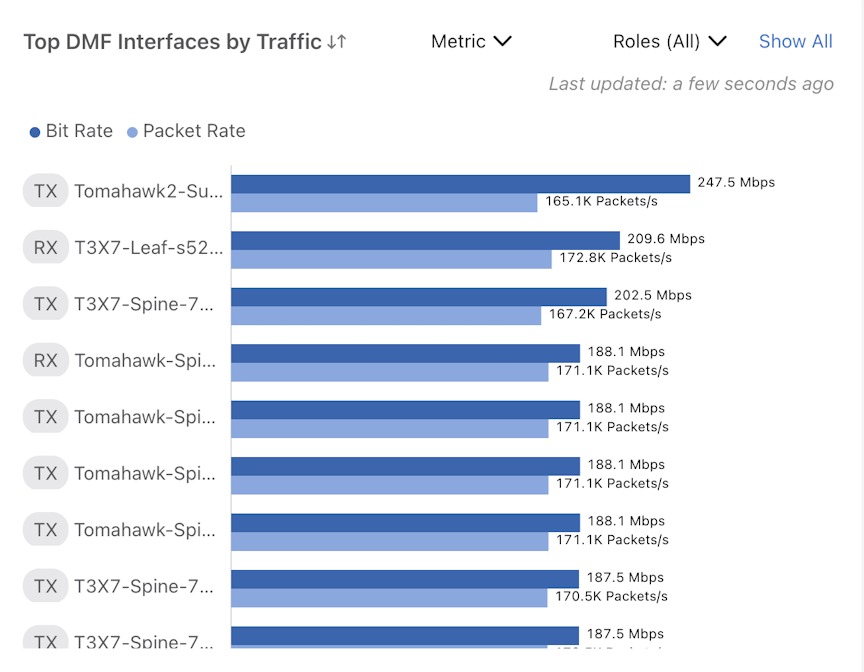
DMF displays interface metrics in:

  • Top 5 Filter Interfaces
  • Top 5 Service Interfaces
  • Top 5 Delivery Interfaces
  • Top 5 Core Interfaces
    • RX - Receive
    • TX - Transmit

Select View in Traffic Counters to navigate to Traffic Counters (described later in this section).

Select the Utilization, Bit Rate, or Packet Rate (Unit) drop-down to switch between utilization, bit rate, and packet rate data. The Overview widgets update with the selected unit type. The selection persists until changed.
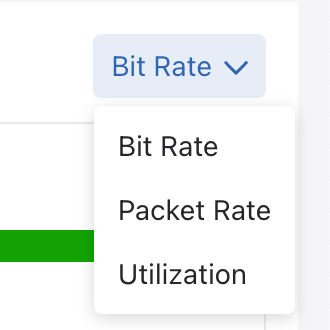
Figure 47. Units

Configuration

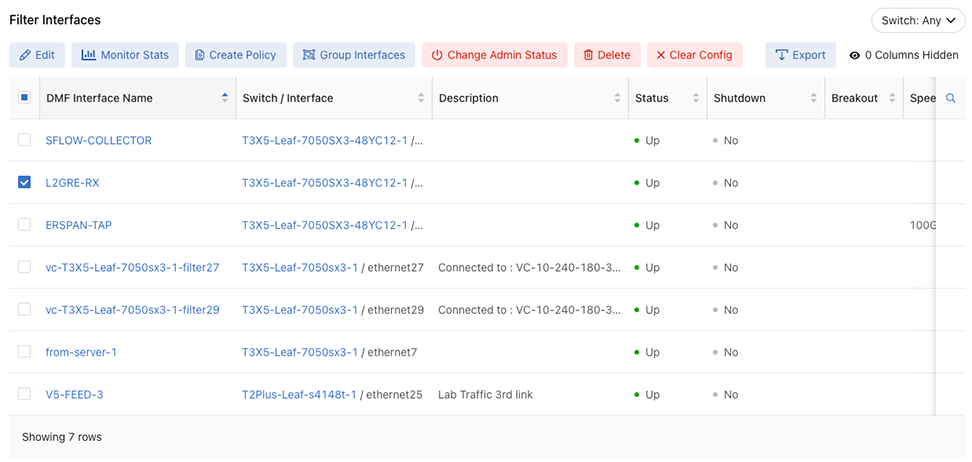
The Configuration dashboard displays tabular configuration information for the following:

  • Filter Interfaces
  • Delivery Interfaces
  • Filter & Delivery Interfaces
  • Service Interfaces
  • PTP Interfaces

Action Buttons (Example - Filter Interfaces)

Edit DMF Interface: Edit opens the Edit DMF Interface window, which is pre-populated with the interface information.
  • When selecting multiple rows Edit is disabled.

Monitor Stats opens the Traffic Counters (described later in this section) window.

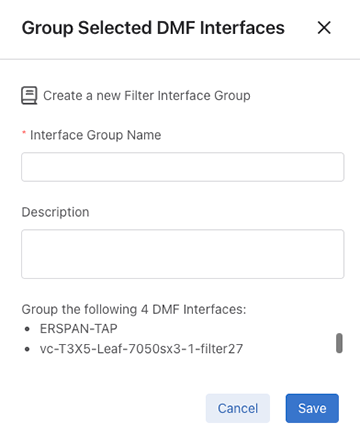
Group Interfaces opens the Group Selected DMF Interfaces configuration window, which is pre-populated with the selected interfaces.
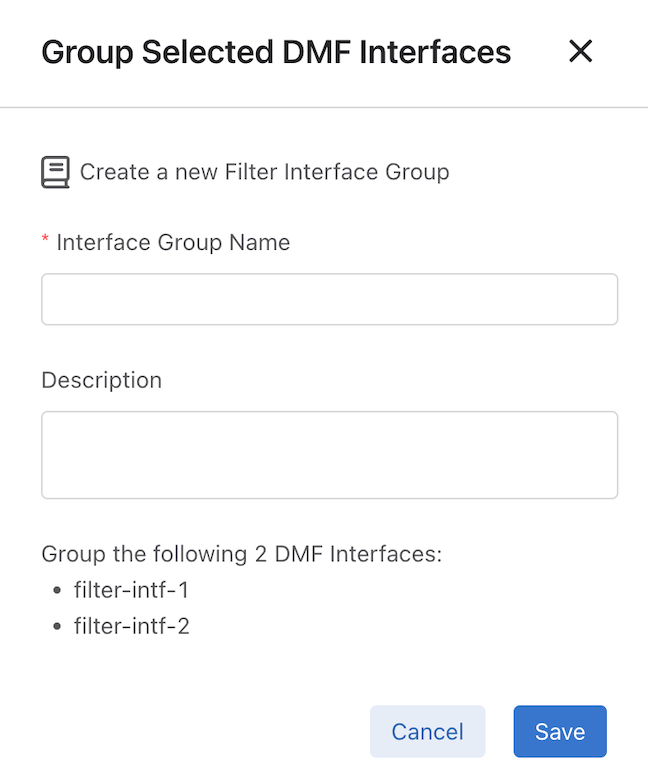
Figure 48. Group Selected DMF Interfaces

Create Policy opens the Create Policy configuration window for the selected interfaces.
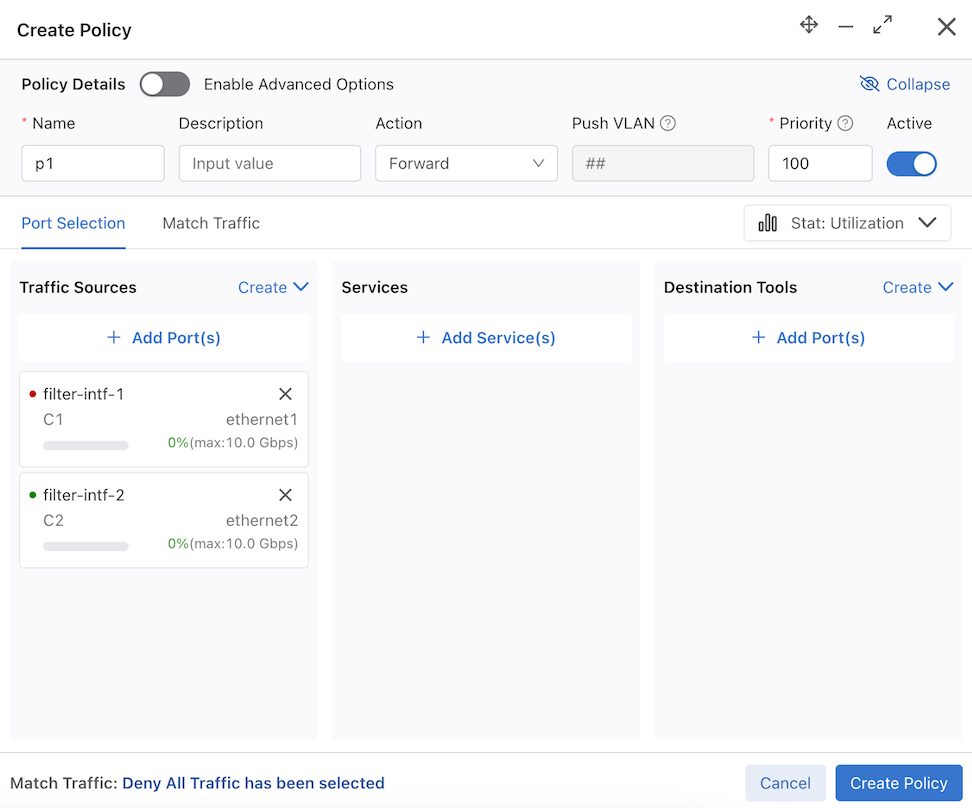
Figure 49. Create Policy

Group Interfaces opens the Group Selected DMF Interfaces window for the selected interfaces.
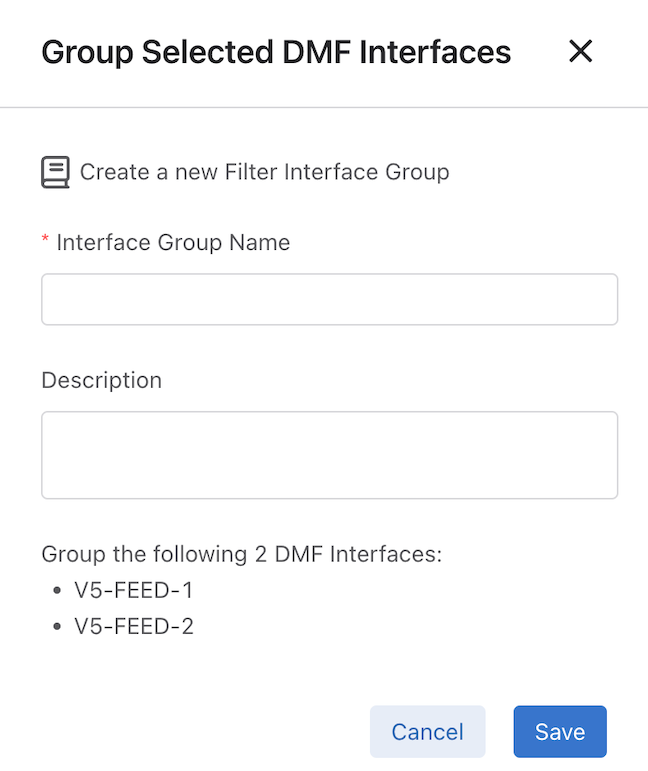
Figure 50. Group Selected DMF Interfaces
Tip: When grouping more than two interfaces, hover over a name and use the scroll feature to view the interface names.


There is an option to select the type of role to assign to the Filter and Delivery interfaces.
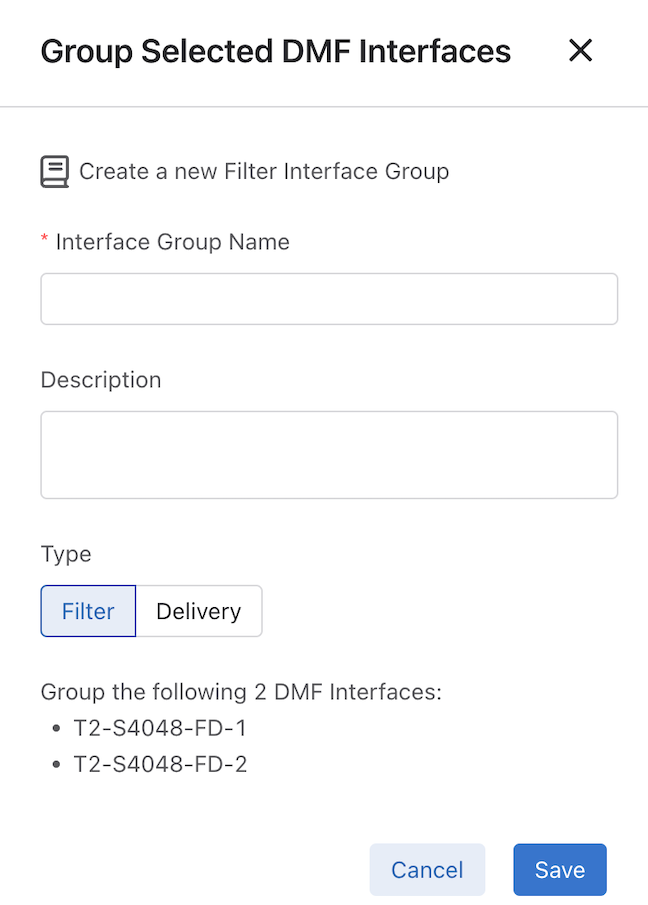
Figure 51. Filter and Delivery Type

Change Admin Status changes the Admin Status (Up or Down).
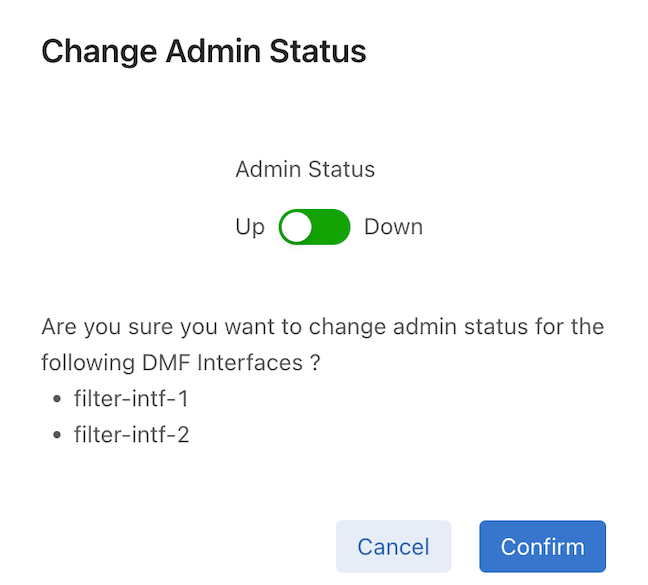
Figure 52. Change Admin Status

Delete (Delete DMF Interface) removes a DMF Interface role-specific configuration from an interface. It does not remove the entire configuration.
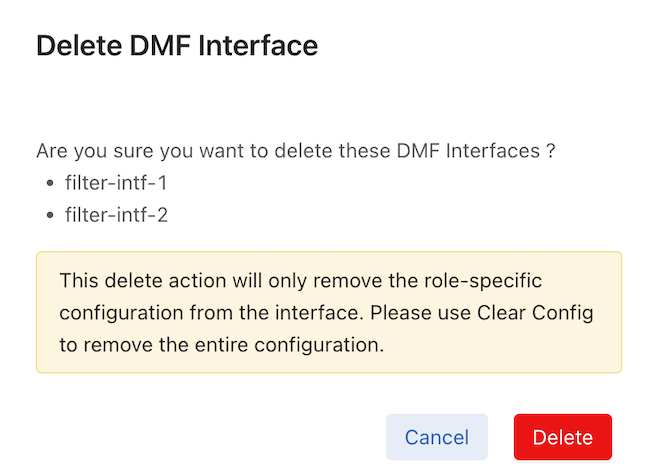
Figure 53. Delete DMF Interface

Clear Config (Clear Interface Configuration) removes the entire configuration for the DMF Interface.
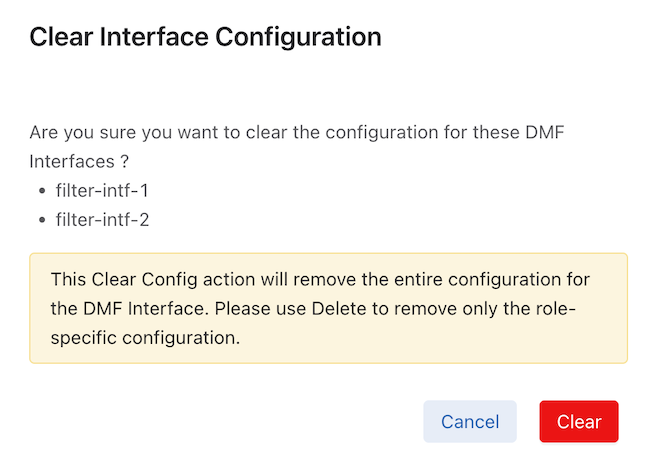
Figure 54. Clear Interface Configuration

Export saves interface data content in a CSV or JSON format in the browser's download folder.
Show / Hide Columns determine the information displayed in the dashboard and are user-selectable. Selections persist until changed.
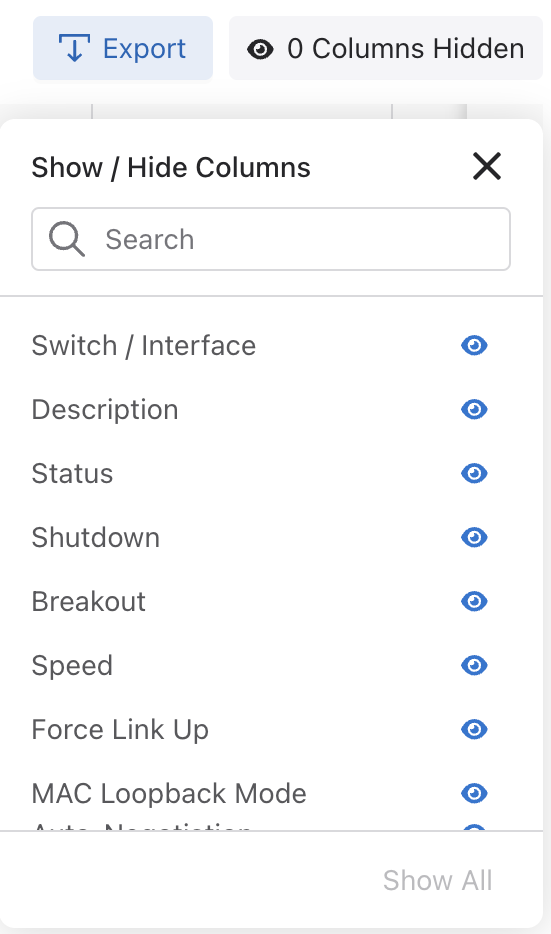
Figure 55. Show / Hide Columns

Switch filters by switch name using Includes and Excludes.
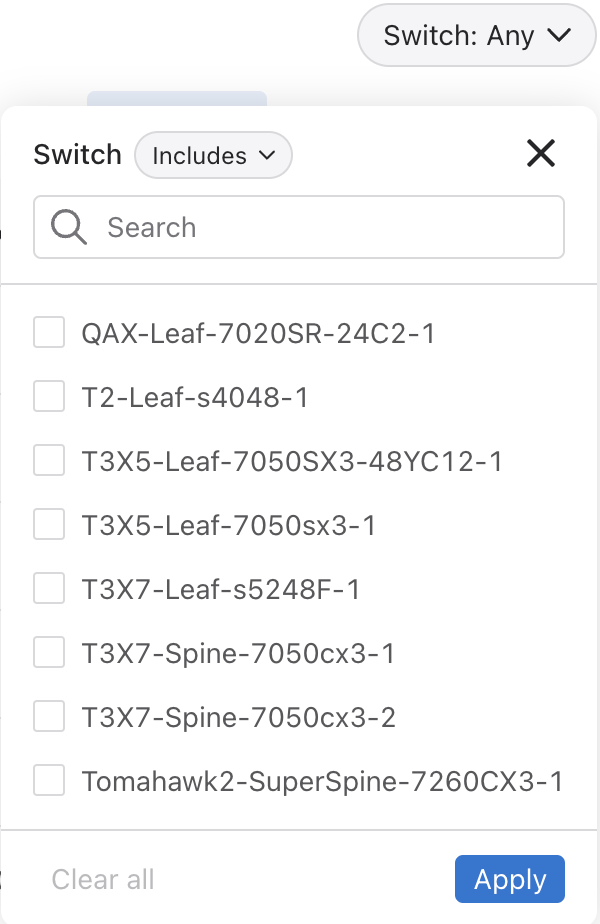
Figure 56. Switch Selection

Enable Search functionality by column using the search icon. Type to Search appears in each column. Enter the required search criteria.
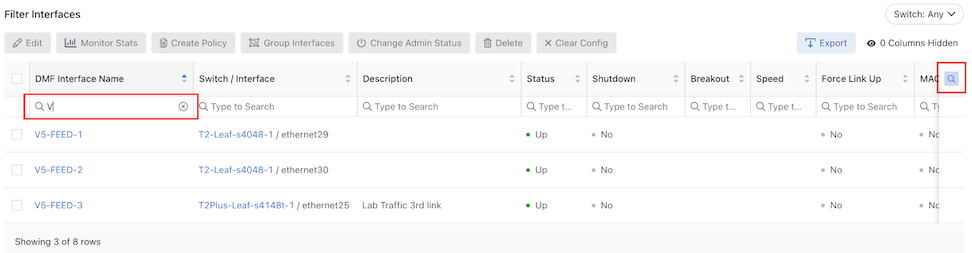
Figure 57. Search

Interface Details View

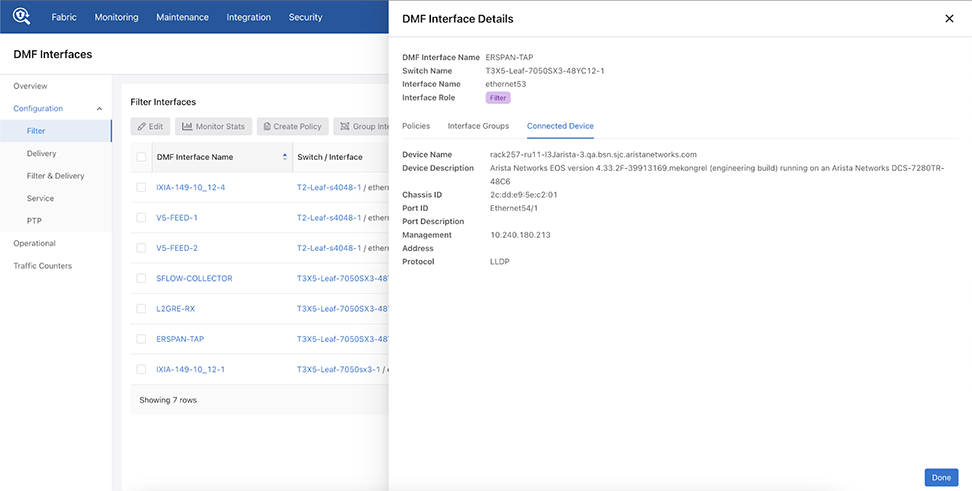
Selecting a DMF Interface Name entry opens the DMF Interface Details window for the Filter, Delivery, and Filter & Delivery interfaces.

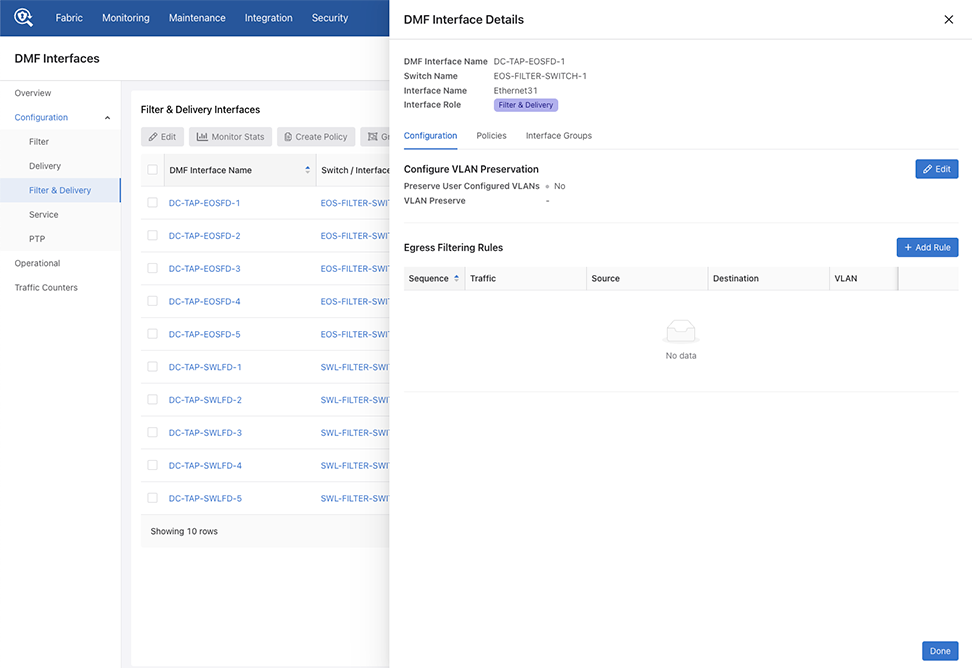
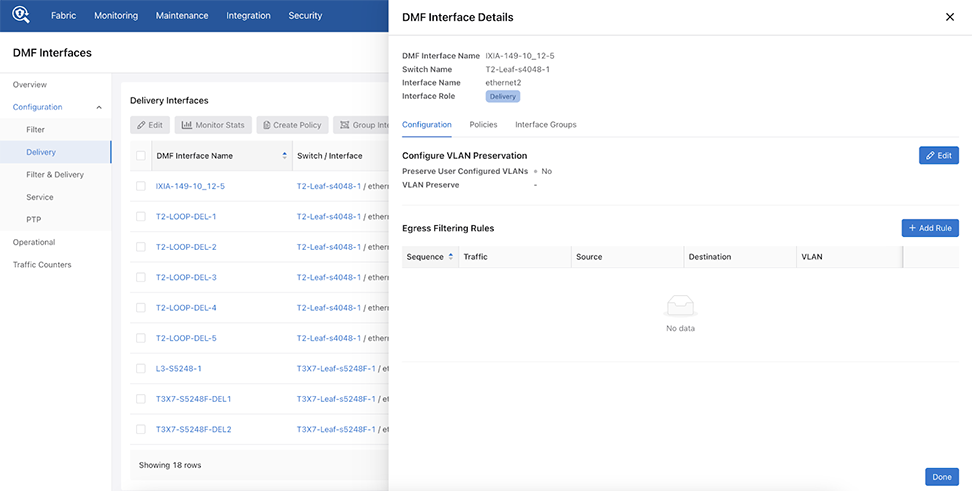
The DMF Interface Details view displays interface information associated with Policies, Interface Groups, and Connected Devices. It supports configuring VLAN Preservation and Egress Filtering Rules, as shown in the following examples:
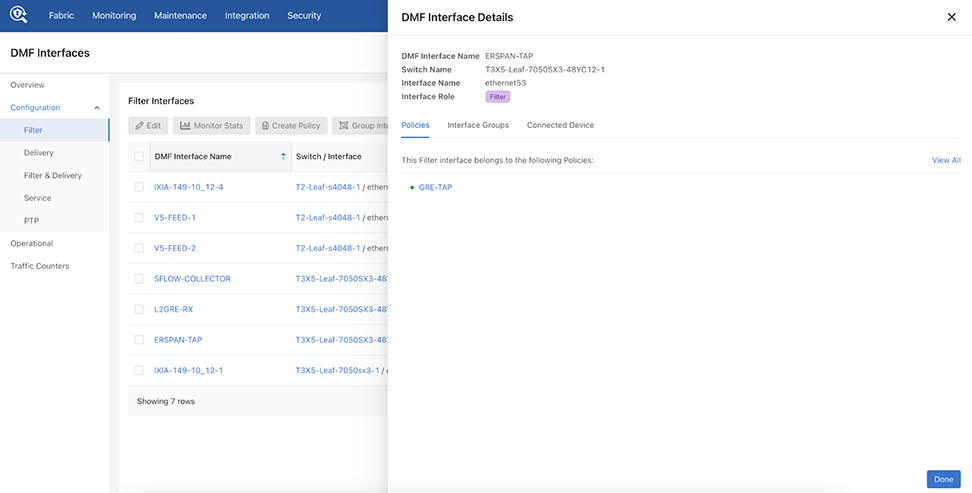
Figure 58. DMF Interface Details - Policies

Hovering over a filter interface configured in a policy displays further status and configuration information:
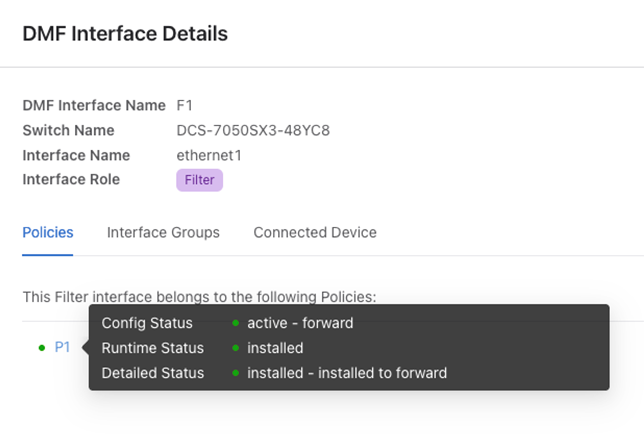
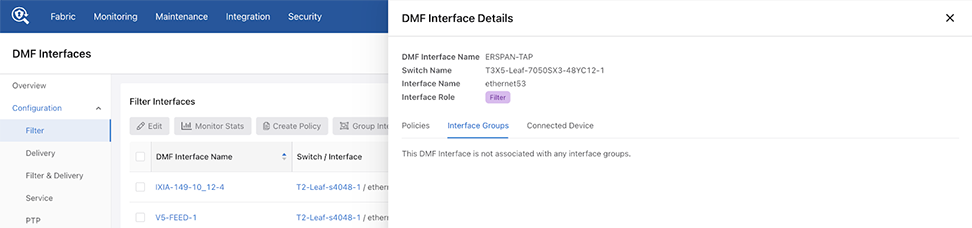
Figure 59. Filter Interface - Policy
Figure 60. DMF Interface Details - Interface Groups


Figure 61. DMF Interface Details - Connected Devices
Figure 62. DMF Interface Details - Filter & Delivery
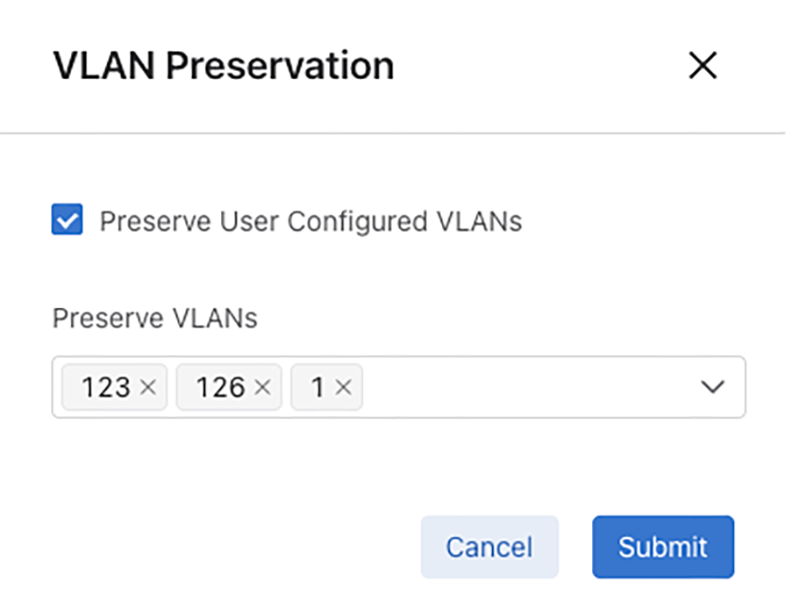
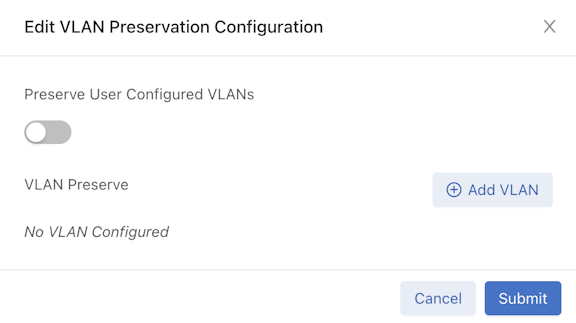
Select Edit to configure VLAN Preservation. Enable the Preserve User Configured VLANs checkbox, use the drop-down menu, and select the required VLAN numbers to preserve.
Figure 63. VLAN Preservation
Figure 64. DMF Interface Details - Egress Filtering Rules

Select + Add Rule Edit to create an egress filtering rule configure egress filtering. Enter the required information in the Create Egress Filtering Rule configuration window.
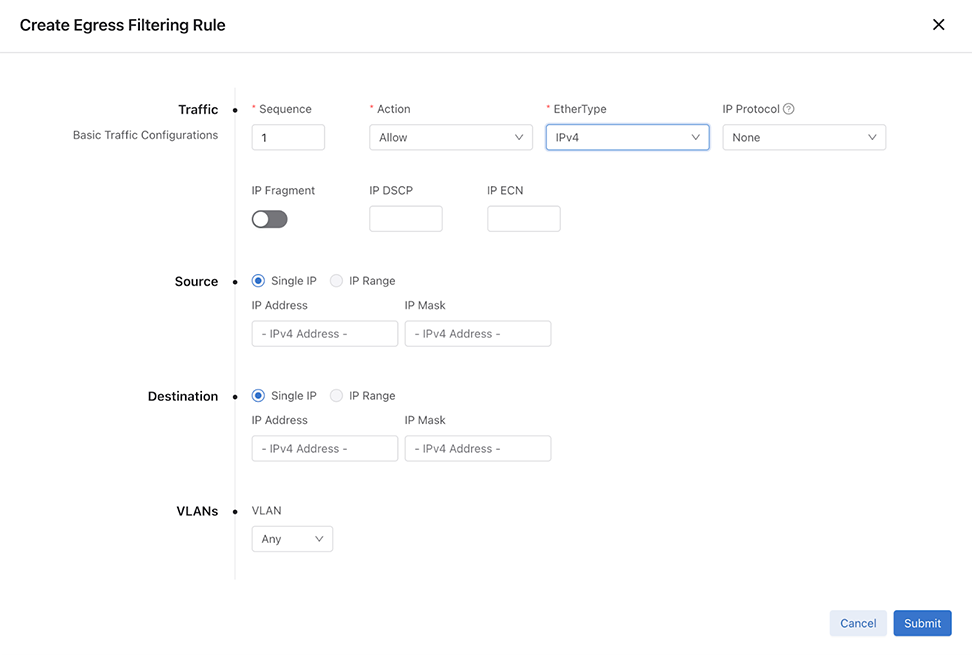
Figure 65. Create Egress Filtering Rule

Operational

The Operational dashboards displays functional information for each interface in tabular format.
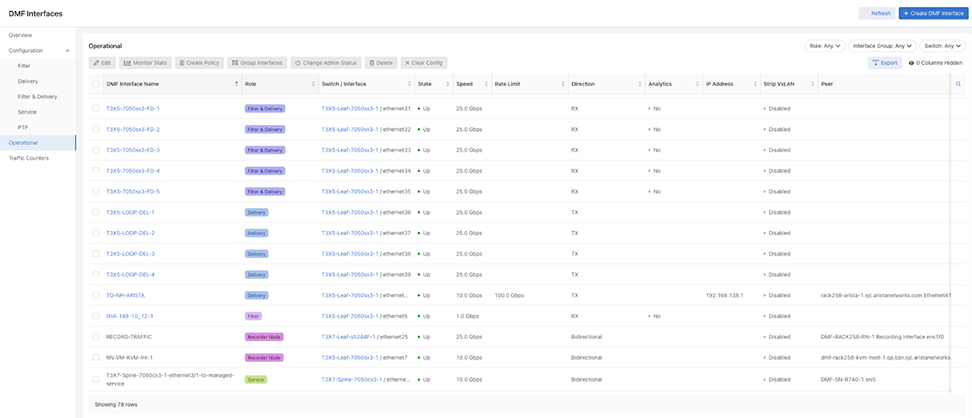
Figure 66. Operational Dashboard

Action Buttons

These work in the same manner as the action buttons in Configuration.

  • Edit

  • Monitor Stats
  • Create Policy
  • Group Interfaces
  • Change Admin Status
  • Delete
  • Clear Config
  • Export
  • Show / Hide Columns

Search

The Search function works in the same manner as the search function in Configuration.

Filters

  • Filter by Role - Search or select from the list and filter by Includes or Excludes.
    Figure 67. Filter by Role
  • Filter by Interface Groups - Search or select from the list.
    Figure 68. Filter by Interface Groups
  • Filter by Switch Name - Search or select from the list and filter by Includes or Excludes.

    Figure 69. Filter by Switch Name
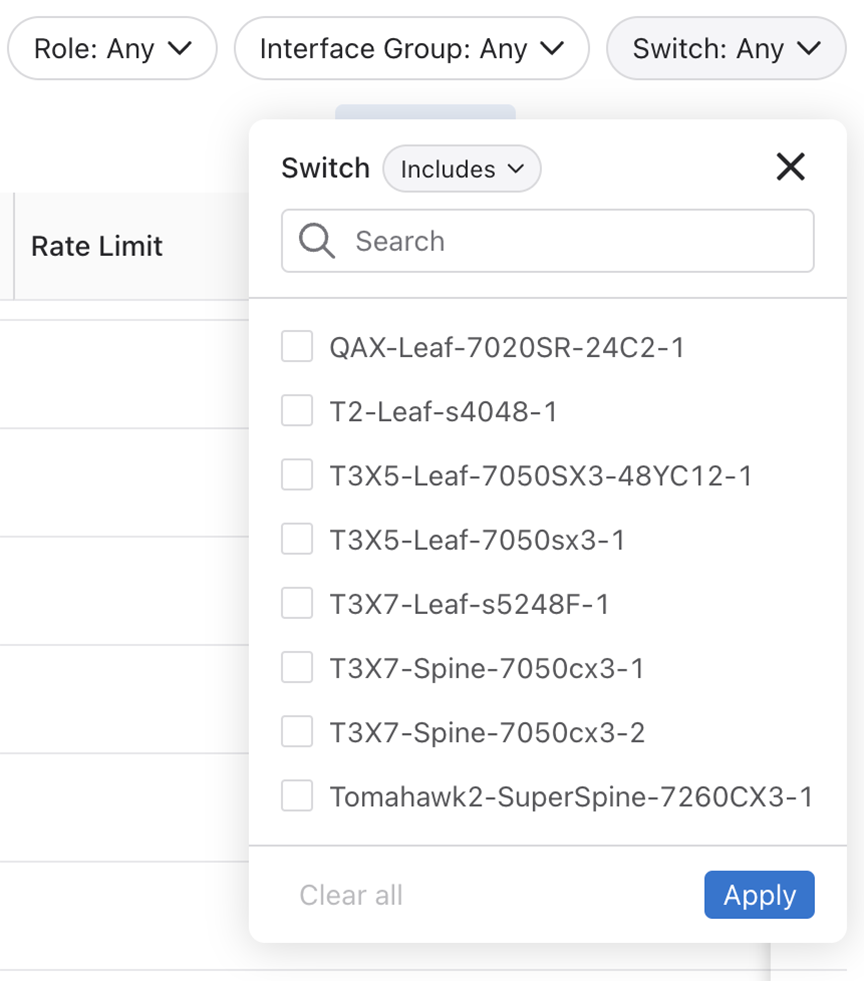
    Select Apply to begin filtering.

Traffic Counters

The Traffic Counters dashboard display the utilization statistics for the interfaces. Six time-series charts display the following stats:

  • RX Bit Rate
  • TX Bit Rate
  • RX Packet Rate
  • TX Packet Rate
  • TX Dropped Rate
  • TX Dropped Count

The charts are updated every 10 seconds and display each interface’s utilization.

You can select up to 10 interfaces at a time, and selecting a new interface re-initializes the charts, and polling begins for new interface utilization data.
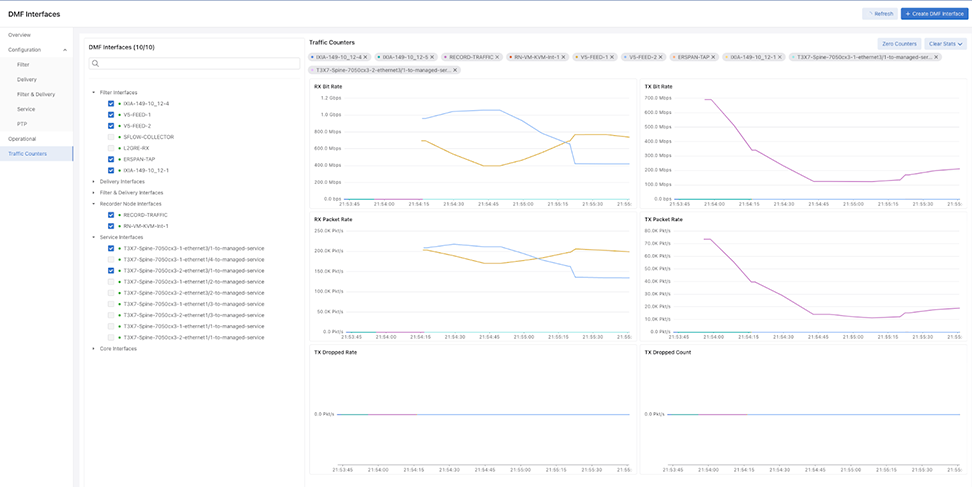
Figure 70. DMF Interfaces - Traffic Counters

Hovering over and selecting graph plot displays bit rate information.
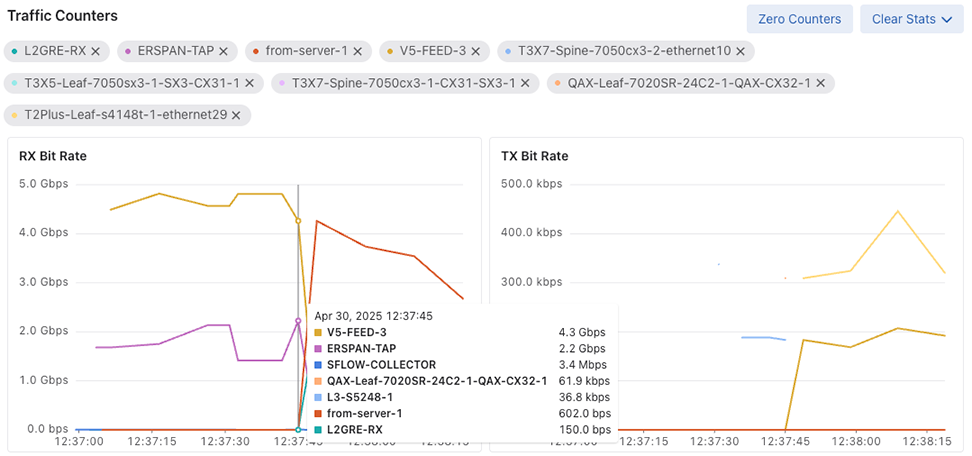
Figure 71. Traffic Counter Rollover

Action Controls

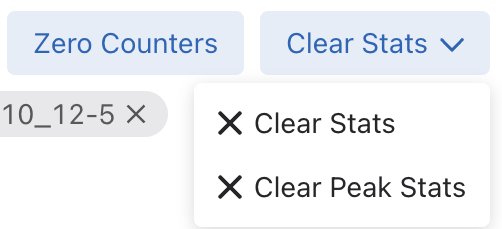
  • Zero Counters: Resets counters for the selected Interfaces in this UI session.
  • Clear Stats: Clear stats for the selected Interfaces.
  • Clear Peak Stats: Clear peak stats for the selected Interfaces.

Configure a DMF Interface

To use the DANZ Monitoring Fabric (DMF) GUI to configure a fabric interface as a Filter, Service, Delivery, Filter & Delivery, or PTP interface, perform the following steps:
  1. Select Monitoring > Interfaces from the main menu to display the DMF interfaces.
    Figure 72. DMF Interfaces
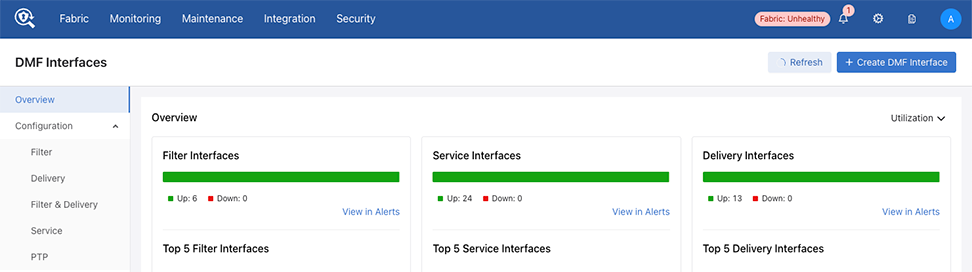
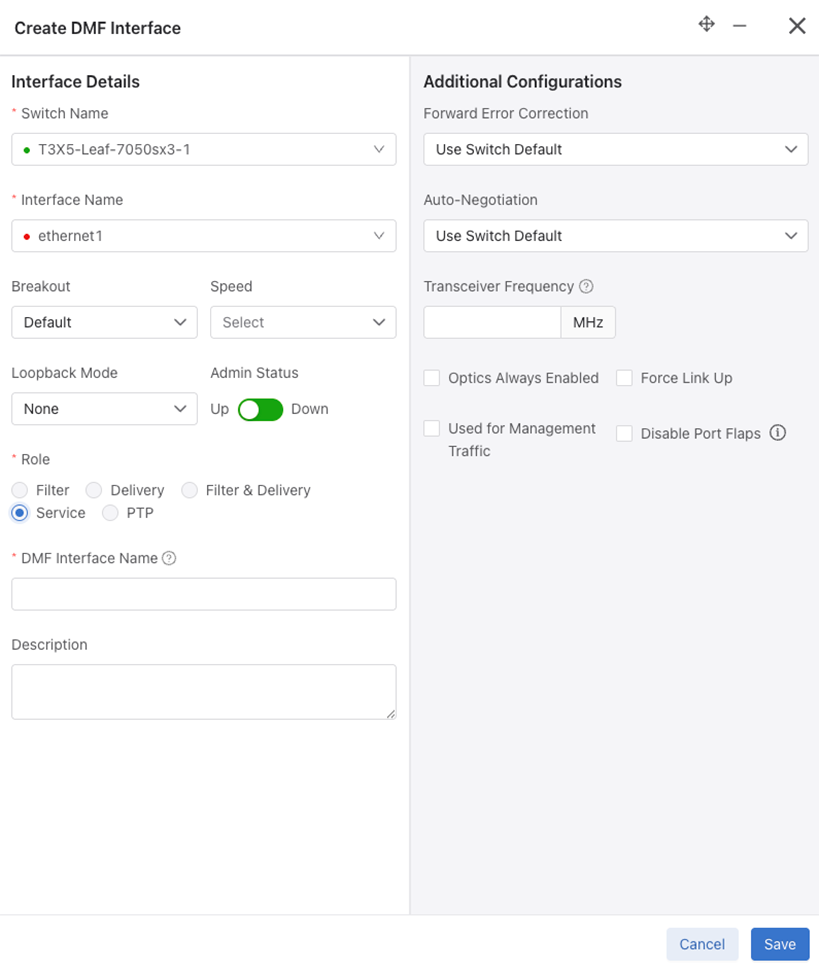
  2. Select the + Create DMF Interface to configure a new interface.
    Figure 73. Create Interface
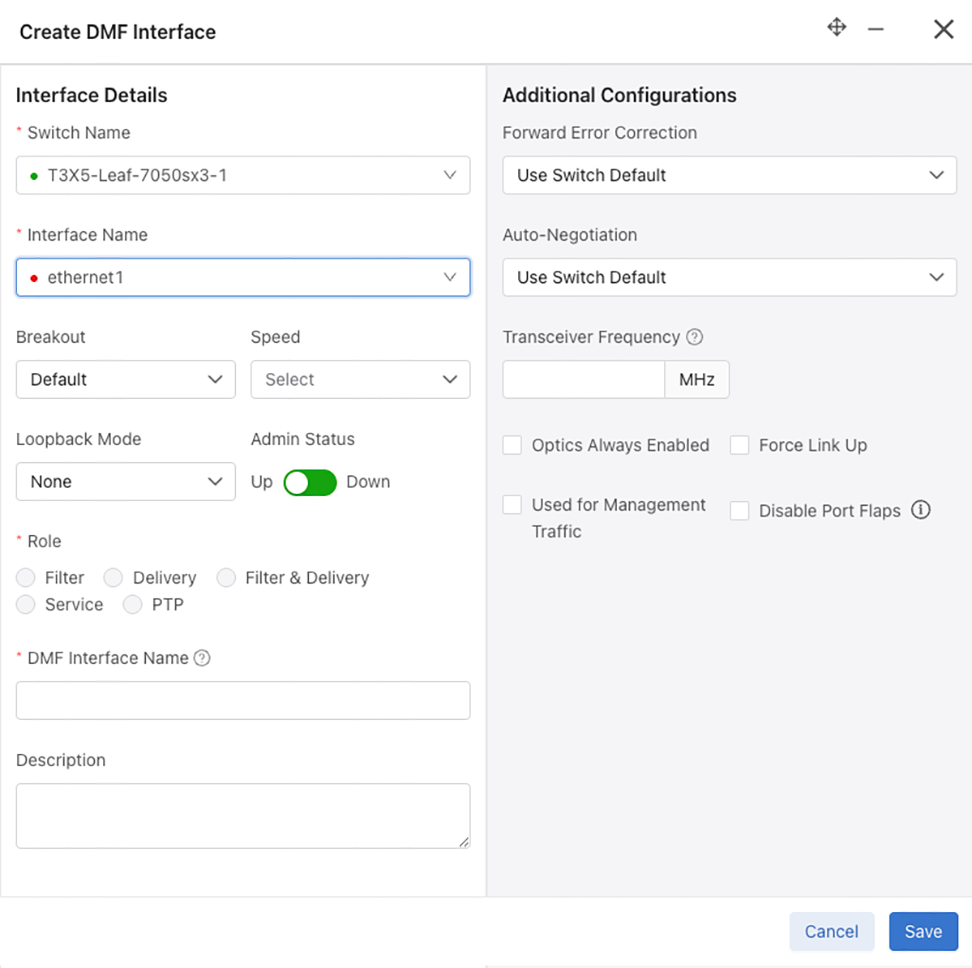
  3. Select the Switch Name and Interface Name.
  4. Define the Role for the interface.
    • Filter
    • Delivery
    • Filter & Delivery
    • Service
    • PTP
  5. Enter a DMF Interface Name and a Description (optional).
  6. If required, enter an IPv4 Address for receiving IP datagram traffic in a Filter or Delivery role.
  7. Complete the settings in Additional Configurations, as required, for the selected role.
    • Forward Error Correction - Select from a drop-down list of FEC codes.
    • Auto-Negotiation - Enable or Disable
    • Transceiver Frequency
    • Optics Always Enabled (checkbox)
    • Force Link Up (checkbox)
    • Used for Management Traffic (checkbox)
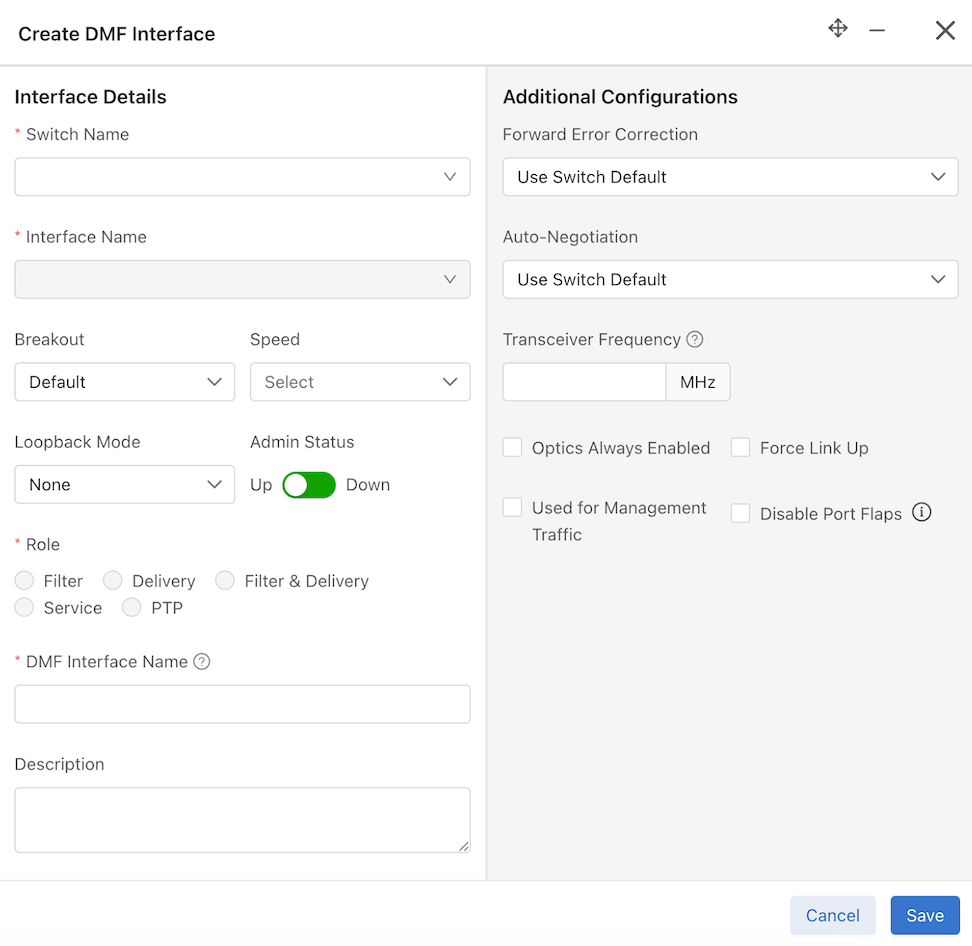
    • Disable Port Flaps (checkbox) - If the Error Disable feature is enabled globally, checking this input will disable the Error Disable feature on this interface temporarily.
  8. Select Save to save the configuration.
The following images depict the specific Additional Configurations settings for each role.

Filter Interface Role

Additional configuration settings for the Filter role include:

  • Enable sFlow (checkbox) - Enabled by default.
  • Enable Analytics (checkbox) - Enabled by default. For information about Analytics, refer to the Analytics Node User Guide.
  • Disable Transmitting Packets (checkbox)
  • Strip VXLAN - Enable or Disable
  • Rewrite Dest. MAC Address - The provided MAC address will overwrite the destination MAC address of packets received on this interface.
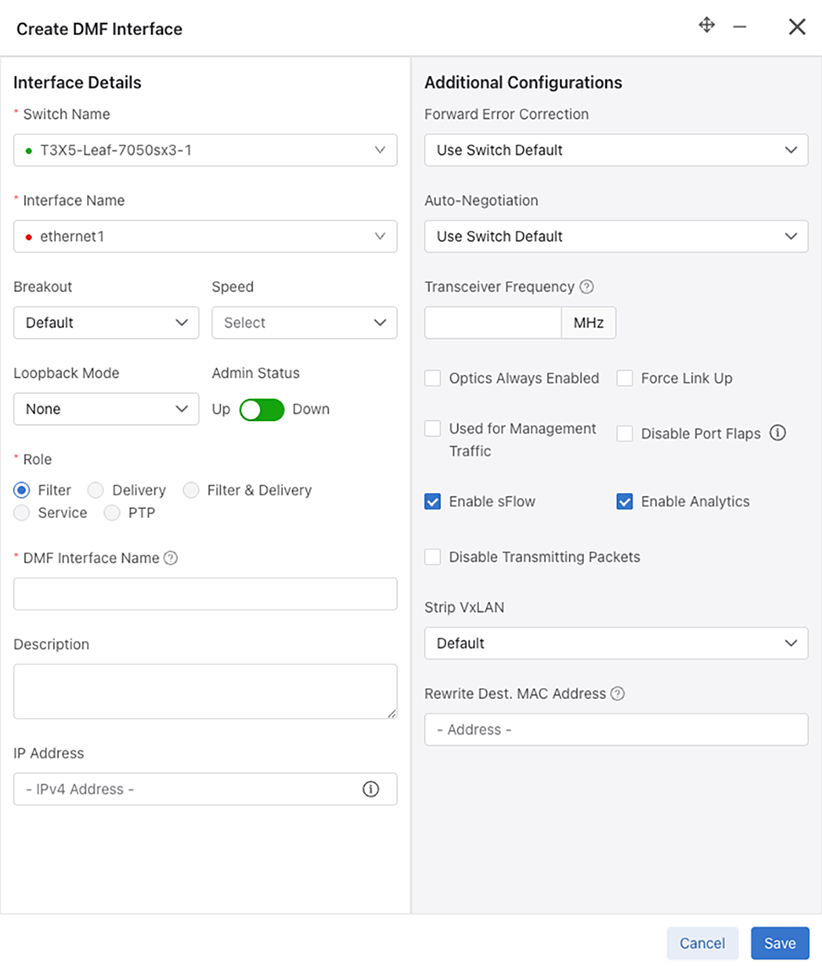
Figure 74. Role - Filter Interface

Delivery Interface Role

Additional configuration settings for the Delivery role include:

  • Rate Limit - Enter a value and select bit rate kbps, Mbps, or Gbps.
  • ARP Interval - Default is 5 seconds.
  • Rewrite VLAN - The vlan tag to push/rewrite for this interface.
  • Next Hop ID - IPv4 Address. Next hop IP that is reachable via delivery interface with local mask.
  • Subnet Mask - IPv4 Address
  • Strip VLAN on Egress - Default, None, One, Two, or Second.
  • VLAN Preservation (checkbox) - Enabled by default.
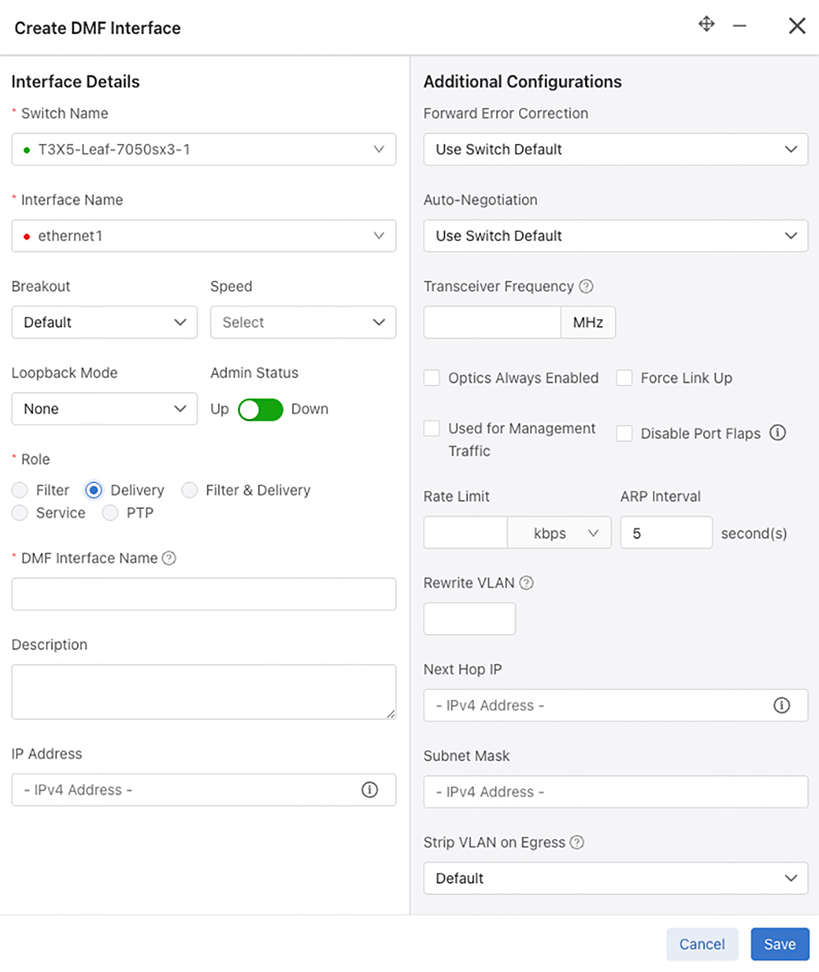
Figure 75. Role - Delivery Interface

Filter & Delivery Interface Role

Additional configuration settings for the Filter & Delivery role include:

  • Enable sFlow (checkbox) - Enabled by default.
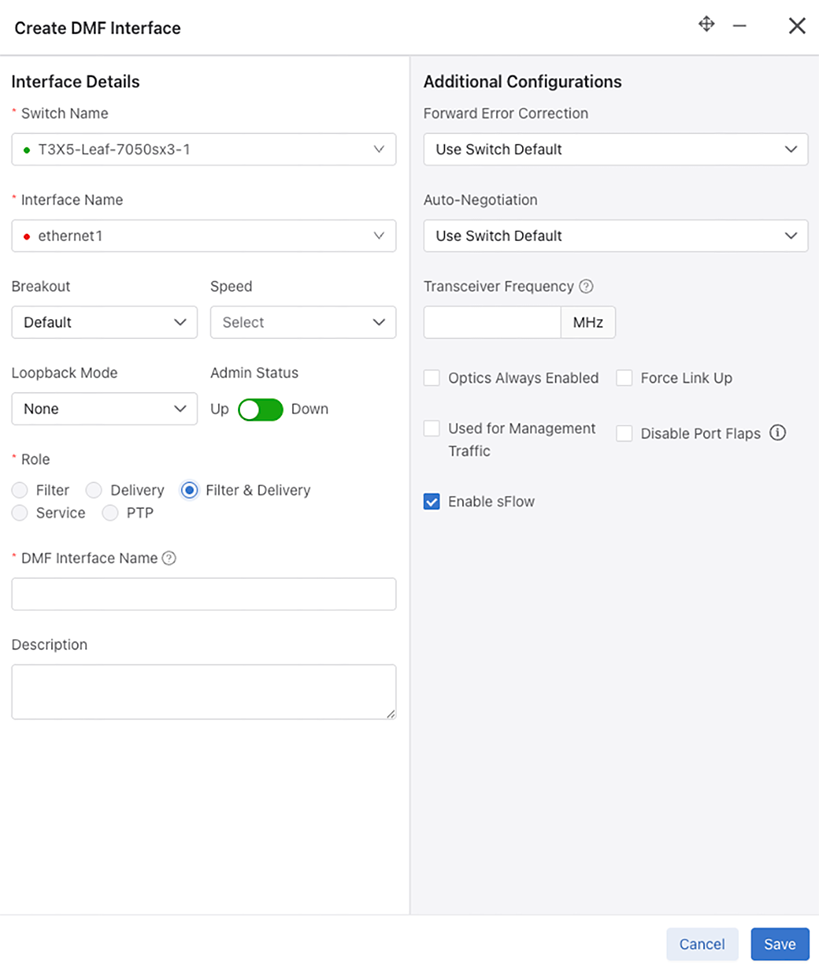
Figure 76. Role - Filter & Delivery Interface

Service Interface Role

Figure 77. Role - Service Interface

PTP Interface Role

Settings for PTP configurations:
  • Switchport Mode - Access, Routed, or Trunk.
  • Announce Interval - Set PTP announce interval between messages (-3 to 4).
  • Delay Request Interval - Set PTP delay request interval between messages (-7 to 8).
  • Sync Message Interval - Set PTP sync message interval between messages (-7 to 3).
  • VLANS - Select from a drop-down list of VLANs.
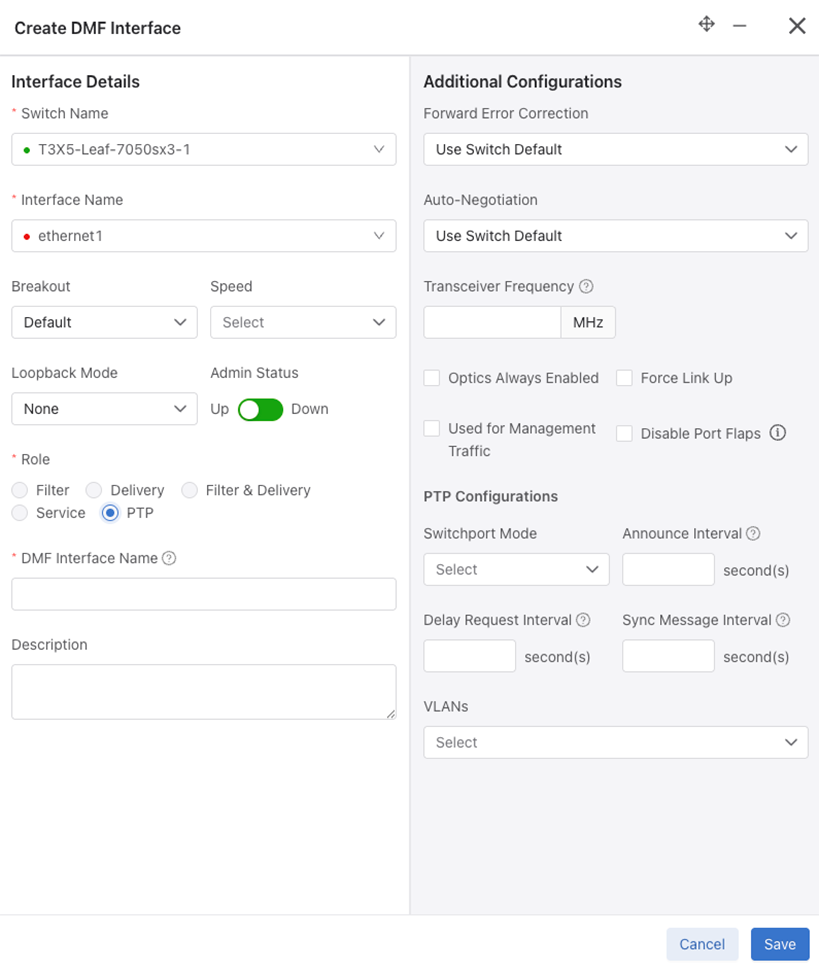
Figure 78. Role - PTP Interface

Identify a Filter Interface using Destination MAC Rewrite

In the UI, configure the Rewrite Dest. MAC Address for a Filter Interface using one of the two workflows detailed below.

Workflow one uses the Monitoring > Interfaces , while the second uses the Fabric > Interfaces . To use the second workflow, proceed to step 6, detailed below.

Workflow One

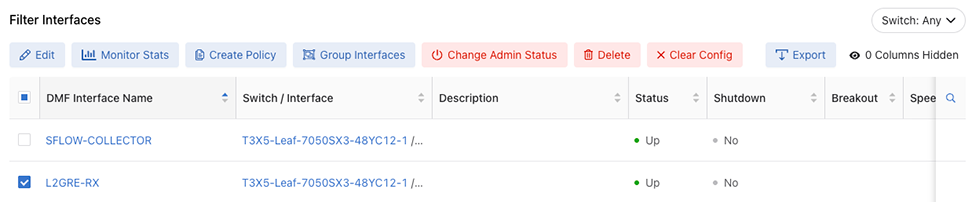
Navigate to Monitoring > Interfaces > Configuration > Filter .
Figure 79. Filter Interfaces

Filter Interfaces

  1. To create a Filter interface refer to Configure a DMF Interface Filter role.
  2. Enter the required Rewrite Dest. MAC Address. The provided MAC address will overwrite the destination MAC address of packets received on this interface.
  3. Select the Role > Filter for the desired interface and use the Rewrite Dest.MAC Address input to configure the MAC address to override.
    Figure 80. Role - Filter Interface
  4. Select Save to continue.

Edit Interface

  1. Select the row menu of the filter interface to configure or edit, and select Edit.
    Figure 81. DANZ Monitoring Fabric (DMF) Interfaces - Edit
Workflow Two

Navigate to Fabric > Interfaces and perform the following steps.

  1. In the Configure step, use the Rewrite Dest. MAC Address input to configure the MAC address to override.
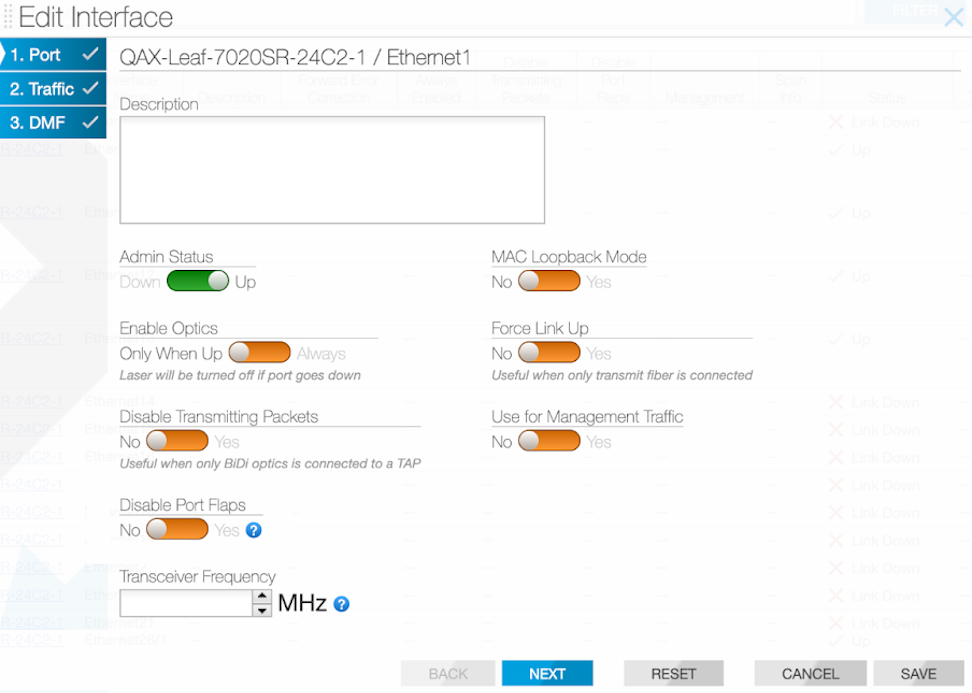
  2. Select the row menu of the switch interface associated with the filter interface and select followed by Configure.
    Figure 82. Configure Interface
  3. In the DMF tab, select the Rewrite Dest.MAC Address field to enter the MAC address to be overridden.
    Figure 83. Edit Interface DMF Rewrite Dest. MAC Address
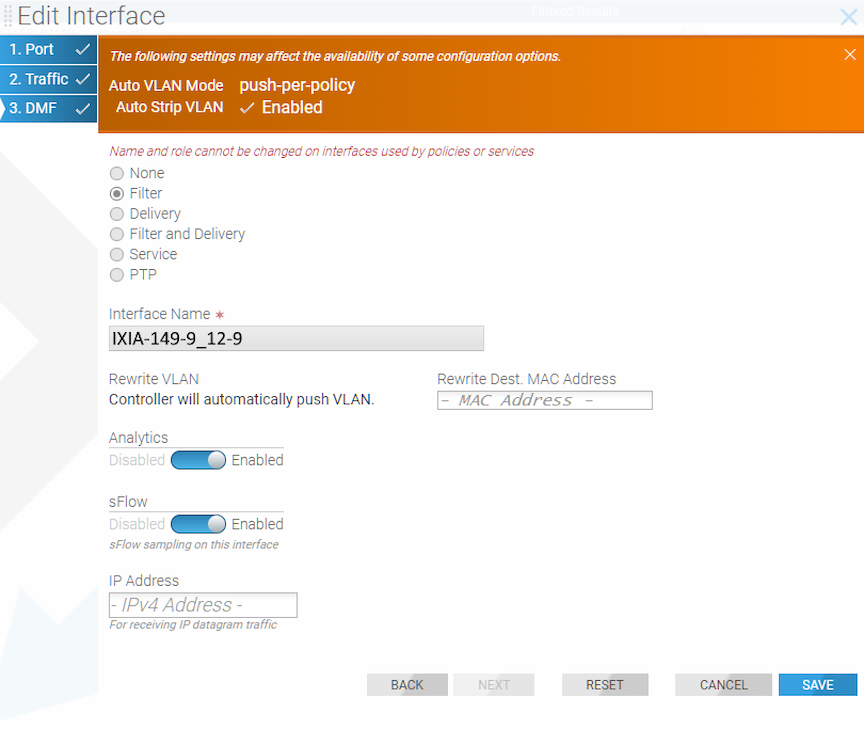
  4. Select Save to continue.

Configure sFlow® on a Filter and Delivery Interface

A DANZ Monitoring Fabric (DMF) interface used by a DMF policy as both a filter and a delivery interface is known as a filter-and-delivery interface. Filter-and-delivery interfaces support configuring sFlow®* in the DMF Controller. DMF enables sFlow by default on filter-and-delivery interfaces.

To disable sFlow on a filter-and-delivery interface, use the DMF Controller GUI.

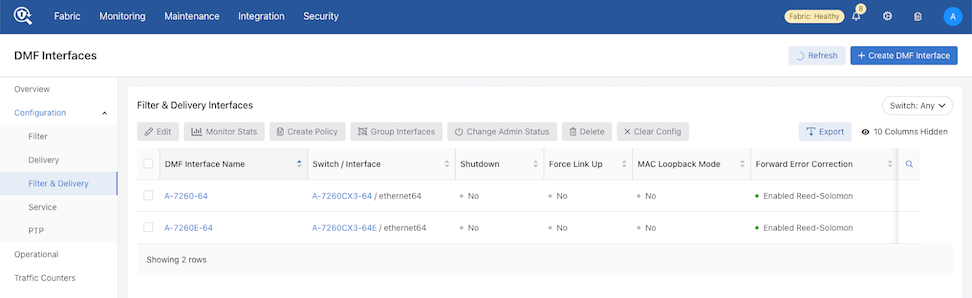
  1. Navigate to Monitoring > Interfaces > Filter & Delivery .
    Figure 84. DMF Interfaces
  2. Select an interface from the list under DMF Interface Name.
    Figure 85. DMF Interface Name
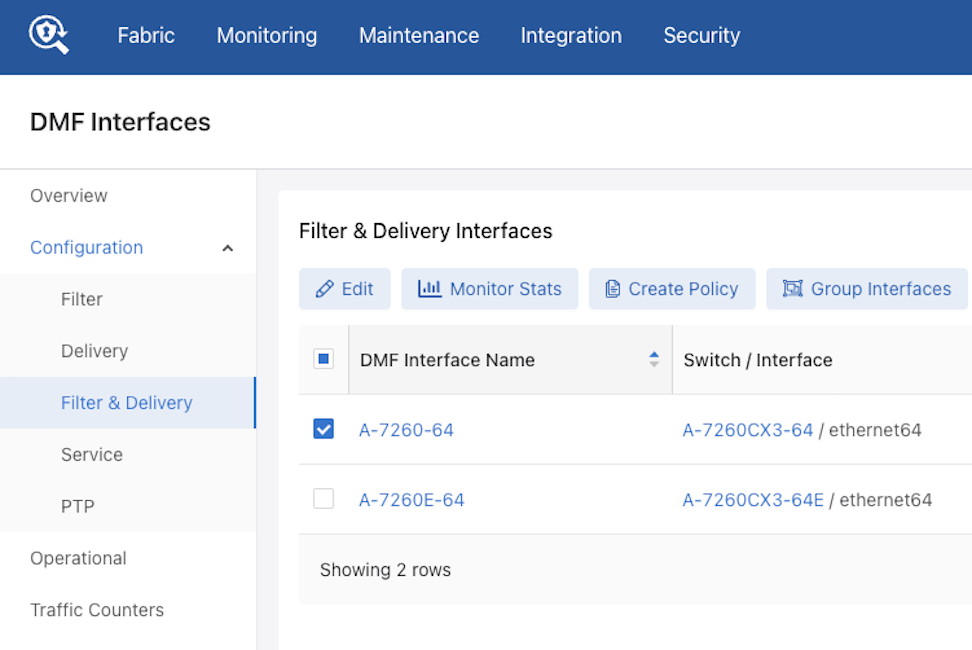
  3. Select Edit to open the Edit DMF Interface configuration window.
    Figure 86. Edit DMF Interface
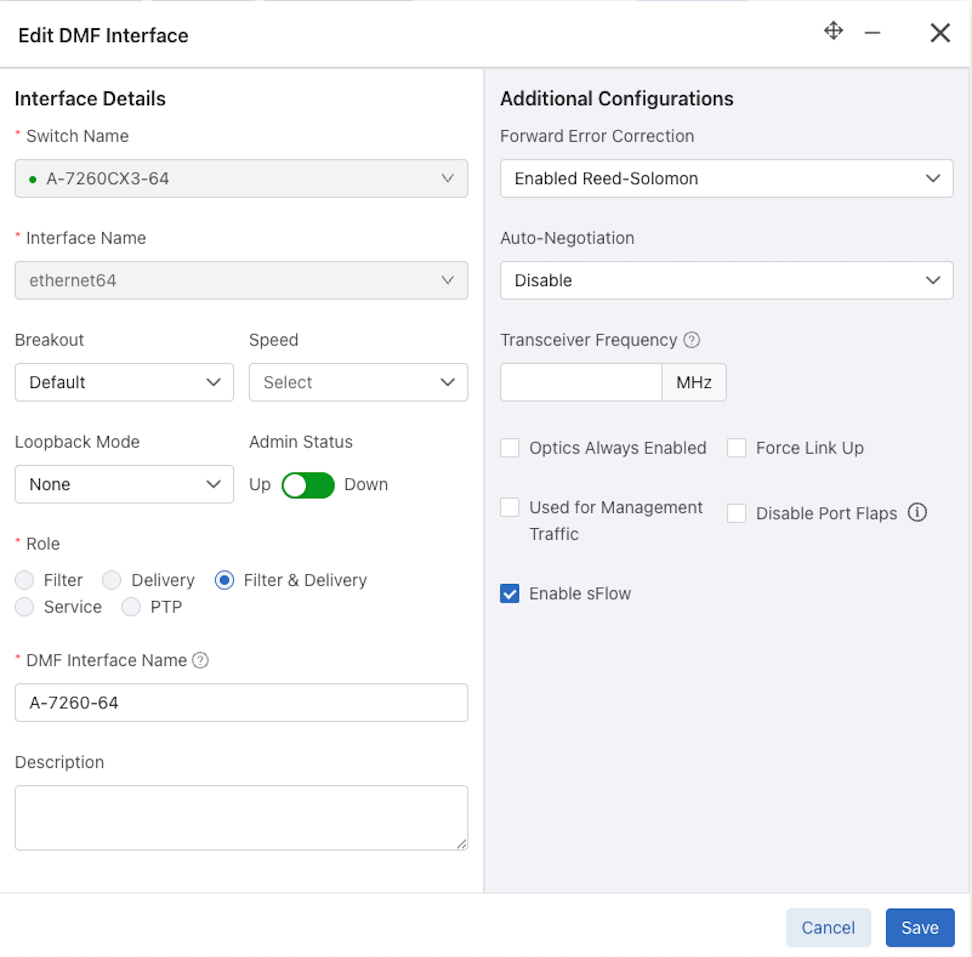
  4. Clear the Enable sFlow checkbox and select Save.

Configure Error Disable State

Error Disable State for Port Flapping prevents policy churn by automatically placing switch interfaces with frequent flapping into an error-disabled state, effectively performing an automatic administrative shutdown. The feature allows for automatically recovering these interfaces after a specified time. It reduces the risk of lost packets caused by continuous re-computation of DANZ Monitoring Fabric (DMF) policies due to flapping interfaces. By default, Error Disable State for Port Flapping is disabled.

Global Configuration
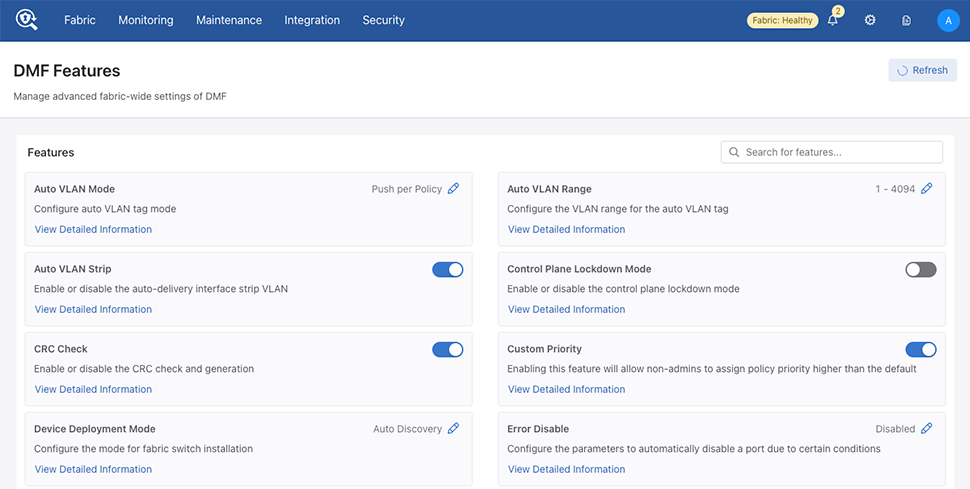
Navigate to DMF Features > Error Disable using the gear icon.
Figure 87. DMF Features

Locate the Error Disable feature card and select the pencil (edit) icon.

Select Enable Error Disable to enable or disable the feature.
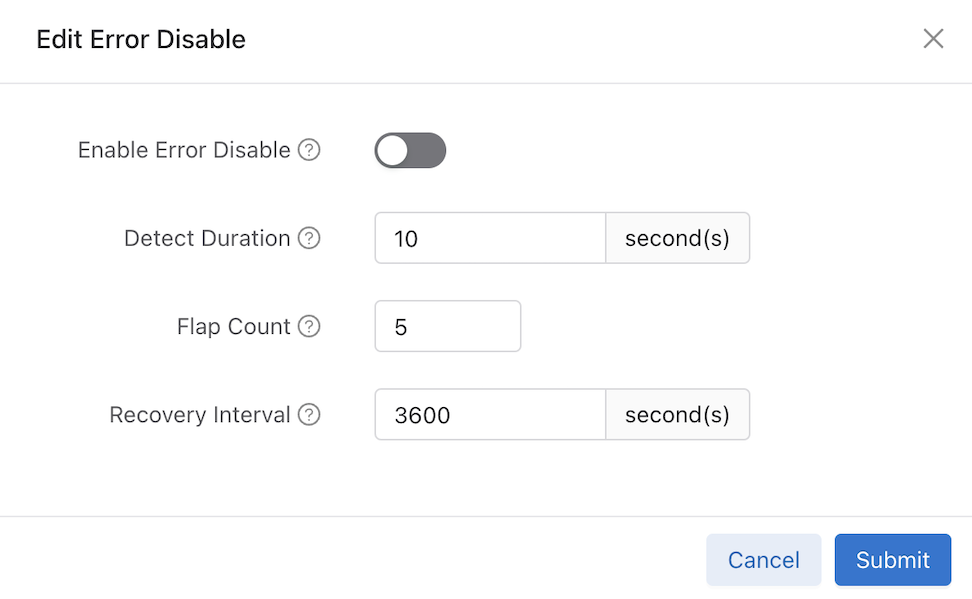
Configure the following inputs as required:

  • Enable Error Disable: Enable or disable the feature.
  • Detect Duration: Specifies the duration during which the required flap count must be reached to set the interface into an error-disabled state. The default is 10 seconds.
  • Flap Count: Specifies the number of flaps required within the detect-duration period to set the interface into the error-disabled state. The default is 5 flaps.
  • Recovery Interval: The Recovery Interval indicates how much time will pass before bringing up the interface when the automatic administrative shutdown action shuts it down. The default is 3600 seconds.

Select Submit to save the global configuration.

Configure Error Disable at the Interface Level

Use the Disable Port Flaps switch to enable or disable port flaps at the interface level on the Fabric > Interfaces dashboard.

Select Save.

When using the Monitoring > Interfaces dashboard during an Edit Interface step or Create DMF Interface configuration process use the Disable Port Flaps checkbox to enable or disable port flaps on the Create DMF Interface page. If the Error Disable feature is enabled globally, checking this input will disable the Error Disable feature on this interface temporarily.
Select Save.

Error Disable Alerts
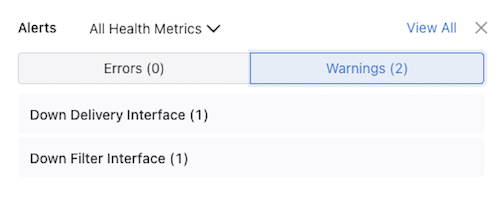
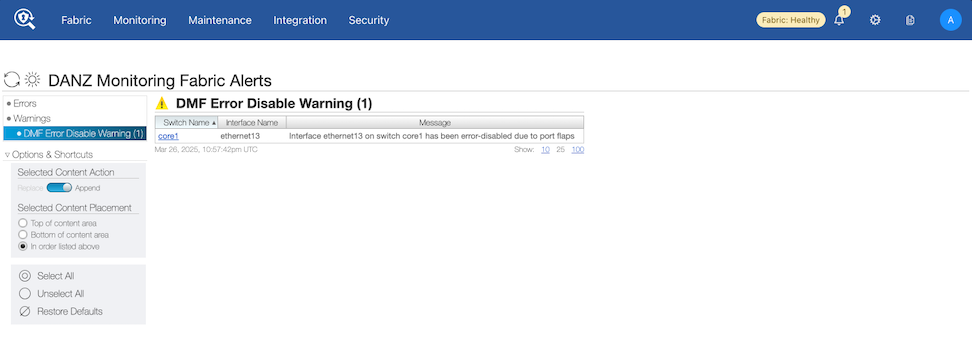
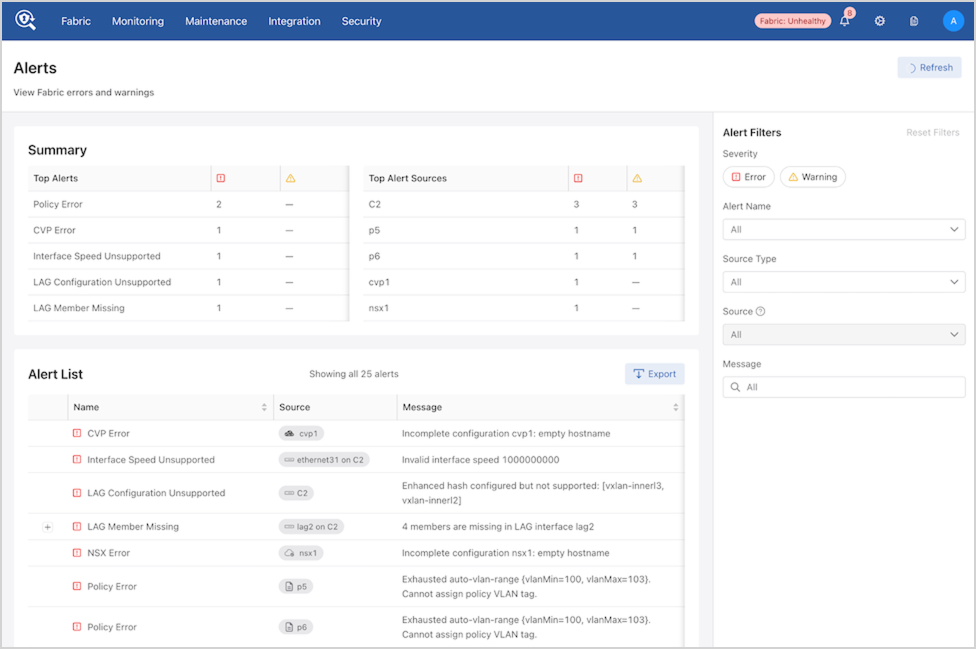
Select the Alarm icon followed by Warnings to view any Error Disable warnings. These appear on the Alerts page.
Figure 88. Warnings
Figure 89. DMF Error Disable Warnings

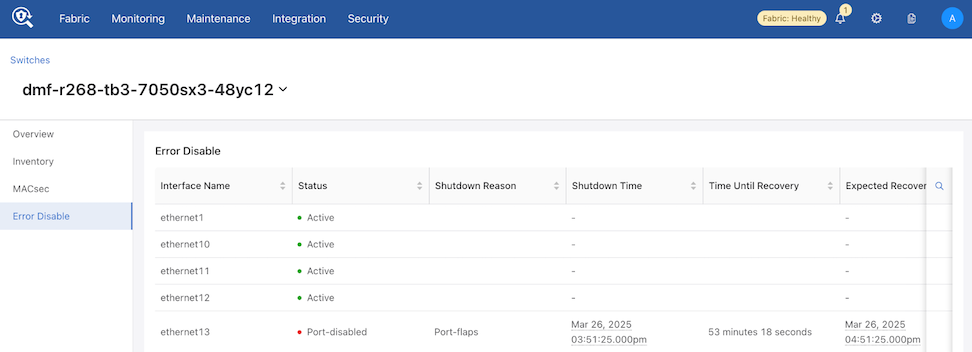
Details related to error disable appear in the Switches detail page in the Error Disable dashboard.

Navigate to Fabric > Switches > Inventory and choose a switch from the inventory list.
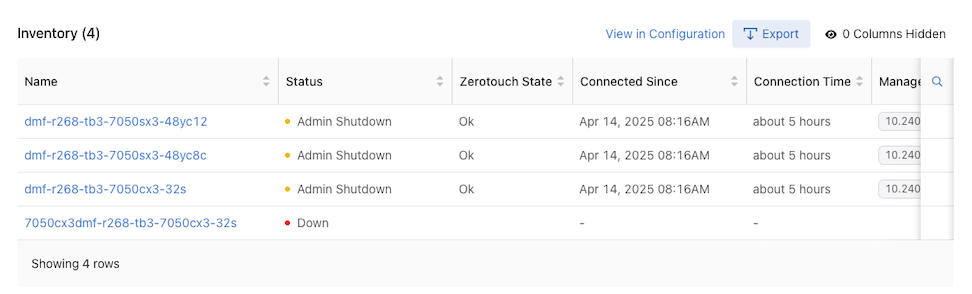
Figure 90. Inventory

Select Error Disable.

Figure 91. Error Disable Dashboard

Configure Interface Groups

DMF version 8.8.0 introduces a redesigned workflow for Interface Groups in the DMF UI. An interface group is a collection of one or more filter or delivery interfaces, making it more convenient to create a policy. It is often easier to refer to an interface group when creating a policy than to identify every interface to which the policy applies explicitly.

Create an interface group consisting of one or more filter or delivery interfaces. Use an address group in multiple policies, referring to the IP address group by name in match rules. If no subnet mask is provided in the address group, it is assumed to be an exact match. For example, in an IPv4 address group, the absence of a mask implies a mask of /32. For an IPv6 address group, the absence of a mask implies a mask of /128. Identify only a single IP address group for a specific policy match rule. Address lists with both src-ip and dst-ip options cannot exist in the same match rule.

Important: An Interface Group differs from a Link Aggregation Group (LAG). A LAG combines multiple LAN links and cables in parallel to provide a high level of redundancy and increased transmission speed.

To access the Interface Groups workflow, and perform the following steps:

  1. Navigate to Monitoring > Interfaces .
    Figure 92. DMF Interfaces - Interface Groups
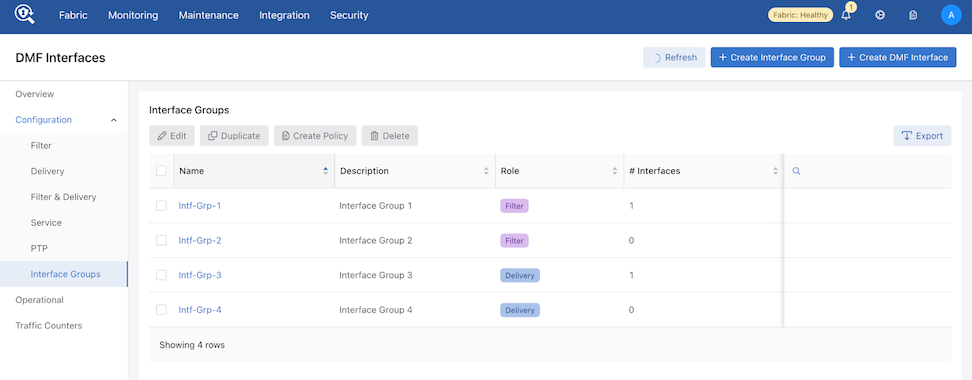
    A + Create Interface Group control displays to the left of Create DMF Interface.
    Figure 93. + Create Interface Group
  2. Select + Create Interface Group.
    The Create Interface Group workflow displays:
    Figure 94. Creating Interface Group
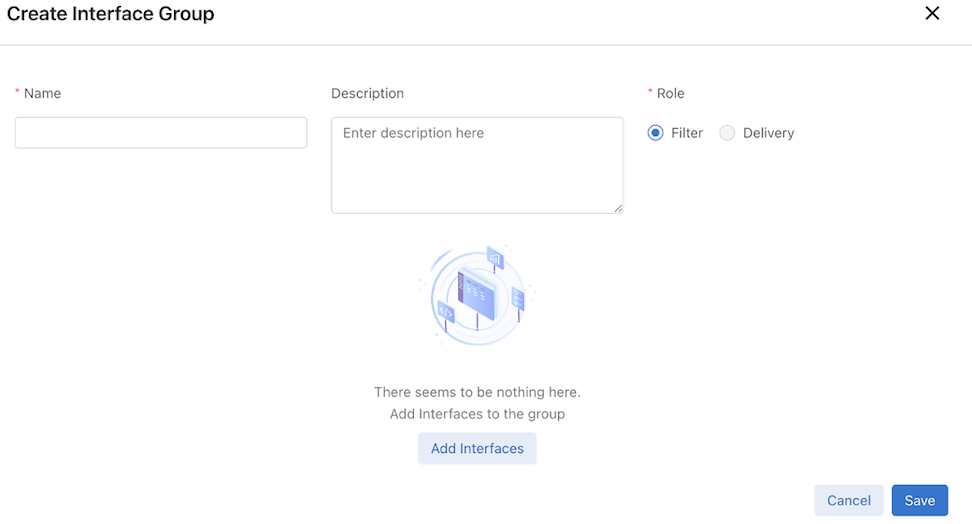
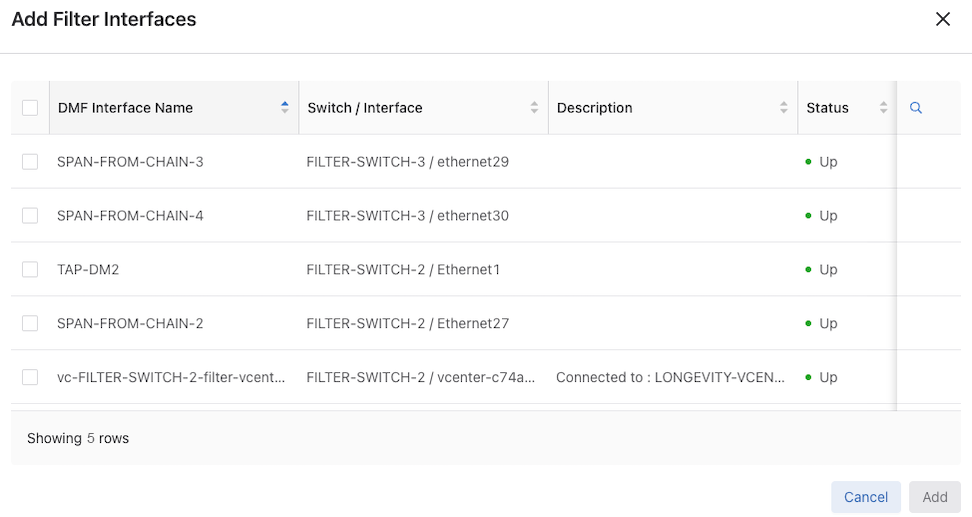
  3. Select Add Interfaces to display a list of available interfaces according to the selected Role, either Filter or Delivery.
    • If Filter is selected, DMF displays interfaces with Filter and Filter & Delivery roles.
    • If Delivery is selected, DMF displays interfaces with Delivery and Filter & Delivery roles.
    These options ensure all compatible interfaces are available for selection.
    Figure 95. Add Filter Interfaces
    Figure 96. Add Delivery Interfaces
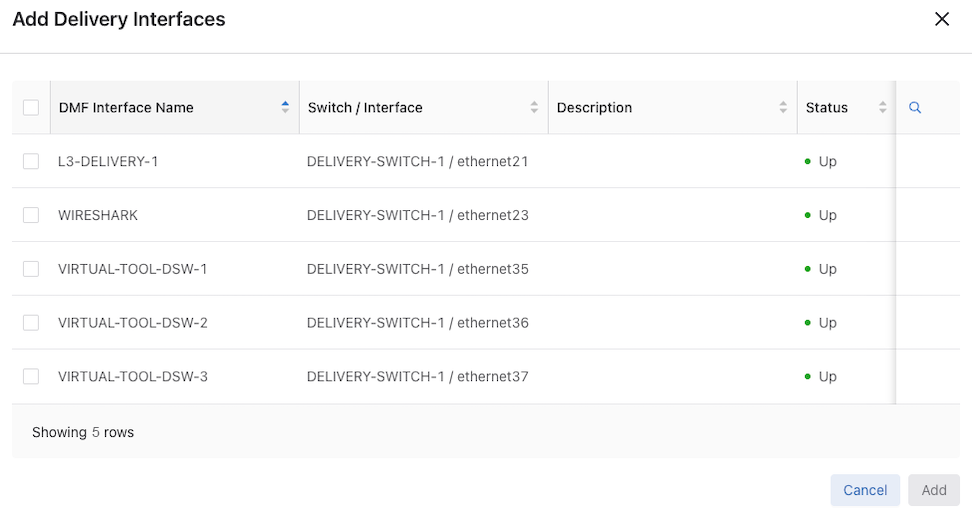
  4. Select Add to add the interfaces to the group.
  5. Enter the information for the Interface Group in the following fields:
    • Name: Required - unique identifier.

    • Description: Optional - text field.

    • Role: Required - as described in Step 3.

  6. Select Save to complete the configuration.
    The new group displays in the Interface Groups dashboard.
    Figure 97. New Group
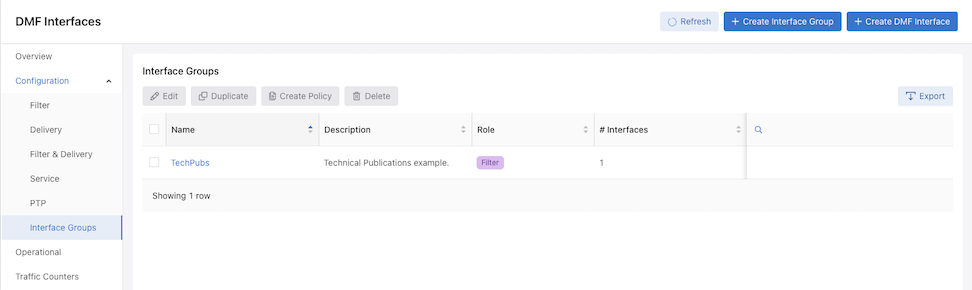
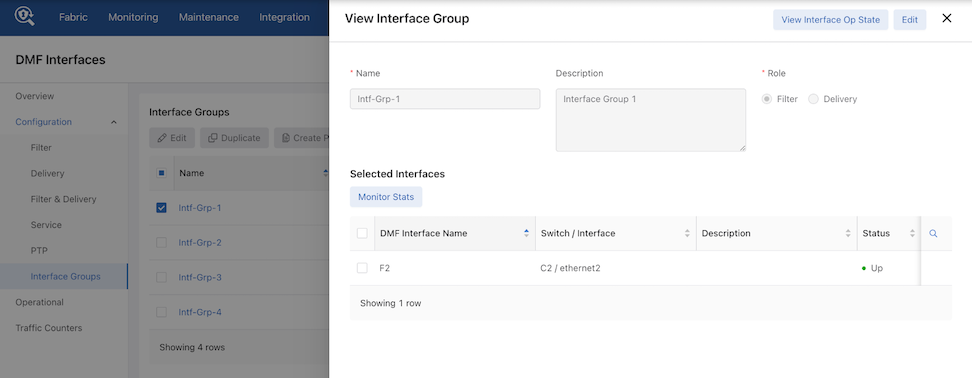
  7. View details for each Interface Group by selecting the corresponding group name in the table.
    The following action buttons are available within the Interface Group details view:
    • Edit: Enables edit mode for the selected Interface Group.
    • View Interface Op State: Redirects to the Operational section with the relevant Interface Group pre-selected.
    • Monitor Stats: This option allows the selection of one or more interfaces. When interfaces are selected, the Traffic Counters page opens with those pre-selected interfaces. If no interfaces are selected, the page opens with default interface selections.
    Figure 98. View Interface Group
     

Additional Interface Controls

Action Buttons

Edit - Select a single row from the list to edit an interface group.
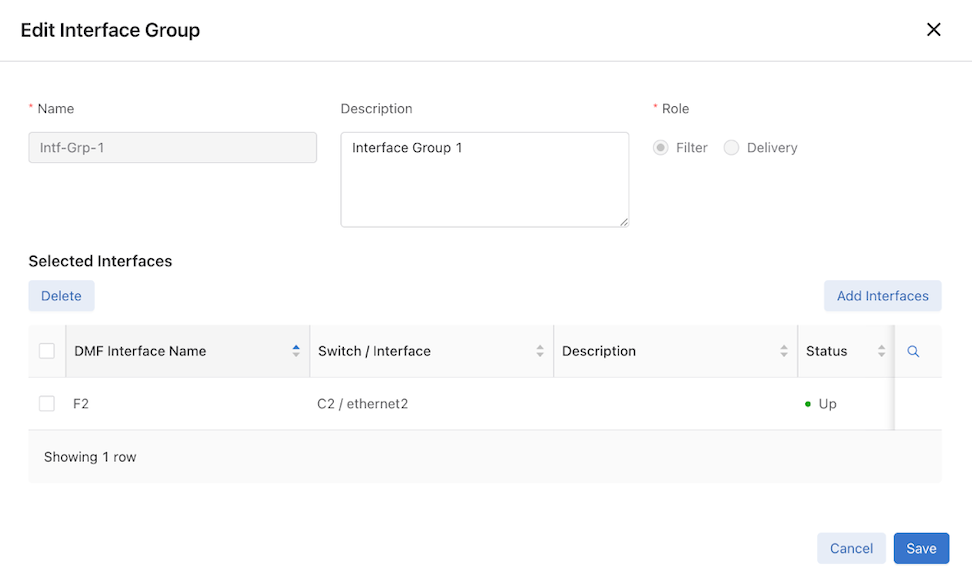
Figure 99. Edit Interface Group


Note: Only the Description and Interfaces fields are editable. The Name and Role fields are read-only and cannot be modified.

Duplicate - To duplicate an interface group, select a single row from the list that opens a copy of the selected interface group for editing.
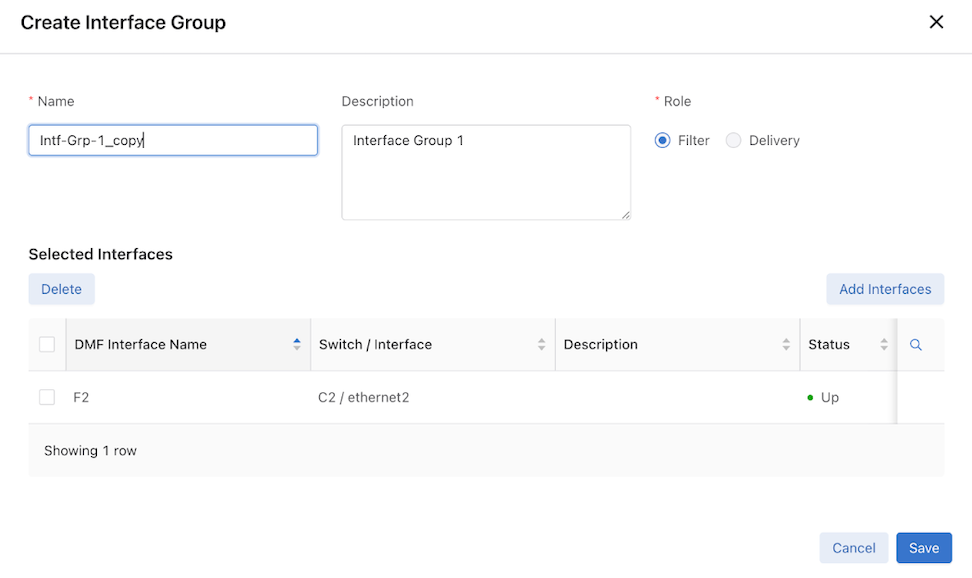
Figure 100. Duplicate Interface


Note: All fields in the duplicated group are editable. The Name field is automatically updated by appending “_copy” to the original name.

Create Policy - The Create Policy option allows the creation of policies directly from the Interface Groups page. Upon selecting Create Policy, the selected Interface Groups are automatically organized under different sources based on their Role — either Filter or Delivery.
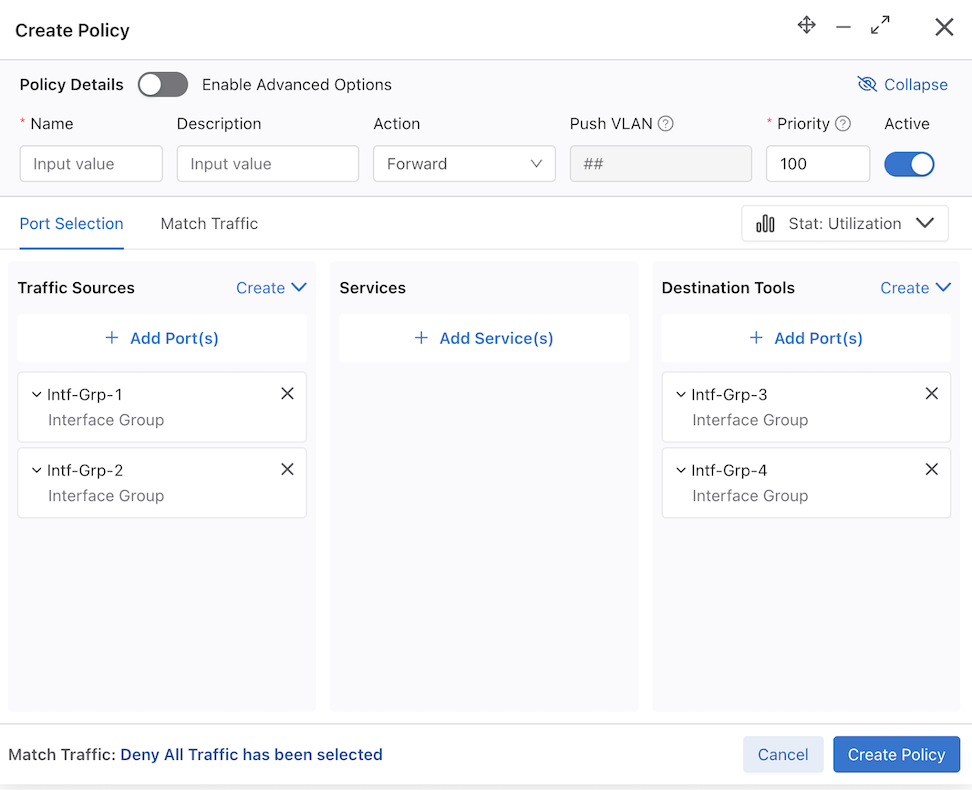
Figure 101. Create Policy

Delete - Delete interface groups by selecting one or more groups and using the Delete option.
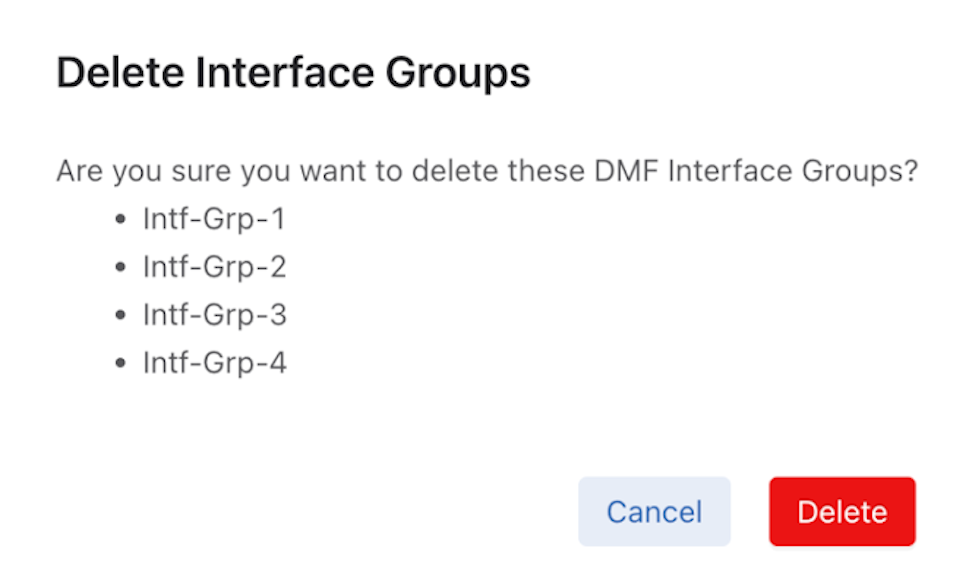
Figure 102. Delete Interface Group

Export - The Export option for the Interface Groups table supports both CSV and JSON formats. Export functionality is independent of any row selection and includes the complete table data.
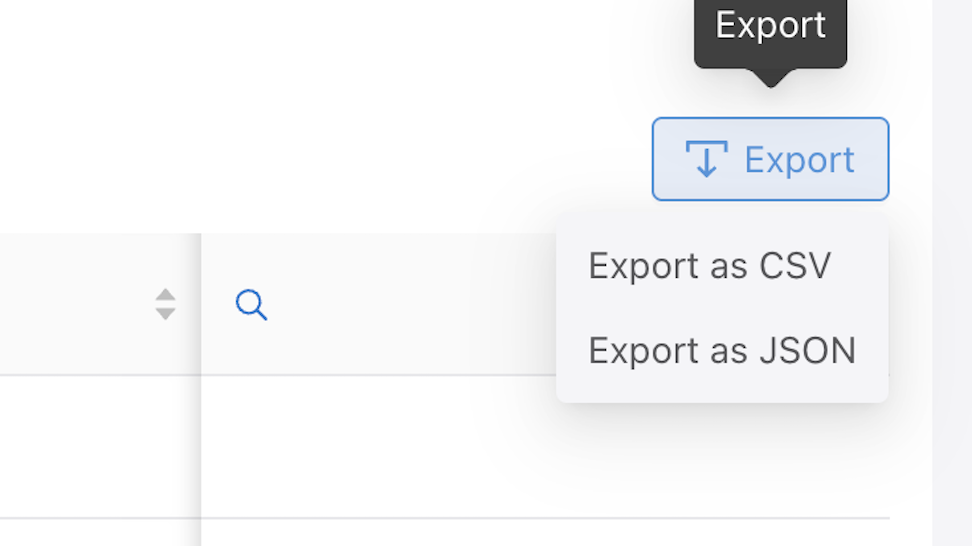
 

Figure 103. Export Data

Considerations

During Interface Group creation, interface selections are not persistent when switching between roles. When adding interfaces to one role and switching to another, the selections made for the first role are lost.

Example:

  1. Select the role Filter and add interfaces.
  2. Change the role to Delivery.
  3. Switch back to the Filter role — the previously selected interfaces are gone.

When deleting a previously added interface in an Interface Group, DMF does not automatically remove it from the Interface Group. The deleted interface entry must be manually removed from the Interface Group configuration.

Using the Command Line Interface

Configure a Filter or Delivery Interface

To assign a filter or delivery role to an interface, perform the following steps:
  1. From the config mode, enter the switch command, identifying the switch having the interface to configure.
    controller-1(config)# switch DMF-FILTER-SWITCH-1
    controller-1(config-switch)#
    Note: Identify the switch using the alias if configured. The CLI changes to the config-switch submode to configure the specified switch.
  2. From the config-switch mode, enter the interface command, as in the following example:
    controller-1(config-switch)# interface ethernet1
    controller-1(config-switch-if)#
    Note:To view a list of the available interfaces, enter the show switch switch-name interface command or press the Tab key, and the command completion feature displays a concise list of permitted values. After identifying the interface, the CLI changes to the config-switch-if mode to configure the specified interface.
  3. From the config-switch-if submode, enter the role command to identify the role for the interface. The syntax for defining an interface role (delivery, filter, filter-and-delivery, or service) is as follows:
    [no] role delivery interface-name <name> [strip-customer-vlan] [ip-address
    <ip-address>]
    [nexthop-ip <ip-address> <subnet> ]
    [no] role filter interface-name <name> [ip-address <ip-address>] {[rewrite
    vlan <vlan id (1-4094)>]} [no-analytics]
    [no] role both-filter-and-delivery interface-name <name> {[rewrite vlan <vlan id
    (1-4094)>]} [noanalytics]
    [no] role service interface-name <name>a
    The interface-name command assigns an alias to the current interface, which typically would indicate the role assigned, as in the following example:
    controller-1(config-switch-if)# role delivery interface-name TOOL-PORT-1
    Note:An interface can have only one role, and the configured interface name must be unique within the DANZ Monitoring Fabric.
    The following examples show the configuration for filter, delivery, and service interfaces:
    • Filter Interfaces
      controller-1 (config)# switch DMF-FILTER-SWITCH-1
      controller-1(config-switch)# interface ethernet1
      controller-1(config-switch-if)# role filter interface-name TAP-PORT-1
      controller-1(config-switch-if)# interface ethernet2
      controller-1(config-switch-if)# role filter interface-name TAP-PORT-2
    • Delivery Interfaces
      controller-1(config-switch-if)# switch DMF-DELIVERY-SWITCH-1
      controller-1(config-switch-if)# interface ethernet1
      controller-1(config-switch-if)# role delivery interface-name TOOL-PORT-1
      controller-1(config-switch-if)# interface ethernet2
      controller-1(config-switch-if)# role delivery interface-name TOOL-PORT-2
    • Filter and Delivery Interfaces
      controller-1(config-switch-if)# switch DMF-CORE-SWITCH-1
      controller-1(config-switch-if)# interface ethernet1
      controller-1(config-switch-if)# role both-filter-and-delivery interface-name loopback-
      port-1
      controller-1(config-switch-if)# interface ethernet2
      controller-1(config-switch-if)# role both-filter-and-delivery interface-name loopback-
      port-2
    • Service Interfaces
      controller-1(config-switch-if)# switch DMF-CORE-SWITCH-1
      controller-1(config-switch-if)# interface ethernet1
      controller-1(config-switch-if)# role service interface-name PRE-SERVICE-PORT-1
      controller-1(config-switch-if)# interface ethernet2
      controller-1(config-switch-if)# role service interface-name POST-SERVICE-PORT-1
    Note:
    1. An interface can have only one role, and the configured interface name must be unique within the DANZ Monitoring Fabric.
    2. A delivery interface will show drops under a many-to-one scenario, i.e., multiple filter interfaces pointing to a single delivery interface as per policy definition. These drops are accounted for as micro bursts occur at the egress port. For example, consider a use case of three 10G ingress ports and one 25G egress port. Even if we send a total of 25Gbps of traffic by calculation from ingress to egress, each individual ingress port still operates at 10Gbps inside the BCM chip (i.e., a total of 30G on ingress, 5Gbps traffic is still running at 10Gbps speed on the wire but with a bigger inter-frame gap). This means the ingress may oversubscribe the egress due to the 30G to 25G traffic ratio. For example, if each ingress port receives one packet at the same time, it causes 30G-to-25G over-subscription or micro-bursting (5Gbps traffic still gets processed at the ingress port’s native speed of 10Gbps). Because the egress can only process packets up to 25Gbps, one of the packets will not get dequeued promptly and accumulate inside the egress TX queue. If this pattern continues, the egress queue eventually drops packets due to the TX buffer becoming full. Therefore, expect this behavior in the case of many-to-one forwarding. After reconfiguring and using only one 25G ingress port to one 25G egress port, there is no TX drop problem.

Interface Description

The show switch <switch name/all> interface details or show switch <switch name/all> interface <interface name> details commands in the CLI include a Description column, which provides the configured description (if any) for the corresponding interface. This is a only a CLI change.

No configuration is necessary to use this feature. However, the column remains empty for any switch interface without a configured description. Please refer to the existing user documentation to configure a description for an interface.

Show Commands

Use the following show commands for viewing an interface description.

Display the interface Description in show switch name interface command:
dmf-controller# show switch all interface details
#   Switch    IF Name    MAC Address                   Config State Adv. Features Curr Features Supported Features Description                              
---|---------|----------|-----------------------------|------|-----|-------------|-------------|------------------|------------------------------------|
1   core1     ethernet1  52:54:00:d9:58:8c (Linux KVM) up     up    10g           10g           10g
2   core1     ethernet2  52:54:00:5a:ba:93 (Linux KVM) up     up    10g           10g           10g                sample description for eth2
...
With the switch name provided:
dmf-controller# show switch core1 interface details
#  IF Name    MAC Address                   Config State Adv. Features Curr Features Supported Features Description                      
--|----------|-----------------------------|------|-----|-------------|-------------|------------------|-------------------------------|
1  ethernet1  52:54:00:d9:58:8c (Linux KVM) up     up    10g           10g           10g
2  ethernet2  52:54:00:5a:ba:93 (Linux KVM) up     up    10g           10g           10g                sample description for eth2
3  ethernet3  5c:16:c7:10:e0:bc (Arista)    up     down  10g           10g           10g
4  ethernet4  5c:16:c7:10:e0:bd (Arista)    up     down  10g           10g           10g
5  ethernet5  5c:16:c7:10:e0:be (Arista)    up     down  10g           10g           10g                sample description for eth5
...
With the switch name and the interface name provided:
dmf-controller# show switch core1 interface ethernet5 details
# IF Name   MAC Address                Config State Adv. Features Curr Features Supported Features Description                      
-|---------|--------------------------|------|-----|-------------|-------------|------------------|--------------------------------|
1 ethernet5 5c:16:c7:10:e0:be (Arista) up     down  10g           10g           10g                sample description for eth5

Identify a Filter Interface using Destination MAC Rewrite

The Destination MAC (D.MAC) Rewrite feature provides an option to identify the Filter interface by overriding the destination MAC address of the packet received on the filter interface. Use this feature for auto-assigned and user-configured VLANs in push-per-filter and push-per-policy modes.
Note: The D.MAC Rewrite feature VLAN preservation applies to switches running SWL OS and does not apply to 7280R/7280R2 switches running EOS.

Global Configuration

Configure this function at the filter interface level and perform the following steps using the CLI.
  1. Select a filter switch and enter the config mode.
    (config)# switch filter1
  2. Select an interface from the switch acting as the filter interface.
    (config-switch)# interface ethernet5
  3. Create a filter interface with a name and provide the MAC address to override.
    (config-switch-if)# role filter interface-name f1 rewrite dst-mac 00:00:00:00:00:03

CLI Show Commands

The following show command displays the ingress flow for the filter switch.

In the Entry value column, the filter switch contains dst MAC tlv: EthDst(00:00:00:00:00:03).

(config-policy)# show switch filter1 table ingress-flow-2
# Ingress-flow-2 Device name Entry key                               Entry value  
-|--------------|-----------|---------------------------------------|-----------------------------------|
1 0              filter1     Priority(6400), Port(5), EthType(34525) Name(p1), Data([0, 0, 0, 61]), PushVlanOnIngress(flags=[]), VlanVid(0x1), Port(1), EthDst(00:00:00:00:00:03)
2 1              filter1     Priority(6400), Port(5)                 Name(p1), Data([0, 0, 0, 62]), PushVlanOnIngress(flags=[]), VlanVid(0x1), Port(1), EthDst(00:00:00:00:00:03)
3 2              filter1     Priority(36000), EthType(35020)         Name(__System_LLDP_Flow_), Data([0, 0, 0, 56]), Port(controller), QueueId(0)

The core and delivery switch in the Entry value column doesn’t contain dst MAC tlv, as shown in the following examples.

(config-policy)# show switch core1 table ingress-flow-2
# Ingress-flow-2 Device name Entry key                                             Entry value  
-|--------------|-----------|-----------------------------------------------------|----------------------------|
1 0              core1       Priority(6400), Port(1), EthType(34525), VlanVid(0x1) Name(p1), Data([0, 0, 0, 60]), Port(2)
2 1              core1       Priority(6400), Port(1), VlanVid(0x1)                 Name(p1), Data([0, 0, 0, 59]), Port(2)
3 2              core1       Priority(36000), EthType(35020)                       Name(__System_LLDP_Flow_), Data([0, 0, 0, 57]), Port(controller), QueueId(0)
(config-policy)# show switch delivery1 table ingress-flow-2
# Ingress-flow-2 Device name Entry key                                             Entry value  
-|--------------|-----------|-----------------------------------------------------|----------------------------|
1 0              delivery1   Priority(6400), Port(1), EthType(34525), VlanVid(0x1) Name(p1), Data([0, 0, 0, 64]), Port(6)
2 1              delivery1   Priority(6400), Port(1), VlanVid(0x1)                 Name(p1), Data([0, 0, 0, 63]), Port(6)
3 2              delivery1   Priority(36000), EthType(35020)                       Name(__System_LLDP_Flow_), Data([0, 0, 0, 58]), Port(controller), QueueId(0)

Troubleshooting

To troubleshoot the scenario where the provided destination MAC address is attached incorrectly to the filter interface. The ingress-flow-2 table shown earlier will have a destination MAC rewrite tlv on the filter switch, but no such tlv appears on the core or delivery switch.

As an alternative, drop into the bash of the filter switch to check the flow and destination MAC rewrite.

Use the following commands for the ZTN CLI of the filter switch.

(config)# connect switch filter1
(ztn-config) debug admin
filter1> enable
filter1# debug bash

The following command prints the flow table of the filter switch.

root@filter1:~# ofad-ctl gt ING_FLOW2
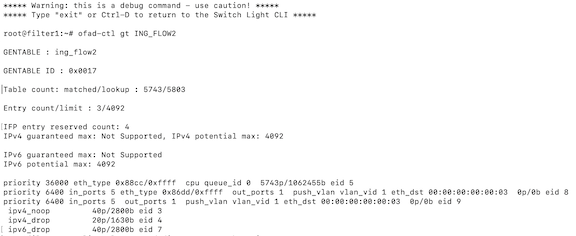
Figure 104. Filter Switch Flow Table

The following command shows the policy flow from the filter switch to the delivery switch. The filter switch will have the assigned destination MAC in the match-field.

(config)# show policy-flow
# Policy Name Switch                              Pkts Bytes Pri  T Match                    Instructions            
-|-----------|-----------------------------------|----|-----|----|-|------------------------|------------------|
1 p1          core1 (00:00:52:54:00:15:94:88)     0    0     6400 1 eth-type ipv6,vlan-vid 1 apply: name=p1 output: max-length=65535, port=2
2 p1          core1 (00:00:52:54:00:15:94:88)     0    0     6400 1 vlan-vid 1               apply: name=p1 output: max-length=65535, port=2
3 p1          delivery1 (00:00:52:54:00:00:11:d2) 0    0     6400 1 vlan-vid 1               apply: name=p1 output: max-length=65535, port=6
4 p1          delivery1 (00:00:52:54:00:00:11:d2) 0    0     6400 1 eth-type ipv6,vlan-vid 1 apply: name=p1 output: max-length=65535, port=6
5 p1          filter1 (00:00:52:54:00:d5:2c:05)   0    0     6400 1                          apply: name=p1 push-vlan: ethertype=802.1Q (33024),set-field: match-field/type=vlan-vid, match-field/vlan-tag=1,output: max-length=65535, port=1,set-field: match-field/eth-address=00:00:00:00:00:03 (XEROX), match-field/type=eth-dst
6 p1          filter1 (00:00:52:54:00:d5:2c:05)   0    0     6400 1 eth-type ipv6            apply: name=p1 push-vlan: ethertype=802.1Q (33024),set-field: match-field/type=vlan-vid, match-field/vlan-tag=1,output: max-length=65535, port=1,set-field: match-field/eth-address=00:00:00:00:00:03 (XEROX), match-field/type=eth-dst

Considerations

  1. The destination MAC rewrite cannot be used on the filter interface where timestamping is enabled.
  2. The destination MAC rewrite will not work when the filter interface is configured as a receive-only tunnel interface.

Forward Slashes in Interface Names

DANZ Monitoring Fabric (DMF) supports using forward slashes (/) in interface names to aid in managing interfaces in the DMF fabric. For example, when:

  • Defining the SPAN device name and port numbers which generally contain a forward slash (eth2/1/1) in the name for easy port identification.
  • Using separate SPAN sessions for Tx and Rx traffic, when there are multiple links from a device to a filter switch.

The following is the comprehensive list of DMF interfaces supporting the use of a forward slash:

filter interface unmanaged service interface
filter interface group recorder node interface
delivery interface MLAG interface
delivery interface group LAG interface
filter-and-delivery interface GRE tunnel interface
PTP interface VXLAN tunnel interface
managed service interface  
Note: An interface name cannot start with a forward slash. However, multiple forward slashes are allowed while adhering to the maximum allowed length limitation.
Configuration

The configuration of DMF filter interfaces remains unchanged. This feature relaxes the existing naming convention by allowing a forward slash to be a part of the name.

The following are several examples:

For switch interfaces, for any of the roles: both-filter-and-delivery, delivery, filter, ptp, service
dmf-controller-1(config-switch-if)# role role interface-name a/b/c
For filter and delivery interface groups:
dmf-controller-1(config)# filter-interface-group a/b/c 
dmf-controller-1(config)# delivery-interface-group a/b/c
Adding interfaces or interface groups to a policy:
dmf-controller-1(config-policy)# filter-interface f1/a/b 
dmf-controller-1(config-policy)# filter-interface-group f/a/b 
dmf-controller-1(config-policy)# delivery-interface d1/a/b 
dmf-controller-1(config-policy)# delivery-interface-group d/a/b
Recorder Node interface:
dmf-controller-1(config)# recorder-fabric interface a/b/c
For a managed service:
dmf-controller-1(config-managed-srv-flow-diff)# l3-delivery-interface a/b/c
MLAG interface:
dmf-controller-1(config-mlag-domain)# mlag-interface a/b/c 
dmf-controller-1(config-mlag-domain-if)# role delivery interface-name a/b/c
LAG interface:
dmf-controller-1(config-switch)# lag-interface a/b/c
GRE tunnel interface:
dmf-controller-1(config-switch)# gre-tunnel-interface a/b/c
VXLAN tunnel interface:
dmf-controller-1(config-switch)# vxlan-tunnel-interface a/b/c
Show Commands

There are no new show commands. The existing show running-config and show this commands for the configurations mentioned earlier should display the interface names without any issue.

Configure sFlow on a Filter and Delivery Interface

A DANZ Monitoring Fabric (DMF) interface used by a DMF policy as both a filter and a delivery interface is known as a filter-and-delivery interface. Filter-and-delivery interfaces support configuring sFlow®* in the DMF Controller. DMF enables sFlow by default on filter-and-delivery interfaces.

Perform the following steps using the CLI:

  1. To disable sFlow on a filter-and-delivery interface, use the DMF Controller CLI and enter the configure submode.
    dmf-controller> enable 
    dmf-controller# configure 
    dmf-controller(config)#
  2. Enter the submode of the switch, followed by the submode of the switch interface where the filter-and-delivery interface is already defined or is to be defined.
    dmf-controller(config)# switch sw1 
    dmf-controller(config-switch)# interface Ethernet1/1 
    dmf-controller(config-switch-if)#
  3. Use the role command to define or edit the filter-and-delivery interface. Specify the optional no-sflow token after the interface name to disable sFlow on the filter-and-delivery interface.
    dmf-controller(config-switch-if)# role both-filter-and-delivery interface-name fd1 
     no-analytics             Disable interface analytics (optional)
     no-sflow                 Disable interface sFlow (optional)
     no-strip-vxlan           Enable/disable VxLAN header stripping (optional)
     no-vlan-preservation     Disable VLAN preservation config for this delivery interface (optional)
     rewrite                  Select header value(s) to rewrite
     strip-no-vlan            Customize Strip VLAN tag on this delivery interface (optional)
     strip-one-vlan           Customize Strip VLAN tag on this delivery interface (optional)
     strip-second-vlan        Customize Strip VLAN tag on this delivery interface (optional)
     strip-two-vlan           Customize Strip VLAN tag on this delivery interface (optional)
     strip-vxlan              Enable/disable VxLAN header stripping (optional)
    <Command-end>             <cr>: Associate filter-and-delivery role with switch interface
     ;                        command separator
     |                        pipe to command
     >                        redirect
    
    dmf-controller(config-switch-if)# role both-filter-and-delivery interface-name fd1 no-sflow 

If sFlow is disabled, apply the role command without the optional no-flow token to enable it and restore the default sFlow behavior on the filter-and-delivery interface.

Important: Be certain to include and preserve any other optional tokens since the role command replaces the role config for the interface.
dmf-controller(config-switch-if)# role both-filter-and-delivery interface-name fd1


Configure Interface Groups

Create an interface group consisting of one or more filter or delivery interfaces. It is often easier to refer to an interface group when creating a policy than to identify every interface to which the policy applies explicitly.

Use an address group in multiple policies, referring to the IP address group by name in match rules. If no subnet mask is provided in the address group, it is assumed to be an exact match. For example, in an IPv4 address group, the absence of a mask implies a mask of /32. For an IPv6 address group, the absence of a mask implies a mask of /128.

Identify only a single IP address group for a specific policy match rule. Address lists with both src-ip and dst-ip options cannot exist in the same match rule.

The following example illustrates the configuration of two interface groups: a filter interface group TAP-PORT-GRP, and a delivery interface group TOOL-PORT-GRP.
controller-1(config-switch)# filter-interface-group TAP-PORT-GRP
controller-1(config-filter-interface-group)# filter-interface TAP-PORT-1
controller-1(config-filter-interface-group)# filter-interface TAP-PORT-2
controller-1(config-switch)# delivery-interface-group TOOL-PORT-GRP
controller-1(config-delivery-interface-group)# delivery-interface TOOL-PORT-1
controller-1(config-delivery-interface-group)# delivery-interface TOOL-PORT-2

To view information about the interface groups in the DMF fabric, enter the show filter-interface-group command, as in the following examples:

Filter Interface Groups

controller-1(config-filter-interface-group)# show filter-interface-group
! show filter-interface-group TAP-PORT-GRP
# Name         Big Tap IF Name            Switch IF Name    Direction  Speed     State   VLAN  Tag
-|------------|--------------------------|-----------------|----------|---------|-------|-----|--------|
1 TAP-PORT-GRP TAP-PORT-1 DMF-CORE-SWITCH-1 ethernet17      rx         100Gbps   up      0
2 TAP-PORT-GRP TAP-PORT-2 DMF-CORE-SWITCH-1 ethernet18      rx         100Gbps   up      0
controller1(config-filter-interface-group)#
Delivery Interface Groups
controller1(config-filter-interface-group)# show delivery-interface-group
! show delivery-interface-group DELIVERY-PORT-GRP
# Name              Big Tap IF Name Switch IF Name        Direction  Speed     Rate   limit     State Strip Forwarding Vlan
-|-----------------|---------------|---------------------|----------|---------|------|---------|-----|---------------------|
1 TOOL-PORT-GRP TOOL-PORT-1 DMF-DELIVERY-SWITCH-1 ethernet15 tx      10Gbps                     up    True
2 TOOL-PORT-GRP TOOL-PORT-2 DMF-DELIVERY-SWITCH-1 ethernet16 tx      10Gbps                     up    True
controller-1(config-filter-interface-group)#

Configure Error Disable State

Error Disable State for Port Flapping prevents policy churn by automatically placing switch interfaces with frequent flapping into an error-disabled state, effectively performing an automatic administrative shutdown. The feature allows for automatically recovering these interfaces after a specified time. It reduces the risk of lost packets caused by continuous re-computation of DANZ Monitoring Fabric (DMF) policies due to flapping interfaces. By default, Error Disable State for Port Flapping is disabled.

Global Configuration

This feature is configurable at the global level.

To configure it, run the errdisable command from the config submode.

dmf-controller(config)# errdisable 
dmf-controller(config-errdisable)# 
detect-duration    enable-feature     flap-count         recovery-interval

By default, this feature is disabled; use the enable-feature command to enable it under the config-errdisable submode.

dmf-controller(config-errdisable)# enable-feature

Conversely, to deactivate it, use the no option of enable-feature.

dmf-controller(config-errdisable)# no enable-feature

Flap-count: Specifies the number of flaps required within the detect-duration period to set the interface into the error-disabled state. The default is 5 flaps.

dmf-controller(config-errdisable)# flap-count 
Flap count     Configure flap count. Range 1..1000 (default 5)
dmf-controller(config-errdisable)# flap-count 20

Detect-duration: Specifies the duration during which the required flap count must be reached to set the interface into an error-disabled state. The default is 10 seconds.

dmf-controller(config-errdisable)# detect-duration 
Detect duration (secs)     Configure detect duration in seconds. Range 1..1800 (default 10s)
dmf-controller(config-errdisable)# detect-duration 30

Recovery-interval: The recovery-interval indicates how much time will pass before bringing up the interface when the automatic administrative shutdown action shuts it down. The default is 3600 seconds.

dmf-controller(config-errdisable)# recovery-interval 
Recovery interval (secs)     Configure the recovery interval in seconds. Range 30..86400 (default 3600s)
dmf-controller(config-errdisable)# recovery-interval 1200                

Use the show this command to review the settings:

dmf-controller(config-errdisable)# show this
! errdisable
errdisable
  detect-duration 30
  enable-feature
  flap-count 20
  recovery-interval 1200
Local Configuration

This feature allows disabling the Error Disable feature on a per-interface basis. This prevents a specific interface from being automatically error-disabled due to port flapping.

To disable Error Disable for an interface:

Enter the interface configuration mode config-switch-if using the following commands:

dmf-controller(config)# switch switch-name
dmf-controller(config-switch)# interface interface-name
dmf-controller(config-switch-if)#

Use the errdisable command to access the interface's Error Disable settings which enters into errdisable submode.

Execute the disable command.

Disable the feature on the interface level using the disable option under config-switch-if-errdisable.

dmf-controller(config-switch-if)# errdisable 
dmf-controller(config-switch-if-errdisable)# disable
Quick Interface Recovery

When an interface is in the error-disabled state, use the disable command to immediately bring the interface back up instead of waiting for the recovery action to be initiated. This action overrides the configured recovery interval and restores the interface's functionality.

Show Commands - Error State

When an interface is in error-disabled state, view the details using the show fabric warnings errdisable-warning command. The output lists the switch and the error-disabled interface name with a detailed message.

dmf-controller# show fabric warnings errdisable-warning
~~~~~~~~~~~~~~~~~~~~~~~~~~~~~~~~~~~~~ Error disable warnings  ~~~~~~~~~~~~~~~~~~~~~~~~~~~~~~~~~~~~~
# Switch IF Name    Warning message                                                                
-|------|----------|------------------------------------------------------------------------------|
1 core1  ethernet12 Interface ethernet12 on switch core1 has been error-disabled due to port flaps

Use the show errdisable command to obtain the following details:

  • Global settings for the error-disable port flapping feature, including the maximum flap count, monitor duration, recovery interval, and status.
  • A list of currently error-disabled interfaces and their switch and interface names.
  • A list of interfaces where the error-disable feature has been specifically disabled.
dmf-controller# show errdisable 
Max flap count                      : 20
Duration to monitor max flaps (sec) : 30
Recovery interval (sec)             : 1200
Status                              : enabled
~ Interfaces in Error-Disable State ~
# Switch IF Name    
-|------|----------|
1 core1  ethernet12
~ Excluded Interfaces from Error-Disable ~
# Switch IF Name    
-|------|----------|
1 core1  ethernet14

Use the show switch switch-name interface interface-name errdisable command to view more details related to the error-disable interface. The output lists the switch name, interface name, state, the reason for the port shutdown, shutdown time, time remaining until its recovery, and expected recovery time.

dmf-controller# show switch core1 interface ethernet12 errdisable 
# Switch IF Name    State         Shutdown Reason Shutdown Time           Time Until Recovery(sec) Expected Recovery Time  
-|------|----------|-------------|---------------|-----------------------|------------------------|-----------------------|
1 core1  ethernet12 port-disabled port-flaps      2025-02-26 20:46:29 UTC 973                      2025-02-26 21:46:29 UTC

Troubleshooting

For troubleshooting scenarios where errdisable is configured but an interface has not been disabled despite flapping, the show flaps port switch-name interface-name command is useful. This command provides the following information:

  • Total Flap Count: The cumulative number of detected flap events for the specified interface.
  • Recent Flap History: The last 10 flap events detail the precise start and end timestamps of the interface’s down and up transitions.
Note: To identify true interface flapping, DMF establishes a baseline by observing a brief period of initial up/down transitions. The show flaps port switch-name interface-name command registers and displays actual flapping events only after establishing this baseline.
# show flaps port core1 ethernet12 
~~~~~~~~ Selected Port  ~~~~~~~~
Port Name           : ethernet12
Switch Name         : core1
Total Flaps on Port : 3
~~~~~~~~~~~~~~~~ Port Flap Events ~~~~~~~~~~~~~~~~
# Start Time of Flap      End Time of Flap        
-|-----------------------|-----------------------|
1 2025-02-27 19:00:33 UTC 2025-02-27 19:00:34 UTC
2 2025-02-27 19:00:30 UTC 2025-02-27 19:00:31 UTC
3 2025-02-27 19:00:28 UTC 2025-02-27 19:00:29 UTC

Overriding the Default Configuration for a Switch

By default, each switch inherits its configuration from the DANZ Monitoring Fabric (DMF) Controller. Use the following pages of the Configure Switch dialog to override the following configuration options for a specific switch.
  • Info
  • Clock
  • SNMP
  • SNMP traps
  • Logging
  • TACACS
  • sFlow®*
  • LAG enhanced hash
CLI Configuration
To use the CLI to manage switch configuration, enter the following commands to enter the config-switch submode.
controller-1(config)# switch switch-name
Replace the switch-name with the alias previously assigned to each switch during installation, as in the following example.
controller-1(config)# switch DMF-SWITCH-1
controller-1(config-switch)#

From this submode, configure the specific switch and override the default configuration pushed from the DANZ Monitoring Fabric (DMF) Controller to the switch.

The DANZ Monitoring Fabric Deployment Guide provides detailed instructions on overriding the switch's default configuration.

Switch Light CLI Operational Commands

As a result of upgrading the Debian distribution to Bookworm, the original Python CLI (based on python2) was removed, as the interaction with the DANZ Monitoring Fabric (DMF) is performed mainly from the Controller.

However, several user operations involve some of the commands used on the switch. These commands are implemented in the new CLI (based on python3) in Switch Light in the Bookworm Debian distribution.

The Zero-Trust Network (ZTN) Security CLI is the default shell when logged into the switch.

Note: The following commands are only available on Arista Switch platforms running Switch Light OS.

Operational Commands

After connecting to the switch and from the DMF Controller, use the debug admin command to enter the switch admin CLI from the ZTN CLI.

Enter the exit command to leave the switch admin CLI, as illustrated in the following example.
DMF-CONTROLLER# connect switch dmf-sw-7050sx3-1
Switch Light OS SWL-OS-DMF-8.6.x(0), 2024-05-16.08:26-17f56f6
Linux dmf-sw-7050sx3-1 4.19.296-OpenNetworkLinux #1 SMP Thu May 16 08:35:25 UTC 2024 x86_64
Last login: Tue May 21 10:39:05 2024 from 10.240.141.151

Switch Light ZTN Manual Configuration. Type help or ? to list commands.

(ztn-config) debug admin
(admin)
(admin) exit

(ztn-config)

Help

The following commands are available under the admin shell.
(admin) help

Documented commands (type help <topic>):
========================================
EOF  copy  exit  help  ping  ping6  quit  reboot  reload  show

Ping

Use the ping command to test a host's accessibility using its IPV4 address.
(admin) ping 10.240.141.151
PING 10.240.141.151 (10.240.141.151) 56(84) bytes of data.
64 bytes from 10.240.141.151: icmp_seq=1 ttl=64 time=0.238 ms
64 bytes from 10.240.141.151: icmp_seq=2 ttl=64 time=0.206 ms
64 bytes from 10.240.141.151: icmp_seq=3 ttl=64 time=0.221 ms
64 bytes from 10.240.141.151: icmp_seq=4 ttl=64 time=0.161 ms

--- 10.240.141.151 ping statistics ---
4 packets transmitted, 4 received, 0% packet loss, time 3049ms
rtt min/avg/max/mdev = 0.161/0.206/0.238/0.028 ms

Ping6

Use the ping6 command to test a host's accessibility using its IPV6 address.
(admin) ping6 fe80::3673:5aff:fefb:9dec
PING fe80::3673:5aff:fefb:9dec(fe80::3673:5aff:fefb:9dec) 56 data bytes
64 bytes from fe80::3673:5aff:fefb:9dec%ma1: icmp_seq=1 ttl=64 time=0.490 ms
64 bytes from fe80::3673:5aff:fefb:9dec%ma1: icmp_seq=2 ttl=64 time=0.232 ms
64 bytes from fe80::3673:5aff:fefb:9dec%ma1: icmp_seq=3 ttl=64 time=0.218 ms
64 bytes from fe80::3673:5aff:fefb:9dec%ma1: icmp_seq=4 ttl=64 time=0.238 ms

--- fe80::3673:5aff:fefb:9dec ping statistics ---
4 packets transmitted, 4 received, 0% packet loss, time 3069ms
rtt min/avg/max/mdev = 0.218/0.294/0.490/0.113 ms

Copy Tech-Support Data

Use the copy tech-support data command to collect the switch support bundle. The tech support command executed from the Controller collects support bundles from all the switches in the fabric.

To collect tech support data for an individual switch, only run the copy tech-support data command from that switch. Perform this action when the switch isn't accessible from the Controller or when collecting a support bundle only for that switch.
(admin) copy tech-support data
Writing /mnt/onl/data/tech-support_240521104337.txt.gz...
tech-support_240521104337.txt.gz created in /mnt/onl/data/
(admin)

Show Commands

The following show commands are available under the admin shell.

Show Clock
(admin) show clock
Tue May 21 10:46:20 2024
(admin)
Show NTP
(admin) show ntp
remote                                   refid           st t when poll  reach delay    offset   jitter
=======================================================================================================
 10.130.234.12                           .STEP.          16 u    - 1024    0   0.0000   0.0000   0.0002
*time2.google.com                        .GOOG.           1 u  649 1024  377  40.0469   1.6957   0.4640
+40.119.6.228                            25.66.230.1      3 u  601 1024  377  50.6083  -0.5323   7.8069
(admin)

Show Controller

The show controller command displays all the configured Controllers and their connection status and role.
(admin) show controller
IP:Port              Proto State          Role     #Aux
10.240.141.151:6653  tcp   CONNECTED      ACTIVE      2
10.240.189.233:6653  tcp   CONNECTED      STANDBY     2
     127.0.0.1:6653  tcp   CONNECTED      STANDBY     1
(admin)
Use the history and statistics options in the show controller command to obtain additional information.
(admin) show controller history | statistics
(admin)
The show controller history command displays the history of controller-to-switch connections and disconnections.
(admin) show controller history
Mon May 20 15:53:42 2024 tcp:127.0.0.1:6653:0 - Connected
Mon May 20 15:53:43 2024 tcp:127.0.0.1:6653:1 - Connected
Mon May 20 15:54:46 2024 tcp:127.0.0.1:6653:1 - Disconnected
Mon May 20 15:54:46 2024 tcp:127.0.0.1:6653:0 - Disconnected
Mon May 20 08:57:07 2024 tcp:127.0.0.1:6653:0 - Connected
Mon May 20 08:57:07 2024 tcp:127.0.0.1:6653:1 - Connected
Mon May 20 08:57:07 2024 tcp:10.240.141.151:6653:0 - Connected
Mon May 20 08:57:07 2024 tcp:10.240.141.151:6653:1 - Connected
Mon May 20 08:57:07 2024 tcp:10.240.141.151:6653:2 - Connected
Mon May 20 11:16:07 2024 tcp:10.240.189.233:6653:0 - Connected
Mon May 20 11:16:19 2024 tcp:10.240.189.233:6653:1 - Connected
Mon May 20 11:16:19 2024 tcp:10.240.189.233:6653:2 - Connected
(admin)
The show controller statistics command displays connection statistics, including keep-alive timeout, timeout threshold count, and other important information, as shown in the following example.
(admin) show controller statistics
Connection statistics report
Outstanding async op count from previous connections: 0
Stats for connection tcp:10.240.141.151:6653:0:
    Id: 131072
    Auxiliary Id: 0
    Controller Id: 0
    State: Connected
    Keepalive timeout: 2000 ms
    Threshold: 3
    Outstanding Echo Count: 0
    Tx Echo Count: 46438
    Messages in, current connection: 52887
    Cumulative messages in: 52887
    Messages out, current connection: 52961
    Cumulative messages out: 52961
    Dropped outgoing messages: 0
    Outstanding Async Operations: 0
Stats for connection tcp:10.240.189.233:6653:0:
    Id: 112066561
    Auxiliary Id: 0
    Controller Id: 1
    State: Connected
    Keepalive timeout: 2000 ms
    Threshold: 3
    Outstanding Echo Count: 0
    Tx Echo Count: 42269
    Messages in, current connection: 43108
    Cumulative messages in: 43108
    Messages out, current connection: 43114
    Cumulative messages out: 43114
    Dropped outgoing messages: 0
    Outstanding Async Operations: 0
(admin)
The show log command displays log messages from the Syslog file.
(admin) show log
2024-05-20T15:53:04+00:00 localhost syslog-ng[3787]: NOTICE syslog-ng starting up; version='3.38.1'
2024-05-20T15:52:51+00:00 localhost kernel: NOTICE Linux version 4.19.296-OpenNetworkLinux (bsn@sbs3) (gcc version 12.2.0 (Debian 12.2.0-14)) #1 SMP Thu May 16 08:35:25 UTC 2024
2024-05-20T15:52:51+00:00 localhost kernel: INFO Command line:  reboot=p acpi=on Aboot=Aboot-norcal6-6.1.10-14653765 platform=magpie sid=Calpella console=ttyS0,9600n8 tsc=reliable pcie_ports=native pti=off reassign_prefmem amd_iommu=off onl_mnt=/dev/mmcblk0p1 quiet=1 onl_platform=x86-64-arista-7050sx3-48yc12-r0 onl_sku=DCS-7050SX3-48YC12
2024-05-20T15:52:51+00:00 localhost kernel: INFO BIOS-provided physical RAM map:
….
….
2024-05-21T10:40:31-07:00 dmf-sw-7050sx3-1 systemd[1]: INFO Starting logrotate.service - Rotate log files...
2024-05-21T10:40:32-07:00 dmf-sw-7050sx3-1 systemd[1]: INFO logrotate.service: Deactivated successfully.
2024-05-21T10:40:32-07:00 dmf-sw-7050sx3-1 systemd[1]: INFO Finished logrotate.service - Rotate log files.
2024-05-21T10:45:32-07:00 dmf-sw-7050sx3-1 systemd[1]: INFO Starting logrotate.service - Rotate log files...
2024-05-21T10:45:33-07:00 dmf-sw-7050sx3-1 systemd[1]: INFO logrotate.service: Deactivated successfully.
2024-05-21T10:45:33-07:00 dmf-sw-7050sx3-1 systemd[1]: INFO Finished logrotate.service - Rotate log files.
(admin)

Reboot and Reload

Use the reboot and reload commands to either reboot or reload the switch, as needed.
(admin) help reboot

Reboot the switch.

(admin) help reload

Reload the switch.

(admin) reboot
Proceed with reboot [confirm]?

(admin) reload
Proceed with reload [confirm]?
(admin)
*sFlow® is a registered trademark of Inmon Corp.

Introduction to DMF and Overview

This chapter introduces the DANZ Monitoring Fabric (DMF) and the user interfaces for out-of-band monitoring and configuration.

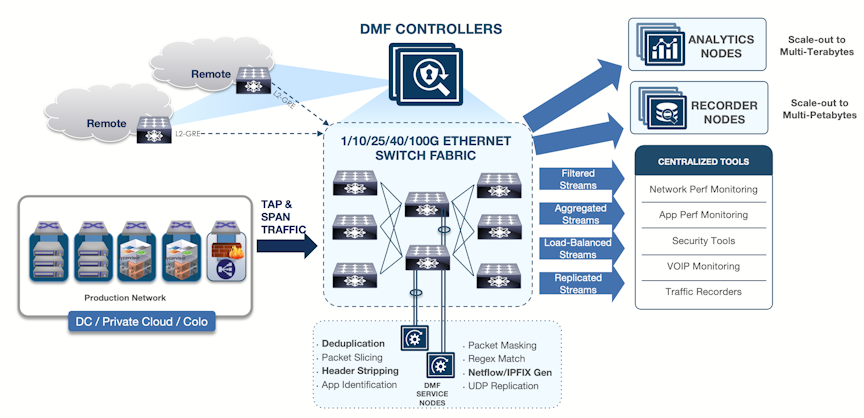
DANZ Monitoring Fabric (DMF) is a cloud-first Network Packet Broker (NPB) that provides a single pane of glass with an integrated visibility fabric. The DMF solution includes NPB functionality with the DMF Recorder Node and the Analytics Node for deeper monitoring and pervasive security of out-of-band workloads in hybrid cloud deployments.

DMF leverages an SDN-controlled fabric using high-performance, open networking (white box/brite box) switches and industry-standard x86 servers to deploy highly scalable and flexible network visibility and security solutions. Traditional, box-based, hardware-centric NPBs are architecturally limited when trying to meet the evolving security and visibility demands of Cloud Native data centers. DMF addresses the challenges of traditional NPB solutions by enabling a scale-out fabric for enterprise-wide security and monitoring, a single pane of glass for operational simplicity, and multi-tenancy for multiple IT teams, including NetOps, DevOps, and SecOps.

Out-of-band Monitoring with DANZ Monitoring Fabric

As data center networks move toward 40/100G designs, cloud computing, hyper scale data analytics, and 5G mobile services, traffic monitoring must transition to next-generation designs. To manage the modern data center, much network traffic must be copied and aggregated from TAP or SPAN ports and forwarded to monitoring and analysis tools. These tools, used in managing network performance, application performance, security, and compliance, leverage other systems such as data recorders, intrusion detection systems, data leakage detectors, SLA measurement devices, and other traffic analyzers like Wireshark.

DANZ Monitoring Fabric (DMF) uses high-performance open-networking switches to deliver an open, production-grade, and scalable monitoring solution based on Software Defined Networking (SDN) technology. The centralized DMF Controller provides flexibility, simplifies policy management and monitoring fabric configuration, and supports cost-effective monitoring of data centers and remote sites or branches with up to several thousand TAP and SPAN ports.

DMF architecture, inspired by hyper scale networking designs, consists of the following components:

  • HA pair of SDN-enabled DMF Controllers (VMs or hardware appliances), enable simplified and centralized configuration, monitoring, and troubleshooting.
  • Arista Networks SDN-enabled Switch Light OS is a production-grade, lightweight OS that runs on DMF Ethernet switches.
  • DANZ Service Nodes (optional), a Data Plane Development Kit (DPDK)-powered, x86-based appliances that connect to the DMF singly or as part of a service node chain. The service node provides advanced packet functions, such as deduplication, packet slicing, header stripping, regex matching, packet masking, UDP replication, and IPFIX/NetFlow generation.
  • DANZ Recorder Nodes (optional) are x86-based appliances connected to the DMF and are managed via the DMF Controller to provide petabyte packet recording, querying, and replay functions.
  • Analytics Nodes (optional) are x86-based appliances that integrate with the DMF to provide multi-terabit, security, and performance analytics with configurable, historical time-series dashboards.
Figure 1. Out-of-Band Monitoring with DANZ Monitoring Fabric
DMF lets a network operator easily deploy data center-wide monitoring with the following benefits:
  • Organization-wide visibility: delivers traffic from any TAP to any tool at any time across one or multiple locations.
  • Flexible, scale-out fabric deployment: supports a large number of 1G, 10G, 25G, 40G, and 100G ports (thousands per fabric).
  • Multi-tenant tap and tool sharing: supports monitoring by multiple teams to enable Monitoring Fabric as a Service.
  • Massive operational simplification: provides a single pane of glass for provisioning, management, monitoring, and debugging through a centralized SDN Controller. This feature eliminates needing a box-by-box configuration.
  • Centralized programmability: a REST-based API architecture enables event-based, centralized policy management and automation for integrated end-to-end IT work flows. This feature leverages DMF Service Nodes, Analytics Nodes, and Recorder Nodes.
  • Dramatic cost savings: Achieving a significant reduction in the total cost of ownership by using open Ethernet switches in combination with industry-standard x86 servers, optimized usage of tools, and SDN-enabled operations and automation.

Using the DANZ Monitoring Fabric GUI

The DANZ Monitoring Fabric (DMF) Graphical User Interface (GUI) performs similar operations to the CLI using a graphic user interface instead of text commands and options. The DMF GUI is compatible with recent versions of any of the following supported browsers:
  • Mozilla Firefox
  • Google Chrome
  • Microsoft Edge
  • Internet Explorer
  • Apple Safari

To connect to the DMF GUI, use the DMF Controller IP address. Use the virtual IP (VIP) assigned to the cluster if configured during deployment. Using the VIP ensures that the user connects to the current active Controller, regardless of any failover that may have occurred.

Use the active Controller for all configuration operations and to obtain reliable information when monitoring DMF. The standby Controller is provided only for redundancy if the active Controller becomes unavailable. Do not perform any configuration using the standby Controller, and any information displayed may not be accurate. The figure below illustrates connecting to the DMF GUI using HTTPS (port 443) at the IP address 192.168.17.233
Figure 2. Connecting to the DANZ Monitoring Fabric GUI
Connecting to the Controller for the first time may result in a security exception prompt (message) because the Controller HTTPS server uses an unknown (self-signed) certificate authority.
Note: When using Internet Explorer, the login attempt may fail if the system time is different than the Controller time. To remedy this, ensure the system used to log in to the Controller is synchronized with the Controller.
After accepting the prompts, the system displays the login prompt, shown in the figure below.
Figure 3. DANZ Monitoring Fabric GUI Login Prompt

Use the admin username and password configured for the DMF Controller during installation or any user account and password configured with administrator privileges. A user in the read-only group will have access to options for monitoring fabric configuration and activity but cannot change the configuration.

Figure 4. DANZ Monitoring Fabric GUI Main Menu
When logging in to the DMF GUI, a landing page appears. This page shows the DMF Controller Overview, dashboard, and a menu bar (pictured above) with sub-menus containing options for setting up DMF and monitoring network activity. The menu bar includes the following sub-menus:
  • Fabric: Manage DMF switches and interfaces.
  • Monitoring: Manage DMF policies, services, and interfaces.
  • Maintenance: Configure fabric-wide settings (clock, SNMP, AAA, sFlow®*, Logging, Analytics Configuration).
  • Integration: Manage the integration of vCenter instances to allow monitoring traffic using DMF.
  • Security: Manage administrative access.
  • DMF Features: Select the gear icon in the navigation bar to view the DMF Features page.
  • Alerts: Select the Notification Bell to view the Alerts page.
  • Background Tasks:Select the Task icon to view running background tasks.

  • Admin (A):A page that displays or edits user preferences; the ability to change the password or sign out. Set Display Preferences, enter the API Inspector, change Settings, and view About details.
The newly designed dashboard displays information about the Controller, including switches, interfaces, policies, and Smart Nodes.
Figure 5. DMF Controller Overview
The header displays the following basic information about the Controller:
  • Active IP address
  • Standby IP address
  • Virtual IP address
  • Redundancy Status - The status contains an informational tool tip that can be hovered for more details.
Four cards control the type of content displayed on the main section of the page. The cards are:
  • Controller Health
  • Switch Health
  • Policy Health
  • Smart Node Health

Admin Settings

The Admin settings menu provides access to the following features and functions.

  • Account Sign-in and User Role
  • About
  • Settings
  • Display Preferences
  • API Inspector
  • Sign out

Hover over and select the (user) icon to view the drop-down menu.

Figure 6. Gear Icon
Figure 7. Admin Menu

Selecting the User Account icon opens a Current Users Permissions window.

Figure 8. Current User Permissions

About: Open an information window providing details about the DMF Instance.

Figure 9. Hardware / Software Information

To manage user preferences select Settings.

Figure 10. Settings
  • Change Password: Change the existing user account password.
    Figure 11. Password Change
  • Change Login Banner: Change the login banner that appears when accessing DMF.
    Figure 12. Change Banner
  • Navigation and Legal: Configure the user interface preferences and view license details.
    Figure 13. Navigation
Display Preferences: Review the preferred Bit Rate Units for data display.
Figure 14. Display Preferences
API Schema: Browse the API Schema of the DMF API.
Figure 15. API Schema

Sign out: Logout of the DMF Instance.

DMF Features Page

To navigate the DMF Features Page, select the gear icon in the navigation bar.
Figure 16. Gear Icon

Page Layout

All fabric-wide configuration settings required in advanced use cases for deploying DMF policies appear in the new DMF Features Page.

Figure 17. DMF Features Page

The fabric-wide options used with DMF policies include the following:

Table 1. Feature Set
Auto VLAN Mode Auto VLAN Range
Auto VLAN Strip Control Plane Lockdown Mode
CRC Check Custom Priority
Device Deployment Mode Error Disable
Filter MAC Rewrite Global PTP Settings
Inport Mask MACsec
Match Mode Policy Overlap Limit
Policy Overlap Limit Strict Retain User Policy VLAN
Supervisor Redundancy Settings Timestamp Settings
Tunneling VLAN Preservation
Each card on the page corresponds to a feature set.
Figure 18. Feature Set Card
The UI displays the following:
  • Feature Title
  • A brief description
  • View / Hide Detailed Information
  • Current Setting
  • Edit Link - Use Edit (pencil icon) to change the value.
View Detailed Information

Each configuration option has detailed information. For more details, select the View Detailed Information link on each card.
Figure 19. View Detailed Information

Feature Settings

Auto VLAN Strip

  1. A toggle button controls the configuration of this feature. Locate the corresponding card and move the toggle button.
    Figure 20. Toggle Switch
  2. A confirm window pops up, displaying the corresponding prompt message. Select Enable to confirm the configuration changes or choose Cancel to cancel the configuration. Conversely, to disable the configuration, select Disable.
    Figure 21. Confirm Enable
    Figure 22. Confirm Disable
  3. Review any warning messages that appear in the confirmation window during the configuration process.
    Figure 23. Warning Message - Changing

The following feature sets work in the same manner as the Auto VLAN Strip feature described above.


Table 2. Similar Feature Sets
CRC Check Policy Overlap Limit Strict
Custom Priority Retain User Policy VLAN
Inport Mask Tunneling

Auto VLAN Mode

  1. Control the configuration of this feature using the Edit icon by locating the corresponding card and selecting the pencil icon.
    Figure 24. Auto VLAN Mode Config
  2. A confirmation edit dialogue window appears, displaying the corresponding prompt message.
    Figure 25. Edit VLAN Mode
  3. To configure different modes, select the drop-down arrow to open the menu.
    Figure 26. Drop-down Example
  4. From the drop-down menu, select and select the desired mode.
    Figure 27. Push Per Policy
  5. Alternatively, enter the desired mode name in the input area.
    Figure 28. Push Per Policy
  6. Select Submit to confirm the configuration changes or choose Cancel to discard the changes.
    Figure 29. Submit Button
  7. After successfully setting the configuration, the current configuration status displays next to the edit icon.
    Figure 30. Current Configuration Status

The following feature sets work in the same manner as the Auto VLAN Mode feature described above.

  • Device Deployment Mode
  • Match Mode

Auto VLAN Range

  1. Control the configuration of this feature using the Edit icon by locating the corresponding card and selecting the pencil icon.
    Figure 31. Edit Auto VLAN Range
  2. A configuration edit dialogue window pops up, displaying the corresponding prompt message. The Auto VLAN Range defaults to 1 - 4094.
    Figure 32. Edit Auto VLAN Range
  3. Select Custom to configure the custom range.
    Figure 33. Custom Button
  4. Adjust range value (minimum value: 1, maximum value: 4094). There are three ways to adjust the value of a range:
    • Directly enter the desired value in the input area, with the left side representing the minimum value of the range and the right side representing the maximum value.
    • Adjust the value by dragging the slider using a mouse. The left knob represents the minimum value of the range, while the right knob represents the maximum value.
    • Use the up and down arrow buttons in the input area to adjust the value accordingly. Pressing the up arrow increments the value by 1, while pressing the down arrow decrements it by 1.
  5. Select Submit to confirm the configuration changes or Cancel to discard the changes.
  6. After successfully setting the configuration, the current configuration status displays next to the pencil (edit) icon.

    Figure 34. Configuration Change Success

Policy Overlap Limit

  1. Control the configuration of this feature using the Edit icon by locating the corresponding card and selecting the pencil icon.
    Figure 35. Policy Overlap Limit
  2. A configuration edit dialogue window pops up, displaying the corresponding prompt message. By default, the Policy Overlap Limit is 4.
    Figure 36. Edit Policy Overlap Limit
  3. Adjust the Value (minimum value: 0, maximum value: 10). There are two ways to adjust the value:
    • Directly enter the desired value in the input area.
    • Use the up and down arrow buttons in the input area to adjust the value accordingly. Pressing the up arrow increments the value by 1, while pressing the down arrow decrements it by 1.
  4. Select Submit to confirm the configuration changes or Cancel to discard the changes.
  5. After successfully setting the configuration, the current configuration status displays next to the pencil (edit) icon.
    Figure 37. Policy Overlap Limit Change Success

VLAN Preservation

  1. Control the configuration of this feature using the Edit icon by locating the corresponding card and selecting the pencil icon.
    Figure 38. VLAN Preservation Feature Set
  2. A configuration edit dialogue window appears displaying the corresponding prompt message. The VLAN Preservation defaults to:
    • Preserve User Configured VLANS: Off
    • Preserve VLAN: No VLAN Configured
  3. To configure Preserve User Configured VLANs, toggle on the switch.
    Figure 39. Edit VLAN Preservation Configuration
  4. To configure Preserve VLAN, select Add VLAN to add a configuration area for preserving the VLAN value.
    Figure 40. Preserve VLAN - Add VLAN
  5. Select the drop-down icon. There are two ways to configure the preserved VLAN value (minimum value: 1, maximum value: 4094) and a method to delete an entry.
    Figure 41. VLAN Single Example
    • Add Single: Choose Single in the VLAN drop-down menu, and type in the value in the input area.
      Figure 42. Add Single VLAN
    • Add Range: Choose Range in the VLAN drop-down menu, and type in the input area's minimum and maximum values.
      Figure 43. Add VLAN Range
    • Delete: Since there must be a corresponding number in the value input area when submitting the configuration, when accidentally adding multiple redundant VLAN configuration areas, delete the corresponding rows by selecting the red trash can icon .
    Note: The feature supports combinations of any number of single values and any number of range values.
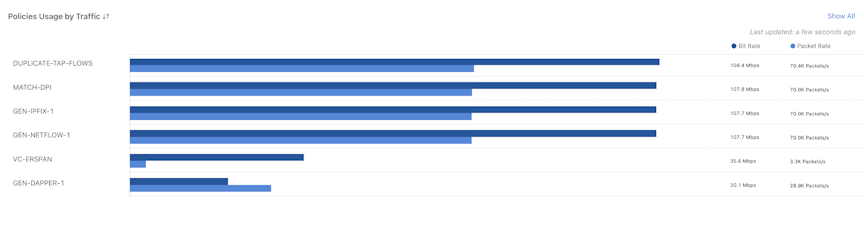
  6. Select Submit confirm the configuration changes or Cancel to discard the changes.
  7. After successfully setting the configuration, the current configuration status displays next to the pencil (edit) icon.
    Figure 44. Preserve VLAN Configuration Change

Global PTP Settings

  1. Control the configuration of this feature using the Edit icon by locating the corresponding card and selecting the pencil icon.
    Figure 45. Global PTP Settings
  2. A configuration edit dialogue window appears displaying the corresponding prompt message. By default, these features are not configured. Enter the desired configuration value in the corresponding input area. Hover over the question mark icon to obtain additional explanatory information.
    Figure 46. Edit PTP Settings
  3. Select Submit to confirm the configuration changes or Cancel to discard the changes.
  4. After successfully setting the configuration, the current configuration status displays next to the pencil (edit) icon.
    Figure 47. PTP Timestamping Configuration Change

Feature Setting Notification Message

Successfully configuring a feature results in a success notification message pop-up with specific details.
Figure 48. Success Message
Whenever an error occurs during the configuration of a feature, an error notification message pops up along with specific details about the error.
Figure 49. Failure Message

Control Plane Lockdown Mode

Enable or disable the Control Plane Lockdown Mode feature.
  1. A toggle button controls the configuration of this feature. Locate the corresponding card and select the toggle switch.
    Figure 50. Control Plane Lockdown Mode
  2. Select Enable to enable Control Plane Lockdown Mode or Cancel to discard the changes.
    Figure 51. Enable Control Plane Lockdown Mode
    Note: Changing the Control Plane Lockdown Mode may cause some service interruption during the transition.
  3. On enabling Control Plane Lockdown Mode, a success notification message pops up with specific details.
    Figure 52. Success Message

Timestamp Settings

  1. Control the configuration of this feature using the Edit icon by locating the corresponding card and selecting the pencil icon.
    Figure 53. Timestamp Settings
  2. To configure different header modes, select the drop-down arrow. There are two ways to edit the timestamp settings - Replace Source MAC or Add Header after L2.
    Figure 54. Edit Timestamp Settings
  3. For Add Header after L2 Mode, choose the header format as 48-bit or 64-bit.
    Figure 55. Add Header after L2
  4. Select Submit to confirm the configuration changes or Cancel to discard the changes.
    Figure 56. Submit Timestamp Changes
  5. Select Replace Source MAC Mode and use Submit to confirm the configuration changes or Cancel to discard the changes.
    Figure 57. Replace Source MAC
  6. On enabling Timestamp Settings, a success notification message pops up with specific details.
    Figure 58. Success Message

Dashboard Layout

The dashboard data displays four tabs:
  • Controller Health
  • Switch Health
  • Policy Health
  • Smart Node Health
Each tab has health indicators for that category, and accessing the tab displays the relevant data below.
Figure 59. DANZ Monitoring Fabric (DMF) Controller Tabs
If a category contains errors or warnings, selecting the message in the tab opens a details window. It displays the number of errors or warnings filtered by tab category.
Figure 60. Filtered by Category
Review errors by selecting the bell icon on the right side of the Navigation bar, and it will list all fabric errors and warnings instead of filtering by an individual tab.
Figure 61. Notification Bell

Controller Health

DANZ Monitoring Fabric (DMF) Interface Utilization

This widget displays the utilization of each DMF interface as follows:

  • DMF Interface Name
  • Interface Role
  • Traffic Direction
  • Current Utilization (%)
  • Peak Utilization (%)
Figure 62. DMF Interface Utilization

The bar indicates the current utilization and shows peak utilization with a vertical line. The color of the bar and percentage changes depending on the utilization:

  • Red means the utilization percentage is greater than 95%.
  • Yellow means the utilization percentage is greater than 70%.
  • Green means the utilization percentage is less than 70%.

Filter interfaces display only RX traffic, while delivery interfaces display only TX traffic. Other roles with bidirectional data can have one item for each direction of traffic, RX, or TX.

Show All leads to the DMF Interfaces page.

On hover, the bar shows the interface’s Bit Rate, Peak Bit Rate, and Speed in bits per second.
Figure 63. DMF Interface Utilization Hover Details

Sort interfaces by Interface Name or Current Utilization. The interfaces are sorted by current utilization (descending order) by default.

Display the interfaces by filtering using Role, Traffic Direction, and Current Utilization.
Figure 64. Sort Roles

Top DMF Interfaces by Traffic

This visualization displays each DMF interface's traffic (bit rate and packet rate).
Figure 65. Top DMF Interfaces by Traffic

The widget shows each interface's traffic direction, DMF Interface name, bit rate, and packet rate. Show All leads to the DMF Interfaces page. Sort interfaces by Bit Rate and filter by Metric and Role. By default, DMF sorts the data in descending order of bit rate.

On hover, the widget shows the DMF name, bit rate, and packet rate.
Figure 66. Top DMF Interfaces by Traffic Hover Details

Top Policies

The widget displays the top policies in DMF. For each policy, traffic is determined by totaling the traffic of each of its configured filter interfaces.
Figure 67. DMF Top Policies

For each policy, the bar chart shows the following:

  • Policy Name
  • The sum of the bit rates of all filter interfaces associated with the policy.
  • The sum of the packet rates of all filter interfaces associated with the policy.
On hover, the bar displays the policy name, bit rate, and packet rate.
Figure 68. DMF Policies Hover Details

Sort policies by Bit Rate and filter by Metric. By default, DMF sorts the policies in descending order of bit rate.

Show All leads to the Policies page.

Switch Health

Interface Usage Summary

This widget displays the usage statistics for all DANZ Monitoring Fabric (DMF) interfaces. The interface utilization groups all active interfaces:
  • Red means that the utilization percentage is greater than 95%.
  • Yellow means that the utilization percentage is greater than 70%.
  • Green means that the utilization percentage is less than 70%.
Figure 69. DMF Interface Usage Summary
There are three other categories for DMF Interfaces with no traffic. These appear beneath the Usage Bar:
  • Admin Shutdown
  • Link Down
  • Unknown - when Interface Speed is undefined or not known
  • Total Capacity Used displays with Total Capacity defined as the number of Active DMF Interfaces divided by the Number of Total DMF Interfaces
On hover, the number of interfaces in each category appears in the respective usage bar.
Figure 70. DMF Interface Usage Hover Details

Switch Usage Summary

This widget displays the usage statistics for each switch. All switches are grouped by:

  • Active (Green)
  • Admin Shutdown (Yellow)
  • Down (Red)
  • Quarantined (Grey)
Figure 71. DMF Switch Usage Summary


The total number of switches is displayed.

Three list items display the number of:

  • Switches Admin Shutdown
  • Switches Down
  • Switches Quarantined
On hover, the number of switches in each category appears in the respective usage bar.
Figure 72. DMF Switch Usage Hover Details

TCAM Usage Summary

This widget displays the usage statistics for the TCAM of each switch and groups all active TCAMs by usage:

  • Red means that the utilization percentage is greater than 95%.
  • Yellow means that the utilization percentage is greater than 70%.
  • Green means that the utilization percentage is less than 70%.
  • Grey means that the utilization is Unknown.
    • A switch is grouped in the Unknown category when no TCAM usage statistics are available, generally from a switch being shut down or disconnected.
Figure 73. DMF TCAM Usage Summary

The View Details link leads to the TCAM Utilization tab of the Switches page.

Below the Usage Bar, there are three list items displaying:
  • Switch Usage 71% - 95%
  • Switch Usage 96% - 100%
  • Unknown
On hover, the number of switches in each category appears in the respective usage bar.
Figure 74. DMF TCAM Utilization Hover Details

DMF Interface Utilization

DMF Interface Utilization is similar to the data displayed in the Controller Health tab. Please refer to its description for more information.

Switch Utilization

This widget contains two tabs:
  • Switch Usage
  • TCAM Usage

Switch Usage

The Switch Usage tab of the Switch Utilization displays essential information for each switch, including the use of each switch interface and alerts for any warnings or errors.
Figure 75. DMF Switch Usage Tab


The widget displays the following data for each switch:

  • Switch Name (contains a link to the Switches page for that specific switch).
  • Switch Usage: Each section represents the number of interfaces with a specific role.
  • Total Usage: Displays the Number of Interfaces with an assigned role divided by the Total Number of Interfaces on the switch.
  • Alerts: This column displays any alerts related to interfaces.
    • The yellow badge indicates the number of warnings, while the red badge shows the number of errors.
The Switch Usage column contains the number of interfaces for each role:
  • Filter
  • Delivery
  • Filter and Delivery
  • Core
  • Recorder Node
  • Service
  • PTP
  • MLAG Core
  • MLAG Delivery.
Three columns can sort the table:
  • Sort the Switch Name column in alphabetical order.
  • Sort the Total Usage column by percentage (%) usage (# used interfaces / # total interfaces).
  • Sort the Alerts column by the total number of alerts (# warnings + # errors).

The default sort order for this table is the Alerts column in descending order, which ensures the switches with the highest number of alerts are initially at the top.

On hover, the number of each interface appears.
Figure 76. DMF Switch Usage Filter Interfaces Hover Details

While hovering over the warnings or alerts badge, a table appears and displays Warnings for the yellow badge and Errors for the red badge, and it will also show the switch name.

Each row of the table contains the following:

  • Interface name (includes a link to Interfaces/[INTERFACE-NAME] page)
  • Interface role
  • Alert type (e.g., Down Delivery Interface)
Figure 77. DMF Interface Warnings
When data is unavailable for a switch (C1), there will be a yellow badge under the Switch Name that says Data Not Available. The Switch Usage column will have an empty usage bar, the Total Usage Column will show 0 (zero) for the number of currently used interfaces, and the Alerts column will be empty.
Figure 78. DMF Switch Usage - Data Not Available
When a switch is down, a red badge appears under the Switch Name that says Switch Not Connected. The other columns will be empty in the same way as the Data Not Available case.
Figure 79. DMF Switch Usage - Switch Not Connected

TCAM Usage

The TCAM Usage widget displays the current utilization of the TCAMs for each active switch. A switch can have a TCAM for IPv4, IPv6, or both. Each TCAM has a guaranteed maximum usage and current utilization. This table compares the current utilization of each TCAM to its guaranteed maximum.
Figure 80. DMF Usage (Policy Usage Only)

This widget displays a TCAM Usage chart for each switch:

  • The purple bar shows IPv4 Current Utilization and Guaranteed Maximum.
  • The cyan bar shows IPv6 Current Utilization and Guaranteed Maximum.
  • Each row will display Current Utilization (IPv4 + IPv6 Current Utilization)
  • Sort by Switch Name and Current Utilization.
  • Sort the Switch Name column alphabetically (descending and ascending).
  • Sort the Current Utilization column in descending and ascending order (IPv4 + IPv6 Current Utilization).
  • The default sort order for the table is the Current Utilization column in descending order, ensuring the switches with the highest current utilization display first.

Top DMF Interfaces by Traffic

The visualization shows DMF interface traffic (bit rate and packet rate) color-coded by interface role. The roles displayed are:
  • Core
  • Delivery
  • Filter
  • Filter and Delivery
  • MLAG Core
  • MLAG Delivery
  • Recorder Node
  • Service
Figure 81. DMF Top Interfaces by Traffic
For each interface, the chart item shows:
  • Interface role
  • Traffic direction
  • DMF interface name
  • Bit rate
  • Packet rate

Show All leads to the DMF Interfaces page.

Sort the interfaces by bit rate, which, by default, are sorted in descending bit rate order. Filter interfaces by interface role using the drop-down.
Figure 82. DMF Sort Interfaces by Bit Rate

Policy Health

Policies Usage by Traffic

This widget displays policy traffic. For each policy, the bar chart shows:

  • Name of the policy
  • Bit rate
  • Packet rate
Figure 83. DANZ Monitoring Fabric (DMF) Policies Usage by Traffic


On hover, similar information displays.

Sort policies by Bit Rate.

Show All leads to the Policies page.

Active Interfaces by Policy

The table displays DMF interfaces associated with policies. DMF interfaces that are not affiliated with a policy are not displayed.
Figure 84. DMF Active Interfaces by Policy

The table contains the following columns:

  • DMF Interface Name: The DMF name of the switch interface.
  • Role: The role of the interface.
  • Policy Name(s): A list of the policies associated with the interface.
  • Bit Rate: The bit rate of the interface.
  • Packet Rate: The packet rate of the interface.

Show All leads to the DMF Interfaces page.

Sort the table by each column; DMF sorts the items in descending bit rate order by default.

Two filters, Roles and Interfaces, allow data sorting by interface role and DMF interface name.
Figure 85. DMF Active Interfaces by Policy - Roles
Figure 86. DMF Active Interfaces by Policy - Interfaces

Smart Node Health

Recorder Node

The Recorder Nodes table displays Recorder Node health and the following columns:
  • Recorder Node Name
  • IP Address
  • MAC Address
  • Recording
    • Indicates the status of the Recorder Node recording configuration, either Yes or No.
  • Storage Utilization
  • Index and Packet disk storage utilization % (percentage) using the following colors:
    • Red means the utilization percentage is greater than 95%.
    • Yellow means the utilization percentage is greater than 70%.
    • Green means the utilization percentage is less than 70%.
Figure 87. Recorder Nodes
On hover, various details appear depending on the column selected. These include:
  • Free and Total Disk Usage
  • Backup Storage Utilization
  • Index and Packet backup disk storage utilization % (percentage) using the following colors.
    • Red means the utilization percentage is greater than 95%.
    • Yellow means the utilization percentage is greater than 70%.
    • Green means the utilization percentage is less than 70%.
  • Virtual Disk Health
  • Status of Index and Packet virtual disks:
    • Green means the virtual disk’s health is good.
    • >Red means the value of the virtual disk’s health is bad.
  • Recorder Node Fabric Interface
    • Shows the DMF interface name and its status where the Recorder Node connects to the DMF Fabric.
  • Switch, Interface, and status
  • Zero Touch State
  • Alerts
  • Errors and warnings for the Recorder Node - Hovering over an error displays additional information about the errors and warnings.
The following are examples of detailed information when hovering.
Figure 88. Example - Index Disk Storage
Figure 89. Example - Index Backup Disk Storage
Figure 90. Example - Recorder Node Fabric Interface


Figure 91. Example - Errors

The View All link leads to the Recorder Node page.

Service Node

The Service Nodes table displays Service Node health and the following columns:
  • Service Node Name
  • IP Address
  • Service Node Interface Load
  • Zero Touch State
Figure 92. DANZ Monitoring Fabric (DMF) Service Nodes
Hovering over the Service Node Interface Load column displays:
  • Interface Name
  • Service Name
  • Action
Figure 93. DMF Service Nodes Hover Details

The View All link leads to the Service Node page.

Analytics Node

The Analytics Node table displays Analytics Node health and the following columns:
  • IP Address: The configured Analytics Node IP address.
    • Selecting the IP Address opens the Analytics Node UI.
  • Redis Status
    • Displays the status in green if healthy, along with the last updated timestamp.
    • Displays the status in red if unhealthy, along with the latest updated timestamp.
  • Replicated Redis Status
    • Displays the status in green if healthy, along with the latest updated timestamp.
    • Displays the status in red if unhealthy, along with the latest updated timestamp
Figure 94. DMF Analytics Node

The View Details link leads to the Analytics Node details page.

Refreshing Data

Data automatically refreshes every minute, and interface topology data automatically refreshes every 10 seconds.

Manually refresh dashboard data using Refresh.

Empty State

When there are no provisioned switches, DANZ Monitoring Fabric (DMF) Interface Utilization and Top DMF Interfaces by Traffic will display an Empty Component.

Each empty component contains a link to provision a switch. The system prompts the user to create a DMF interface if there are provisioned switches but no assigned DMF interfaces.
Figure 95. DMF Controller Overview - Empty State

Top Policies will display an Empty Component if no policies exist.

Select Create Policy to go to the Create Policy page.
Figure 96. DMF Switch Health - Empty State
The Usage Summary components will display Unused or No Switches Connected for the usage bar legend.
Figure 97. DMF Policy Health - Empty State

Policies Usage by Traffic displays the same Empty Component as Top Policies.

Alerts

The Alerts page is the central hub for monitoring system errors and warnings. It provides a quick summary of critical issues and a detailed list of all active alerts, enabling swift identification, investigation, and subsequent addressing of potential problems within the fabric.

Key Features:

  • Enhanced Visibility: A clear summary section at the top provides an immediate snapshot of the most critical alerts.
  • Intuitive Filtering: A dedicated Alert Filters panel makes it easier to narrow down alerts based on severity, name, source, and message.
  • Detailed Alert List: The Alert List offers a comprehensive view with sortable columns and expandable details for each alert.
  • Improved User Experience: Streamlined navigation and a clean layout ensure a more efficient workflow.
Figure 98. Alerts Dashboard


Navigation

Navigate to the Alerts page by selecting the notification icon in the navigation bar.

Figure 99. Notification Bell


DMF displays a summary of fabric alerts. Select View All to proceed to the Alerts page.

Figure 100. View All

The Alerts dashboard displays the current list of Alerts and Warnings.

Figure 101. Alerts Dashboard

Select View to display a specific alert.

Figure 102. View

Summary

The Summary section provides a high-level overview of the most frequent and impactful alerts.

Figure 103. Summary

The Summary section contains two key areas:

Top Alerts

Top Alerts displays the top 5 names of the current and most prevalent alerts and the count of active instances for each:

  • Total: The total number of active alerts for that specific alert name.
  • Error (Red Square): The count of alerts categorized as Error severity.
  • Warning (Yellow Triangle): The count of alerts categorized as Warning severity.
Note: Alert names are ranked by severity and then by count.

Top Alert Sources

Top Alert Sources highlights the top 5 sources (e.g., specific devices and policies) generating the most alerts. Similar to Top Alerts, it shows:

  • Total: The total number of alerts originating from that specific source.
  • Error (Red Square): The count of alerts categorized as Error severity from that source.
  • Warning (Yellow Triangle): The count of alerts categorized as Warning severity from that source.
Note: Alert names are ranked by severity and then by count. This summary allows for quick identification of areas of concern and prioritization of investigation.

Alert Filters

The Alert Filters section is a powerful tool for refining alert views. Combine multiple filters to pinpoint specific issues. When filters are applied, DMF updates both the Summary and Alert List sections.

  • Severity

    • Error: Displays only alerts categorized as errors.
    • Warning: Displays only alerts categorized as warnings.
      Figure 104. Severity
      Note: Select or deselect both Error and Warning to view all alerts.
  • Alert Name: Use the drop-down menu to select a specific or multiple alert names to filter the list.
    Figure 105. Alert Name
  • Source Type: Use the drop-down menu to select a specific type of source (e.g., switch, policy, etc.).
    Figure 106. Source Type
  • Source: If a Source Type is selected, the Source drop-down lists all the source names (e.g., switch names, policy names, etc.) used by the alert source as filters.
    Figure 107. Source
    Note: The Source drop-down is enabled only when selecting one Source Type.
  • Message: Enter keywords or phrases into the search text box to filter alerts based on their message content.
    Figure 108. Message

Reset Filters: In the Alert Filters section, select Reset Filters to clear all applied filters and view all alerts again.

Alert List

The Alert List section provides a comprehensive view of all active alerts based on the applied filters.

  • Columns: The list includes the following columns:
    • Name: The name of the alert.
    • Source: The origin of the alert (e.g., policy name, switch name, etc.).
    • Message: A brief description of the alert.
  • Sorting: Sort the list by Name or Source by selecting the respective column headers. An arrow indicates the current sort order (ascending or descending).
  • Expanding Alert Details: For some alerts, an expand icon appears next to the alert name. Selecting the icon displays additional details about the alert.
    Figure 109. LAG Member Missing


    Figure 110. Inactive Policy
  • Export: Select Export to download the current list of alerts to a file (CSV or JSON file), which can be useful for further analysis or record-keeping.


Important: New alerts have been introduced to enhance fabric health monitoring. DMF 8.8.0 now includes an Inactive Policy warning alert. This specific alert is not displayed when using the CLI show fabric warnings command.

Using the Command Line Interface

Before connecting to the DANZ Monitoring Fabric (DMF) Controller, ensure the DMF application is running. Log in to the DMF Controller using the local console or SSH to the address assigned to the DMF Controller during installation.
Note: Make all fabric switch configuration changes using the Controller CLI, which provides configuration options in the config-switch submode for each switch. Do not log in to the switch to make changes directly using the switch CLI.
Mode and sub-modes divide CLI commands, which restrict commands to the appropriate context. The main modes and their available commands are as follows:
  • login mode: commands available immediately after logging in, with the broadest possible context.
  • enable mode: commands that are available only after entering the enable command.
  • config mode: commands that significantly affect system configuration and can only be entered after entering the configure command. The user can also access submodes from this mode.

Enter submodes from config mode to provision specific monitoring fabric objects. For example, the switch switchname command changes the CLI prompt to (config-switch)# and lets the user configure the switch identified by the switch name.

When the user logs in via SSH to the Controller, the CLI appears in login mode, where the default prompt is the system name followed by a greater than sign (>), as shown below:
controller-1>
To change the CLI to enable mode, enter the enable command. The default prompt for enable mode is the system name followed by a pound sign (#), as shown below:
controller-1> enable
controller-1#
To change to config mode, enter the configure command. The default prompt for config mode is the system name followed by (config)#, as shown below:
controller-1> config
controller-1(config)#
To change to a submode, enter the command from config mode, followed by any object identifier required, as in the following example:
controller-1(config)# switch filter-switch-1
controller-1(config-switch)# interface ethernet54
controller-1(config-switch-if)#
To return to enable mode, type end, as shown below:
controller-1(config)# end
controller-1#
To view the path to the current CLI prompt, enter the show this command from any nested submode, as in the following example:
controller-1(config-switch-if)# show this
! switch
switch filter-switch-1
interface ethernet54
To view details about the configuration, enter the show this details command, as in the following example:
controller-1(config-switch-if)# show this details
! switch
switch filter-switch-1
!
interface ethernet54
no force-link-up
no optics-always-enabled
no shutdown
To view a list of available commands in the current or submode, enter the help command.
controller-1> help
For help on specific commands: help <command>
Commands:
%<n>                     Move job to foreground
debug
echo                     Print remaining arguments
enable                   Enter enable mode
exit                     Exit submode
help                     Show help
history                  Show commands recently executed
logout                   Logout
no                       Prefix existing commands to delete item
ping                     Send echo messages
ping6                    Send echo messages
profile                  Configure user profile
reauth                   Reauthenticate
set                      Manage CLI sessions settings
show
support                  Generate diagnostic data bundle for technical support
terminal                 Manage CLI sessions settings
topic                    Show documentation on topic
upload                   Upload diagnostic data bundle for technical support
watch                    Show output of other commands
whoami                   Identify the current authenticated account
workflow                 Show workflow documentation
controller-1>
To view detailed online help for the command, enter the help command followed by the command.
controller-1> help support
Support Command:         Generate diagnostic data bundle for technical support
Support Command Syntax:  no support skip-switches skip-cluster skip-service-nodes 
                         skip-recorder-nodes sequential support [[skip-switches]
                         [skip-cluster] [skip-service-nodes]
                         [skip-recorder-nodes] [sequential]]
Next Keyword Descriptions:
sequential:              Use sequential (non-parallel) fallback collection mode, which will be
                         slower but use fewer resources.
skip-cluster:            Skip cluster information from the collection.
skip-recorder-nodes:     Skip recorder nodes information from the collection.
skip-service-nodes:      Skip service nodes information from the collection.
skip-switches:           Skip switches information from the collection.
Support Command:         Generate diagnostic data bundle for technical support
Support Command Syntax:  no support skip-switches skip-cluster skip-service-nodes
                         skip-recorder-nodes sequential support [[skip-switches]
                         [skip-cluster] [skip-service-nodes] [skip-recorder-nodes] [sequential]]
Next Keyword Descriptions:
sequential:              Use sequential (non-parallel) fallback collection mode, which will be
                         slower but use fewer resources.
skip-cluster:            Skip cluster information from the collection.
skip-recorder-nodes:     Skip recorder nodes information from the collection.
skip-service-nodes:      Skip service nodes information from the collection.
skip-switches:           Skip switches information from the collection.
controller-1>
To display the options available for a command or keyword, enter the command or keyword followed by a question mark (?).
controller-1> support ?
<cr>
sequential               Use sequential (non-parallel) fallback collection mode, which will be
                         slower but use fewer resources.
skip-cluster             Skip cluster information from the collection.
skip-recorder-nodes      Skip recorder nodes information from the collection.
skip-service-nodes       Skip service nodes information from the collection.
skip-switches            Skip switches information from the collection.
controller-1>
To view any command's permitted values or keywords, enter the command followed by a space and press the <Tab> key. The command completion feature displays a concise list of permitted values, as in the following example:
controller-1> support <TAB>
<cr> sequential skip-cluster
skip-recorder-nodes skip-service-nodes skip-switches
controller-1>

For information about managing administrative access to the DMF Controller, refer to the DANZ Monitoring Fabric Deployment Guide.

*sFlow® is a registered trademark of Inmon Corp.
DANZ Monitoring Fabric
User Guide
Arista Networks

www.arista.com

DANZ Monitoring Fabric User Guide

Version 8.9

DOC-08673-01


Headquarters
5453 Great America Parkway
Santa Clara, CA 95054, USA
+1-408 547-5500
www.arista.com
Support
+1-408 547-5502
+1-866 476-0000
This email address is being protected from spambots. You need JavaScript enabled to view it.
Sales
+1-408 547-5501
+1-866 497-0000
This email address is being protected from spambots. You need JavaScript enabled to view it.
© Copyright 2026 Arista Networks, Inc. The information contained herein is subject to change without notice. Arista Networks and the Arista logo are trademarks of Arista Networks, Inc., in the United States and other countries. Other product or service names may be trademarks or service marks of others.