Visibility is a critical component to a more efficient cloud-like network. Being able to capture what a network is ‘thinking’ or ‘doing’ is the basis for true network automation and analytics. Legacy networking has long suffered from limitations in network visibility largely due to inefficient polling mechanisms that only provide a limited subset of data. As a result, the operators of legacy networks have been essentially blinded when it comes to true network insight.
Today’s cloud networks operate at a scale where visibility is even more important for efficient operations, and legacy visibility solutions do not meet the cloud requirements. In particular, today’s cloud networks require fine-grained visibility into:
- Network state in real-time
- Dynamic workloads in virtualized and containerized environments
- Advanced monitoring and instrumentation for troubleshooting
A true cloud networking operating system, Arista EOS® has been designed for advanced telemetry from the start. The key to Arista’s telemetry solution is the state-based software architecture of Arista EOS. From the beginning, Arista EOS platforms store all real-time state in one common database, SysDB, easily accessible through powerful APIs and SDKs. With the software infrastructure enhancements to NetDBTM, EOS-based devices are now able to stream every state change from every device into an aggregated network-wide view.
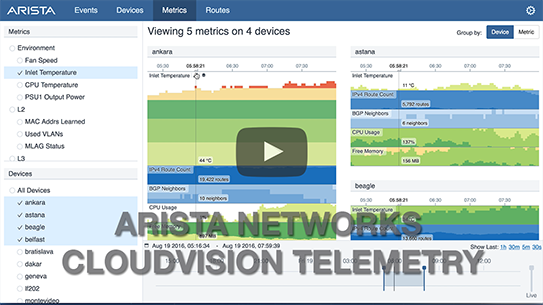
Featured Video: Arista Networks CloudVision Telemetry
With Arista DANZ, organizations that have requirements to perform critical analytical and monitoring functions with increasingly higher data volumes and higher network bandwidths can maintain security, compliance and reporting for all traffic without the addition of proprietary out-of-band monitoring infrastructure or backhaul networks.
- Meet security, compliance and reporting requirements even for high data traffic and network bandwidth environments
- Apply advanced filtering and precision time stamping at wire rate in hardware
- Integrate with any standard 3rd party API and Application/Network management tools
Real-time state streaming and analytics - Arista EOS and CloudVision bring a modern approach to network telemetry and a replacement for legacy polling mechanisms. CloudVision Analytics engines and CloudVision Telemetry Apps take full advantage of the state streaming infrastructure of EOS and NetDB to give Arista customers an unprecedented level of visibility into their network operations.
Telemetry Tracers - VMtracer, MapReduce tracer and Container tracer are a part of Arista's Telemetry solution that bring deeper workload-level visibility by integrating with distributed applications like big data, cloud, container and virtualized environments.
Advanced Monitoring - Arista’s EOS offers an advanced set of tools for proactive monitoring and instrumentation that provides insight into network hotspot detection using LANZ, programmable event triggers with Advanced Event Monitoring and the ability to capture, aggregate and replicate high volumes of traffic for processing using the integrated DANZ feature set.
Partner Eco-system - Arista’s Telemetry solutions are built on the extensible foundation of EOS and CloudVision, which offer a rich set of JSON and RESTful APIs for easy integration with third party systems. Solutions with VMware, Docker, Microsoft System Center, Openstack and SAP give customers the flexibility to choose from a best-of-breed ecosystem that integrates the state of the cloud network with Arista real-time telemetry.
In addition to cloud platform integrations above, Arista has a broad ecosystem of technology alliances in packet analysis, security and troubleshooting analytics, and network visibility.
Most provisioning and monitoring tools are reactive and fail to provide fine-grained visibility into network state. Utilizing the state-based architecture of Arista EOS®, NetDBTM state streaming provides a modern and granular approach for capturing the state of each network device into an aggregated network-wide view. With state streaming, every state change on the network is streamed instantaneously to a repository for analytics. Arista customers will have access to both real-time and historic telemetry views of the network in one place and at a level of granularity never before achievable.
Featured Video: Arista Networks EOS Evolution
For a greater impact on today’s cloud network, the CloudVision® platform includes CloudVision Analytics engines and CloudVision Telemetry Apps that take full advantage of the state streaming infrastructure of EOS and NetDB to give Arista customers improved visibility, faster problem isolation and correction, and greater visibility of network performance over time.
Open Framework
The state-streaming architecture is based on an open industry-standard framework for a variety of integration options. Customers have a choice with the ability to stream the EOS state to the Arista CloudVision platform, to a partner application, or directly to their own backend systems. This streaming architecture is the basis for the YANG-based OpenConfig data models, as well.
Partner Integrations
Arista's Network Telemetry application for Splunk combines multiple data sources from EOS into a centralized Splunk application with pre-built dashboards, views, searches and add-ons for visualizing this network telemetry data.
Know More: With Arista LANZ Track Real Time Congestion
- Know the answer to the question: Is the network slow?
- Track sources of congestion in real-time
- Integrate network performance into applications and middleware
Featured Video: Overview of LANZ
Arista Latency Analyzer or LANZ is a breakthrough technology from Arista that tracks sources of congestion and latency with real time reporting in microseconds. Historically if 'the network was slow' administrators would attach a probe/collector and hope the problem happened again. No longer. With LANZ you will know when prior congestion happened, track the sources of congestion, and be able to export real-time events to external applications like Solace Systems middleware. This enables the application layer to make intelligent traffic routing decisions with unprecedented visibility into the network.
A key application of integrated LANZ is for the financial services market where trading plant performance is key. With LANZ the network operations teams and administrators will have more visibility than ever before to know if 'microbursts' are really happening or not. With sub-millisecond reporting intervals, congestion can be detected and application-layer messages sent faster than some products can forward a packet.
Arista offers a new approach to TAP Aggregation that delivers security, availability and data analysis for high density, non-blocking 10/25/40/50/100GbE networks at any scale– all powered by Arista EOS® software to deliver an order of magnitude improvement in the economics of building cloud-scale visibility.
Next generation TAP Aggregation using Arista CloudVision® with Arista Data ANalyZer (DANZ) makes it possible to cost-effectively and losslessly monitor all datacenter network traffic, while capturing and analyzing only the traffic that is needed. DANZ is a precision visibility architecture that can scale to thousands of access points and hundreds of Terabits bandwidth.
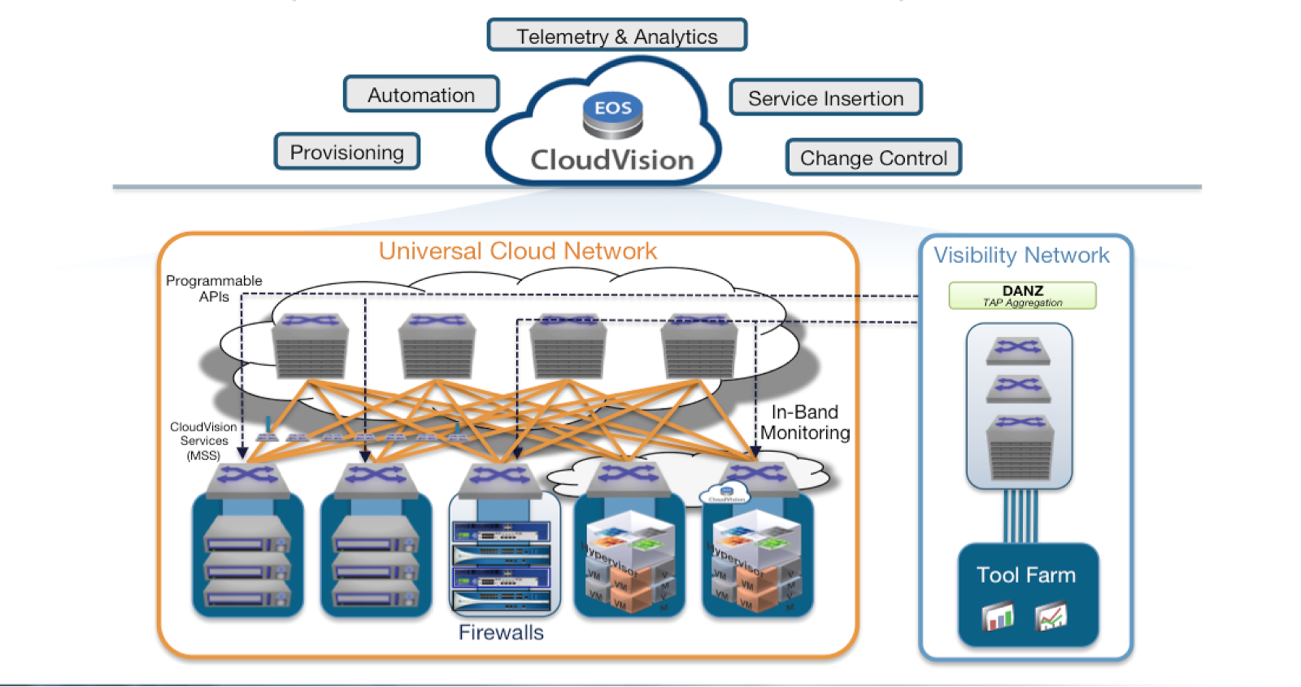
DANZ lowers CAPEX and OPEX versus traditional packet brokers or in-band monitoring approaches with its cloud-scale architecture, best-in-class business value and deep lossless visibility features. DANZ provides both an in-band and out-of-band telemetry and packet capture architecture, not available in lower scale, proprietary add-on visibility fabrics. With DANZ, customers can transform opaque datacenter traffic into comprehensive visibility for security threat detection and mitigation, application and network performance management, service availability monitoring, traffic recording and troubleshooting.
Arista TAP Aggregation capabilities deliver the ability to integrate visibility into current and future enterprise cloud, service provider and other large scale cloud environments with the same highly scalable platforms optimized as Arista’s Universal Leaf and Spine, including:
- High density, non-blocking, wire-speed 10/25/40/50/100GbE packet capture with advanced traffic management capabilities for lossless monitoring of network traffic
- Support for up to 432 ports of 100G and 1152 ports of 10/25G in a single non-blocking platform that simplifies deployment by providing higher density and capacity with fewer devices
- Programmability and automation for operations in a cloud environment that is all provided on Arista’s proven open switching platforms, including: 7280R-Series and 7500R-Series, without proprietary fabrics or inflexible designs
- Advanced network packet broker functionality delivered at wire-rate without the need for additional service-nodes or “smart” blades that create performance bottlenecks
- CloudVision as single point of control for provisioning, orchestration and real-time telemetry for both the TAP Aggregation network, as well as the general purpose datacenter network infrastructure
The DANZ solution delivers scalable end-to-end network and application visibility with exceptional flexibility and precision, while enabling existing third-party security and monitoring tools to integrate directly with captured data.
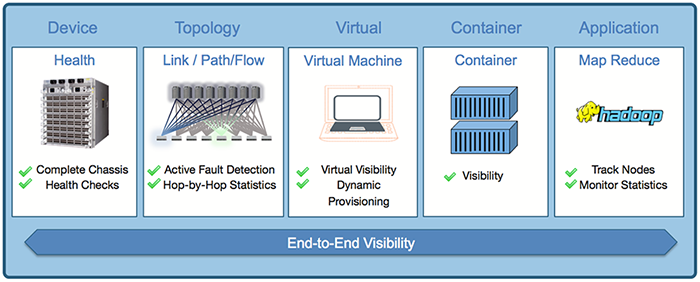
Network Tracers provide a linkage between the network infrastructure and cloud orchestration and virtualization environments.These powerful features, embedded in Arista EOS® software, bring deeper application level visibility by integrating with cloud applications like big data, cloud and virtualized environments.
Network Tracers for virtual to physical to application visibility are:
- VM Tracer: EOS VM Tracer allows the network engineer to have visibility into virtual infrastructure as well from the physical switch.
- Container Tracer: Container Tracer provides a network operator with visibility into container workloads running in the data center.
- MapReduce Tracer: EOS MapReduce Tracer tracks and interacts with Hadoop workloads directly connected to Arista switches in a cluster ensuring faster rebalancing and recovery in case of a node failure or congested link.
- Health Tracer: EOS Health Tracer enables infrastructure resiliency at the hardware and software layer to increase overall service availability across all EOS platforms.
- Path Tracer: EOS Path Tracer is a network monitoring and analysis tool that monitors all paths in the active-active Layer 2 and ECMP networks.
Literature - Network Tracers
LANZ - Literature
DANZ - Literature
- .TAP Aggregation Product Brief
- .Precision Data Analysis with DANZ - White Paper
- .Security for the Cloud Data Center
- .Leveraging EOS and sFlow for Advanced Network Visibility White Paper
- .Cloudifying Data Center Monitoring White Paper
DANZ - Learning Center
Network Telemetry - Media
- .Arista And The Telemetry Framework
- .SAP Endorses Arista CloudVision Telemetry
- .Veriflow Endorses Arista CloudVision Telemetry
Network Tracers - Media