
Monitoring Fabric and Production Networks
This chapter describes viewing information about the DANZ Monitoring Fabric (DMF) and connected production networks.
DMF Fabric Topology
DMF introduces a completely redesigned Fabric Topology dashboard. This modernization effort improves visual clarity for data displays and the topology graph, providing an interactive fabric representation for a better understanding of device connectivity.
Key Enhancements
- Topology Graph: Refined layout and updated node iconography provide a more intuitive view of the fabric architecture.
- Visual Status: Clearer indicators facilitate rapid identification of health and connectivity issues across the fabric.
- Interactive Side Panel: A new integrated side panel provides essential details for any selected device or edge, reducing the need to navigate away from the primary topology view.
The Fabric Topology dashboard provides an interactive, visual representation of the DMF network infrastructure. The dashboard displays all network devices, roles, connections, and real-time status within a graphical interface. This visualization facilitates understanding of the network layout, monitoring of device health, troubleshooting of connectivity issues, and analysis of traffic flows.
Navigate to .
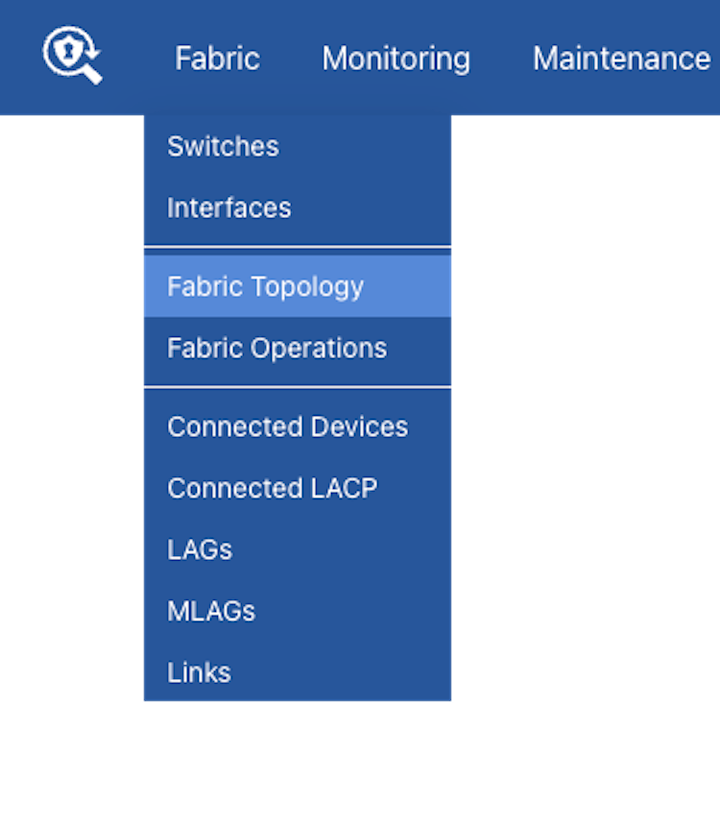
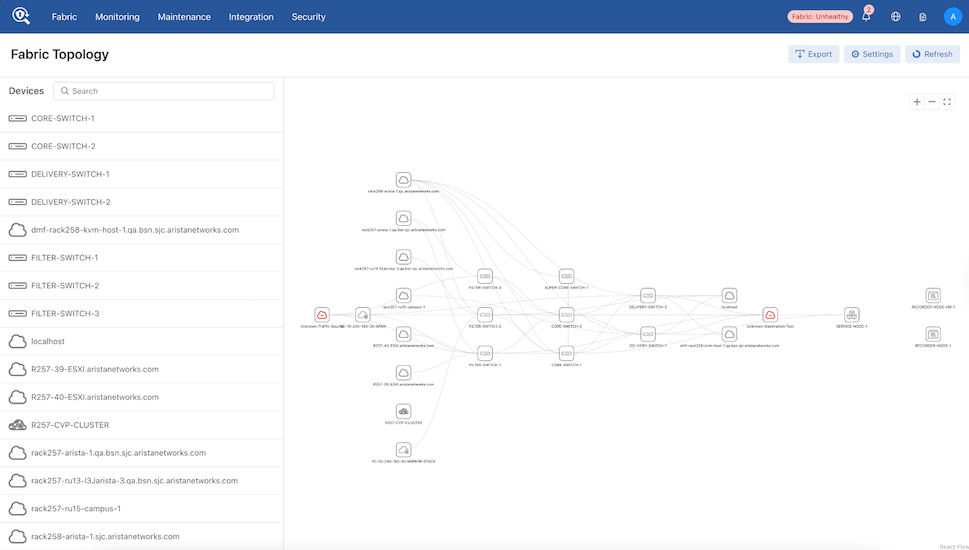
The Fabric Topology dashboard appears with a list of devices and a topology visualization (graph) of those devices.
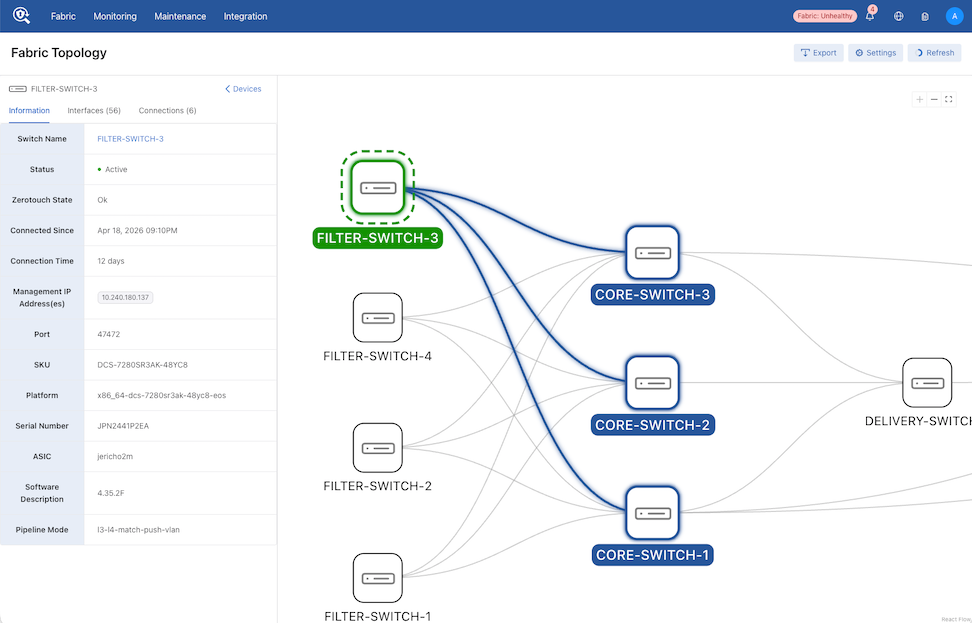
Selecting a device within the topology updates the Fabric Topology legend with the specific details about the device.
Topology Graph
Graph Layout
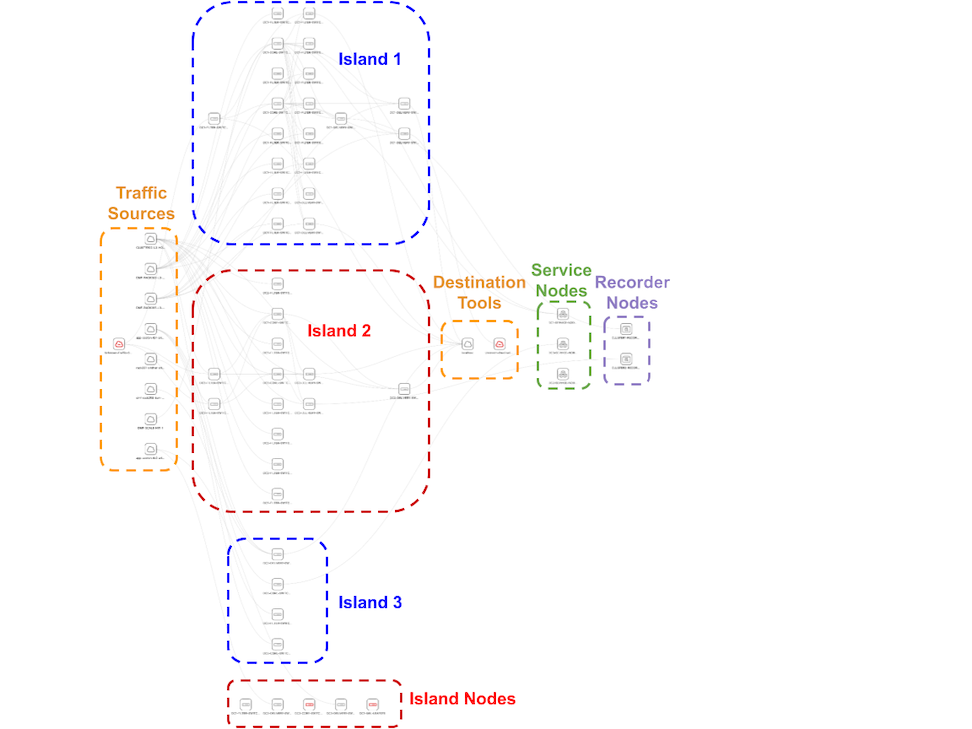
The topology graph organizes nodes into columns and groups based on node type. Horizontal positioning represents packet flow from left to right. The following sequence defines the left-to-right order of node groups in the graph:
- Unknown Traffic Source Node
- Traffic Sources
- Connected Devices (linked to DMF-configured filter interfaces)
- vCenters
- CloudVision Portals
- Override Filter Connections
- Filter Switches
- Core Switches
- Delivery Switches
- Destination Tools
- Connected Devices (linked to DMF-configured delivery interfaces)
- Override Delivery Connections
- Service Nodes
- Recorder Nodes
Switch Role Classification
The assigned role of a switch determines its position within the topology graph. Role calculation relies on the types and quantities of configured DMF interfaces. These roles dictate horizontal placement: filter switches occupy the left near traffic sources, delivery switches occupy the right near destination tools, and core switches sit in between.
Primary classification derives from the relative count of DMF interface roles when a switch maintains multiple roles simultaneously.
Categorization follows this logic:
- Filter Switches: Switches where the count of filter interfaces exceeds the count of delivery interfaces.
- Delivery Switches: Switches where the count of delivery interfaces exceeds the count of filter interfaces.
- Core Switches: Switches with an equal number of filter and delivery interfaces, or those with no filter or delivery interfaces configured.
Node Legend
| Icon | Type | Visibility | Data Source |
|---|---|---|---|
 |
Switch | Always | Switch / Switch Configs |
 |
Service Node | Always | Service Node Devices |
 |
Recorder Node | Always | Recorder Node Devices |
 |
Connected Device | Show Connected Devices = ON | Connected Devices |
 |
CloudVision Portal | Show Connected Devices = ON | CloudVision Portal Integrations |
 |
vCenter | Show Connected Devices = ON | vCenter Integrations |
 |
Override Node | Show Connected Devices = ON | User Configured Setting |
 |
Unknown Node | Show Unknown Nodes = ON | DMF Interfaces |
Multi Island Configurations
DMF supports monitoring multiple independent switch islands from a single Controller. The topology graph automatically detects and visualizes these islands based on physical link connectivity. An island is defined as a group of switches connected by links; if a switch has no links to any switch in an existing island, it forms a separate island. Switches without connections to other switches appear as single-node islands and occupy a row at the bottom of the graph.
When detecting multiple islands, the topology utilizes vertical stacking to organize the view. Switch islands arrange vertically from top to bottom, while non-switch nodes (traffic sources, destination tools, service nodes, and recorder nodes) remain vertically centered relative to the stacked islands. This layout provides visual separation between independent switch deployments, facilitating the navigation of complex multi-island environments.
Status Indicators
The topology utilizes visual status indicators to provide immediate feedback on device health. A red (red) icon signifies a device in an error state, facilitating rapid diagnosis of the fabric. Consequently, links associated with an error-state device feature a red connection icon.
- Unknown Nodes: These nodes always appear in red.
- Override Nodes: Manually configured override nodes do not include status indicators, as the DMF Controller does not track these elements.
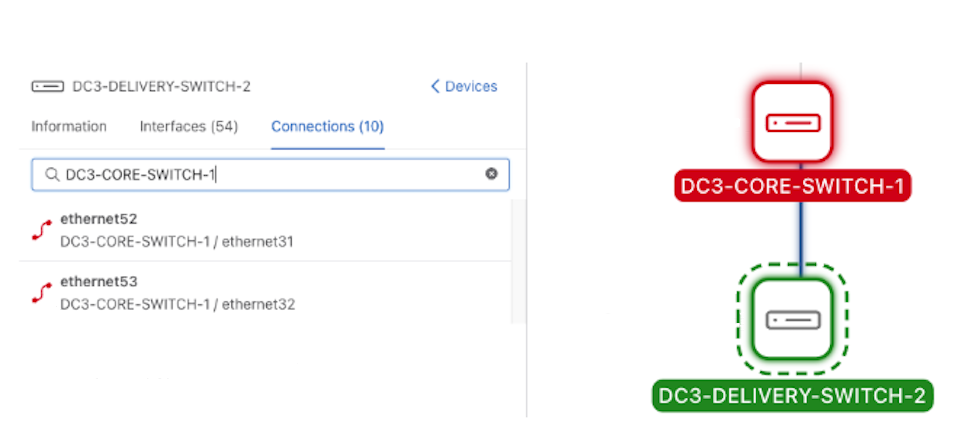
Down connections display in red in the Connections panel, and switches in a down state display in red in the topology graph. A selected switch displays with a dashed line around its icon.
Graph Controls
| Action | Mouse | Keyboard/UI |
|---|---|---|
| Pan | Click + Drag | – |
| Zoom In/Out | Scroll Wheel | Zoom Buttons |
| Fit to View | – | Fit View Button |
| Select Node | Click Node | Select Device in the Devices Panel |
| Select Edge | Click Edge | – |
| Deselect | Click Background | Select Back to Devices. |
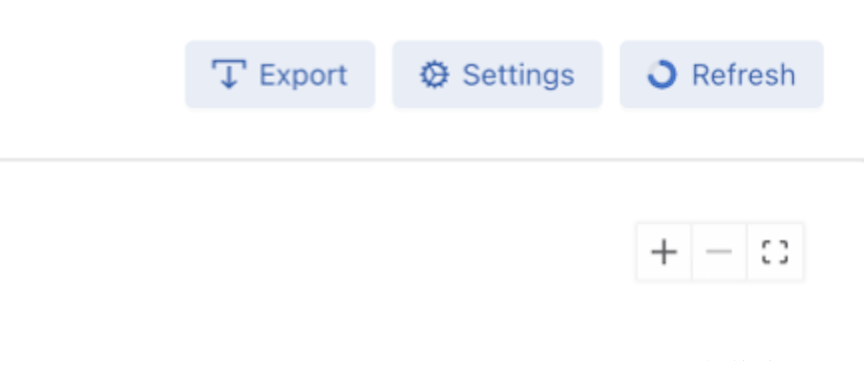
Use the plus, minus, and fit view icons to zoom in, zoom out, or return the topology graph to the default view.
Unknown Nodes
Unknown nodes represent DMF-configured filter or delivery interfaces not connected to an identified device. These nodes indicate incomplete fabric discovery where the DMF Controller lacks information regarding the connected device.
Visual Representation and Identification
- Iconography: Unknown nodes appear as a red cloud icon containing a minus sign.
- Labeling: The interface type dictates the label, appearing as either Unknown Traffic Source (filter interfaces) or Unknown Destination Tool (delivery interfaces).
Purpose and Resolution
These indicators assist in identifying gaps within the fabric configuration. Resolution of unknown nodes occurs through:
- Automated Discovery: Ensuring proper device discovery via LLDP or CDP.
- Manual Mapping: Utilizing the Override Unknown Connections feature to map connections manually.
Unknown Connection Override Nodes
When the DMF Controller cannot automatically detect connected devices due to unmanaged hardware or missing discovery protocol data (CDP/LLDP), Override Nodes allow for the manual completion of the fabric topology. Creating an override connection maps a specific filter or delivery interface to a custom device name. This action replaces the generic Unknown node connection in the visualization with a connection to a labeled node, ensuring full documentation of the monitoring infrastructure.
Key Features
- Shared Mapping: Multiple interfaces can map to a single override node. This facilitates the representation of external tools that send or receive traffic through multiple fabric ports.
- Categorization: Filter overrides reside within the Traffic Sources group, while delivery overrides reside within the Destination Tools group. The system creates distinct nodes if the same name applies to both roles.
- Persistence: Configurations save to local storage to ensure they persist between sessions on the same device. These settings do not synchronize across different devices.
Side Panel
The topology includes a redesigned side panel that displays data in a concise, readable format. This panel facilitates searching for and selecting devices within the graph.
Functional Details
- Contextual Information: The displayed information varies based on the selected node type. All node panels provide basic details, such as device connections.
- Streamlined Design: The panel focuses on essential device information to maintain a clean interface.
- Navigation: Node panels contain direct links to dedicated pages for comprehensive data viewing or device configuration.
Devices Panel
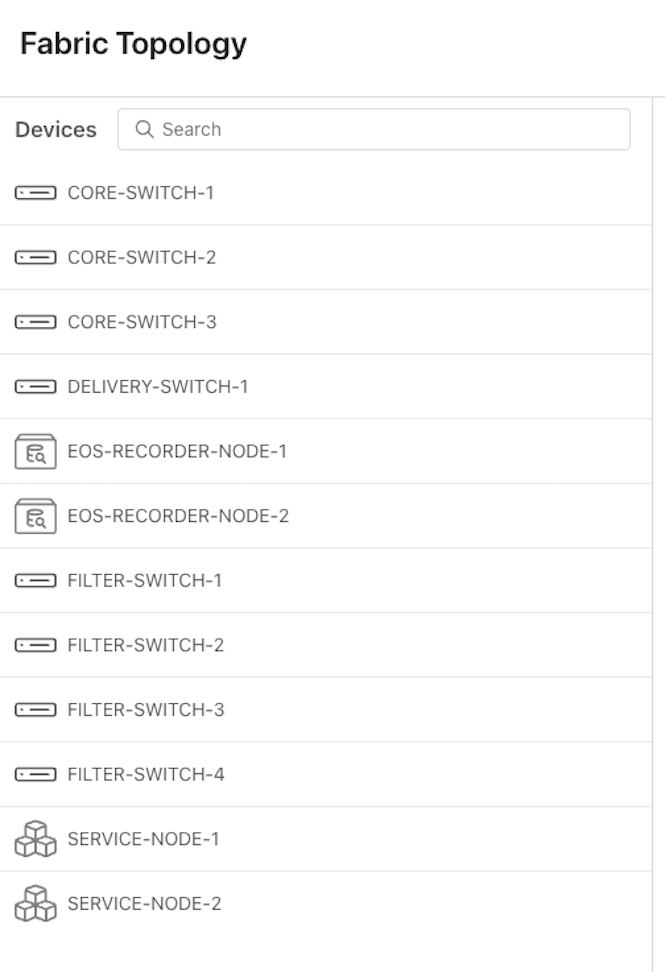
The Devices Panel appears upon the initial loading of the topology page or when no specific element is selected in the graph. This panel provides a comprehensive list of all visible devices, accompanied by their respective icons.
Key Features
- Visibility: The list only includes nodes currently visible on the graph.
- Search Functionality: A search bar facilitates filtering the device list for rapid identification.
- Selection: Selecting a device from the list highlights the corresponding node within the topology graph.
Node Panel
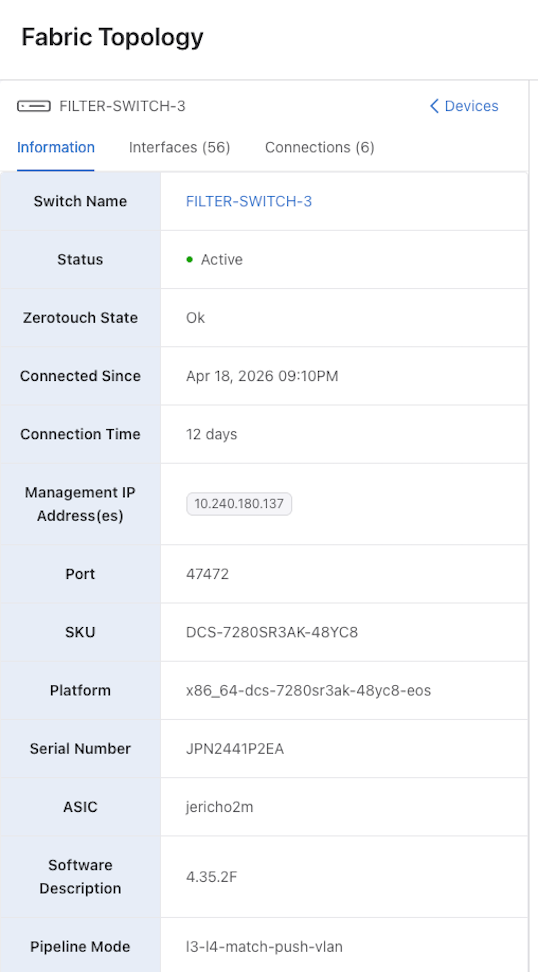
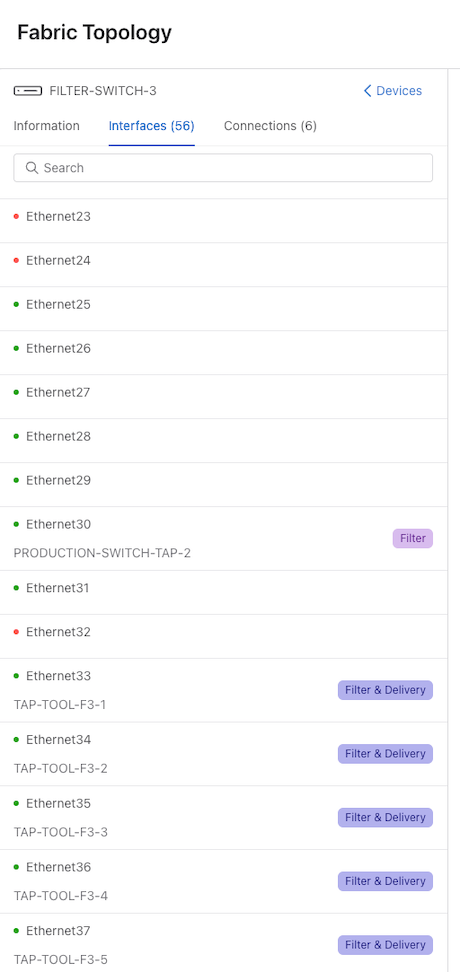
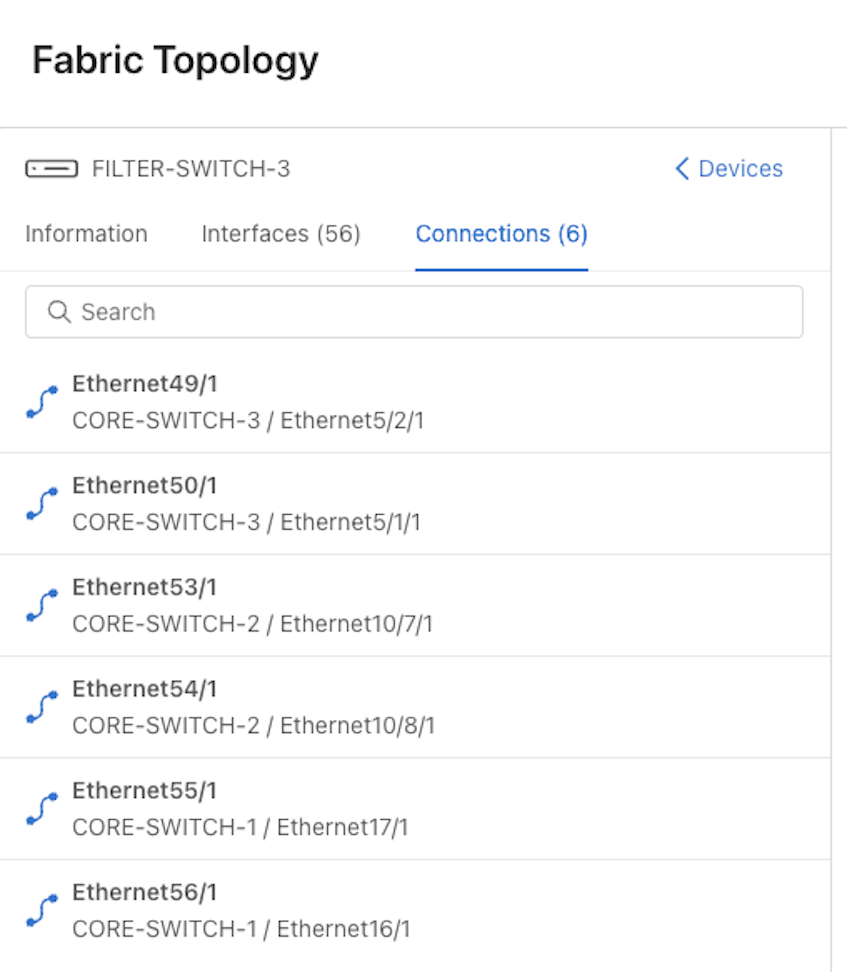
The following details the side panel displayed upon selecting a Switch node. The interface organizes data into three distinct tabs: Information, Interfaces, and Connections.
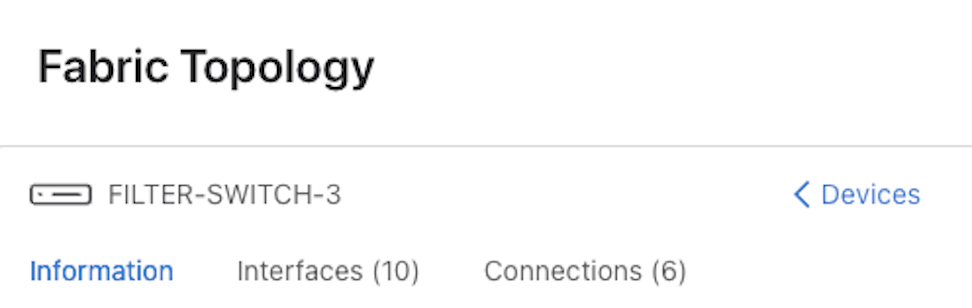
Information Tab
The Information tab provides a high-level overview of the switch identity and its specific DMF configuration. Every node type includes this tab to maintain consistent identification across the fabric.
Interfaces Tab
The Interfaces tab displays a comprehensive list of physical ports belonging to the switch. This view includes the associated DMF configuration for each port.
Connections Tab
The Connections tab details the links for the selected node. This tab maps local interfaces and ports to the corresponding device names and ports on the opposing end of each link. This tab remains a standard feature for all node types.
Edge Panel
Selecting an edge within the graph opens the Edge Panel. This panel identifies the two connected nodes, displays their icons, and lists the specific connections represented by the edge.
Edge Representation
The topology graph renders a single edge for each pair of devices. If multiple links exist between two devices (e.g., Switch A and Switch B), the graph displays one edge. The Edge Panel provides a comprehensive list of all individual connections for that specific device pair.
Select an edge (connection) within the topology graph.
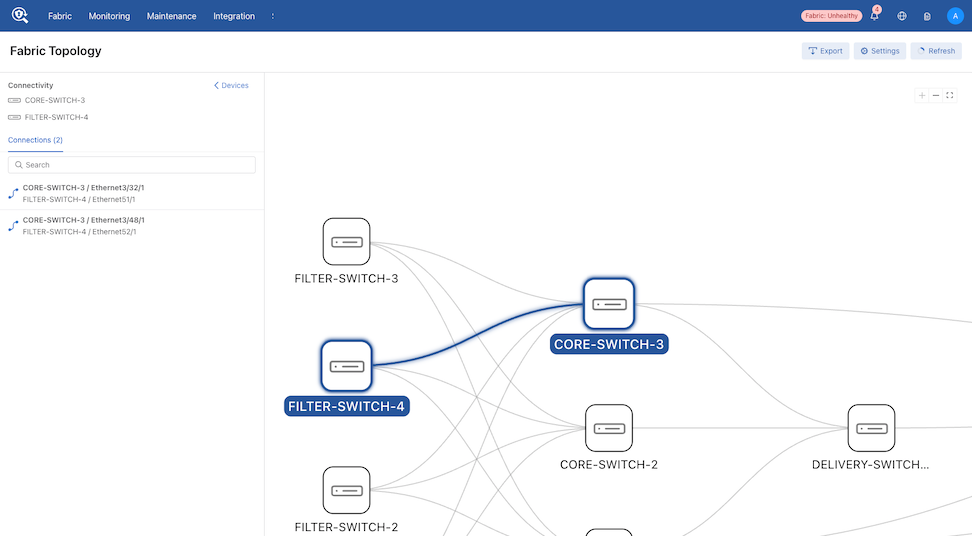
DMF displays a Connectivity panel.
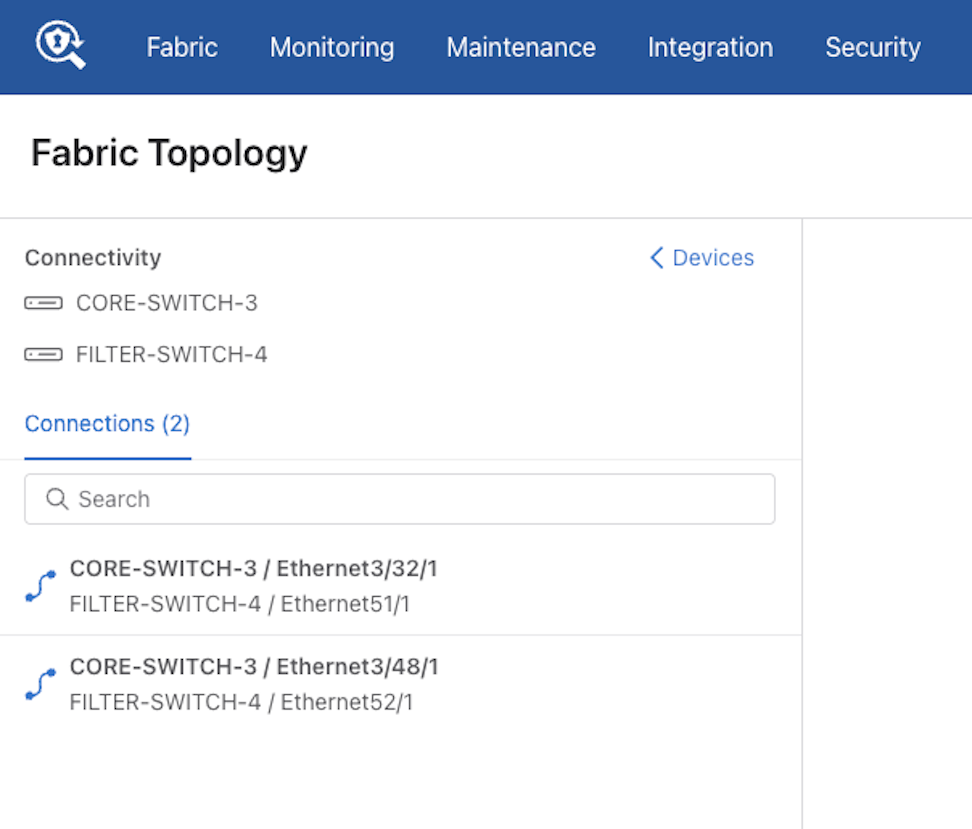
The Connectivity panel displays the connections between devices. The bolded entry indicates the Source Node and Port, while the entry underneath indicates the Destination Node and Port.
Select Devices to clear the currently displayed devices.
Exporting the Topology
The DMF Fabric Topology graph includes export functionality to facilitate the sharing of fabric layouts for documentation and collaboration.
Export Formats
The system supports two file formats for exporting the topology:
- Portable Network Graphics (PNG): A raster-based format suitable for general documentation.
- Scalable Vector Graphics (SVG): A vector-based format that maintains clarity at any scale.
PNG Resolution Options
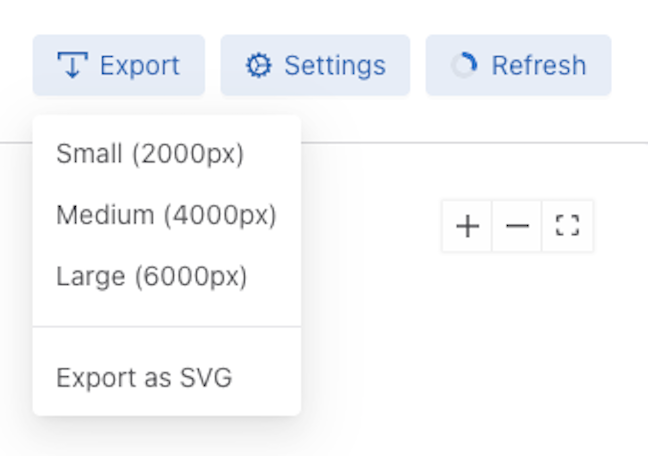
To ensure high-quality output for various use cases, the system supports three high-resolution export sizes for PNG files:
- 2000 x 2000 pixels
- 4000 x 4000 pixels
- 6000 x 6000 pixels
Select Export followed by the desired size or the SVG format.
Settings
Fabric Topology derives its graph structure from various DMF data and configurations. To customize the visualization, the interface provides specific settings within the topology page.
Data Persistence
For the initial release, the system saves these settings locally to the hardware in use. Consequently, preferences do not synchronize across different devices or browsers.
Accessing the Topology Page Settings
Select Settings.
Choose the desired topology settings:
- Show Connected Devices
- Show Full Node Labels
- Show Unknown Devices
- Override Unknown Connections
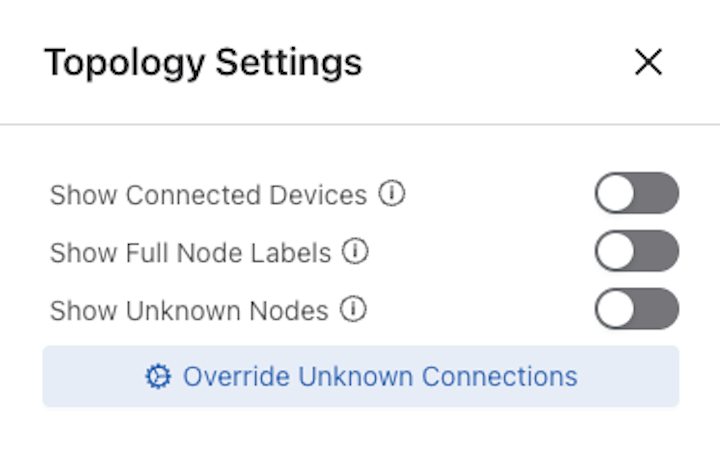
The topology map updates immediately after making a selection.
Settings Drawer Overview
| Setting | Type | Default | Impact |
|---|---|---|---|
| Show Connected Devices | Toggle | Off | Controls visibility of Connected Device, vCenter, CloudVision Portal, and Override nodes in the topology graph. Toggling off these nodes can help reduce visual clutter. |
| Show Full Node Labels | Toggle | Off | Controls whether node names are truncated or displayed in full. Toggling off can improve clarity when nodes have long labels. |
| Show Unknown Nodes | Toggle | Off | Controls visibility of Unknown nodes, if present. Toggling off unknown nodes can help reduce visual clutter. |
| Unknown Connection Overrides | Form | Empty | The Unknown Connection Override configuration window enables the manual definition of connections that the DMF Controller cannot automatically detect. By configuring these overrides, specific nodes and edges are inserted into the topology graph to represent known external devices. This process results in a more comprehensive and detailed visualization of the fabric. |
Unknown Connection Override Configuration
The Unknown Connection Override panel allows for the manual bridging of gaps in the topology by redefining connections for DMF interfaces.
Configuration Process
- Identify Interfaces: Locate a DMF interface currently linked to an Unknown node. These links typically result from a lack of discovered device data (missing CDP/LLDP).
- Apply Override: Reassign the interface from the Unknown node to a newly created node identified by a specified device name.
-
Use +Add in either section to create multiple Filter Connections Overrides or Delivery Connection Overrides.
-
After configuring the Filter Connections Overrides or Delivery Connection Overrides, select Submit to commit the changes or Cancel to discard any changes.
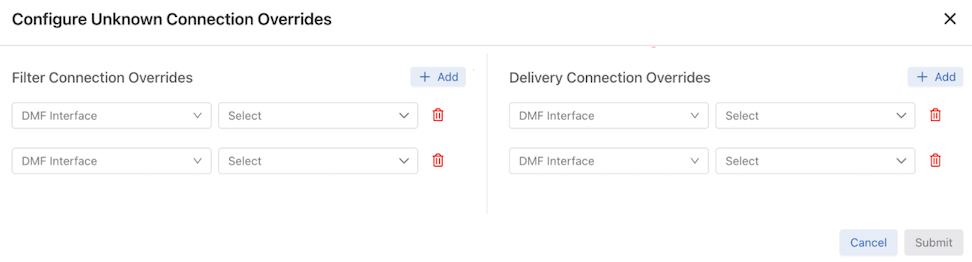
Graph Cleanup: After all interfaces associated with an Unknown node are successfully overridden, the system automatically removes the Unknown node from the topology graph as it no longer contains active connections.
Troubleshooting
Enabling the New Topology Page
The enhanced Topology page is enabled by default. If the page is missing from the interface, verify the Fabric Topology configuration in Settings.
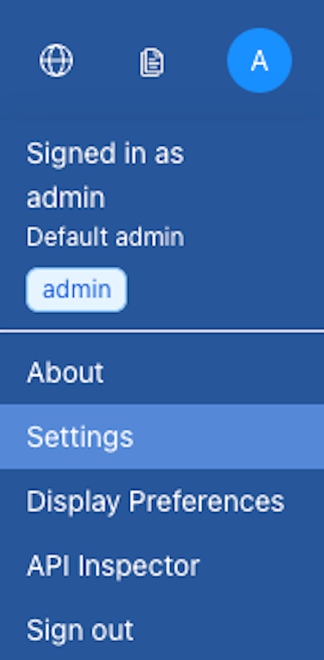
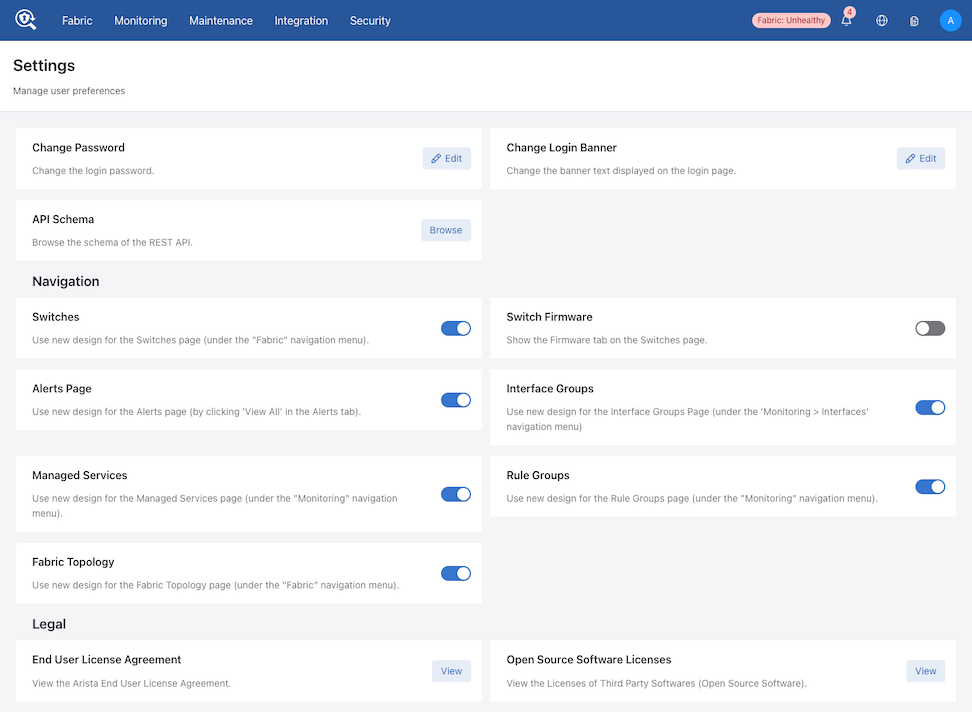
Enable the toggle switch.
| Issue | Potential Cause | Resolution |
|---|---|---|
| Connected Devices, vCenter, CVP, or Override Nodes are missing. | The Show Connected Devices toggle is disabled. | Open the Topology Settings drawer and enable the Show Connected Devices toggle. |
| Unknown nodes do not appear in the graph. | All filter and delivery interfaces have identified connections or overrides. | Unknown nodes only appear when a configured interface lacks a discovered device. If all interfaces are accounted for, these nodes remain hidden regardless of settings. |
| Unknown nodes are missing despite unidentified interfaces. | The Show Unknown Nodes toggle is disabled. | Ensure the Show Unknown Nodes setting is toggled on in the topology settings. |
| Interfaces appear as Unknown, but the physical connection is known. | The DMF Controller lacks discovery data (LLDP/CDP) for the peer device. |
Use the Unknown Interface Connection Override feature in the topology settings to manually map the interface. Important: These nodes only appear if Show Connected Devices is also enabled.
|
Technical Notes on Unknown Nodes
An Unknown node automatically disappears from the graph once all associated interfaces are successfully overridden. If no active connections point to an unknown node, the graph does not render it.
Limitations
While the Fabric Topology provides a comprehensive view of the network, certain functionalities and components remain restricted in the current release.
Policy Path Visualization
The policy path overlay feature is not available in this release. To visualize specific policy traffic paths, navigate to the Settings menu and utilize the toggle to switch to the legacy topology page.
Unsupported Elements
The topology graph does not currently display the following components:
- Infrastructure Nodes: Nutanix nodes, NSX nodes, and Analytics nodes.
- Logical Interfaces: Link Aggregation Groups (LAGs) and tunnel interfaces.
Support for these elements is planned for future software releases.
Fabric Operations
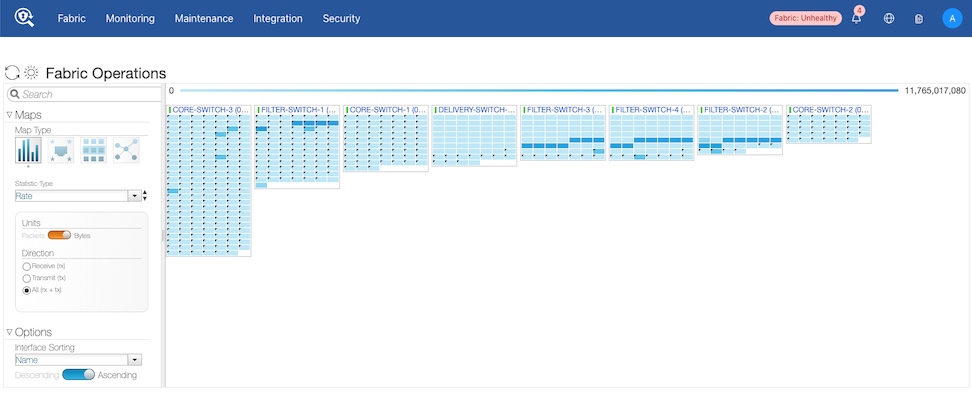
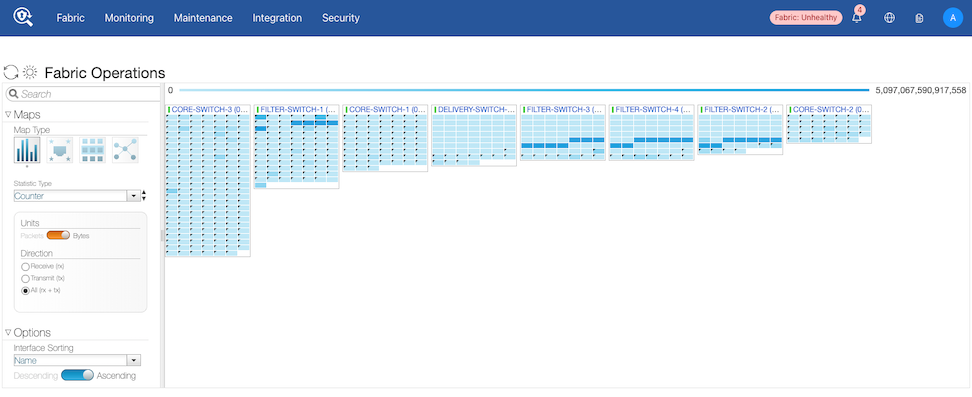
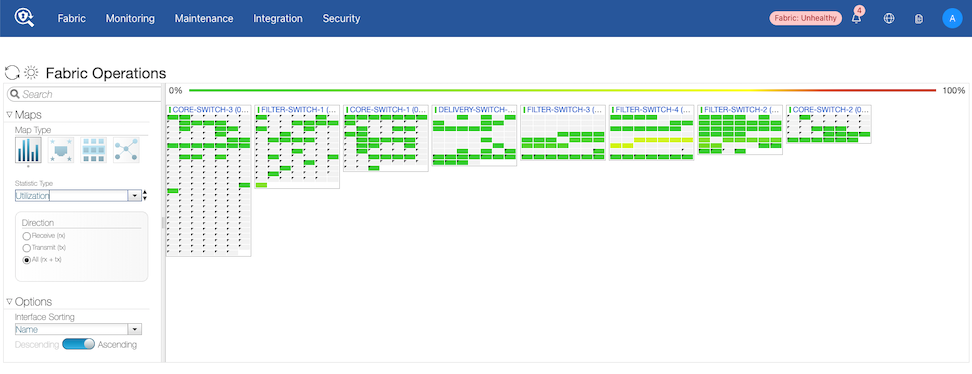
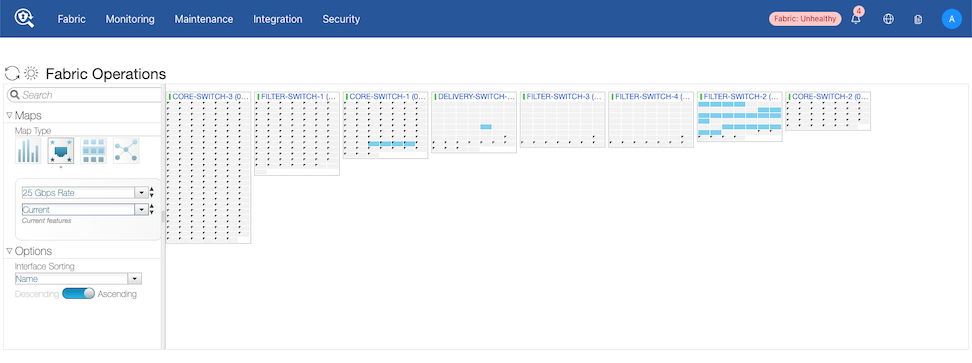
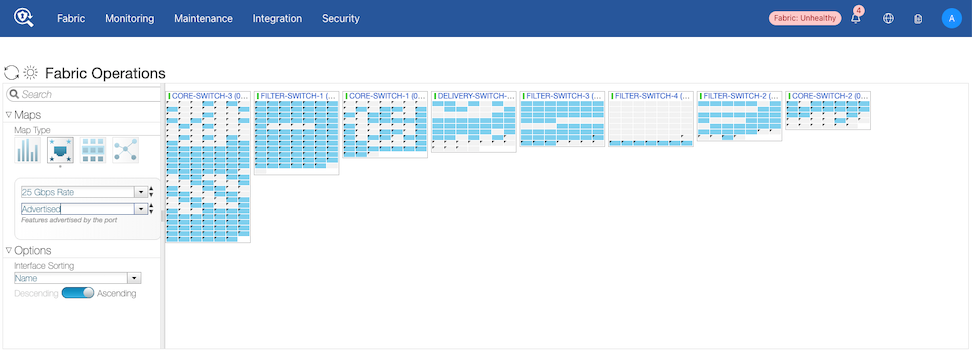
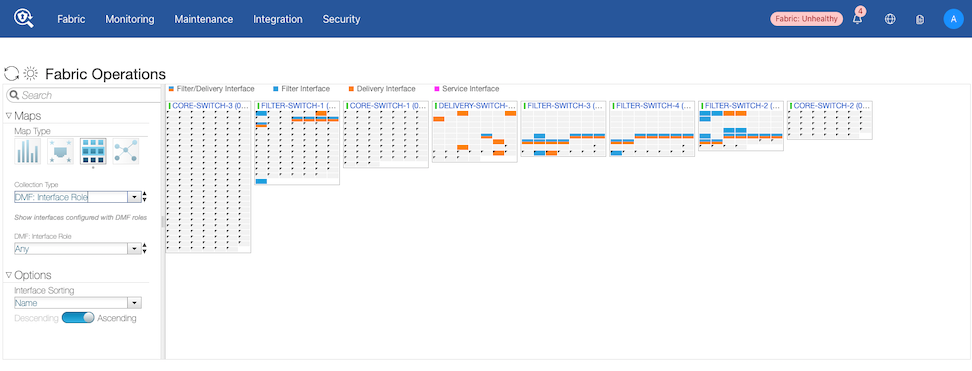
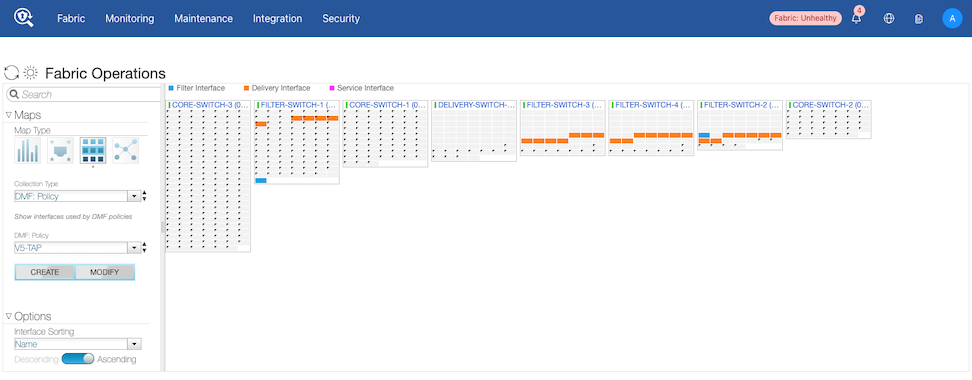
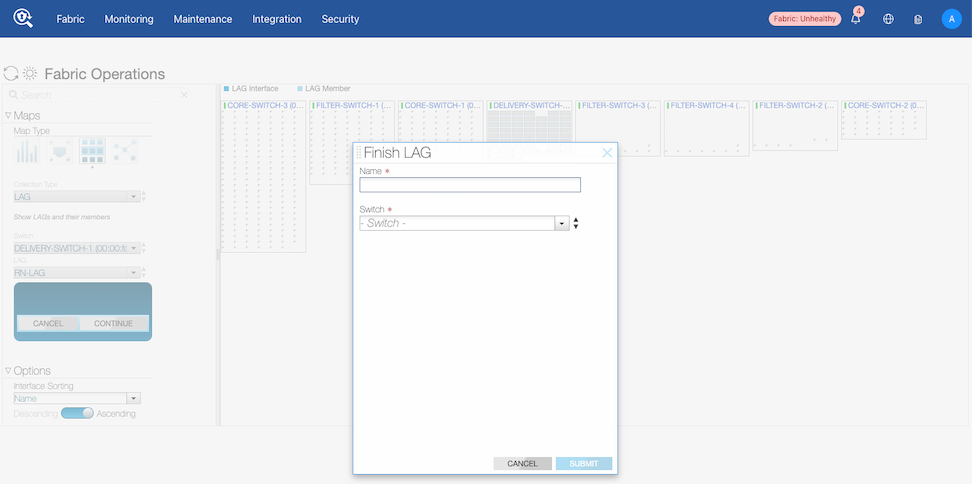
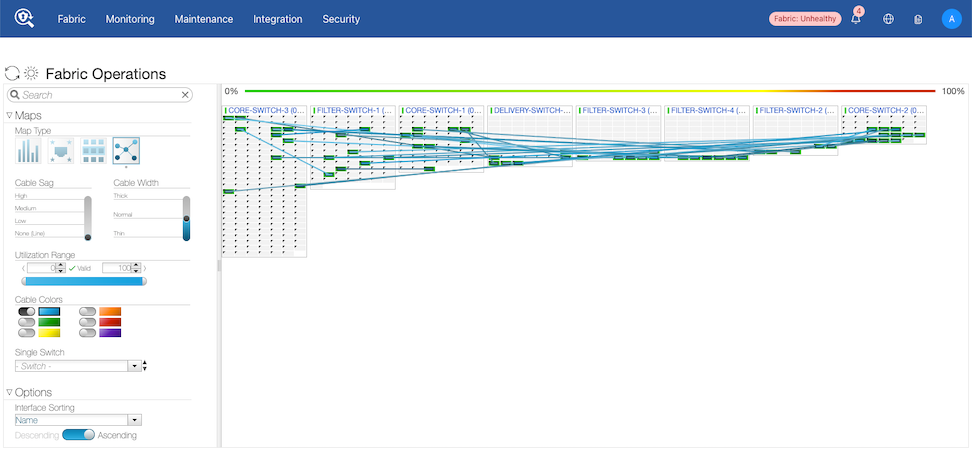
Fabric Operations provides a dynamic, visual interface for monitoring and managing network topology. Highly customizable Map Types provide visual methods to analyze port statistics, inspect device capabilities, manage interface relationships, and visualize physical and logical connections across all configured devices.
Depending on the selected Map Type, the interface provides specific UI controls to filter and refine displayed data:
-
Port Stats: Monitor network traffic by filtering statistic types (Rate, Counter, or Utilization). Refine views further by selecting specific units (Packets or Bytes) and traffic directions (Receive, Transmit, or All).
-
Port Features: Inspect physical and logical connection attributes. Displayed details include media types (Copper, Fiber), cable support, auto-negotiation settings, and connection rates (Current, Supported, and Advertised).
-
Interface Relationships: Map and manage complex network structures. View and Create/Modify relationships based on collection types, including Link Aggregation Groups (LAGs), Switches, DMF Services, and DMF Policies. Display specific interface roles (e.g., Filter, Delivery, or Service).
-
View Links: Customize the visual representation of network connections. Adjust cable sag and width, toggle cable colors based on selectable utilization ranges, or isolate the view to a single switch.
Display and Customization Controls
To ensure data is easy to read and navigate, the Fabric Operations UI includes global display options:
-
Interface Sorting: Under the Options menu, sort map information by Interface Name or Port Number in ascending or descending order.
-
Display Theme: Toggle the Moon/Sun icon to switch the interface between Light and Dark modes.
-
Refresh Data: Use the Refresh icon (circular arrows) to update the map with the latest list of connected devices and statistics.
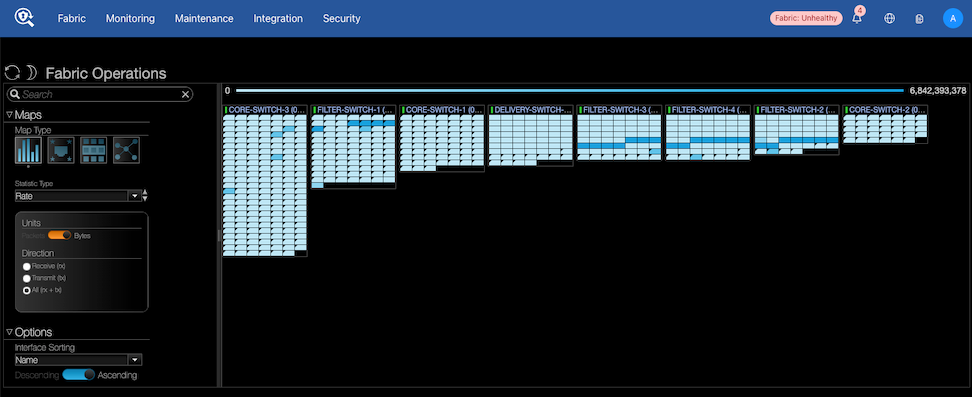
Examples of the various Map Types follow:
Monitor DMF Interfaces
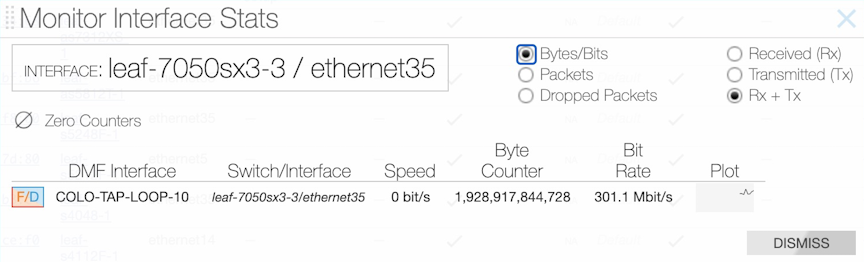
This window displays statistics for up to four selected interfaces and provides a line graph (sparkline) that indicates changes in packet rate or bandwidth utilization. The auto-refresh rate for these statistics is ten seconds—mouse over the sparkline to view the range of values represented. To clear statistics for an interface, select the Menu control and select Clear Stats.

To view the interfaces assigned a specific role, use the command and select the Filter, Delivery, or Service sub-option from the menu.
Viewing Oversubscription Statistics
To view peak bit rate statistics used to monitor bandwidth utilization due to oversubscription, select the Menu in the Interfaces table, select Show/Hide Columns, and enable the Peak Bit Rate checkbox on the dialog box that appears.
After enabling the Peak Bit Rate column, a column appears in the Interfaces table that indicates the relative bandwidth utilization of each interface. When using less than 50% of the bandwidth, the bar appears in green; 50-75% changes the bar to yellow, and over 75% switches the bar color to red.
To display statistics for a specific interface, select Monitor Stats from the Menu control to the left of the row.
To reset the statistics counters, select Clear Stats from the Menu control.
View Fabric-Connected Devices
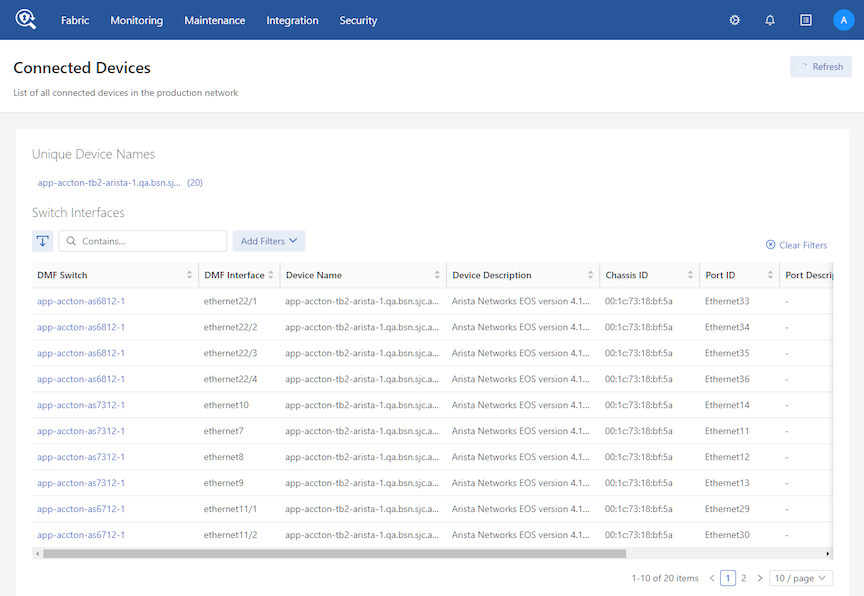
The Switch Interfaces table displays the unique devices connected to each out-of-band filter or delivery switch.It lists each interface's MAC address (Chassis ID) on every device connected to the fabric as a separate device.
The Unique Device Names table lists all unique device names with a count of interfaces in parentheses. Selecting a link in a row in this list filters the contents of the Switch Interfaces table.
To view a display of the devices discovered by the Controller through the Link Aggregation Control Protocol (LACP), select from the main menu.
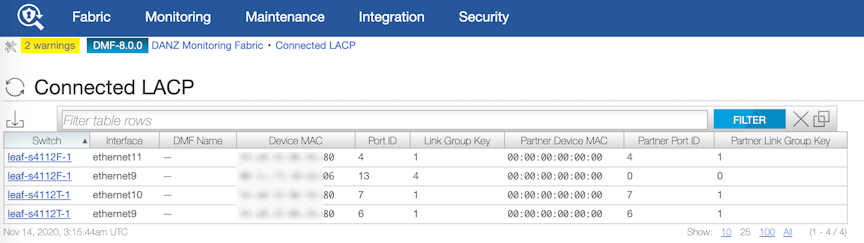
This page displays the devices discovered by the Controller through LACP.
Capacity Planning - Current versus Verified Scale
Before DMF release 8.9, the DMF fabric lacked direct visibility into current scale metrics relative to verified scale limits. This feature exposes real-time scale data against verified benchmarks via REST APIs, GUI, and CLI commands. The verified scale represents the capacity tested under reference conditions. The feature is compatible with all platforms and no new configuration is necessary; the feature uses existing settings to provide immediate visibility into the scale.
Navigate to Monitoring and select Fabric Scale.
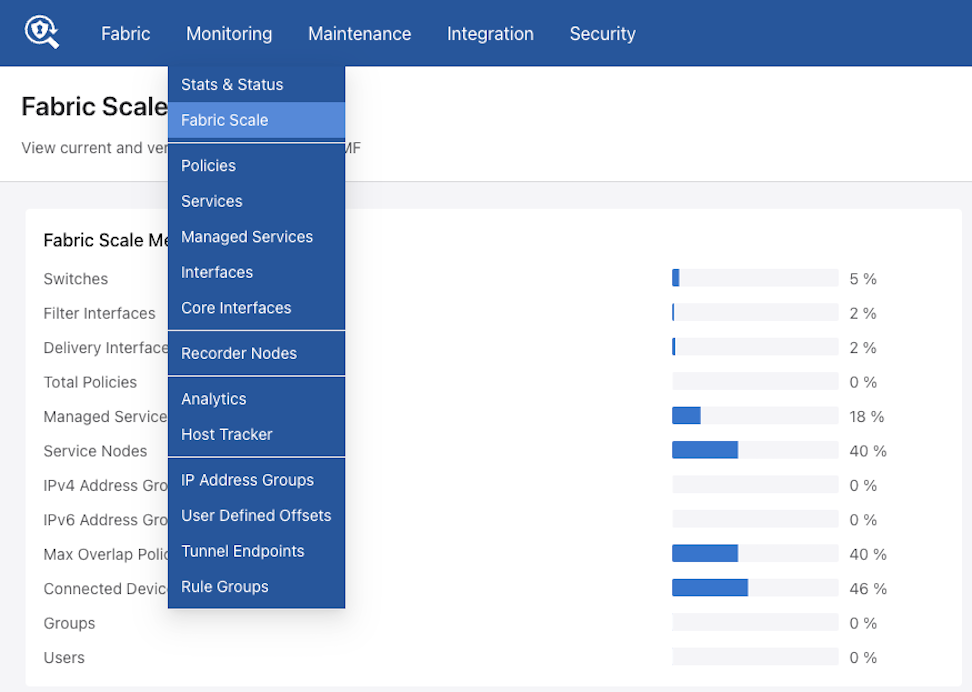
The Fabric Scale dashboard contains two main sections, Fabric Scale Metrics and Category Scale Metrics.
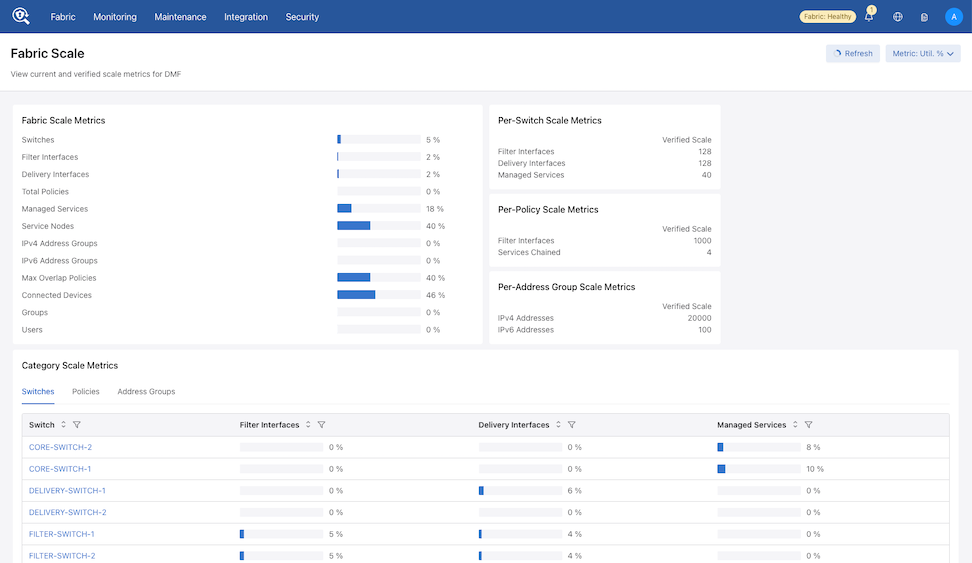
Fabric Scale Metrics
The first section provides a high-level overview of Fabric Scale Metrics.
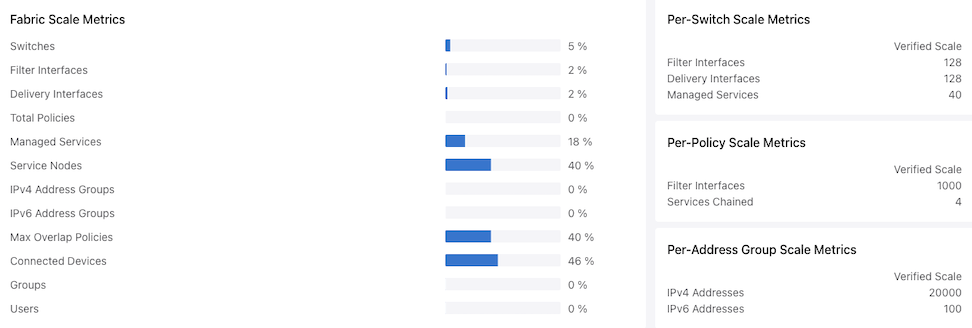
All fabric-level scale metrics are displayed visually and compared against verified limits, with meter-range indicators highlighting utilization levels. Each meter represents the relationship between the current usage and the verified supported limit.
Hovering over a meter displays an information card showing the calculated values for:
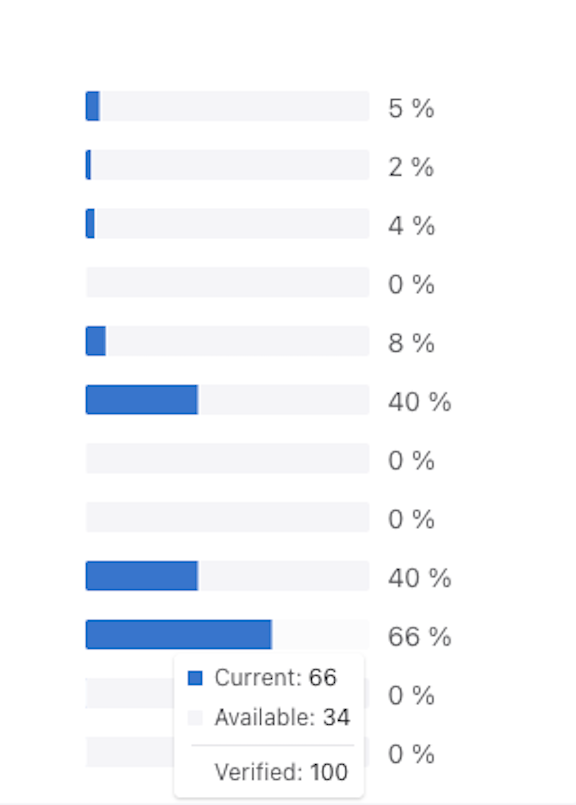
- Current
- Available
- Verified
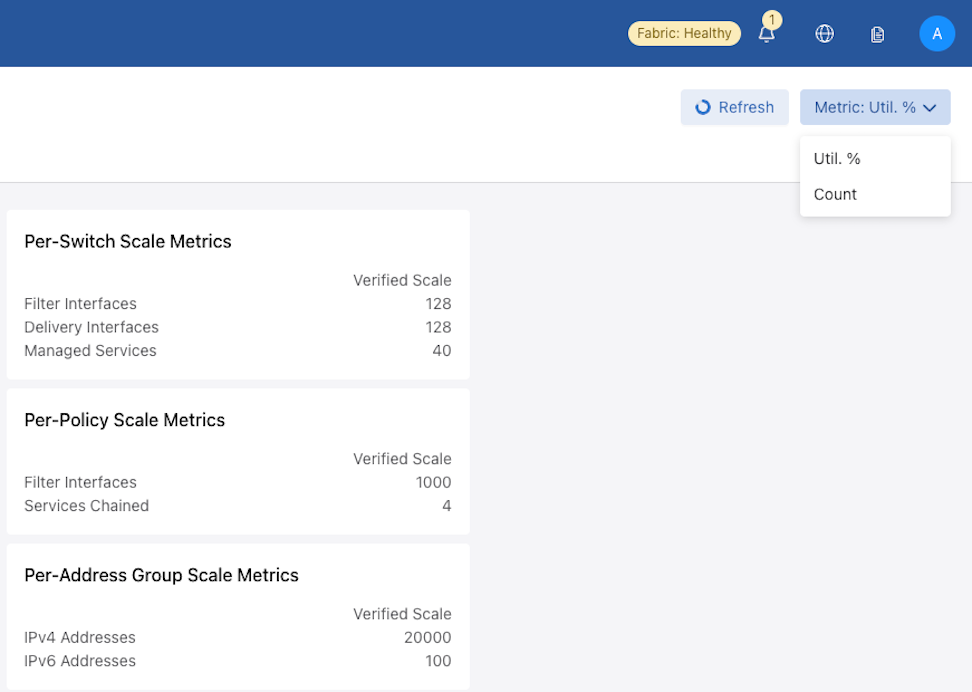
In addition to the meters, Verified Scale summary cards display for Per-Switch Scale Metrics, Per-Policy Scale Metrics, and Per-Address Group Scale Metrics, providing a quick reference to the supported scale limits for these categories.
Category-Level Scale Metrics
The second section, Category Scale Metrics, provides a detailed, categorized view of scale metrics at a more granular level.
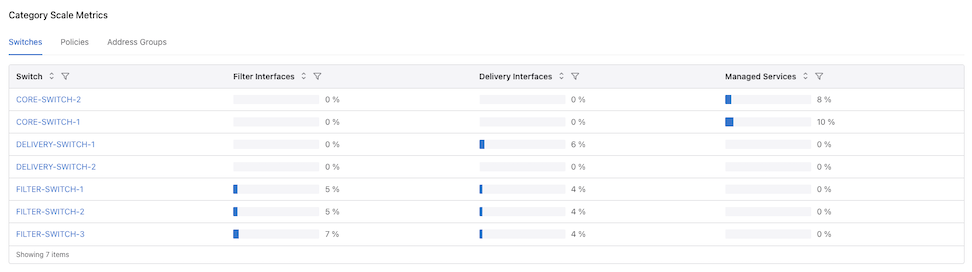
This section is organized by:
- Switches
- Policies
- Address Groups
Based on the selection, DMF displays a corresponding table allowing review of validated scale usage details for the selected category.
Color Coding
The meter color reflects the current scale utilization:
- Blue: ≤ 70%
- Orange: ≤ 95%
- Red: > 95%
Display Mode
Select the Utili. (%) or the Count drop-down to view the metrics as percentages or counts. The dashboard updates with the chosen view.
Using the Command Line Interface
Monitor Interface Configuration
View Connected Devices and LAGs
Monitor Interface Configuration
Ctrl-2> show interface-names

~~~~~~~~~~~~~~~~~~~~~~~~~~~~~~~~~~~~~~~~~~~ Filter Interface(s)  ~~~~~~~~~~~~~~~~~~~~~~~~~~~~~~~~~~~~~~~~~~~
# DMF IF      Switch              IF Name   Dir State Speed  VLAN Tag Analytics Ip address Connected Device
-|-----------|-------------------|---------|---|-----|------|--------|---------|----------|----------------|
1 Lab-traffic Arista-7050SX3-T3X5 ethernet7 rx  up    10Gbps 0        True

~ Delivery Interface(s) ~
None.


~ Service Interface(s) ~
None.

~~~~~~~~~~~~~~~~~~~~~~~~~~~~~~~~ Recorder Fabric Interface(s)  ~~~~~~~~~~~~~~~~~~~~~~~~~~~~~~~~
# DMF IF          Switch              IF Name    Dir           State Speed  Connected Device
-|---------------|-------------------|----------|-------------|-----|------|------------------|
1 PR-NewHW-Intf   Arista-7050SX3-T3X5 ethernet25 bidirectional up    25Gbps PR-NewHW   ens1f0
2 RMA-CNrail-intf Arista-7050SX3-T3X5 ethernet35 bidirectional up    25Gbps RMA-CNrail ens1f0
controller-1# show fabric
~~~~~~~~~~~~~~~~~~~~~ Aggregate Network State ~~~~~~~~~~~~~~~~~~~~~
Number of switches : 3
Inport masking : False
Start time : 2018-03-16 15:42:43.322000 PDT
Number of unmanaged services : 0
Filter efficiency : 0:1
Number of switches with service interfaces : 0
Total delivery traffic (bps) : 168bps
Number of managed service instances : 2
Number of service interfaces : 0
Match mode : l3-l4-offset-match
Number of delivery interfaces : 6
Max pre-service BW (bps) : 20Gbps
Auto VLAN mode : push-per-policy
Number of switches with delivery interfaces : 2
Number of managed devices : 1
Uptime : 5 hours, 4 minutes
Total ingress traffic (bps) : 160bps
Max filter BW (bps) : 221Gbps
Auto Delivery Interface Strip VLAN : True
Number of core interfaces : 12
Overlap : True
Number of switches with filter interfaces : 2
State : Enabled
Max delivery BW (bps) : 231Gbps
Total pre-service traffic (bps) : 200bps
Track hosts : True
Number of filter interfaces : 5
Number of active policies : 2
Number of policies : 5
~~~~~~~~~~~~~ Aggregate Interface Statistics ~~~~~~~~~~~~~
# Interface Type     Dir Packets Bytes  Pkt Rate Bit Rate
-|------------------|---|-------|------|--------|--------|
1 Filter Interface   rx  2444    455611 0        160bps
2 Delivery Interface tx  4050    421227 0        168bps
---------------------example truncated--------------------
controller-1#
View Switch Configuration
controller> show topology
~~~~~~~~~~~~~~~~~~~~~ Filter Interface(s) ~~~~~~~~~~~~~~~~~~~~~
# DMF IF    Switch IF   Name     state speed   Connected Device
-|---------|-----------|--------|-----|-------|----------------|
1 f1        filter-sw-1 s11-eth1 up    10 Gbps
2 f2        filter-sw-1 s11-eth2 up    10 Gbps
~~~~~~~~~~~~~~~~~~~~ Delivery Interface(s) ~~~~~~~~~~~~~~~~~~~~
# DMF IF    Switch IF   Name     state speed   Connected Device
-|---------|-----------|--------|-----|-------|----------------|
1 d1        filter-sw-2 s12-eth1 up    10 Gbps
2 d2        filter-sw-2 s12-eth2 up    10 Gbps
~~~~~~~~~~~~~~~~~~~~~~~~~ Service Interface(s) ~~~~~~~~~~~~~~~~~~~~~~~~~
# DMF IF           Switch IF Name    Dir state speed   Connected Device
-|----------------|---------|-------|---|-----|-------|----------------|
1 post-serv-intf-1 core-sw-1 s9-eth2     up    10 Gbps
2 pre-serv-intf-1  core-sw-1 s9-eth1     up    10 Gbps
~~~~~~~~~~~~~~~~~~~~~~~~ Core Interface(s) ~~~~~~~~~~~~~~~~~~~~~~~~
# Src Switch    Src IF   Src Speed Dst Switch    Dst IF   Dst Speed
-|-------------|--------|---------|-------------|--------|---------|
1 core-sw-3     s13-eth2 10 Gbps   delivery-sw-2 s15-eth3 10 Gbps
2 core-sw-3     s13-eth1 10 Gbps   delivery-sw-1 s14-eth3 10 Gbps
3 filter-sw-1   s11-eth3 10 Gbps   core-sw-2     s10-eth1 10 Gbps
4 core-sw-2     s10-eth1 10 Gbps   filter-sw-1   s11-eth3 10 Gbps
5 delivery-sw-2 s15-eth3 10 Gbps   core-sw-3     s13-eth2 10 Gbps
6 core-sw-2     s10-eth2 10 Gbps   filter-sw-2   s12-eth3 10 Gbps
7 filter-sw-2   s12-eth3 10 Gbps   core-sw-2     s10-eth2 10 Gbps
8 delivery-sw-1 s14-eth3 10 Gbps   core-sw-3     s13-eth1 10 Gbps
~~~~~~~~~~~~~~~~~~~~~~~~~~~~~~~~~~~~ Statistics ~~~~~~~~~~~~~~~~~~~~~~~~~~~~~~~~~~~~
#  DMF IF    Switch IF     Role     State   Packets        Bytes  Pkt Rate Bit Rate
--|---------|-------------|--------|--------|-----|-------|------|--------|--------|
1 f1         filter-sw-1   s11-eth1 filter   up    0       0      0        -
2 f2         filter-sw-1   s11-eth2 filter   up    0       0      0        -
3 d1         filter-sw-2   s12-eth1 delivery up    8       600    0        -
4 d2         filter-sw-2   s12-eth2 delivery up    8       600    0        32 bps
6 -          core-sw-3     s13-eth1 core     up    3432    257400 0        32 bps
7 -          delivery-sw-2 s15-eth3 core     up    3431    257325 0        32 bps
8 -          delivery-sw-1 s14-eth3 core     up    3430    257250 0        32 bps
9 -          core-sw-2     s10-eth1 core     up    3429    257175 0        32 bps
10 -         filter-sw-1   s11-eth3 core     up    3431    257325 0        32 bps
11 -         core-sw-3     s13-eth2 core     up    3432    257400 0        32 bps
12 -         filter-sw-2   s12-eth3 core     up    3429    257175 0        32 bps
View Connected Devices and LAGs
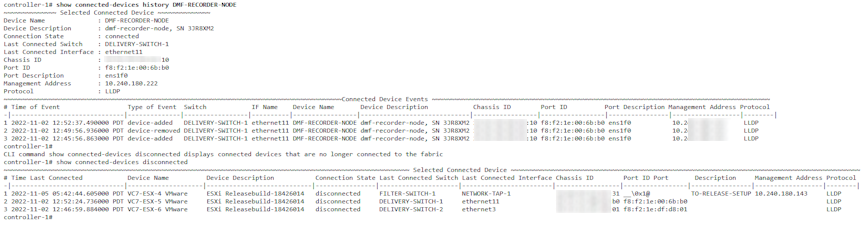
Some information on devices in the production network, discovered using LLDP and CDP, can be seen using the show connected-devices command. The data helps determine if filter interfaces are connected to the intended production device.
The show connected-devicescommand from login mode displays the devices connected to the DANZ Monitoring Fabric (DMF). This command displays information about devices connected to DMF switch interfaces. DMF extracts the information from link-level protocol packets such as LLDP, CDP, and UDLD and ignores expired link-level data.

Users can see the most recent events related to particular connected devices via the CLI command show connected-devices history device_alias.
Connecting a DMF switch interface to a SPAN port may result in inaccurate information because some vendor devices mirror link-level packets to the SPAN port.
To display details about the link aggregation groups connected to the DMF switch interfaces use the show connected-lacp command. DMF extracts the information from LACP protocol packets and expired LACP information is ignored as illustrated in the following.

Viewing Information about a Connected Production Network
# show tracked-hosts
#   IP Address      MAC Address                                              Host name                           Filter interfaces        VLANs   Last seen Extra info
---|---------------|--------------------------------------------------------|-----------------------------------|------------------------|-------|---------|
1   10.0.0.3        40:a6:d9:7c:9f:9f                                        Apple                               wireless-poe-1           0       1 hours
2   10.0.0.6        98:fe:94:1c:37:06                                        Apple                               wireless-poe-1           0       42 min
3   10.0.0.6        dc:2b:61:81:64:45                                        Apple                               wireless-poe-1           0       3 hours
4   10.0.0.7        20:c9:d0:48:f3:3d                                        Apple                               wireless-poe-1           0       2 hours
5   10.0.0.11       60:03:08:9b:4f:48                                        Apple                               wireless-poe-1           0       13 min
6   10.0.1.3        14:10:9f:e4:e6:bf                                        Apple                               wireless-poe-1           0       51 min
--------------------------------------------------------------------output truncated----------------------------------------------------------------------
DMF also tracks the DNS names of hosts by capturing and analyzing packets using several different protocols. To manage host-name tracking, from config-analytics mode, use the track command, which has the following syntax:
[no] track { arp | dns | dhcp | icmp }
controller-1(config)# analytics
controller-1(config-analytics)# track dns
controller-1(config)# switch DMF-FILTER-SWITCH-1
controller-1(config-switch)# interface ethernet20
controller-1(config-switch-if)# role filter interface-name TAP-PORT-01 no-analytics
This command disables all host tracking on interface TAP-PORT-01.
Capacity Planning - Current versus Verified Scale
Before DMF release 8.9, the DMF fabric lacked direct visibility into current scale metrics relative to verified scale limits. This feature exposes real-time scale data against verified benchmarks via REST APIs, the GUI, and CLI commands. The verified scale represents the capacity tested under reference conditions. The feature is compatible with all platforms and no new configuration is necessary; the feature uses existing settings to provide immediate visibility into the scale.
Show Commands
The scale feature introduces new CLI commands under the existing show
fabric command structure. These commands provide visibility into current fabric resource usage compared to verified scale across different categories.
show fabric scale- Display fabric-wide current scale and verified scale.show fabric scale category- Display verified scale for specified category.show fabric scale category identifier-Display current scale and verified scale for specified identifier.show fabric scale category all-Display current scale and verified scale for all instances of the specified category.show fabric scale category all metric-name- Display current scale values for the specified metric across all instances of the specified category, along with the metric's verified scale.
- The category can be a switch, policy, or address-group.
- An identifier is the specific name within the category (switch name, policy name, or address-group name).
- A metric-name is the name of the metric.
dmf-controller-1> show fabric scale
~~~~~~~~~~~~~~~ Fabric Scale Metrics  ~~~~~~~~~~~~~~~
#  Metric               Current Scale Verified Scale
--|--------------------|-------------|--------------|
1  switches             3             150
2  filter-interfaces    1             1500
3  delivery-interfaces  5             1000
4  total-policies       1             4000
5  managed-services     2             40
6  service-nodes        1             5
7  ipv4-address-groups  1             170
8  ipv6-address-groups  1             50
9  max-overlap-policies 4             10
10 connected-devices    3             100
11 groups               3             500
12 users                1             500
Notes:
Verified scale represents capacity that has been tested under reference conditions.
dmf-controller-1> show fabric scale <tab>
address-group  switch         |               <cr>
policy         ;
dmf-controller-1> show fabric scale switch
~~~~~ Per-Switch Scale Metrics  ~~~~~
# Metric              Verified Scale
-|-------------------|--------------|
1 filter-interfaces   128
2 delivery-interfaces 128
3 managed-services    40
Notes:
Verified scale represents capacity that has been tested under
reference conditions.
dmf-controller-1> show fabric scale switch <tab>
all        core1      delivery1  filter1    ;          |          >           <cr>
dmf-controller-1> show fabric scale switch core1
~~~~~~~~~~~~~~~~~~~~ Switch Scale Metrics  ~~~~~~~~~~~~~~~~~~~~
# Switch Name Metric              Current Scale Verified Scale
-|-----------|-------------------|-------------|--------------|
1 core1       filter-interfaces   0             128
2 core1       delivery-interfaces 0             128
3 core1       managed-services    2             40
Notes:
Verified scale represents capacity that has been tested under reference conditions
dmf-controller-1> show fabric scale switch all
~~~~~~~~~~~~~~~~~~~~ Switch Scale Metrics  ~~~~~~~~~~~~~~~~~~~~
# Switch Name Metric              Current Scale Verified Scale
-|-----------|-------------------|-------------|--------------|
1 core1       filter-interfaces   0             128
2 core1       delivery-interfaces 0             128
3 core1       managed-services    2             40
4 delivery1   filter-interfaces   0             128
5 delivery1   delivery-interfaces 3             128
6 delivery1   managed-services    0             40
7 filter1     filter-interfaces   1             128
8 filter1     delivery-interfaces 2             128
9 filter1     managed-services    0             40
Notes:
Verified scale represents capacity that has been tested under reference conditions.
dmf-controller-1> show fabric scale policy all
~~~~~~~~~~~~~~~~~~~ Policy Scale Metrics  ~~~~~~~~~~~~~~~~~~~
# Policy Name Metric            Current Scale Verified Scale
-|-----------|-----------------|-------------|--------------|
1 slc         filter-interfaces 5             1000
2 slc         services-chained  4             4
Notes:
Verified scale represents capacity that has been tested under reference conditions.
dmf-controller-1> show fabric scale address-group all
~~~~~~~~~~~~~~~~~~ Address Group Scale Metrics ~~~~~~~~~~~~~~~~~~
# Address Group Name Metric         Current Scale Verified Scale
-|------------------|--------------|-------------|--------------|
1 temp               ipv4-addresses 1             20000
2 v6                 ipv6-addresses 2             100
Notes:
Verified scale represents capacity that has been tested under reference conditions.
dmf-controller-1> show fabric scale switch all <tab>
delivery-interfaces  managed-services     |                     <cr>
filter-interfaces    ;                    >
dmf-controller-1> show fabric scale switch all delivery-interfaces
Metric         : delivery-interfaces
Verified Scale : 128
~~~ Switch Scale Metrics ~~~
# Switch Name Current Scale
-|-----------|-------------|
1 core1       0
2 delivery1   3
3 filter1     2
Notes:
Verified scale represents capacity that has been tested under reference conditions.
Syslog Messages - Scale
- WARN
- SCALE4000: Verified scale file not found at {file path}.
- ERROR
- SCALE7000: Unable to read verified scale file {file path} due to security violation.
- SCALE7001: Failed to load verified scale from {file path}.
- SCALE7002: Ignoring invalid category {file path}.