Monitor Wi-Fi
The Monitor tab in CV-CUE is primarily used for monitoring the Clients, APs, Radios, WLANs, Applications, and Tunnels in the network. You can perform troubleshooting operations based on the information collected for each of the components in the Monitor tab.
- Clients
- Presents a list of clients connected to and clients that failed to connect to Arista devices.
- Access Points
- Lists the Arista devices that are operating in AP or in AP/Sensor mode.
- Radios
- Lists the radios operating on 2.4, 5, and 6 GHz frequencies.
- Active SSIDs (WLANs)
- Lists the SSID profiles.
- Application Visibility
- Lists the applications with details about their data usage for a specific SSID.
- Tunnels
- Lists the tunnels used by the SSIDS to move data between endpoints.
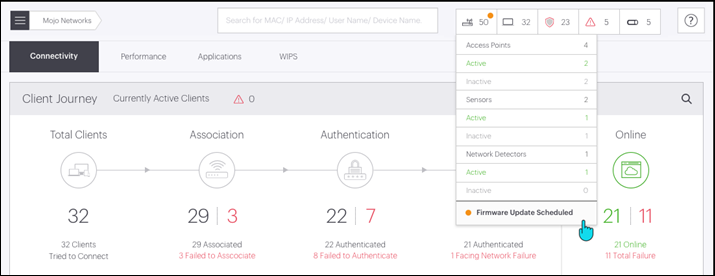
The Global Counters at the top-right corner provide you a summary of Clients and Access Points.
- Total managed devices (access points and sensors)
- Total active access points
- Total inactive access points
- Total currently online clients
- Total switches
Clients
The Clients tab displays the clients that are connected to APs. The type of Clients differ depending on their association with the AP.
- If you select Live: A list of clients with the following status are displayed:
- Clients that are successfully connected to Arista APs.
- Clients that failed to connect.
- If you select All: A list of clients with the following status (including Live clients) are displayed:
- Clients that are successfully connected to Arista APs.
- Clients that failed to connect.
- Clients that are currently visible but not connected to an Arista AP.
- Clients that are currently not visible, but connected earlier to an Arista AP.
- Clients that are currently not visible and failed to connect in their last attempt.
To know the status, hover the mouse over the Status icon.
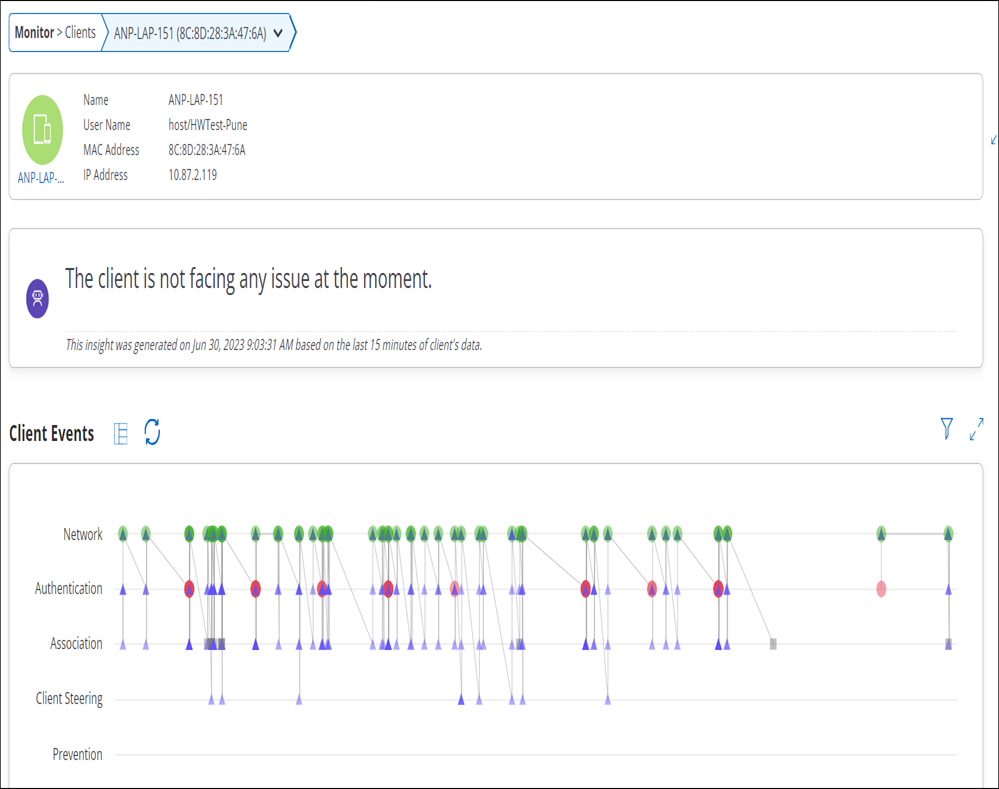
Graph View (Old view)
| Property | Description |
|---|---|
| Status | Indicates if the client is successfully associated or failed to connect. |
| Name | Specifies the user-defined name of the client. |
| User Name | Provides Username of the client |
| Role | After client is connected via any SSID, it is assigned with Role configured in SSID profile. |
| Google Authorized | It is boolean value to represent whether client is authorized using google integration. |
| Location | Location of the client. |
| MAC Address | Specifies the unique 48-bit IEEE format address of the client assigned to the network adapter by the manufacturer. |
| IP Address | IP address of the client. |
| OS | Name of Operating System running on the client. |
| Associated AP | Specifies the AP with which a client is associated. This is the AP through which the client communicates with other clients and devices on the network. |
| Associated SSID | Specifies the operating SSID of the AP with which the client is associated. |
| Avg. data rate | Refers to the average amount of data transferred per unit of time |
| RSSI(dbm) | Displays the observed RSSI (Received Signal Strength Indicator) value for the client. |
| Uplink Data | Indicates the amount of data transferred by the client. |
| Downlink Data | Indicates the amount of data received by the client. |
| Protocol | Indicates the 802.11 protocol (with or without 802.11n or 802.11ac capability) used. |
| Up/Down Since | Date and time since the client is up or down. |
| First Detected At | Indicates the time and day when the client was first detected |
| Retry Rate (%) | Indicates the retry rate in percentage |
| Sticky | Denotes whether client is sticky or not. Sticky client means if client is connected to AP and while roaming it found better AP with more better signal strength, still it decides to stay connected with older AP. |
- Live Client Debugging- The Live Client Debugging feature enables you to troubleshoot client activities. Selecting this feature displays the list of the clients, for those any live activities are in progress.
- Packet Trace- Capture Packet Trace action on a client to intercept a data packet that is crossing or moving over a specific network. Selecting this activity displays the list of those clients for which packet trace is in session.
- Prevention- Prevention activity displays the list of all quarantined clients.
- None- Selecting None provided the list of all the clients without any filters.
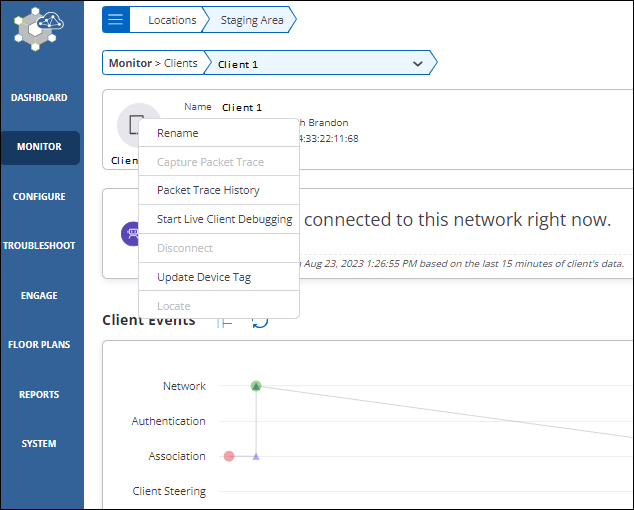
You can perform the following actions on every client, these actions are available on a right click on any client:
| Action | Description |
|---|---|
| Rename a Client | To change the name of a client. |
| Capture Packet Trace for a Client | Responsible for intercepting a data packet that is crossing or moving over a specific computer network |
| View Packet Trace History for an Access Point | Displays packet traces captured in the last 30 minutes |
| Start Live Client Debugging | Displays live client logs of a client. |
| Disconnect | Disconnects the client. |
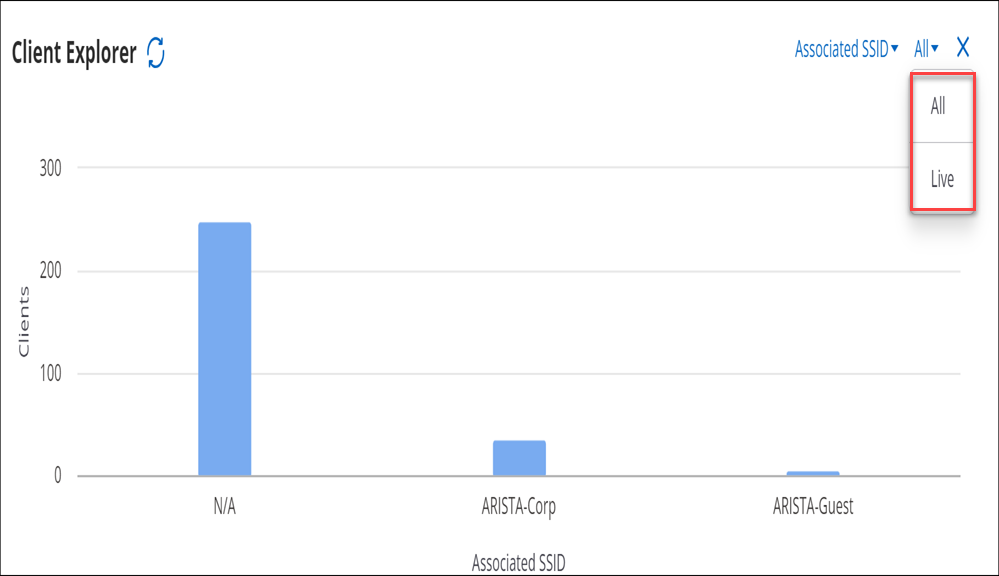
Client Explorer
Client Explorer helps you view the distribution of clients that are connected to Arista devices.
It provides a summary view of all the clients and provides an easy way for the network administrators to understand client distribution for each attribute. For example, network administrators can use the Client Explorer to understand client distribution for different versions of Wi-Fi and determine the percentage of legacy clients at a location.
- Navigate to
- Click Client Explorer
On the Client Explorer chart, you can filter the clients based on their association attributes such as SSID and with AP as well as a range of Client properties. You can use the client connection status drop-down menu to view graphical client distribution based on the selected attribute.
Connection Status
- Clients that are successfully connected to Arista APs.
- Clients that failed to connect.
- Clients that are successfully connected to Arista APs.
- Clients that failed to connect.
- Clients that are currently visible but not connected to an Arista AP.
- Clients that are currently not visible, but connected earlier to an Arista AP.
- Clients that are currently not visible and failed to connect in their last attempt.
Hover over the Status icon to view the current selection for client connection status filter.
Client Attributes
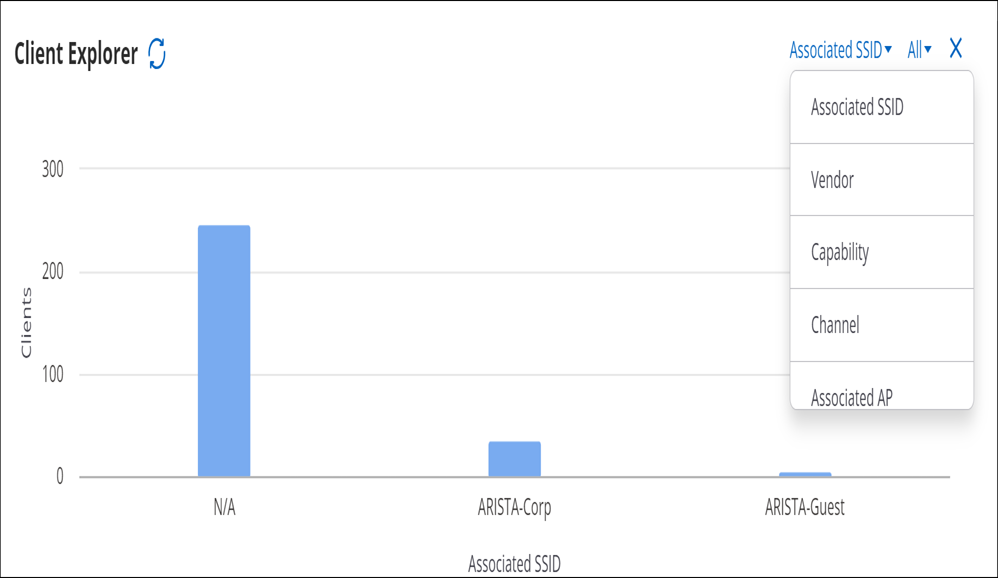
- Associated SSID
- Vendor
- Capability
- Channel
- Associated AP
- Connection Failure Type
- Protocol
- Google Auth Status
- Role Operating Status
You can select and deselect a particular bar in the bar graph to filter the tabular data in the client list.
Client Dashboard
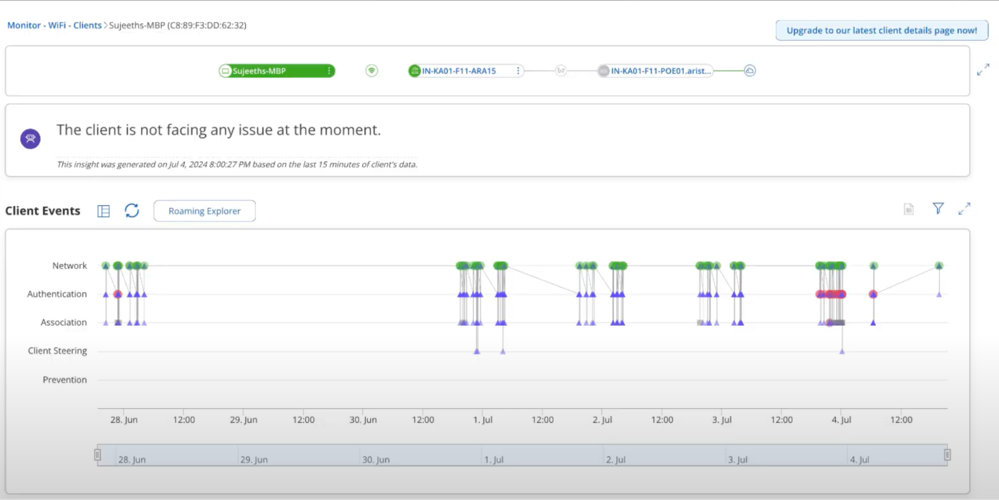
Along with client and network details, the client details dashboard also contains multiple data points regarding client connectivity, performance, and application experience. From a single dashboard, you can conduct live troubleshooting, and review past data to identify and troubleshoot past issues, thus resulting in a faster resolution.
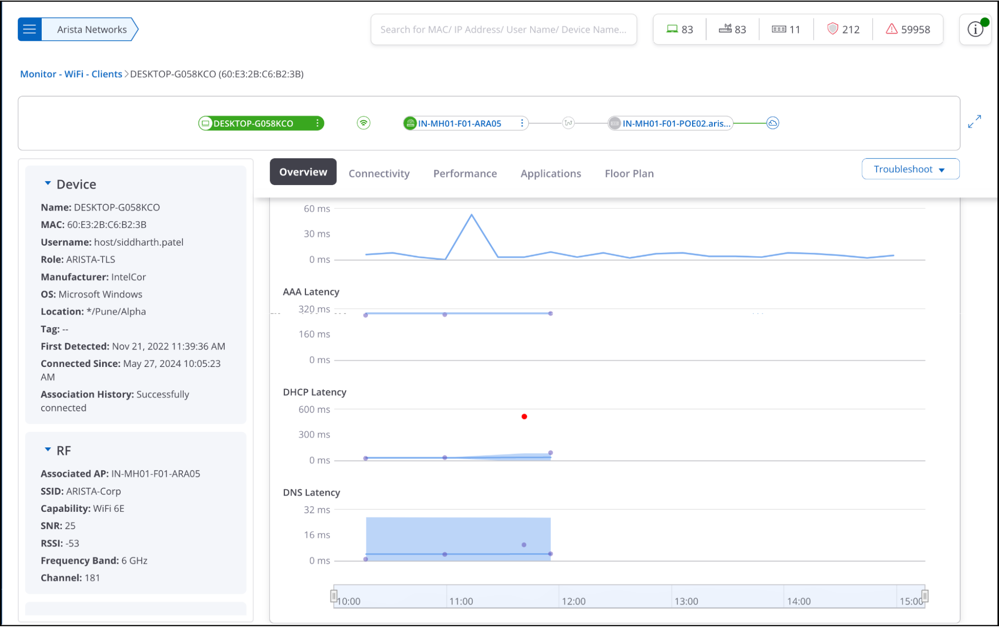
The Client Details Dashboard contains a client connection widget, a client properties widget, and multiple tabs containing different charts and graphs showcasing client details.
Client Connection Widget
The top section of the dashboard has the client connection widget, which visually shows the selected client's network connectivity path. It shows the Client > AP > Switch association.

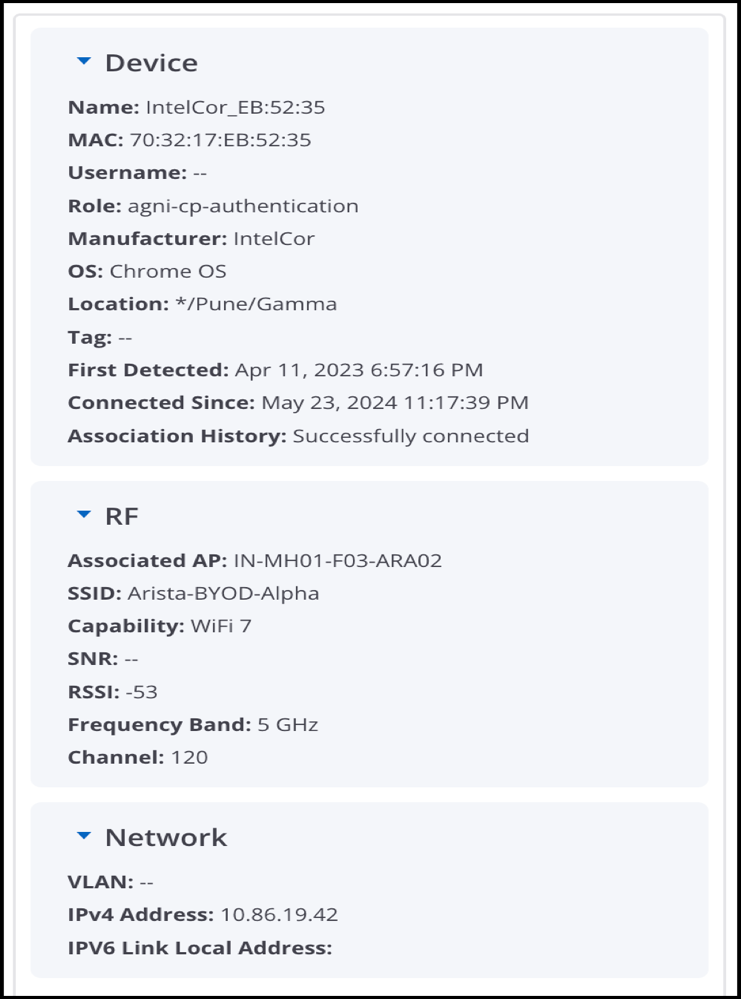
Client Properties Widget
The left side of the dashboard contains the following sections that display client properties:
- Device Details
- RF Details (Radio Frequency)
- Network Details - Only available for connected clients.
Client Dashboard Tabs
- Overview
- Connectivity
- Performance
- Application
- Floor Plan
Overview Tab
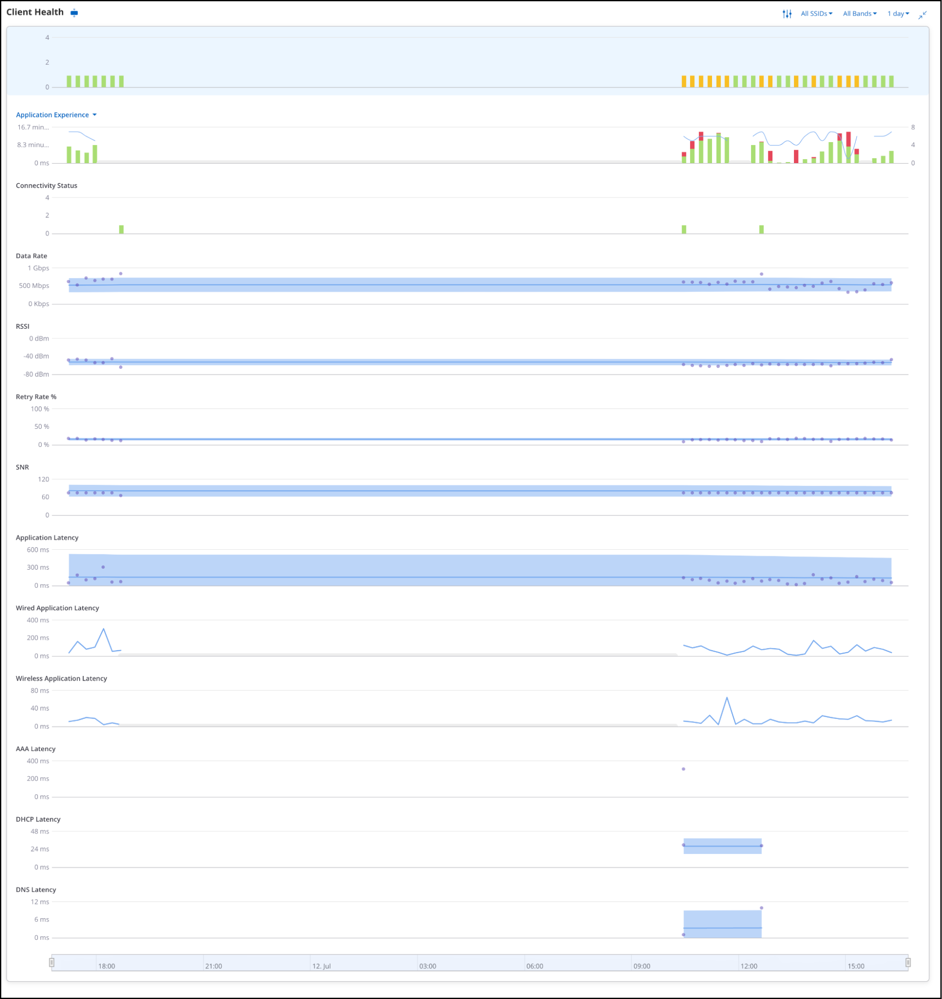
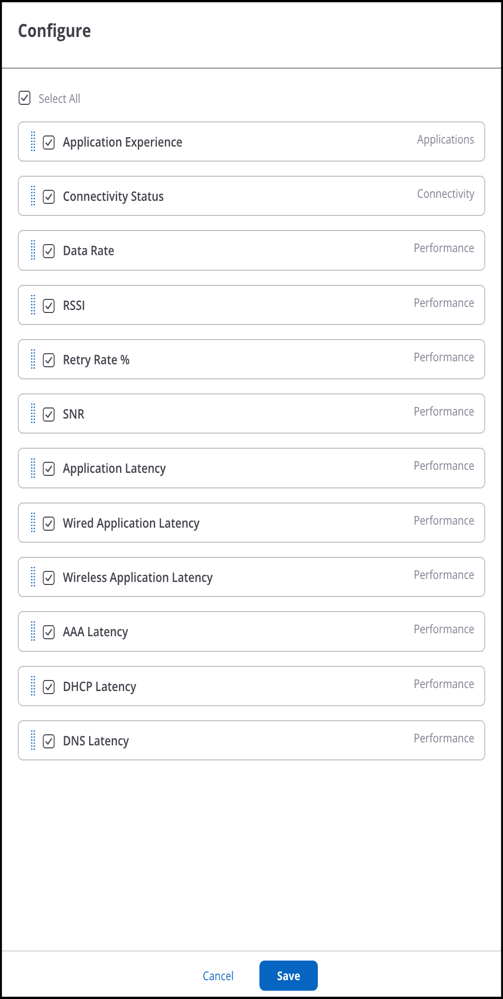
The Client Health Widget contains multiple charts related to client health, such as % Poor application experience, Connectivity Failures, RSSI, Data Rate, Wired Application Latency, Wireless Application Latency, Retry Rate %, etc. It is an interactive widget that you can customize according to your preferences. You can customize it to add or remove certain charts and change the order of visible charts. You can also hover over any data point to view more information.
Connectivity Tab
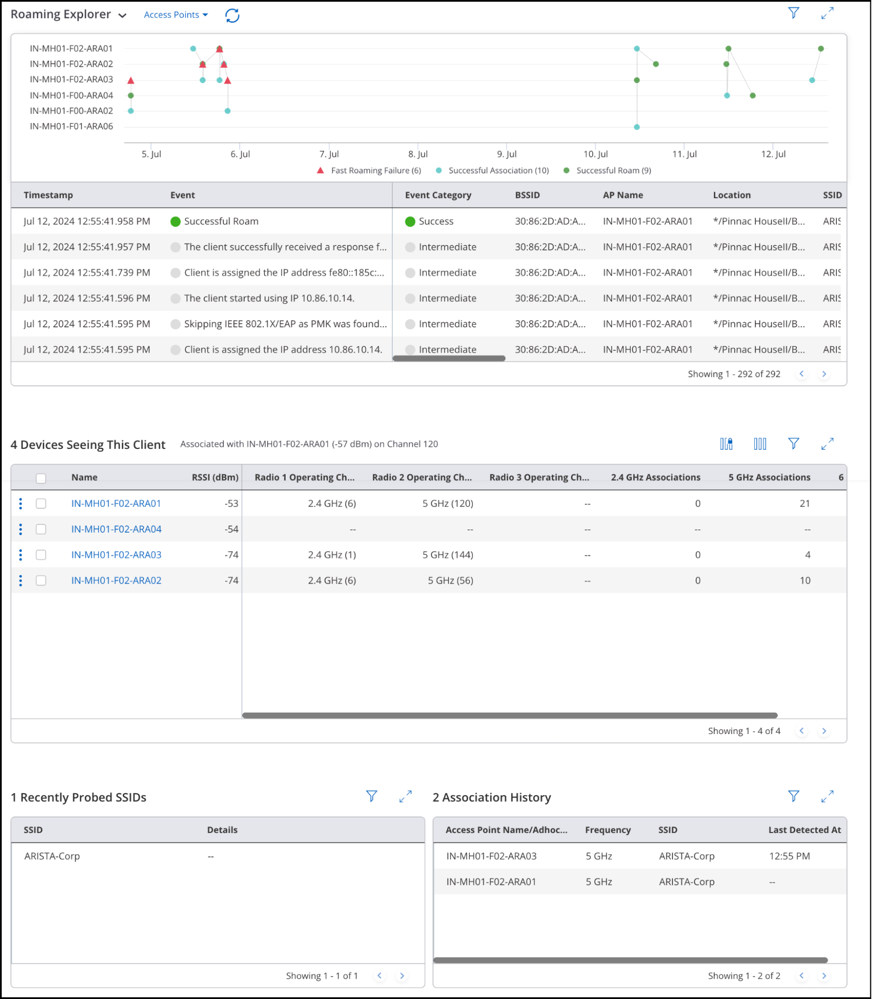
The connectivity tab contains charts that display the client’s connection attempts, the client’s roaming events from one AP to another, and a list of APs watching this client.
- Client Events / Roaming Explorer
- Devices Seeing This Client
- Recently Probed SSIDs
- Association History
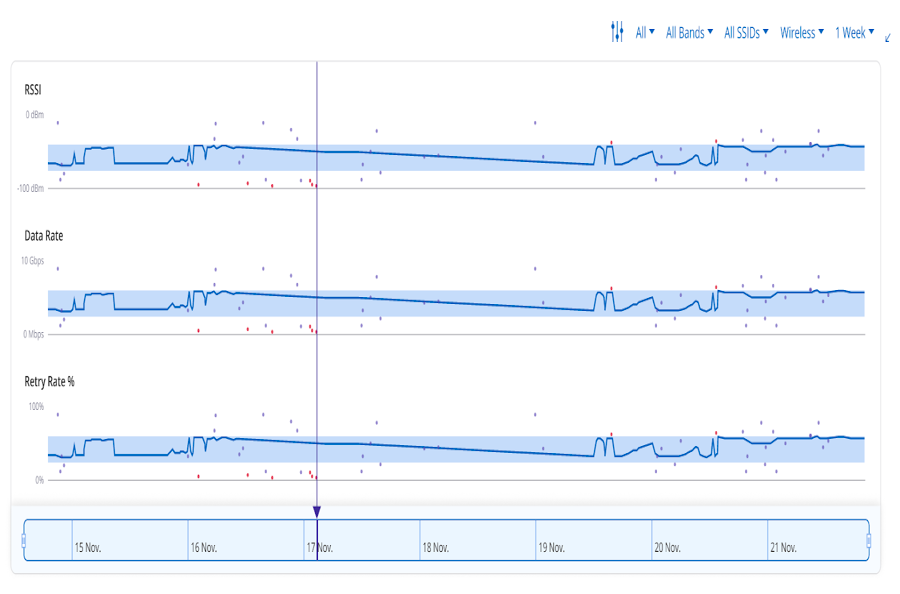
Performance Tab
The performance tab contains RSSI, Data Rate, Retry Rate %, and Traffic Volume charts.

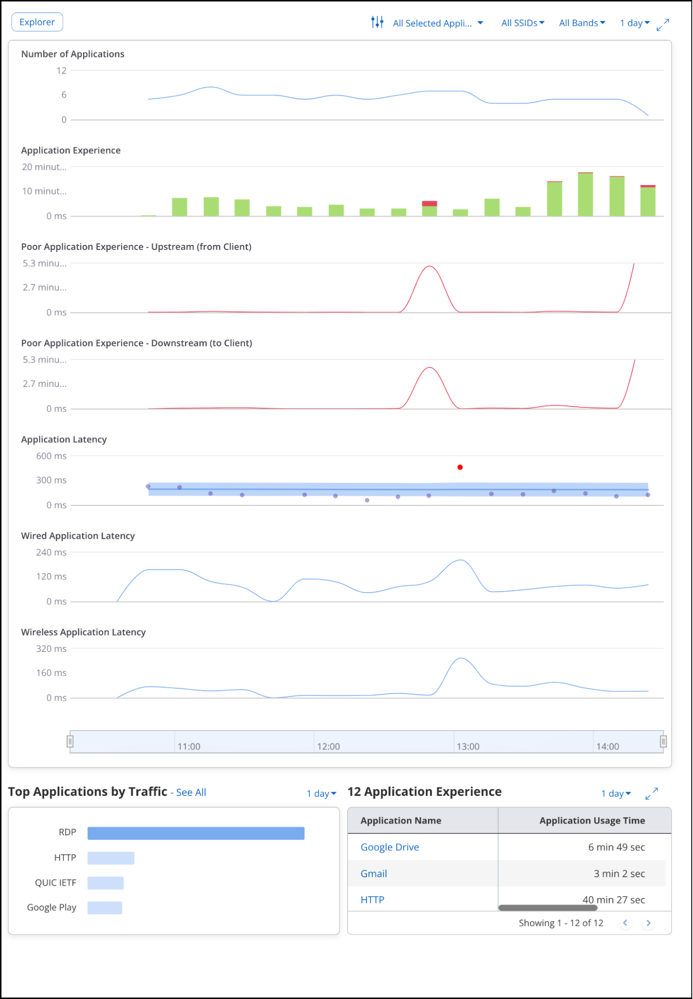
Application Tab
The application tab displays charts that provide details about the applications used by the client, such as the number of applications, application latency, poor application experience, etc.
- Application Explorer
- Top Applications by Traffic
- Application Experience
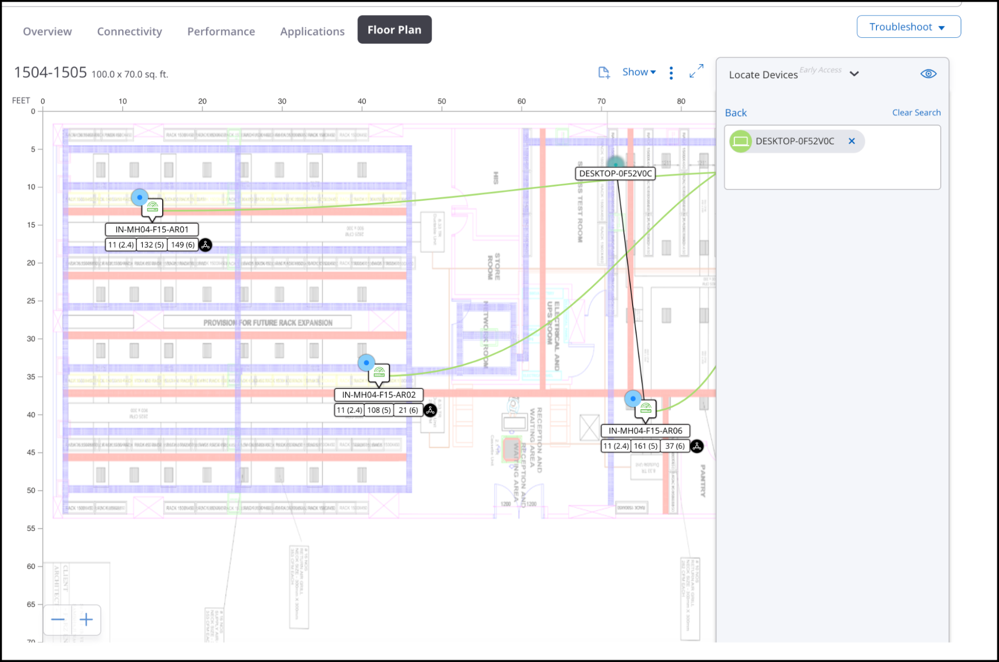
Floor Plan Tab
The floor plan shows the location of the client on the floor. For the client to be located on the floor plan, it must be visible to at least three APs operating in the same frequency band. At least three APs must report the device and the APs must be placed on the floor.
Troubleshooting a Client
You can perform the following actions on each client. These actions are available under the Troubleshoot menu.
- Rename: To change the name of a client.
- Capture Packet Trace: To intercept a data packet that is crossing or moving over a specific network. The captured packet is stored temporarily for analysis. The packet is inspected to help diagnose and solve network problems.
- Packet Trace History: To view the Packet Trace History for the selected client. The packet traces captured only during the last 30 minutes are displayed in the history.
- Start Live Client Debugging: Displays live client logs of a client connection.
- Disconnect: Disconnects the client.
- Update Device Tag: Update the device tag of the client.
Related AP Events
The Related AP Events chart is a diagnostic chart that correlates a client's connectivity experience with the health of the Access Points (AP) they are connected to.
You can instantly see whether a client’s connection issue was caused by an infrastructure event, such as an Access Point reboot or a configuration change, or whether the problem was isolated to the client's device. By syncing these two perspectives, you no longer need to manually cross-reference timestamps across multiple logs, making troubleshooting significantly faster and more efficient.
For example, if a client experiences a disconnection at the same time the Related AP Events chart shows a red or blue bar, the problem is likely caused by the network equipment. Or, if a client reports poor performance but the chart is empty or shows only blue bars, the access point is working correctly, suggesting the issue is likely specific to the device, such as a weak signal or a problem with the device itself.
This chart supports client roaming. If a client moves between multiple APs during the 15-minute window, the chart combines data from all associated APs, providing a seamless troubleshooting timeline.
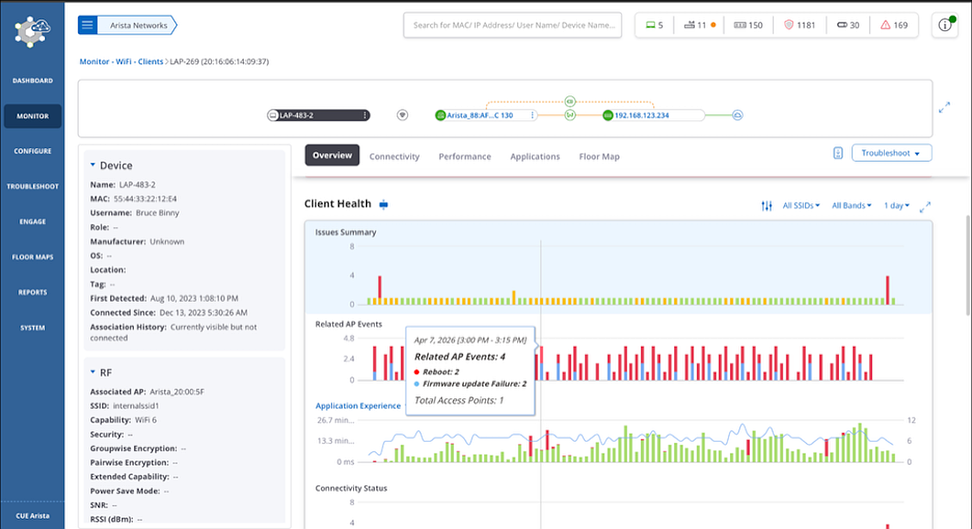
Hover over a bar to view more details, or click a specific bar to drill down and view more details in the right-hand panel.
The right-hand panel shows client connectivity and performance issues along with a detailed list of AP event names and their frequencies. This panel correlates each event to the specific AP and provides a direct link to the Access Point Detail page for easy navigation.
You can also see the Related AP Events information in the Issue Summary tooltip.
Roaming Explorer
Roaming Explorer provides a graphical and tabular view of a client’s roaming events from one access point (AP) to another AP.
- Navigate to
- Click Roaming Explorer next to the Client Events widget.
Roaming Explorer consists of a graph view and a split view.
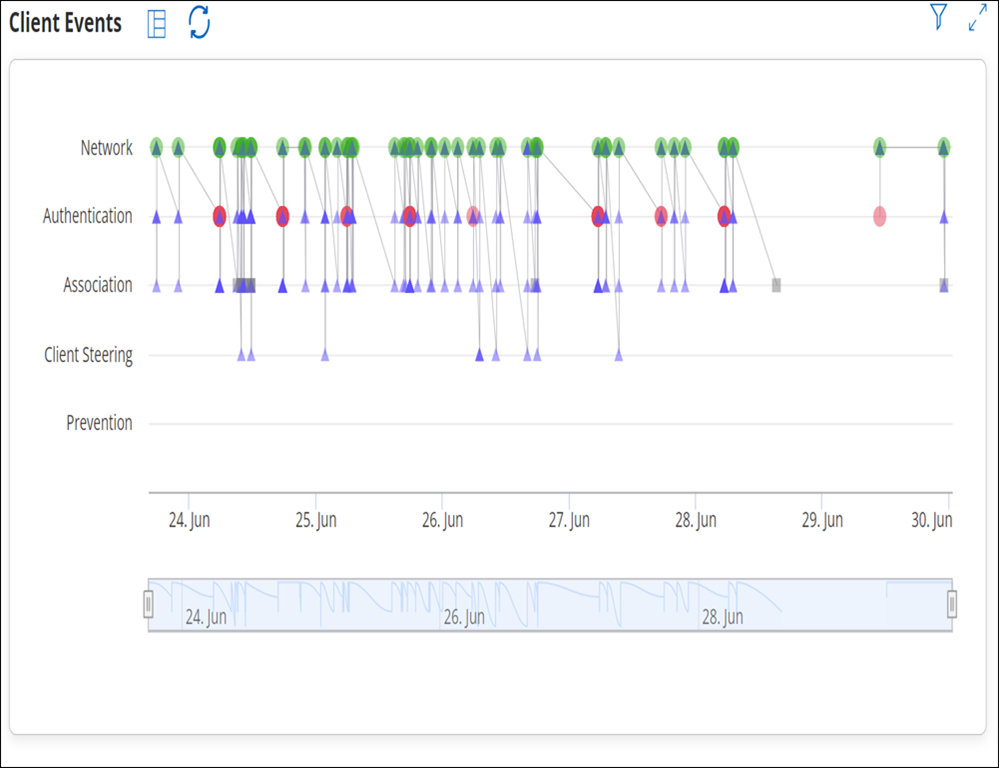
Graph View
The graph view appears as follows:
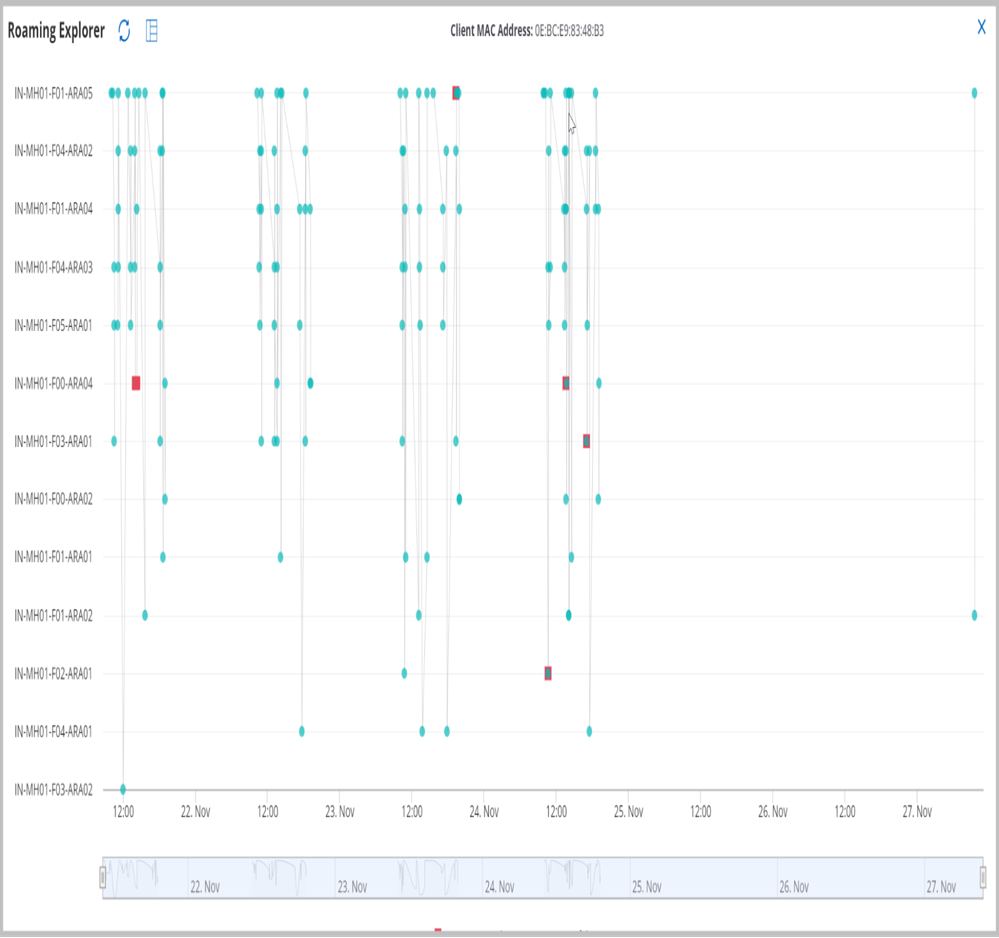
It is a line graph denoting the client’s roaming activities on different APs. The APs are listed based on the number of events logged for each AP, with the AP having the highest number of roaming events listed on top. The Y-axis shows the APs, and the X-axis shows the timeline of the roaming event. You can hover over any event to view more details about it.
Graph view considers the following roaming events only:
- Association Failure
- Fast Roaming Failure
- Successful-Fast Roam
- Successful-First Association
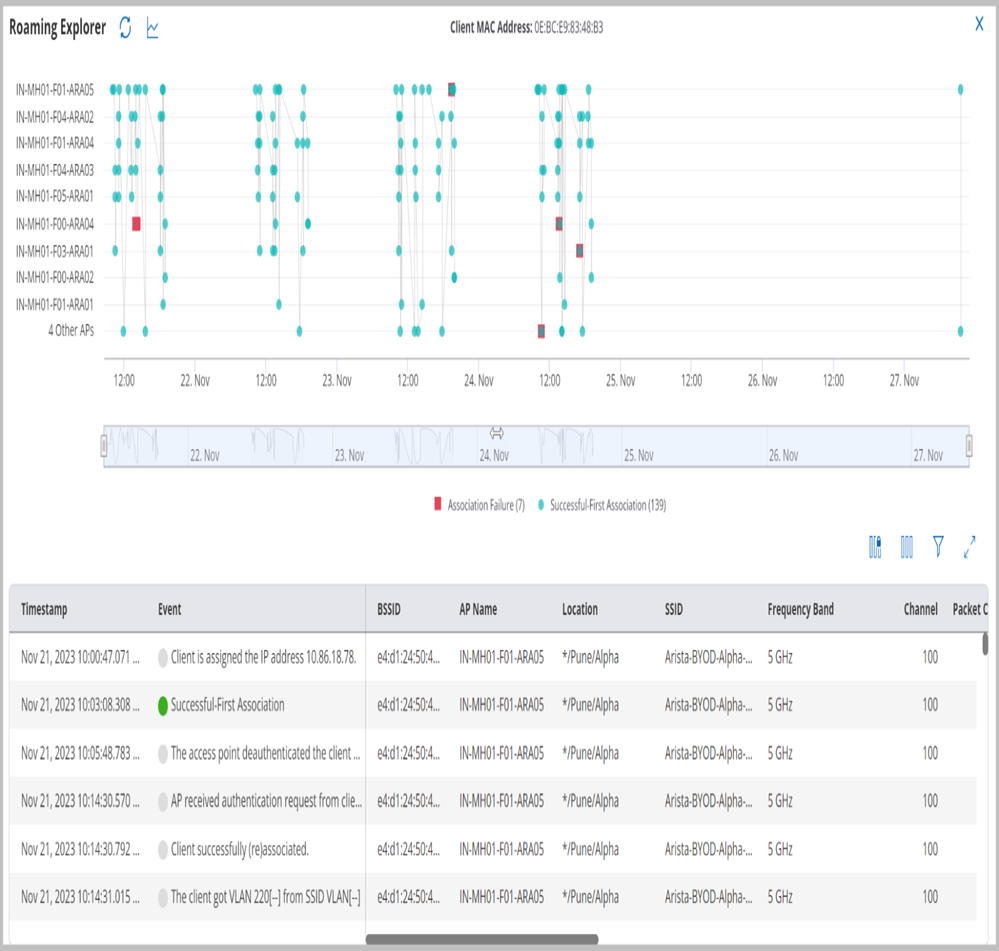
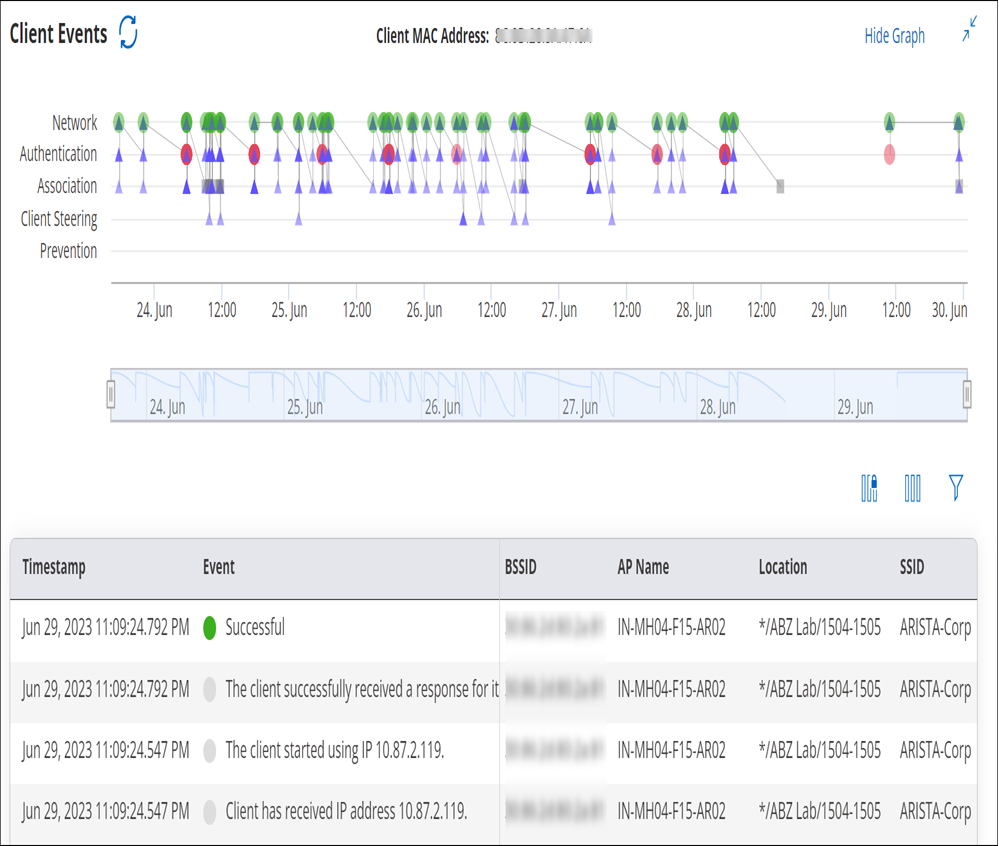
Split View
The split view consists of a graph view and tabular data that lists all the clients' events along with the event timestamp and further details such as BSSID, AP Name, Location, Frequency Band, and more.
Client Connection Logs
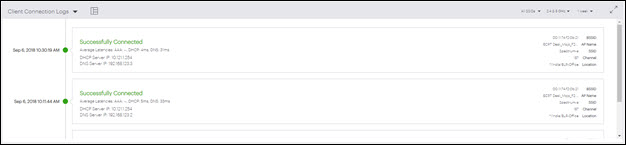
Selecting a client in the Clients list displays the connection logs.
Client Connection Logs shows the list of successful or failed connection attempts made by client. The list provides information about every attempt of connection made by a client. Green color represents successful connection. Red color represents failed connections. Client connection logs can be retrieved only for 802.11ac or higher APs.
- 2 hours
- 4 hours
- 8 hours
- 12 hours
- 1 day
- 1 week
- Timeline View
- Grid View
| Field | Description |
|---|---|
| Timestamp | Indicates the date and time when the client connected to an AP. |
| Average Latencies | Average latencies of various stages and their sub-stages in the Wi-Fi connection for the client. |
| BSSID | BSSID is the MAC address of the AP to which the client attempted to connect. |
| AP Name | Name of the AP to which the client attempted to connect. |
| SSID | SSID of the WLAN to which the client is connected. |
| Channel | Operating channel of the AP to which the client attempted to connect. |
| Disconnect | Disconnects client from AP. |
| Field | Description |
|---|---|
| BSSID | BSSID is the MAC address of the AP to which the client attempted to connect. |
| AP Name | Name of the AP to which the client attempted to connect. |
| SSID | SSID of the WLAN to which the client is connected. |
| Channel | Operating channel of the AP to which the client attempted to connect. |
| Timestamp | Indicates the date and time when the client connected to an AP. |
| Event | Indicates if the client successfully connected. |
| Failure Categories | Main Failure Type |
|---|---|
| Association Failure | AP association limit exceeded |
| Capability mismatch | |
| Association failure | |
| Authentication Failures | EAPOL 4-way handshake failed |
| RADIUS authentication failure | |
| RADIUS server not responding | |
| Incorrect Pre-Shared Key | |
| Fast roaming failed | |
| Network Failures | Captive portal - shared secret mismatch |
| Captive Portal authentication failed | |
| Captive portal - client in blackout period | |
| DHCP failed | |
| DNS failure |
| Column | Filtering Criteria | Description |
|---|---|---|
| Event | All | Retrieves all the event logs. |
| Successful | Retrieves only successful event logs. | |
| Failed | Retrieves only unsuccessful event logs. |
| Filtering Criteria | Description |
|---|---|
| Enter the From and To dates. | Retrieves client connection logs between the From and To dates. |
| Check the Long Time Ago check box and enter the To date. | Retrieves all client connection logs till the To date. |
| Enter the From date and check the Now check box. | Retrieves client connection logs between the From date and the current date. |
| Check the Long Time Ago and Now check boxes. | Retrieves all the available client connection logs. |
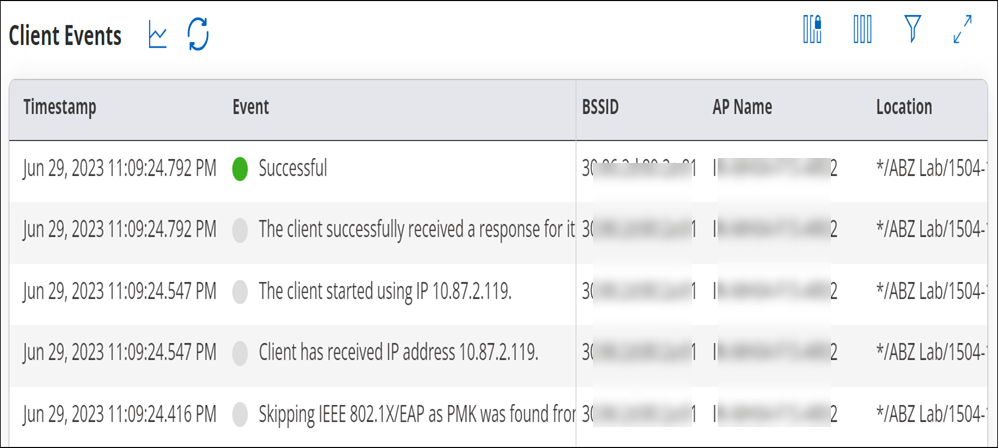
Client Events Logs
You can view Client Events Logs by navigating to Clients > Client Connection Logs drop-down menu > Client Events Logs.
Client Event Logs by default opens in a full screen mode. It lists majority of client events including connection attempts. The list provides information about client connectivity events. Green color represents successful connection events. Grey color represents intermediate events. Red color represents failed connection events.
- 2 hours
- 4 hours
- 8 hours
- 12 hours
- 1 day
- 1 week
- Graph View
- Grid View
- Consolidated View
Graph View
| Field | Description |
|---|---|
| Timestamp | Indicates the date and time when the client connected to an AP. |
| Average Latencies | Average latencies of various stages and their sub-stages in the Wi-Fi connection for the client. This is seen in case of a successful connection event. |
| BSSID | BSSID is the MAC address of the AP radio for that SSID. |
| AP Name | Name of the AP to which the client attempted to connect. |
| SSID | SSID of the WLAN to which the client is connected. |
| Channel | Operating channel of the AP to which the client attempted to connect. |
| Location | Location of the AP to which the client is connected. |
| Frequency Band | Frequency band of the client connected to the AP. |
Graph View
If you are interested in a specific event, you can apply filters based on various criteria to view the specific event. The filter is applied on the Grid view but the filter criteria are reflected in the Graph view as well. You can remove the filter from the Grid view.
You can click a specific event in the graph and the corresponding event detail is highlighted in the table.
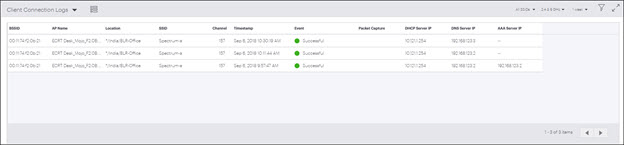
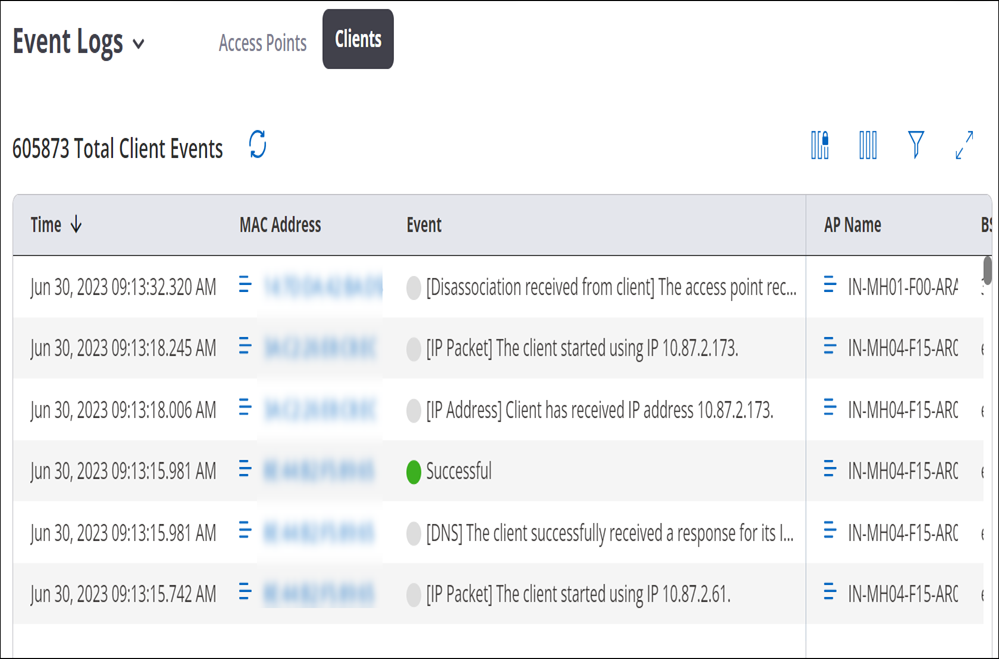
Grid View
The Grid View appears as follows. The red, green, and grey colored symbols in event column of the client event logs denote unsuccessful, successful, and intermediate events, respectively. Hover on each text to know about type of event occurred.
| Field | Description |
|---|---|
| BSSID | BSSID is the MAC address of the AP to which the client attempted to connect. |
| AP Name | Name of the AP to which the client attempted to connect. |
| SSID | SSID of the WLAN to which the client is connected. |
| Channel | Operating channel of the AP to which the client attempted to connect. The channel is shown as Dual for sensor that operates on both 802.11a and 802.11b/g simultaneously. |
| Timestamp | Indicates the date and time when the client connected to an AP. |
| Event | Indicates if the client successfully connected. |
| Packet Capture | It provides the link of the Wireshark file, that contains a packet capture for all failure events. User can open the file in Arista packets or download the file. |
Consolidated View
Top Applications by Traffic in Client Tab
Top Applications by Traffic chart graphically represents data usage for applications. It always represents data for top five applications, with highest traffic. To view exact data usage, hover on the specific bar in the graph.
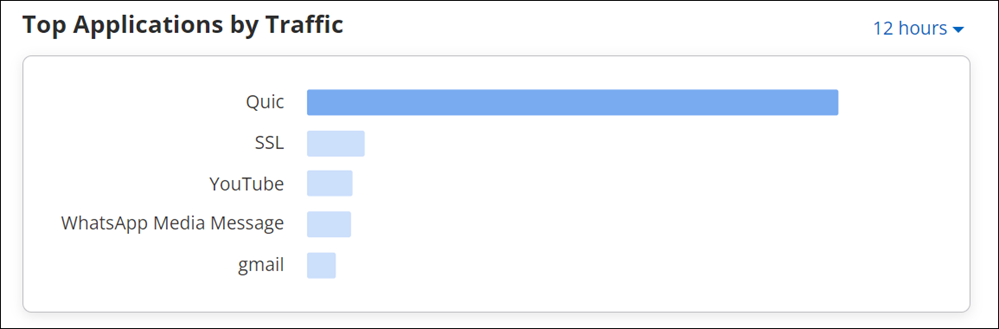
The data on the widget can be filtered using the available filters on the top right corner of the widget. To know more about the filters refer Filters on Widgets.
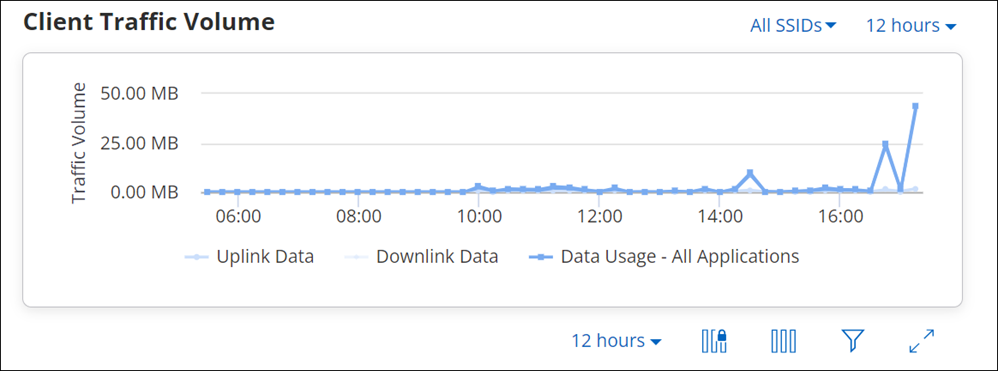
Client Traffic Volume
The Client Traffic Volume graph represents the data traffic sent and received by the client every 15 minutes. X-axis in the graph denotes the time period for which the Data Usage is plotted and Y-axis denotes the Traffic Volume.
- 2 hours
- 4 hours
- 8 hours
- 12 hours
- 1 day
- 1 week
Hovering the mouse on data point provides detail information about data usage.
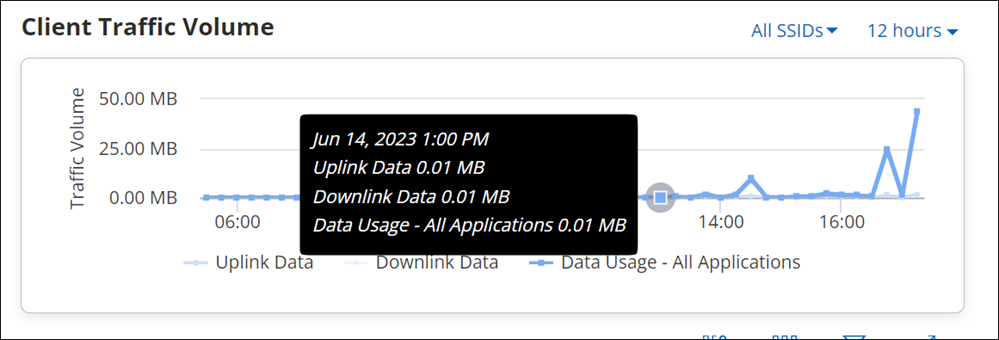
- Time stamp: It includes day, date, month, year, and time of data usage.
- Uplink Data: It states Uplink Data usage.
- Downlink Data: It states Downlink Data usage.
- Data Usage: It states Data Usage for all applications.
Application Session Logs
Application Session Logs provides details of the applications used by the client. Select a client from to view Application Session Logs.
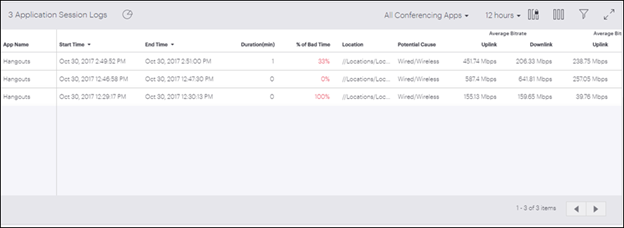
Hover on the pie chart icon to view overall aggregated data. The data provides information about Total Sessions, percentage count of Affected Sessions, Total Experience Time and percentage count for Poor App Experience.
The logs on the widget can be filtered using the available filters on the top right corner of the widget. To know more about the filters refer Filters on Widgets.
| Property | Description |
|---|---|
| App Name | Name of the application. |
| Start Time | Session start time. |
| End Time | Session end time. |
| Duration(min)x | Session duration in minutes. |
| % of Bad Time | Percentage of time for which app experience was bad for the specified clients. |
| Location | Location at which the client connected. |
| Potential Cause | Potential root cause for application performance to be poor. |
| Average Bitrate Uplink | Indicates average of the number of bits sent per second by the client in that session. |
| Average Bitrate Downlink | Indicates average of the number of bits received per second by the client in that session. |
| Average Bitrate Jitter Uplink | Average standard deviation in uplink bitrate. |
| Average Bitrate Jitter Downlink | Average standard deviation in downlink bitrate. |
| Average RSSI(dbm) | Average Received Signal Strength Indicator. |
| Average Retry Rate | Average percentage of retry packets out of the total packets sent or received by the client. |
| Average Data Rate Upstream | Average upstream data rate. |
| Average Data Rate Downstream | Average downstream data rate. |
| Roaming Count | Number of APs involved during the session. |
| Associated AP(s) | List of APs involved in the client session. |
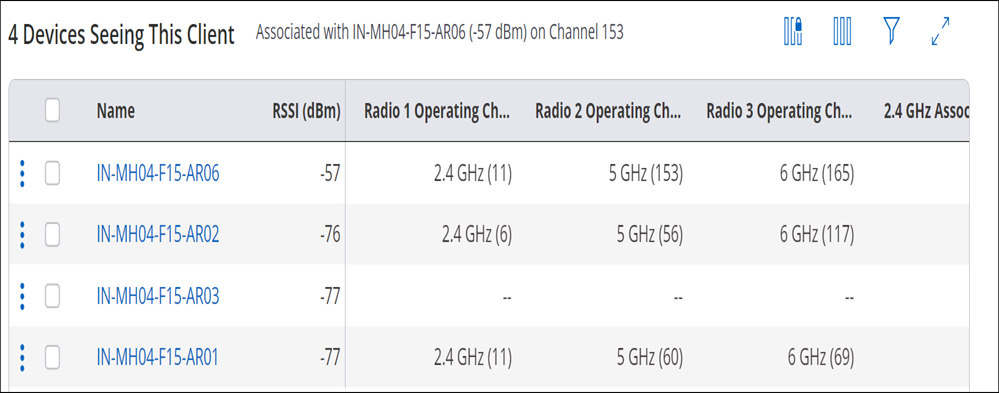
Devices Seeing This Client
Devices Seeing This Client represents list of APs currently watching the client.
| Field | Description |
|---|---|
| Name | Name of APs seeing the client. |
| RSSI (dbm) | RSSI states signal strength of an AP as seen by the client. |
| Radio 1 Operating Channel | Shows the band and channel operating on radio 1. Channel is shown in brackets. |
| Radio 2 Operating Channel | Shows the band and channel operating on radio 2. Channel is shown in brackets. |
| Radio 3 Operating Channel | Shows the band and channel operating on radio 3. Channel is shown in brackets. |
| 2.4 GHz Associations | It states number of clients associated with 2.4 GHz radio. |
| 5 GHz Associations | It states number of clients associated with 5 GHz radio. |
| 6 GHz Association | It states number of clients associated with 6 GHz radio. |
Clicking on the name of AP takes you to the Access Points Information page.
Rename a Client
You can change the name of a client.
- Go to or .
- Right-click on the name of the client you want to rename or click on the menu icon (three vertical dots) and select Rename Client.
- Change the name of the client and click Done to save the changes.
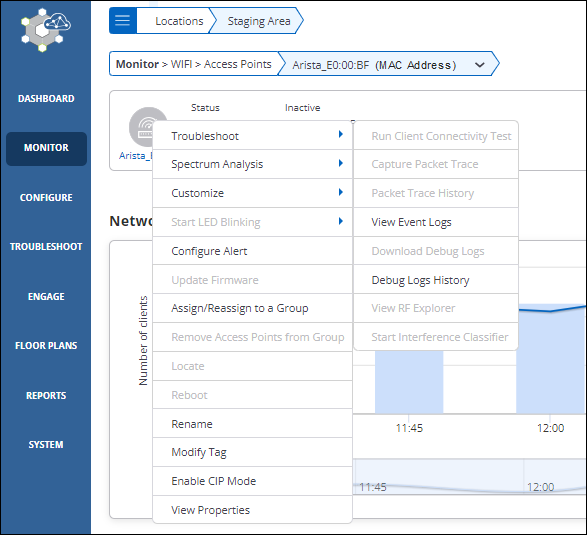
Access Points
The Access Point tab provides detailed information of an AP such as its name, IP Address, status, and the switch it is connected to.
- Packet Trace: Capture Packet Trace action on an AP captures the packet and inspects it to help diagnose and solve network problems. Selecting this activity displays the list of those devices for which packet trace is in session.
- Prevention: Prevention activity displays the list of all quarantine devices.
- Client Connectivity Test: Client Connectivity Test is performed to troubleshoot an AP that has client connectivity issues. Client Connectivity Test action displays the list of such devices, for which the troubleshooting is in progress.
- None: Selecting None provided the list of all the APs without any filters.
| Action | Description |
|---|---|
| Update Firmware | Using this option you can update the firmware on the AP to the latest or any previously released version. |
| Access Point Event Logs | A log table that maintains event logs of APs. |
| Run Client Connectivity Test | Runs the Client Connectivity Test. |
| View RF Explorer | The RF Explorer shows you information such as the channels occupied by other APs in the vicinity of the AP and the RSSI values for each of the neighboring APs as seen by the AP. |
| Capture Packet Trace | This option helps troubleshoot Arista devices operating in AP or AP/Sensor mode. |
| Packet Trace History | You can view the Packet Trace History for a selected AP. |
| View on Floor Map | This option redirects you to the location on the floor map where the AP is placed. |
| Customize Radio Settings | Transmit Power Selection enables you to control the transmission power of the AP. |
| Move | Using the Move operation, you can change location of an AP. |
| Reboot | Reboots the AP. |
| Rename | Renames the AP. |
| Delete | Deletes the APs from the list of available APs. |
- Network Usage - Traffic
- The chart displays a line graph showing the number of client association and its traffic volume, for all the clients on the selected folder or floor.
- Network Usage - Poor Application Experience
- This chart provides overall application usage analysis.
- Baseline - Clients Affected By Poor Experience
- The Baseline - Clients Affected By Poor Performance graph calculates the baseline for the percentage of clients affected by poor performance, for the selected AP, over a period of time.
- Baseline - Retry Rate%
- The graph calculates baseline for the Retry Rate % of the clients connected to the selected AP
- Baseline - Average Data Rate
- The graph calculates the data rates for 2.4 GHz, 5 GHz, or 6 GHz for the selected SSIDs and duration.
- Baseline - Clients Affected by Failure
- Baseline - Clients Affected by Failure chart provides calculated baseline for the percentage of clients that failed due to connectivity issues.
- Baseline - Clients Affected by Poor App Experience
- Baseline - Clients Affected chart provides the calculated baseline for the percentage of clients affected by poor app experience. This data is provided for the selected AP.
- Clients by Average Data Rate
- Displays a bar graph of the clients and their data usage, for the selected AP.
- Top Applications by Traffic
- Displays a bar graph of the top 5 applications that has highest data usage, for the selected AP.
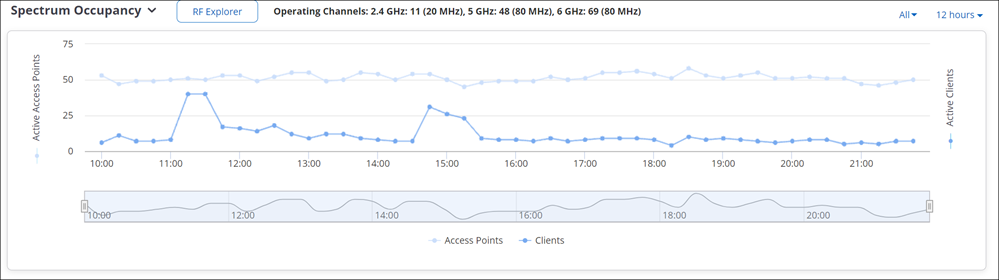
- Spectrum Occupancy
- Shows the number of active radios and clients across the Rf spectrum.
- Channel Utilization
- Shows the AP channel utilization.
- Currently Associated Clients
- The Currently Associated Clients widget provides the list of clients that are currently associated with the AP.
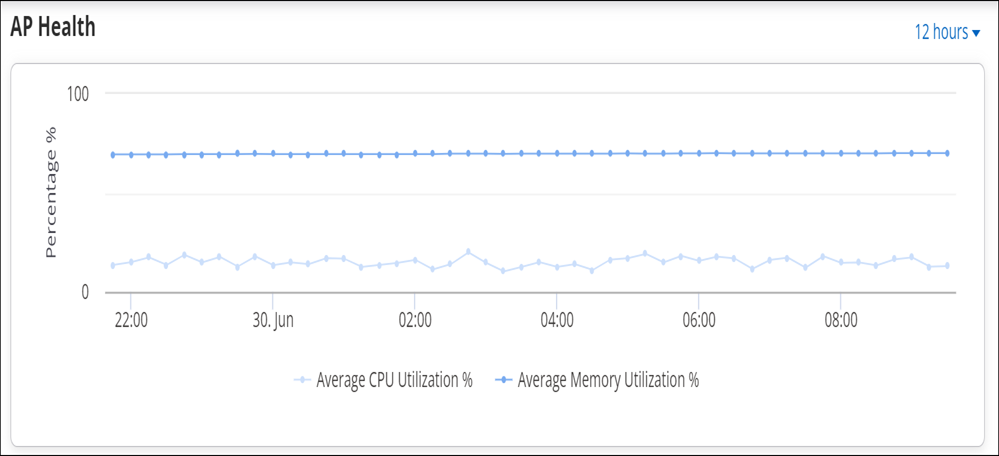
- Ap Health
- Shows the CPU and memory utilization of an AP.
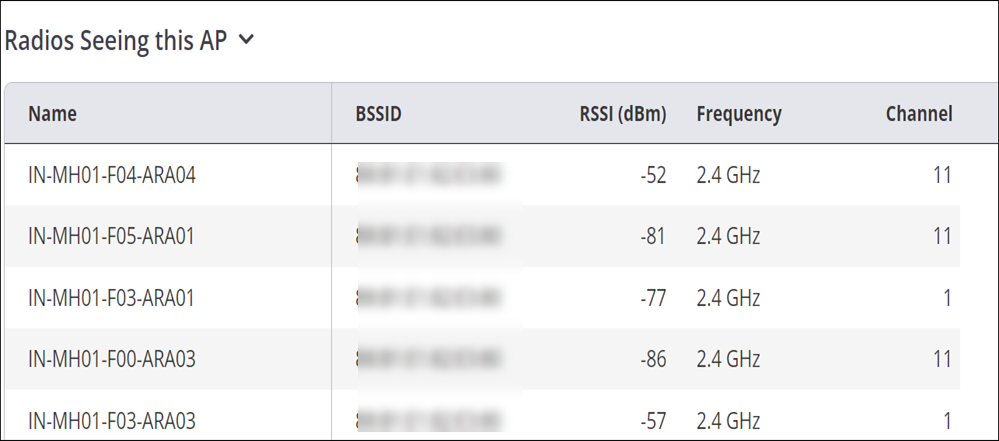
- Devices Seeing this AP
- The widget displays the list of managed devices observing the selected device.
- Visible VLANs
- The widget displays details of the VLANs visible to the managed device.
- Visible Access Points
- Provides the list of the APs visible to the selected AP.
- Visible Clients
- Provides the list of clients visible to the selected AP.
| AP State | Switch Properties | VLANs Detected | IPv4 or IPv6 Properties | Link Speed | Health Stats | ||
| Switch Name | Switch Vendor | Switch Port | |||||
| Active | Current | Current | Current | Current | Current | Current | Current |
| Inactive or Offline | Last Known | Last Known | Last Known | Last Known | Last Known | Last Known | Last Known with a note in the right panel: "Values when AP was last active"
(shown "--" in the Managed Devices and AP listing) |
| Mesh Root | Current | Current | Current | Current | Current | Current | Current |
| Mesh Non-Root (Powered by DC or PoE brick) | Not Displayed ("--") | Not Displayed ("--") | Not Displayed ("--") | Current | Current | Not Displayed ("--") | Current |
| Mesh Non-Root (Used for network extension and connected to a switch) | Current | Current | Current | Current | Current | Current | Current |
|
Link Aggregation: eth0 Up (regardless of whether eth1 is Up or Down) |
Current | Current | Current | Current | Current | Current | Current |
|
Link Aggregation: eth0 Down and eth1 is Up |
Last known | Last known | Last known | Last known | Current | Last known | Current |
| Failsafe | Last Known | Last Known | Last Known | Last Known | Last Known | Last Known | Last Known with a note in the right panel: "Values before AP entered failsafe mode"
(shown "--" in the Managed Devices and AP listing) |
| LLDP Disabled on Switch | Last Known | Last Known | Last Known | Current | Current | Current | Current |
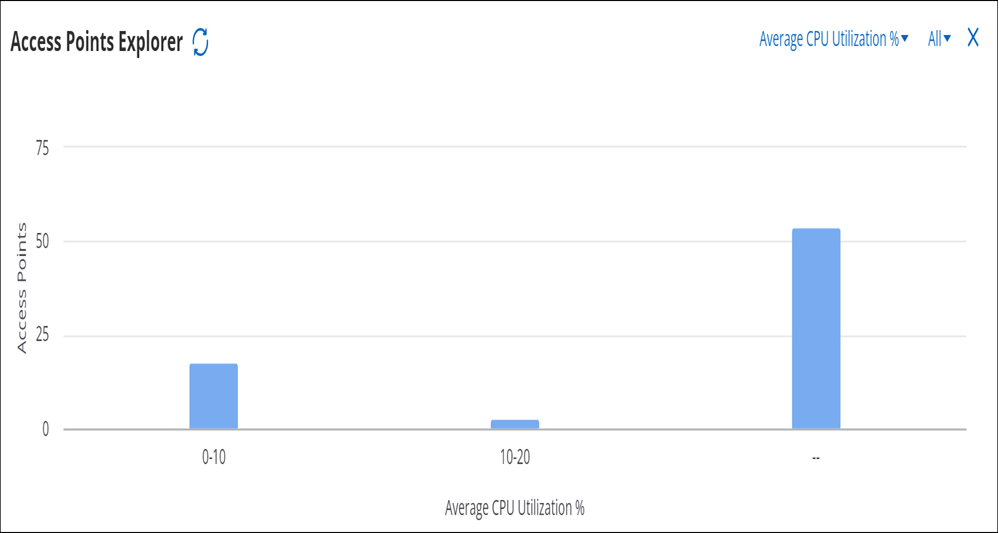
Access Point Explorer
AP Explorer provides a holistic view of all the APs at a location and provides an easy way for the network administrators to understand AP distribution for each attribute.
- Navigate to
- Click Access Point Explorer.
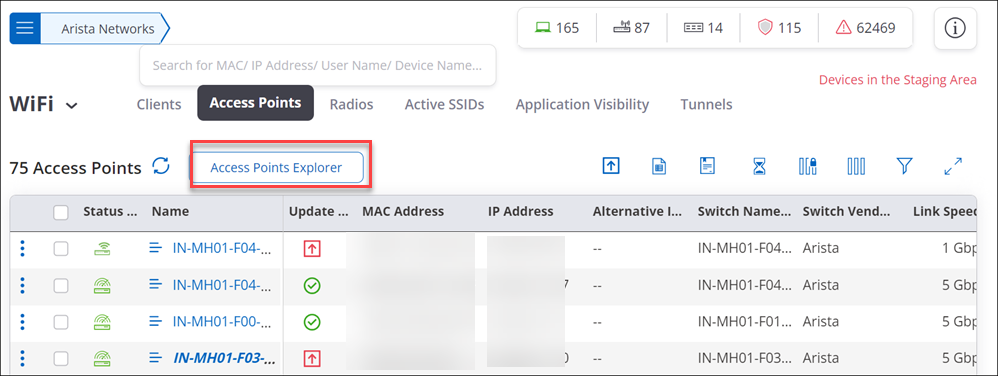
On the AP Explorer chart, you can filter the devices based on the Device Status (All, Active, or Inactive). You can use the attribute drop-down menu to view graphical AP distribution based on the selected attribute. For example, you can use the AP Explorer chart to get a summary view of AP Health by looking at the APs based on CPU Utilization or Memory Utilization.
Clients by Avg. Data Rate for an Access Point
The Clients by Avg. Data Rate graph displays clients classified based on data rate. CV-CUE has pre-defined, fixed thresholds for Average Data Rate. Since thresholds are configurable, user may select a value that falls in between a bucket on the X-axis. For instance, if a user sets the data rate threshold to 75 Mbps and RSSI threshold to -68 dBm, then these values fall in the “50 to 100 Mbps” data rate bucket and “-65 to -75 dBm” RSSI bucket, respectively.
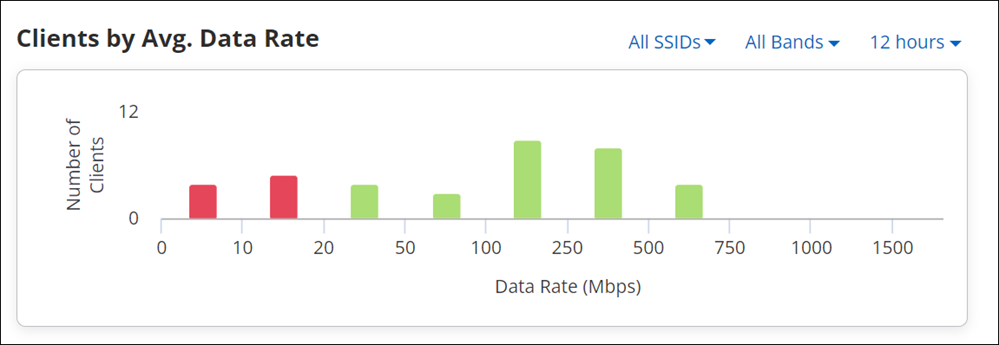
- If all values in the “50 to 100 Mbps” bucket are below 75 Mbps, then the bar in the “50 to 100 Mbps” bucket is red.
- If all values in the “50 to 100 Mbps” bucket are above 75 Mbps, then the bar in the “50 to 100 Mbps” bucket is green.
- If some values in the “50 to 100 Mbps” bucket are above and below 75 Mbps, then the bar in the “50 to 100 Mbps” bucket is yellow.
- 2.4 GHz
- 5 GHz
- 6 GHz
- All Bands
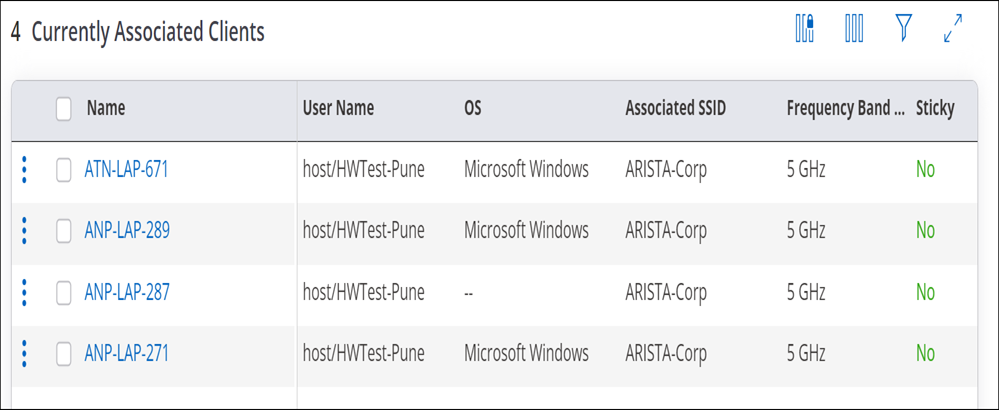
Currently Associated Clients for an Access Point
Currently Associated Clients widget provides the list of clients that are currently associated to the AP.
| Column | Description |
|---|---|
| Name | Name of a device to which AP is connected. |
| User Name | Name of a user. |
| MAC Address | Unique 48-bit address of the AP/ 802.11 PHY modes used by the AP. |
| IP Address | IP address of the AP |
| Associated SSID | Name of a SSID to which client is connected. |
| OS | Operating System running on the client. |
| UP/Down Since | Up since time or Down since time |
| RSSI (dBm) | Received Signal Strength Indicator. |
| Sticky | Denotes whether client is sticky or not. Sticky client means if client is connected to AP and while roaming it found better AP with more better signal strength, still it decides to stay connected with older client. |
| Tx Data Rate | Tx Data Rate is Transmission Data Rate of a client. |
| Rx Data Rate | Rx Data Rate is Received Data Rate of a client. |
| Avg Data Rate | Avg Data Rate is Average Data Rate of a client |
| Retry Rate (%) | Retry Rate (%) is Retransmission rate of a client. |
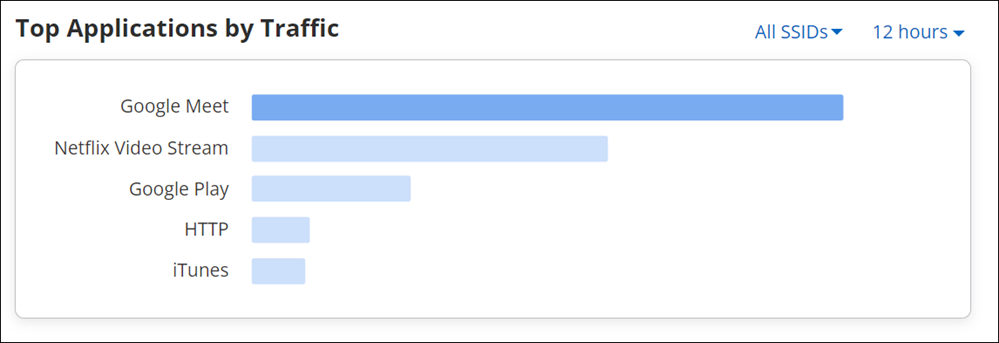
Top Applications by Traffic for an Access Point
Top Applications by Traffic chart graphically represents data usage for applications. It always represents data for top five applications that have highest data usage (transmit and receive). To view exact data usage, hover on the specific bar in the graph.
- 2 hours
- 4 hours
- 8 hours
- 12 hours
- 1 day
- 1 week
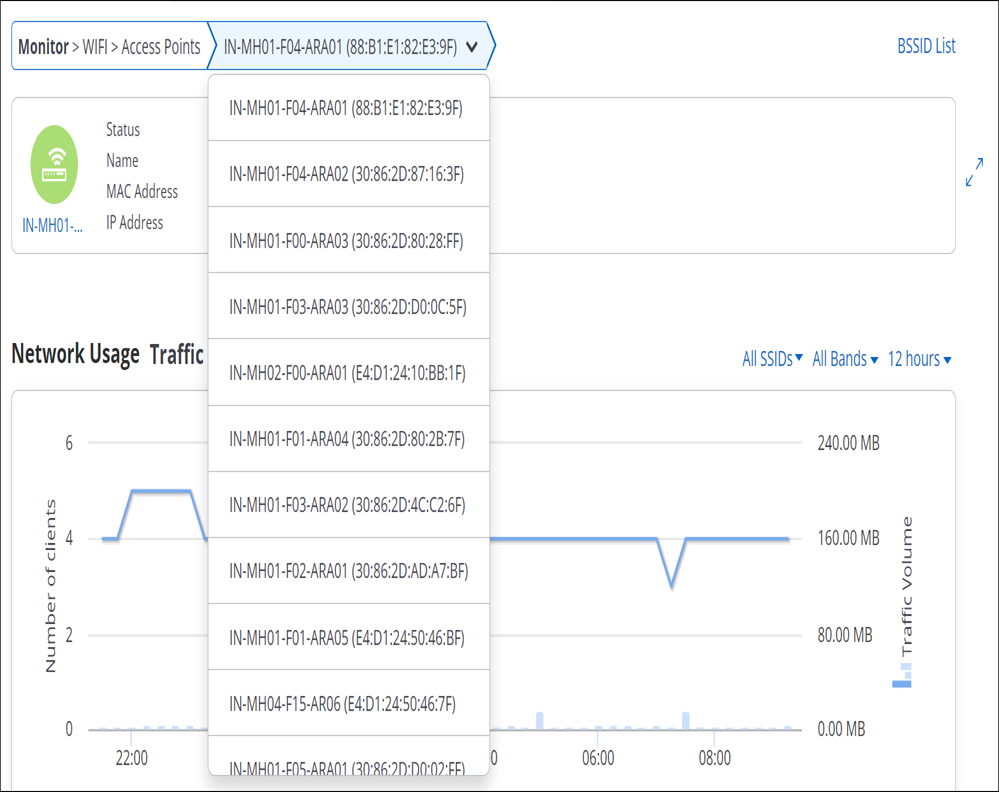
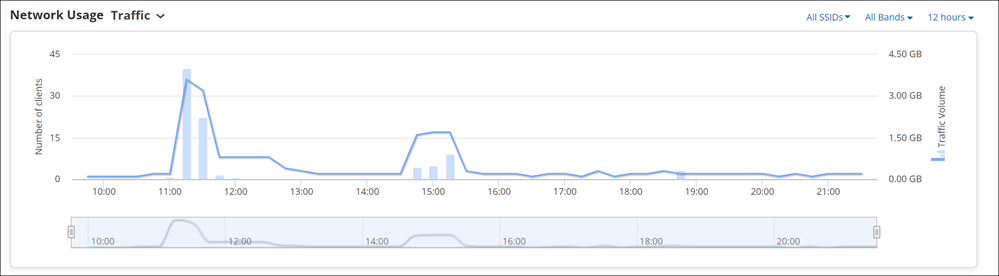
Network Usage
You can access the Network Usage chart in two different ways from CV-CUE UI. If you access the chart from the performance dashboard, it displays a line graph showing the number of clients associated with the SSID and its traffic volume, for all the clients on the selected folder or floor. Whereas when you access the chart through AP drill down, it displays similar data, but this time for the selected AP.
You can view or retrieve data using the filters. To know more about these filters refer Filters on Widgets.
The data of the network usage chart can be filtered based on two parameters; a client's data and the amount of data used by an application.
Drill down on the data point on the graph, redirects you to the page containing client connections table. This table contains the list of all the client connections along with their detailed information for the selected timestamp. For client details refer, Filtered Network Usage Chart.
- Client Connections table - contains the list of all the client connections along with their detailed information for the selected timestamp.
- Top Applications - that shows top ten applications with highest data usage. You can select an app from the drop-down list given on the top left corner of the table. Along with the selected application name it displays application specific data consumption.
- All Application traffic - it displays the total amount of data used by the applications for a selected Access Point or a location. This information is shown at the top-right corner of the table.
- Client Connections - selecting client connection displays the list of all the clients using the application selected from the top applications list.
- Access Points Distribution - selecting access points distribution displays the list of all the associated APs.
Network Usage - Poor Application Experience
This chart provides overall application usage analysis. It states the time for which application quality was good and the time for which it was bad.
The graph displays poor app experience in red color and good app experience in green color. X-axis displays time slots and Y-axis displays amount of time app quality was good or bad.
- Timestamp
- Number of associations
- Aggregated value for poor app experience in percentage.
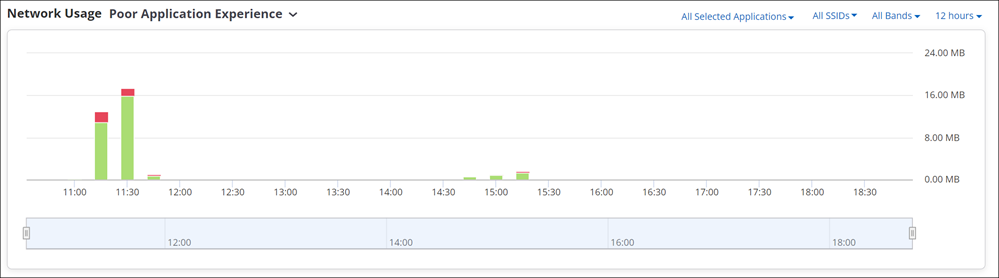
Click the data point or bar graph in the chart to view more details.
There are four filters provided on the right corner of the chart to filter the data:
Conferencing Apps Filter
- WebEx
- Skype
- GoToMeeting
- Hangouts
- Slack
- Microsoft Teams
- Zoom
SSID Filter
The application quality can also be viewed for specific SSID, using All SSIDs filter. Selecting a specific SSID provides a application quality graph for the specified SSID. Selecting All SSIDs provides an aggregated data on a graph for all the SSIDs.
Frequency Filter
- 2.4 GHz
- 5 GHz
- 6 GHz
- All Bands
Time Filter
- 2 hours
- 4 hours
- 8 hours
- 12 hours
- 1 day
- 1 week
Spectrum Occupancy
Channel Map
Channel Map displays the number of clients and Access Points (APs) visible to the managed device at a time on a given channel. Network administrators can use this information to identify congested or underutilized channels in a given band.
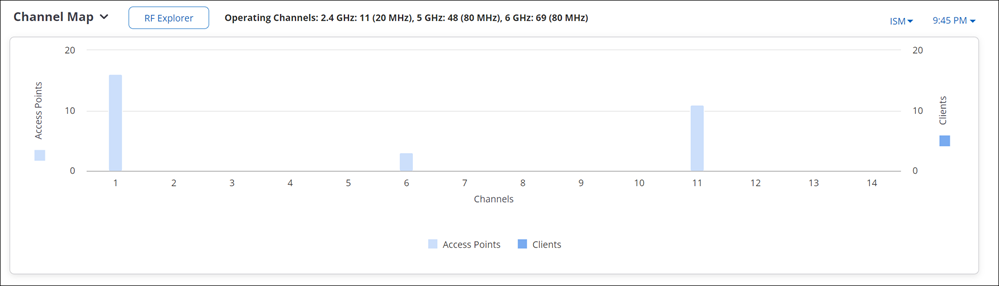
In the Channel Map chart, from the right-hand drop-down menu, select the band and use the time slider to select your time interval to view the number of visible clients and APs. You can view the Channel Map up to 12 hours in the past from the current time. Hover over the chart to view the exact count of APs and clients on a given channel.
RF Explorer
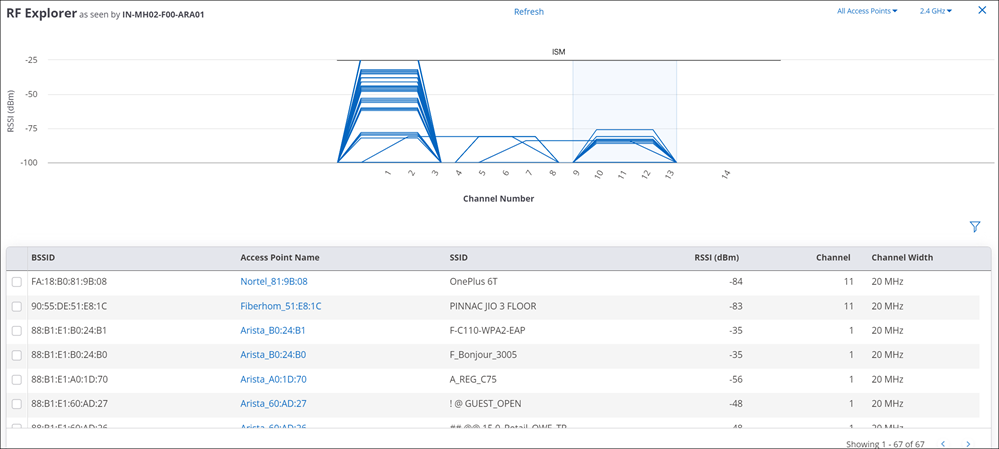
As seen in the previous figure, the RF Explorer shows you what an AP sees in its RF neighborhood. For example, it shows you the channels occupied by other APs in the vicinity of the AP and the RSSI values for each of the neighboring APs as seen by the AP.
You can use the RF Explorer to identify issues such as co-channel and adjacent channel interference, and DFS channels occupied by APs. The gray rectangle stretching across the RSSI axis represents the operating channel of the AP itself; the heights of the other channel trapezoids indicate the RSSI values of those channels as seen by the AP. You can click on an AP from the list of APs to see its channel details on the chart (as seen in the call-out in the previous figure).
Interference Classifier
One of the reasons why Wi-Fi clients encounter RF issues is non-Wi-Fi interference. All Wi-Fi 6 and above APs can perform interference classification. CV-CUE classifies interference into four categories — Wi-Fi, Microwave Oven (MWO), Frequency Hopping Spread Spectrum (FHSS), and Continuous Wave (CW).
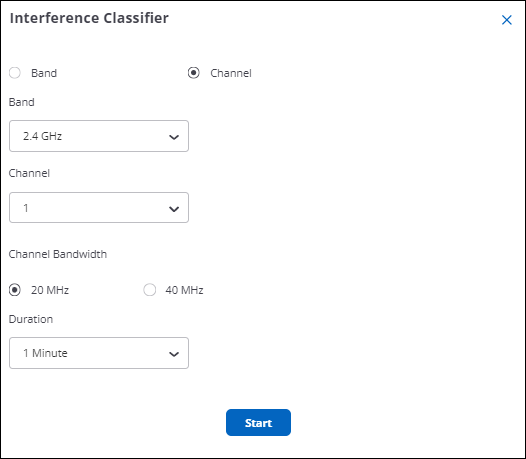
The interference classification opens in a separate tab. Hover your pointer over a data point to see more details about the interference source for a specific channel.
Channel Utilization
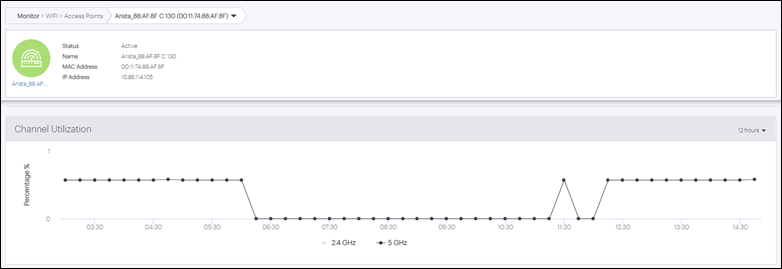
The channel utilization chart is available for 2.4, 5, and 6 GHz bands.
Access Point Health
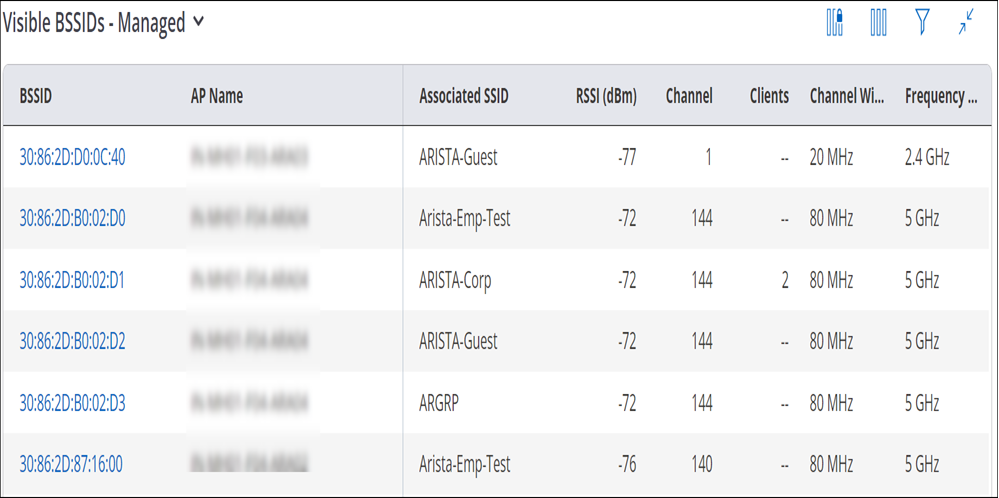
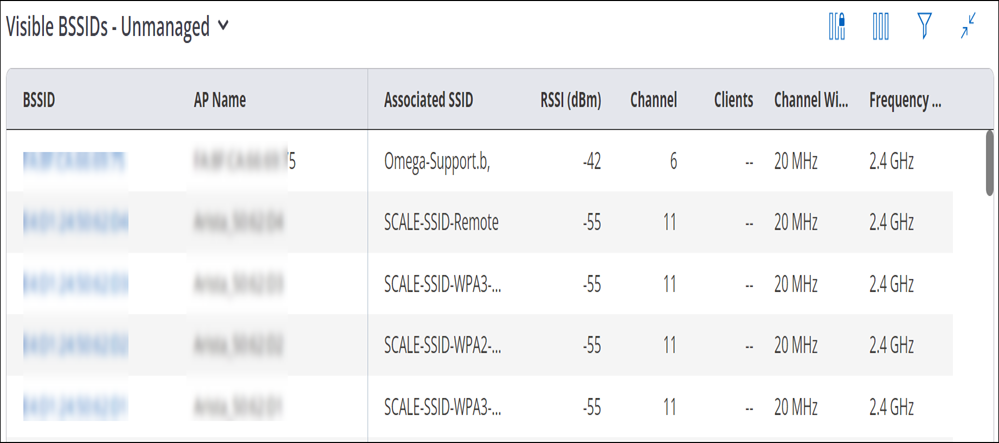
Visible BSSIDs
The Visible BSSID widget provides the list of the APs visible to the selected AP. The widget provides two different views: one for Managed BSSIDs and the other for Unmanaged BSSIDs.
Visible BSSIDs - Managed
Visible Access Points - Un-managed
Radios Seeing this Access Point
Visible VLANs
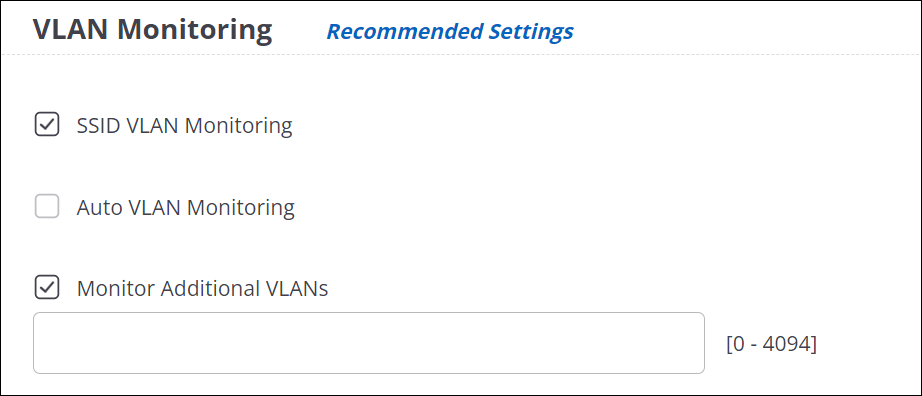
The visible VLANs widget is available on drilling down from any managed Wi-Fi device. The widget displays details of the VLANs visible to the managed device. "Monitored" in the Status column indicates that the VLAN is being monitored by that managed device. "Not monitored" indicates that it is being monitored by another managed device.
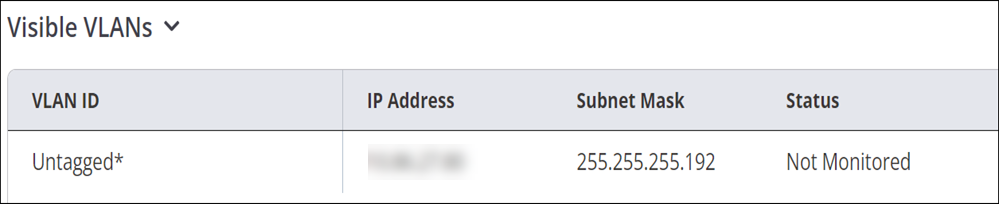
- If the VLAN is used by the device to communicate with the CV-CUE (aka communication VLAN); shown marked with an asterisk.
- If the ID of the VLAN is added while configuring the SSID.
- If you enable Auto VLAN monitoring from the active VLAN is monitored by the device with the highest MAC address.
Thus the monitored VLAN's ID is added to the monitoring device's list and the VLAN's status is set to Monitored.
- If you choose to enable Monitor Additional VLANs , one needs to specify a comma-separated list of VLANs to be monitored. In this situation, any active VLAN from the specified list is monitored. The device with the highest MAC address monitors the VLAN. The monitored VLAN's ID is added to the monitoring device's list and VLAN's status is set to Monitored.
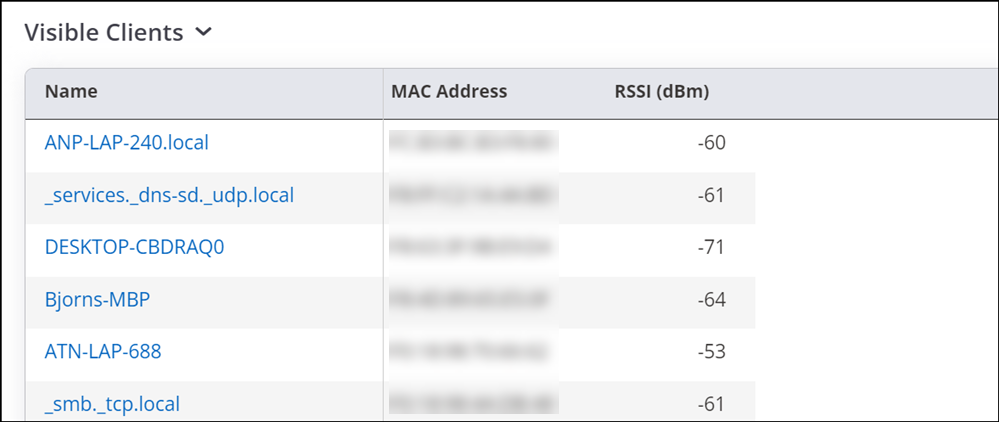
Visible Clients
The Visible Client widget provides the list of clients visible to the selected AP. It also provides the total number of visible clients on the top left corner of the widget.
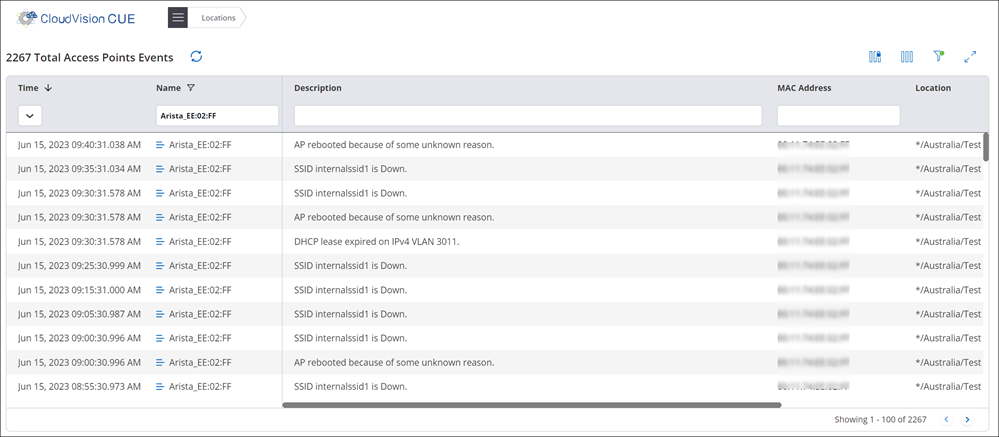
View Access Point Event Logs
AP event logs table maintain event logs of AP. The captured events are from an AP perspective and do not include data related to clients and their connectivity information. These events are sent by the AP to CV-CUE in real time.
To view AP event logs, right-click on an AP and select .
| Column | Description |
|---|---|
| Category | It is a category of event. |
| Type | It is a type of event. |
| Description | It is description of event. |
| Date | Timestamp at which event occurred. |
- AP Memory Status
- AP Reboot
- AP IP Conflict
- AP System Service Crash
- AP Ethernet Port Status
- AP Upgrade Failure
- AP Upgraded
- AP CLI config change
- AP DHCP lease status, etc.
View on Floor Map
View on Floor Map option redirects you to the location on the floor map where the AP is placed.
- Navigate to or
- Right click on the AP, you wish to locate on the Floor Map.
- Select Locate. These option is enabled only if the selected AP is placed on any of the floor maps. Else it is disabled.
Customize Transmit Power or Channel
Transmit Power Control enables you to control the transmission power of the AP. Transmit Control Settings are configured from Radio Settings. These settings are the generic settings for all the APs.
CV-CUE facilitates AP specific Transmit Control Settings.
To know more about Transmit Power Selection refer Configure Transmit Power Selection in Radio Settings and for Channel settings refer Configure Basic Radio Settings.
- Navigate to
- Right-click on the AP for which you want to customize the transmit power or channel.
- Select Customize Transmit Power or Channel.
- Select appropriate frequency for which you wish to customize the settings.
- Select Customize Transmit Power for transmit power settings. Select Auto or Manual option.
- Select Customize Channel Settings for channel settings. Select Operating Channel as either Auto or Manual.
- Click Save.
External Antenna Gain for Each Access Point
Antenna gain measures an antenna's effectiveness in sending and receiving signals. It doesn’t amplify the total radio signal strength but redistributes the signal in the desired direction to maximize signal coverage, reduce interference, and enhance network performance.
Customization of external antenna gain applies to Access Points (APs) with an external antenna. Other AP models do not support this feature.
Network Administrators can configure each supported AP with a custom antenna gain for improved network performance. External antenna gain can also be configured at a location level from Device Settings. The Device Settings configuration gets applied to all APs at that location.
Customize the External Antenna Gain
- Go to .
- Select an AP and select the three-dot menu to open the context menu operations.
- Select .
Figure 5. Customize Radio Settings 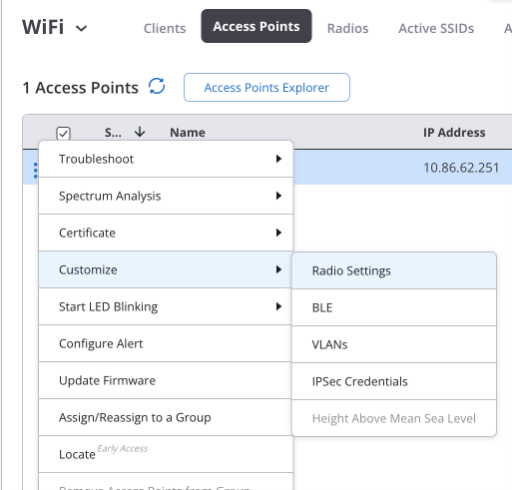
The Customize Radio Settings right panel opens.
- For each band, select the External Antenna Gain checkbox and provide your value. Enter a value between 0 and 25 dBi.
Figure 6. External Antenna Gain option 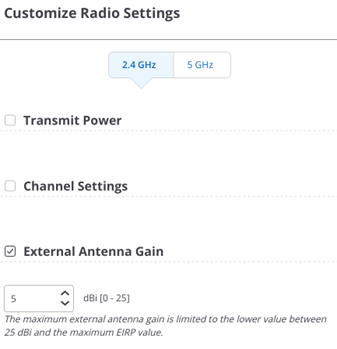
- Save the settings.
Conflict Resolution
If there is a conflict among location-level, group-level, and per-AP configurations, the per-AP configuration takes precedence over the others. The order of precedence is per-AP > Group > Location, where per-AP takes the highest precedence and Location takes the lowest.
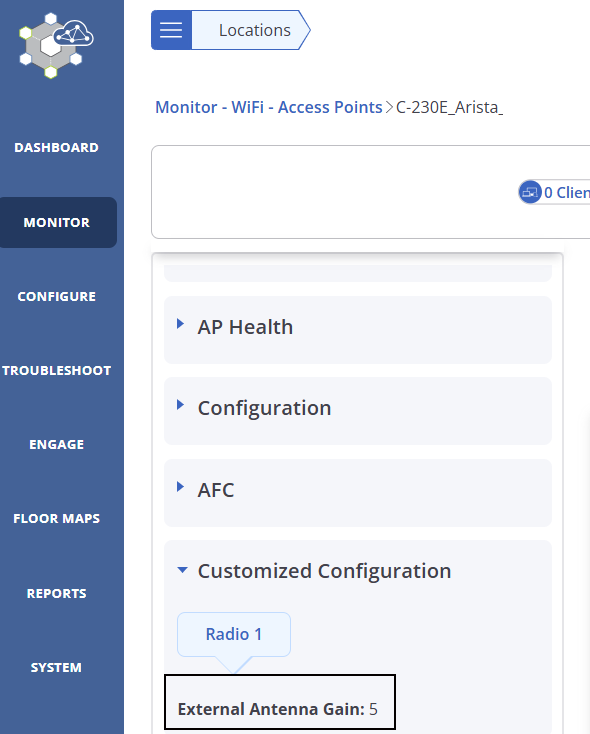
UI Verification
Verify the external antenna gain from the AP Details pane in . Expand the Customized Configuration section and view the External Antenna Gain parameter. You can verify the value for all the bands that you have configured.
Customize VLANs to Monitor per Access Point
- Go to or , or go to a floor plan and select an AP on the floor plan.
- Right click on the AP and click Customize > VLANs. The Customize Access Point VLANs right panel appears.
- Add the VLANs you want the AP to monitor. Detected VLANs are VLANs that the AP has detected on the network. They might help you select VLANs to monitor.
- Select whether you want the VLAN to use a Static IP or DHCP. For the Static IP case, enter the IP network configuration.
- Select a Communication VLAN from among the monitored VLANs. The AP communicates with the Wi-Fi server over the Communication VLAN. So the Communication VLAN must be one of the VLANs that the AP monitors.
- Save the configuration.
Move an Access Point
CV-CUE provides the facility to change the location of an AP using the Move option.
- Go to or
- Right-click on the name of the AP that you want to move and select Move.
- Select the new location, where you wish to move the AP.
- Click Move.
- Select appropriate option to confirm. If you select Yes, the selected access points will adopt the configuration applied at the destination folder. Also if the AP is currently placed on any of the floor map, then the AP will be removed from that map.
Behavior - Move Devices
When you move devices across locations, the behavior of the devices may change depending on multiple factors.
The factors to be considered are captured below.
- For devices that are not part of any group, the behavior is exactly as expected - when moved from one folder to another, these devices start using the default configuration of the destination folder.
- If the destination folder has no groups, devices from the source groups will be removed from their respective groups and all devices will start using the default configuration of the destination folder.
- For devices that were part of some group in the source folder, see the table below.
| Source | Destination | ||
|---|---|---|---|
| Is the device in a group? | Does the group have a config? | Is the same group available at the destination location? | Behavior |
| Yes | Yes | Yes | All devices become part of the destination group but retain their configuration. |
| Yes | Yes | No | All devices are removed from their respective groups and start using the default configuration of the destination folder. |
| Yes | No | Yes | All the devices are removed from their respective groups and become part of the destination group. They start using the configuration of the destination group. |
| Yes | No | No | All devices are removed from their respective groups and start using the default configuration of the destination folder. |
Reboot Access Points
You can reboot an AP, with the help of CV-CUE.
- Go to
- Right-click on the name of the AP that you want to reboot and select Reboot.
- Click Yes to reboot the AP.
Rename Access Points
You can change the name of the AP.
- Go to or
- Right-click on the name of the AP that you want to rename and select Rename.
- Change the name of the AP and click Done to save the changes.
Delete Access Points
You can delete the access points (APs) from the list of APs available on the Access Points tab.
Deleting APs from or deletes the BSSIDs (the properties) of the AP but doesn't remove the AP from the listing. To permanently remove the APs from the listing, unassign them from Arista Launchpad.
shows all the APs (BSSIDs) visible to the managed access points in the vicinity; the BSSIDs could be the Managed AP's BSSID, another managed AP's BSSID, or neighboring company's BSSIDs. Deleting the neighboring company’s AP removes it from the list. Deleting a Managed AP resets its properties but doesn't remove it from the AP list.
- Go to or
- Right-click on the name of the AP that you want to delete and select Delete.
- Click Yes to confirm the deletion.
Important: If the AP is physically active on the network after deletion, then:
- CV-CUE marks the AP to the Unknown location.
- The default Device Settings of the Unknown location is applied.
- The default SSIDs are pushed to the active AP, if the AP is configured in the Device Settings.
- SSIDs are not applied, if the AP is not configured.
View Ongoing Activities on Access Point
View Ongoing Activities is an action available on Access Points screen.
- In CV-CUE navigate to Access > Access Points.
- Click on View Ongoing Activities action present on the top right hand corner of the screen.
- From the drop-down menu, select one of the following:
Choose From:
- Packet Trace: It displays the list of APs with their information on which the Packet Trace Activity is in progress.
- Prevention: It displays the list of APs in quarantined status.
- None: It displays the list of APs on which no activity is going on.
View Access Point Uptime
Access Point (AP) Uptime indicates how long the AP has been up and running. To view AP Uptime, navigate to The Last Booted At column shows the AP Uptime.
Assign a Device to a Group
You can assign one or more access points from a location subtree to a group. It is a method used to apply a single Wi-Fi configuration to multiple devices across different locations. If a group has no configuration, then the assigned devices will use the default Wi-Fi configuration of their respective locations. On the other hand, suppose an AP already has custom Wi-Fi configuration applied to it. Then if you assign such an AP to a group it will start using the Wi-Fi configuration of the group.
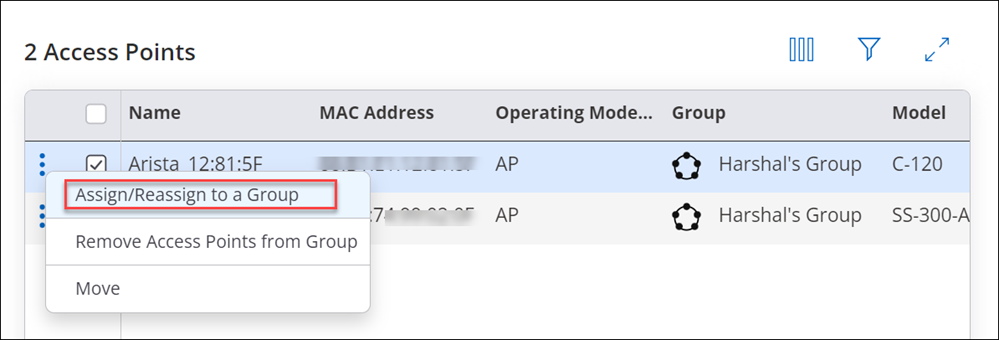
Assign a Device to a Group from Access Points tab
One of the ways to assign access points to a group is from the access point list available on the access point page.
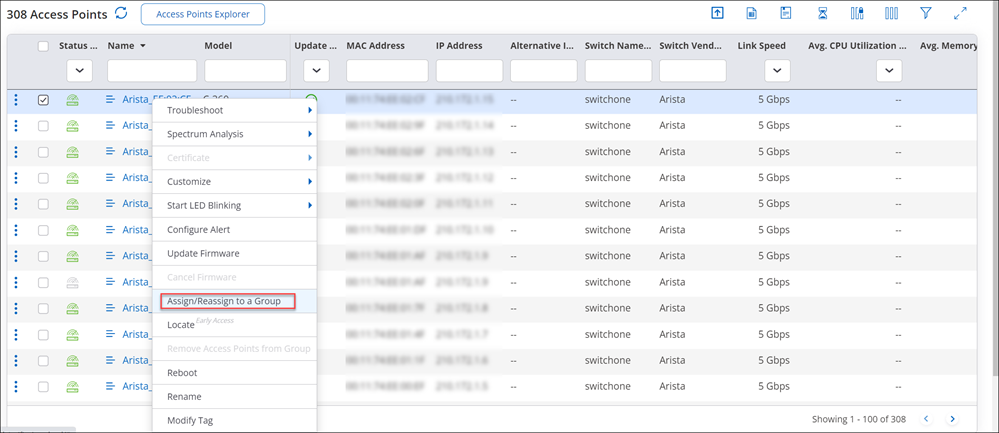
- Go to
- Right-click on the name of a single AP, that you want to assign to a group or click on the menu icon (three vertical dots) and select Assign/Reassign to a Group.
- Select the group to which you want to assign the selected AP.
If the group is not available in the list, you can add a new group from this panel. The newly added group will always be created at the top-most allowed folder of the selected locations. Adding a group option is disabled, if the user does not have access to the folder.Note: When assigning multiple APs, only those groups which are available to the selected access points' folders will be listed under the Select a Group panel.
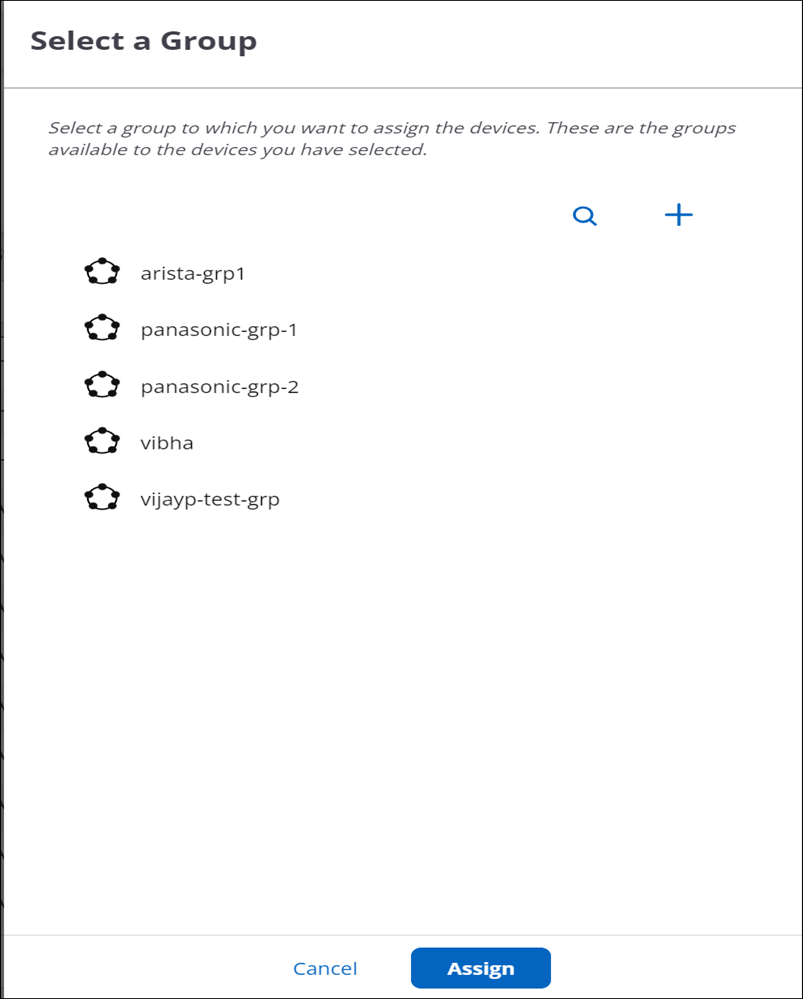
- Click Assign.
Assign a Device to a Group from the Folders/Floors Page
In addition to assigning a device to a group from access point’s page, you can also do this from the folder/floor page.
- Go to
- Right-click on the name of a single AP that you want to assign to a group or click on the menu icon (three vertical dots) and select Show Available Devices option from the list.
- Right-click on the name of a single AP that you want to assign to a group or click on the menu icon (three vertical dots) and select Assign/Reassign to a Group.
- Select the group to which you want to assign to the selected AP.
Info:In case, the group is not available in the list, you can add a new group from this panel. You cannot add a group if you do not have access to the top-most allowed parent folder. The newly added group will always be created at the top-most allowed parent folder of the selected locations.
- Click Assign.
Re-assign a Device to Another Group
This operation allows you to move the access points from one group to another. Once reassigned, selected access points will start using target group's Wi-Fi configuration. If the target group does not have Wi-Fi configuration applied to it, access points will use their location's default Wi-Fi configuration. Even if the selected access points were not assigned to any group, reassigning will assign them to the target group.
The first two methods are the same as for assigning a device to a group. The third one is applicable only to re-assigning devices.
- Go to
- Right-click on a selected group and select Show Assigned Devices.
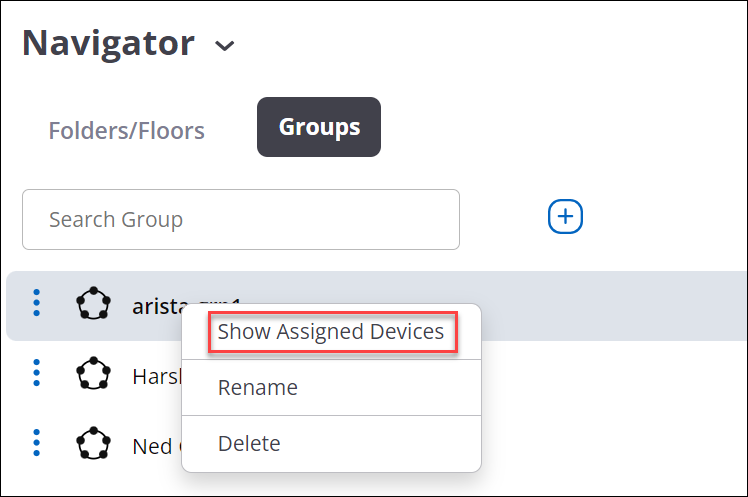
- Right-click on the name of the AP you want to reassign and click Assign/Reassign to a Group.
- Select a group from the list to re-assign that device to the selected group.
About Device Firmware Update in CV-CUE
You can configure an automatic update that includes upgrade or downgrade of Arista devices deployed at your enterprise premises. The device update can be configured or scheduled for devices that connect to the server for the first time as well as for existing devices that are already placed at various locations.
A device firmware update configuration is specific to a location and applies to all Arista devices placed at the location. An individual Arista device cannot have an independent device firmware update configuration.
A device firmware update configuration can be created for location folders only. A location floor cannot have its own device firmware update configuration; it inherits the device firmware update configuration from the parent location folder. When you do not recursively apply a device firmware update configuration to the child location folders, the configuration is applied only to the selected location folder and the location floors directly under the selected location folder.
You can choose to apply a device firmware update configuration recursively to the child location folders, when you are creating or editing the device firmware update configuration, However, a child location folder can have its own device firmware update configuration. If you define the firmware update configuration specific to the child location folder when a schedule for its parent location folder is already defined, the schedule configured to the child location applies to the child location folder
When an active schedule is deleted or modified for a location, the sensors of that location on which the update process is already started or the update command is scheduled would still be upgraded.
The device firmware update setting for a location applies to all active devices deployed at the location. The update can be applied to both existing Arista devices and new devices connecting to the Arista Server for the first time. A schedule can be configured for existing Arista devices at a location. The device firmware update configuration is not tied to release numbers. If a server is updated multiple times between the creation of the update configuration and scheduled time of device update, the devices are updated to the latest firmware release.
Update AP Firmware
You can update the firmware on the AP to the latest or any previously released version. The AP automatically reboots after the firmware update is complete.
- Go to
- Click the Options icon (three vertical dots) or right-click on the name of the AP and select Update Firmware.
- Select the required firmware version from the Version drop-down list.
- Click Update.
Update Firmware for Multiple Access Points
You can update the firmware for multiple APs at the same time.
- Go to
- Select the required APs, click the Options icon (three vertical dots) and click Update Firmware. Update Firmware page is displayed as follows:
- The model names of the selected APs.
- Number of access points selected for each device model.
- Version, drop-down list that contains the available firmware versions for each device model.
- Select the required version number per AP model, from the Version drop-down list.
- Click Update to update the firmware.
Schedule Firmware Update of a Single AP
- Go to
- Right click the AP and select Update Firmware.
- Select the version from the right panel.
Schedule Firmware Update of Multiple Access Points
- Go to
- Click Update under Firmware Settings icon.
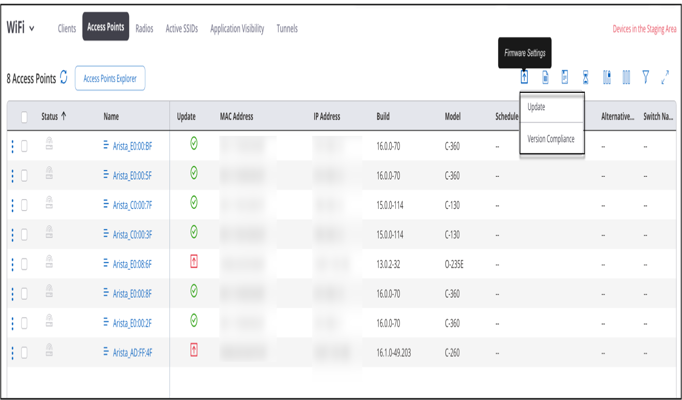
- Provide the schedule for update in the Firmware Update Settings right panel.
The following table provides additional information for some of the options the Firmware Update Settings panel:
Table 1. UI Option Description Apply Update Settings Recursively to Subfolders Applies the update settings to the selected folder location and also to all its subfolders, if any. Hitless Update Updates access points with minimum impact to Wi-Fi clients. In certain situations, when the selected AP is the only AP on the floor and there are no APs around for clients to connect, then the Wi-Fi will be impacted. Update Window Defines the duration for the firmware update. For example, if the Start Time is 1 hour 15 minutes and the Update Window is 20 hours 30 minutes, then the update will begin at 1:15 AM and end at 9:45 PM. Firmware updates are not initiated after the expiry of the Update Window. However, ongoing updates during the Update Window can continue even after the Update Window expires.
Cancel Firmware Update
You can cancel the firmware update for an AP. When an update is initiated for an Arista AP, the AP is initially in Active state and changes to Inactive state after a while. You can cancel the update only until the Arista AP is in Active state. Once the device is in Inactive state, you cannot cancel the firmware update.
- Go to
- Right-click the AP for which you want to cancel the firmware update and select Cancel Update.
- Click Yes to cancel the update.
Configure Firmware Version Compliance
Organizations may have multiple access points (APs) of different models operating with various firmware versions. As an organization, you may want to designate a specific version as a compliant firmware version for a certain model. Assigning a compliant firmware version helps network administrators identify non-compliant AP models by generating notification alerts.
Firmware Version Compliance is a location-based setting and is applicable for all access points placed at the location.
Note:Configure the firmware version compliance before you update the AP firmware version.
Assign a Compliant Firmware Version
- Select
- Select
- Select the Compliant Version checkbox.
- Select one of the two options:
- Latest Version for all Models: Indicates that the latest firmware version is the compliant version across your organization. CV-CUE will raise an alert if any AP model doesn’t have the latest firmware version.
- Customize: Specify the AP model number and the firmware version you want to standardize across your organization. After you have made the selection, if any AP doesn’t have the compliant version, CV-CUE will raise an alert.
- Save the settings.
Configure Alerts
The compliant firmware detection alert notifies you whenever CV-CUE detects non-compliant firmware. To configure alerts for compliant firmware, go to and select Access Point with non-compliant firmware version detected.For more information on this alert, refer to Configure System Alerts
Access Point Web Shell
Web Shell is an online interface to remotely log into an access point (AP) via SSH. An administrator or a superuser can open Web Shell for a specific AP from CV-CUE. Web Shell is helpful to troubleshoot AP issues, especially if an AP is behind a NAT. The URL for the Web Shell is specific to an AP. You can bookmark the URL to open a shell session to the AP directly instead of opening the shell session from CV-CUE.
For the list of APs supporting Web Shell, see the Access Point Feature Matrix article.
- Floor Plan
Open Access Point Web Shell
You can open the Access Point (AP) web shell from CV-CUE for an individual AP and perform basic operations using CLI commands.
- Got to .
- Right click the AP and go to .
Web Shell opens in a new tab.
- Enter the root credentials and log in to the web shell.
You can now type your AP-CLI commands.
To terminate the session, close the browser.
Custom Certificates for Access Points
Manage custom certificates and CA certificates for access points from a central location.
Access points (AP) can authenticate themselves to the network using respective certificates. With AP VPN, an AP uses the EAP-TLS protocol for authentication. Since EAP-TLS requires the client and network to authenticate themselves using respective certificates, the protocol is considered robust compared to exchanging shared secret and Xauth password. Therefore, the AP VPN solution requires the AP to use a unique certificate per AP or per tunnel. APs can use the default certificate or a custom certificate for the authentication.
Caveats
- You can upload the Device and CA certificate in the PEM encoded format.
- You can upload a certificate with a maximum of five CA chain length.
- You need to upload the device certificate and root CA chain separately at two different places.
- When you regenerate a CSR, the existing certificates on the APs are not deleted until the new signed certificates are installed on the AP.
Certificate Flow Overview
High level process flow for managing certificates.
- Generate CSR.
- Create a new tag and assign it to a CSR from the global certificate menu. Note that you cannot create a new tag for an individual AP.
- Use an existing tag to generate a CSR. You can use an existing tag for an individual AP or for all APs.
- Download the generated CSR and get it signed manually/offline.
- Upload Device Certificate.
- Upload CA Certificates.
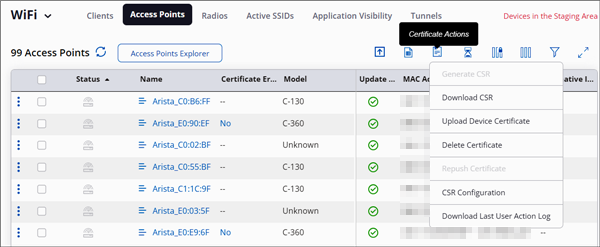
Certificate Actions and Tags
Describes different actions available for certificates from the global toolbar as well as per AP.
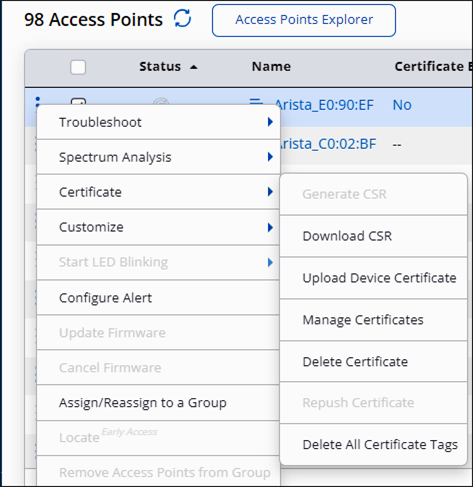
You can take actions related to certificates for each AP or for all the APs seen in the Monitor > Access Points tab. When you use the global menu to perform your certificate-related actions, it applies to all APs in that location. For individual APs, you can perform the certificate actions from the three-dot menu per AP.
Certificate Tags
Each certificate must have a tag associated with it. Typically, you assign tags for a specific function or you could keep a generic tag and use it for all purposes. For example, you could use a tag named IPsec and assign it to all the APs that use the IPsec protocol. You can also use a tag named Generic and use it for all purposes. This makes handling of certificates easier through tags. Note that after you update the certificate, you still need to manually upload the new certificates to APs.
You can create a new tag from the global certificate actions only. You cannot create a new tag for an individual AP.
CSR Configuration
Configure CSR properties for access points.
CSR Configuration allows you to configure CSR properties for your AP. This is a location-based configuration.
- Go to
- Click the Certificate Action button from the global toolbar and click CSR Configuration.
- In the right panel, provide the values for each field.
Figure 11. CSR configuration
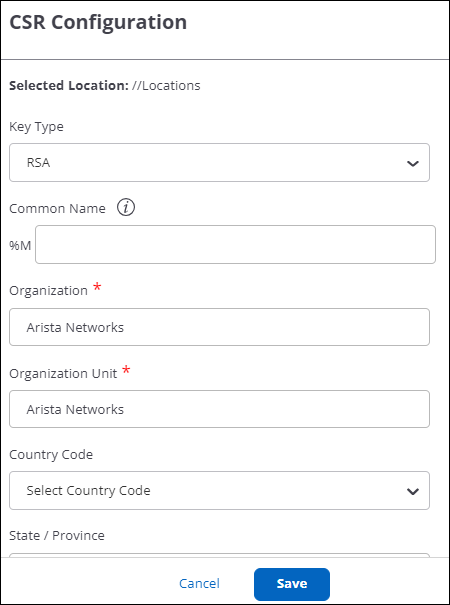
- Save the configuration.
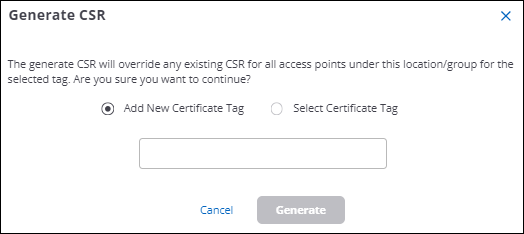
Generate CSR
Generate CSR for your access points.
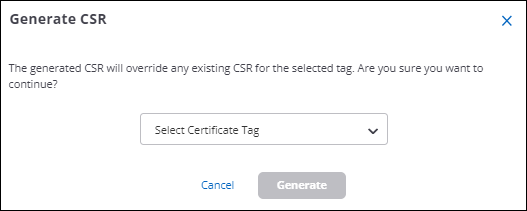
You can generate CSR for individual APs or all the APs at the selected location. When you generate CSR for all the APs, you can create a new tag and assign it to the CSR. However, if you generate a CSR for an individual AP, you cannot create a new tag. You have to use an existing tag.
- Go to .
- Click the Certificate Action button and click Generate CSR.
- Assign a new tag or use any existing tags if you have.
Figure 12. Add new tag and generate CSR
- Click Generate.
Manage Certificates
Manage certificates for each access point.
You can see all the certificates for a location from the Manage Certificates page. It is a per-AP feature. Right-click an AP, then click . You can view the current status of certificates based on the tags. Refresh the page to get the latest certificate status.
- Generate CSR
- Download CSR
- Upload Device Certificate
- Delete Certificate
- Repush Certificate
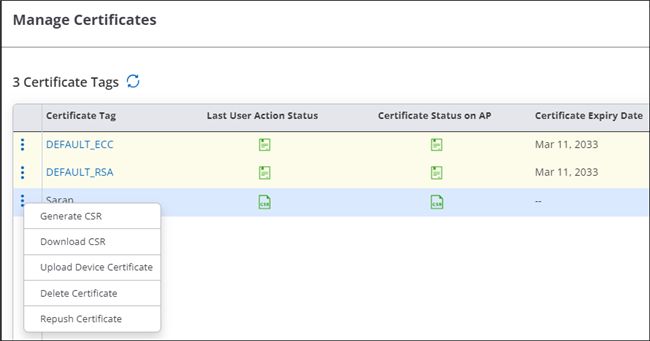
The Last User Action Status column shows the latest action performed by the user. For example, if you regenerate the certificate, this column shows the status of your action. The Certificate Status on AP column shows whether the AP already has a certificate or if it’s in the process of obtaining a certificate.
The actions on the Manage Certificate page are already associated with a tag. Therefore, you do not have to provide a new tag when you perform any action from this page.
Upload Device Certificate
Upload device certificate for one or all access points.
After the certificates are signed by the signing authority, you can upload the device certificate either from the global toolbar or individually for each AP. You must upload the device certificate first before uploading the CA certificates.
- Go to .
- Select the APs for which you want to upload the signed certificates.
- Click the three-dot menu and click .
Figure 14. Upload certificate for a single access point
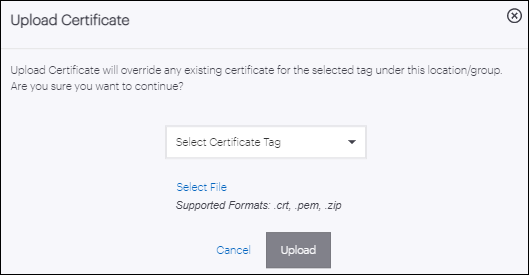
- Select the certificate tag and click Upload.
Upload CA Certificate
Upload CA certificate in Advanced Settings.
You can upload the CA certificates from the global settings and the CA certificates get automatically applied to the respective APs that have the device certificate installed.
- Go to .
- Click Upload CA Certificate.
Figure 15. Upload CA certificate
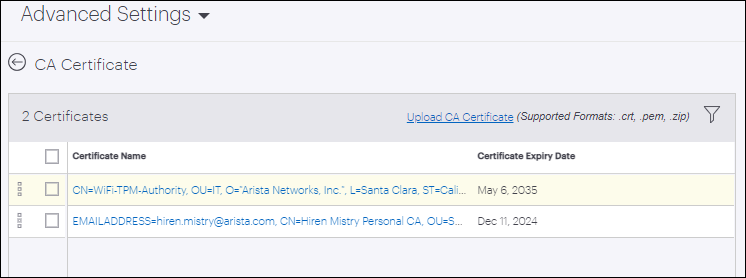
- Select the certificate or the certificate chain zip file from your local drive.
- (Optional) Select a certificate and click the three-dot menu icon to Delete or Download the CA certificate.
- (Optional) Click the certificate to view the certificate details in the right panel.
Note that the default certificate is grayed out and you cannot delete it.
Delete Certificate
When you delete a certificate, the tag is also deleted from the AP. When you delete certificates from an AP, you delete both the device certificate and CA certificates associated with the respective tag.
- Go to .
- Select the APs for which you want to delete the certificates.
- Click the three-dot menu and click .
However, if you want to update a certificate and not delete it, you can use the Upload option and it will update the certificate.
Repush Certificate
Repush a certificate to reupload an existing but corrupt certificate.
When you repush a certificate, the server tries to reupload the device and CA certificates to the AP. Use this option when the AP malfunctions and stops associating with the installed certificates.
When you initiate the Repush action, the server automatically identifies the certificate that was previously available and tries to reinstall the certificate. Note that when you delete a certificate from an AP, the Repush action will not be effective to reinstall the certificate. You need to manually reupload certificates then.
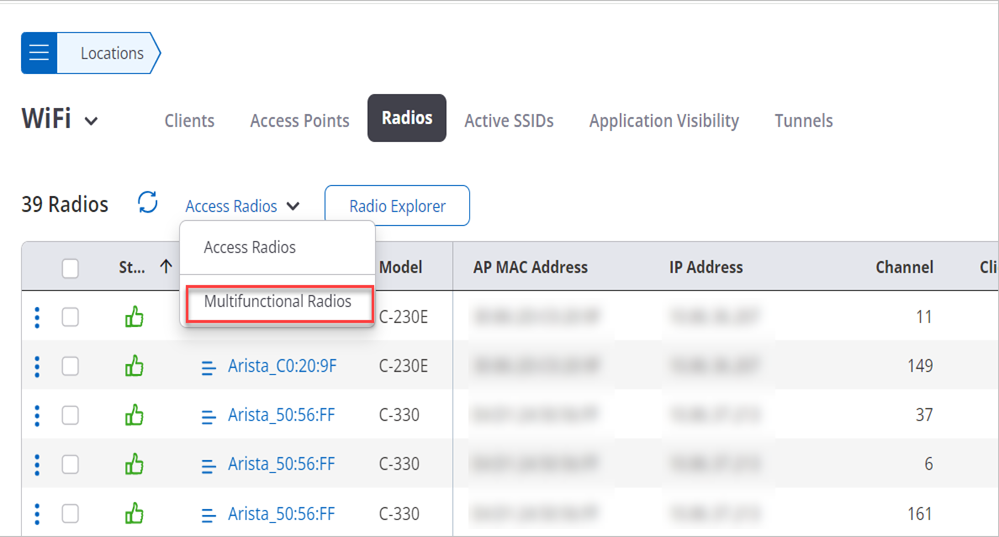
Radios
The Radios tab under MONITOR tab has Access Radio Grid and Multifunctional Radio Grid.
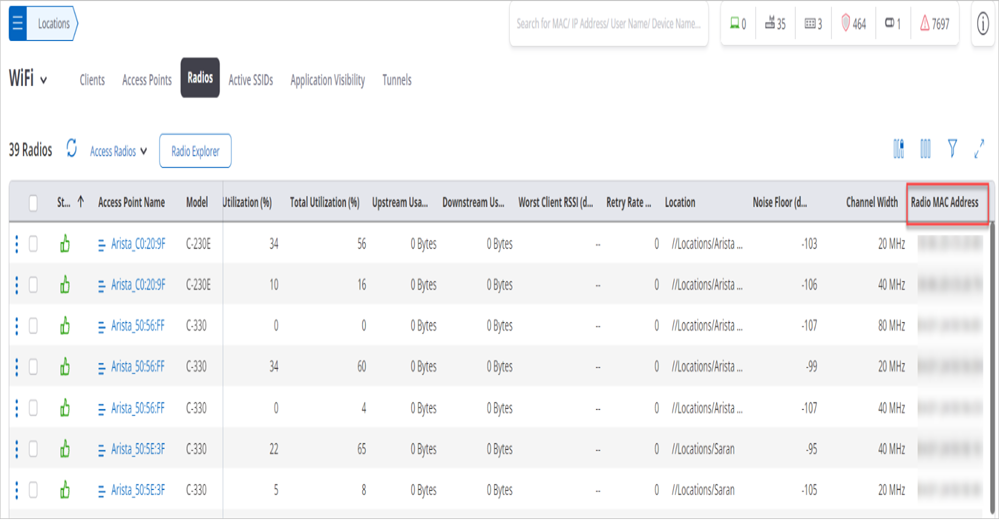
Access Radio Grid
Access Radio Grid contains a list of all the radios operating on 2.4 GHz, 5 GHz, and 6 GHz bands. It displays a list of clients that are recently associated to the selected Radio. The recent associations are either those that happened in the last 4 hours or the latest 100 clients. This is the total number of associations in the system and not per device.
| Field | Description |
|---|---|
| Status | Indicates whether the radio is on or off. |
| Access Point Name | Name of the AP. |
| Channel Width | Displays the width of the operating channel of the radio such as 80 MHz or 40 MHz. |
| MAC Address | Unique 48-bit address of the AP. |
| IP Address | Displays the IP address. |
| Device Template | Indicates the device template applied to the device. |
| Channel | Displays the Channel number on which the AP radio operates. |
| Clients | Displays the number of clients connected to the radio. |
| Tx. Power(dBm) | Indicates the transmission power. |
| Frequency | Indicates the frequency on which radio is operating. |
| RF Utilization (%) | Indicates the percentage of transmit and receive time on the radio. |
| Upstream Usage | Indicates upstream data usage. |
| Downstream Usage | Indicates downstream data usage. |
| Worst Client RSSI (dBm) | Displays the worst client signal strength. |
| Retry Rate (%) | Indicates the re-transmission rate in percentage. |
| Location | Displays the radio location. |
| Model | Displays the name of the device model. |
| Noise Floor (dBm) | Indicates the measure of the signal created from the sum of all the noise sources and unwanted signals within a measurement system. |
| Channel Width | Shows the width of the operating channel of the radio. |
| Radio MAC Address | Displays the MAC Address of the radio. |
Multifunctional Radios
Multifunctional radios are radios present on Arista APs that do not broadcast SSIDS. Multifunctional radios can be used to perform actions such as Client Connectivity Tests (CCT), Packet Capture, Spectrum Analysis, etc.
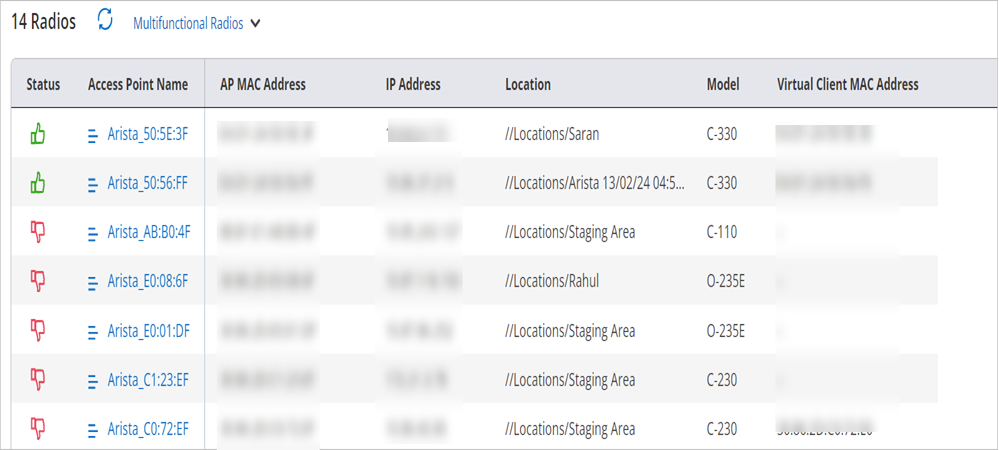
| Field | Description |
|---|---|
| Status | Indicates whether the radio is on or off. |
| Access Point Name | Name of the AP on which the radio is present. |
| IP Address | Displays the IP address of the AP on which radio is present. |
| Location | Displays the location of the AP on which the radio is present. |
| Model | Displays the AP model of the connected radio. |
| Virtual Client MAC Address | Virtual MAC Address used by the radio to connect as a client to another AP while performing Client Connectivity Test. |
Turn Radio On or Off
You can turn individual Access Point (AP) radios on or off. To understand the motivation for this, consider a floor where Wi-Fi APs with both 2.4GHz and 5GHz radios are deployed. Since the 2.4GHz signal propagates better than 5GHz and APs are often deployed to provide high 5GHz RSSI all over the floor, some areas on the floor end up having an “excess” of 2.4GHz signal, i.e., these areas get high RSSI signal from multiple 2.4GHz AP radios. This could cause interference in those areas because the 2.4GHz band has only three non-overlapping channels. You can then simply turn off the 2.4GHz radio for APs near these high 2.4GHz interference spots on the floor.
- The AP is active and
- The radio is not part of a mesh network.
- Select the location of the AP whose radio you want to turn on or off.
- Go to Monitor > WiFi > Radios.
- Right-click on the radio and select Turn Radio Off or Turn Radio On.
Note:
- When you turn a radio off, all SSIDs on that radio are turned off. For uninterrupted Wi-Fi in the coverage area of an AP, make sure that at least one AP radio is on.
- Turning a radio on or off can take a few minutes; the radio appears in italics until its status has changed, after which the UI shows the updated status—on or off, as the case may be.
- A radio that has been turned off manually is not turned on automatically when its AP reboots or when an SSID of that AP is scheduled to be on.
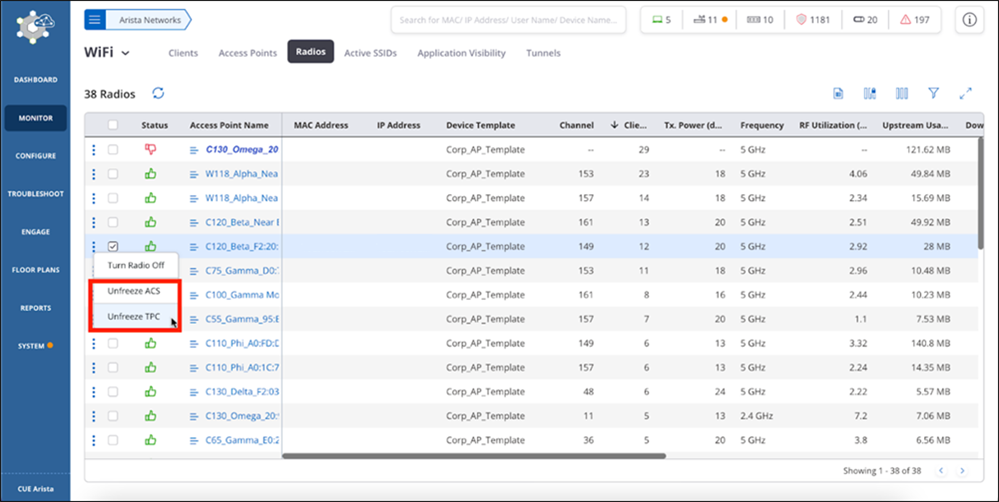
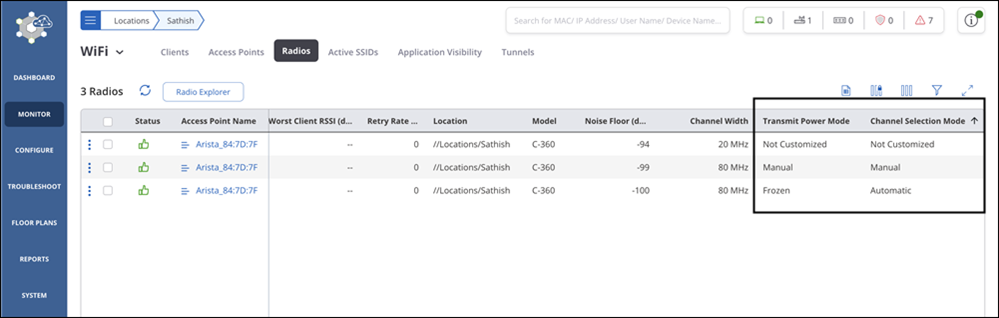
Freeze and Unfreeze Transmit Power Control and Auto-Channel Selection
Use Case
When you customize the Transmit Power and Channel Settings, and select the Auto mode, you let the access point decide and select the best channel and transmit power according to the current conditions. The AP reviews the channel and transmit power periodically and depending on the conditions, it may change the channel and power to best suit the existing conditions. For operational needs, you may want to freeze the channel and transmit power in the Auto mode. The Freeze ACS and Freeze TPC options let you easily achieve this result.
- Navigate to
- Select the radio of the access point and click the three-dot menu to open the context menu.
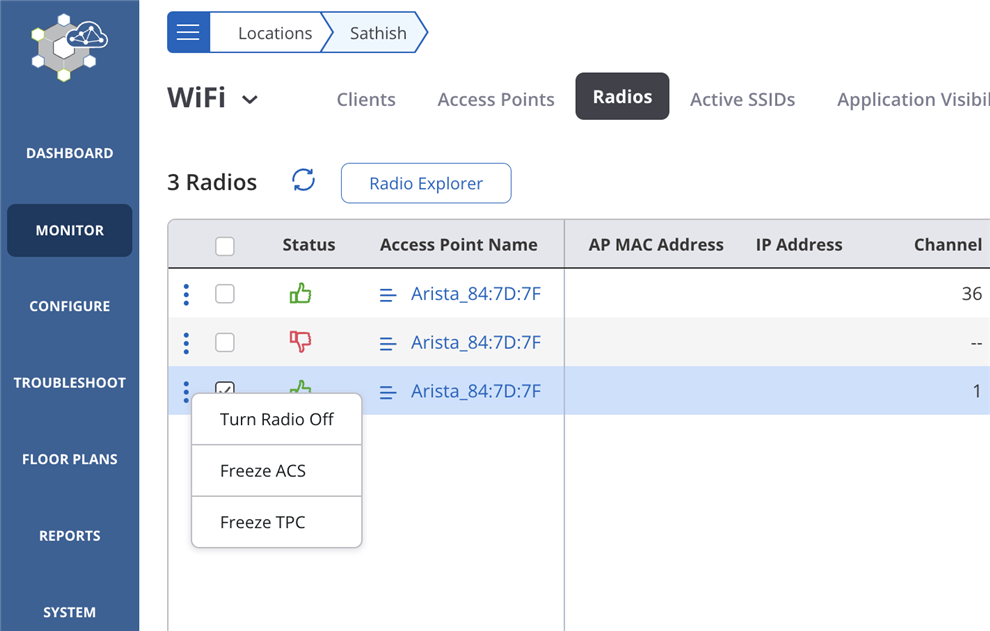
- Select Freeze ACS or Freeze TPC.
- Click Confirm in the confirmation dialog box.
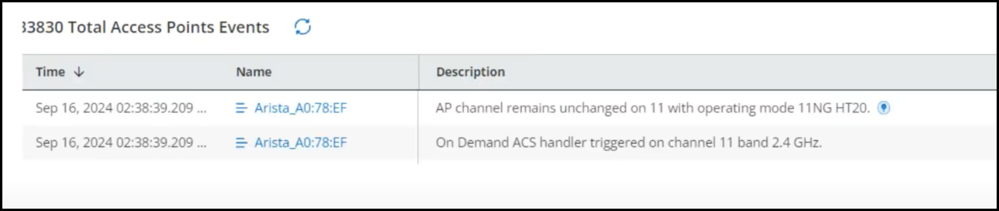
On-Demand Transmit Power Control and Auto-Channel Selection
You can trigger ACS and TPC only when you have enabled the Auto option. Both these options do not work in the Manual mode.
Note: Trigger ACS and Trigger TPC work even if ACS or TPC is in freeze mode.
Use Case
When you customize the Transmit Power and Channel Settings, and select the Auto mode, the access point decides and selects the best channel and transmit power according to the current conditions. When you are facing high interference in your network, Triggering ACS and TPC allows the AP to review the channel and transmit power and change the channel and power to best suit the existing network conditions. Network administrators can use this functionality to switch to the best conditions without changing network configurations.
- Navigate to
- Select the radio of the access point and click the three-dot menu to open the context menu.
- Select Trigger ACS or Trigger TPC.
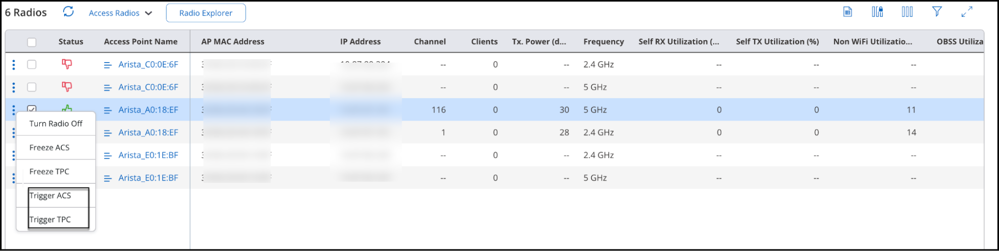
- Click Confirm in the confirmation dialog box.
Active SSIDs
The Active SSIDs page displays a list of active SSID profiles.
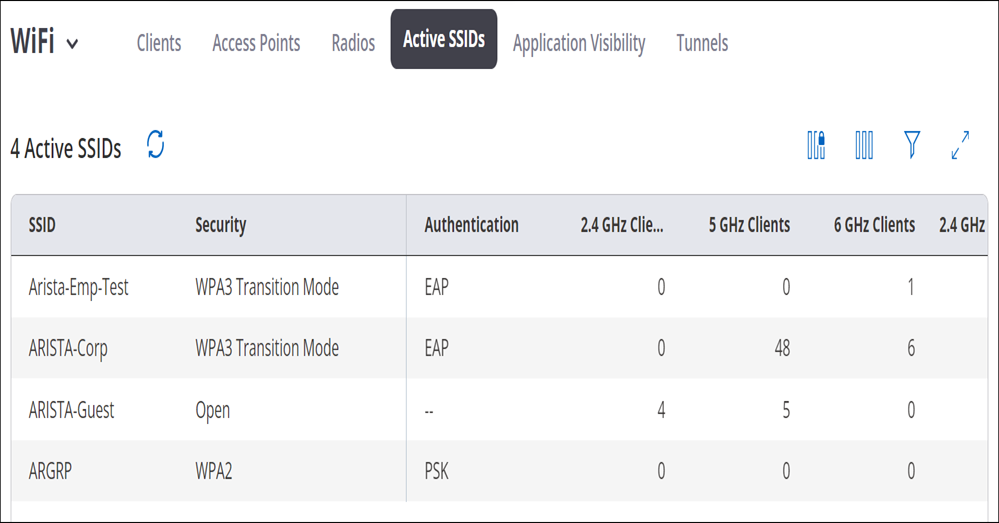
| Field | Description |
|---|---|
| SSID | Name of the SSID profile. |
| Security | The mode of security used. |
| Authentication | The authentication method used. |
| 2.4Ghz Clients | The number of clients connected on the 2.4 GHz frequency. |
| 5 GHz Clients | The number of clients connected on the 5 GHz frequency. |
| 6 GHz Clients | The number of clients connected on the 6 GHz frequency. |
| 2.4 GHz Radios | The number of 2.4 GHz radios on which the SSID is being broadcasted. |
| 5 GHz Radios | The number of 5 GHz radios on which the SSID is being broadcasted. |
| 6 GHz Radios | The number of 6 GHz radios on which the SSID is being broadcasted. |
| Uplink Data | The uplink data usage. |
| Downlink Data | The downlink data usage. |
Application Visibility
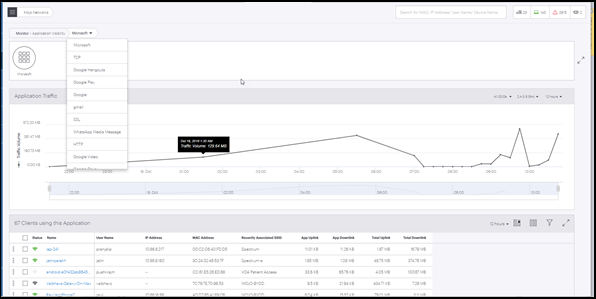
Application information page provides detailed monitoring information for an application selected from the Application Visibility tab. It displays a list of top 10 clients using the selected application and a line graph plotting the usage of the selected application over a period of time.
The application information page displays the following information:
- Baseline - Clients Affected
- Baseline - % Poor Application Experience
- Application Traffic: It displays the usage of data of the selected application, over a period of time. Refer Application Traffic section for more information.
- Application Traffic - Clients
- Application Traffic - Sessions
- Application Traffic - Quality of Experience
- Clients Using This Application: It displays a list of the top 10 clients with highest data usage for the selected application along with the detailed information of the client like Username, MAC address, IP address, Recently Associated SSID and so on. Refer Clients Using This Application section for more details.
Monitoring an Application
You can monitor an application, from the list of applications that are displayed in the Application Visibility tab.
- Go to
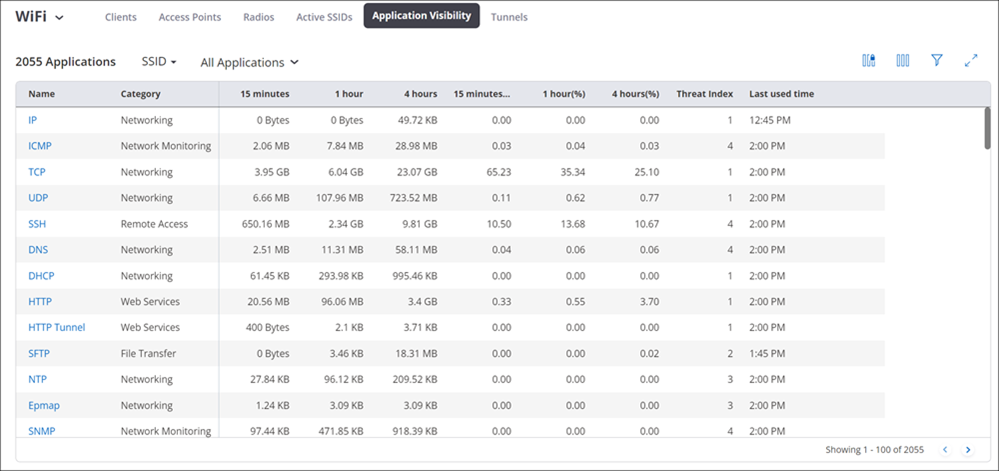
- Click on the name of the application that you want to monitor. A page providing detailed application information is displayed as follows:
- Top 10 clients using the selected application. Refer to Clients with Most Application Traffic for more details.
- Application Data Usage Over Time. Refer to Application Traffic for more information.
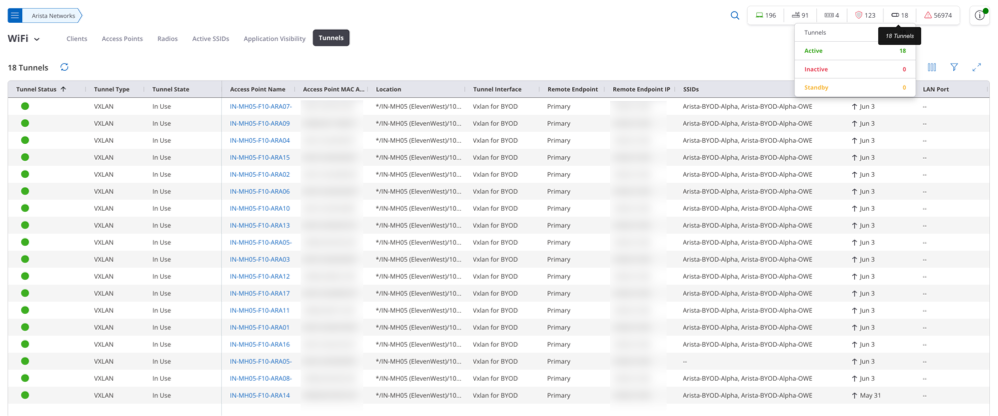
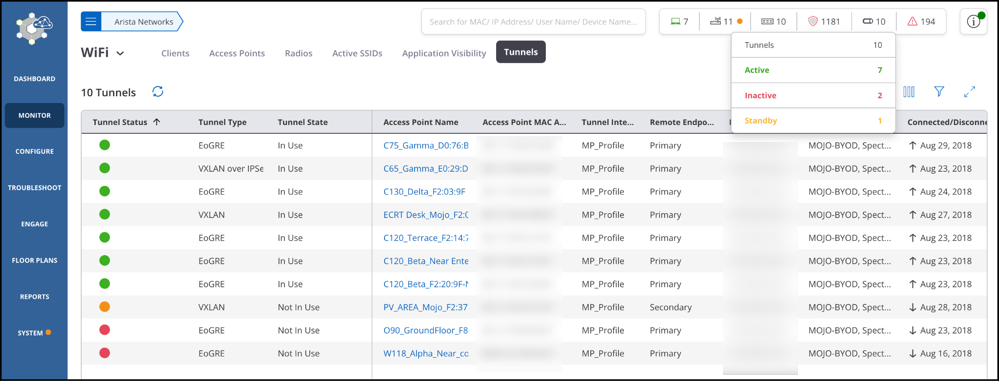
Tunnels
The Tunnels tab lists all tunnels used by SSIDs to move data between Access Points and their remote endpoints. It provides a real-time view of tunnel health across the network.
Tunnel Details
The tunnel list contains the following information:
| Column | Description |
|---|---|
| Tunnel Status | Color indicator of tunnel health. The Tunnel Status color means the following:
|
| Tunnel Type | The tunneling protocol in use: EoGRE, EoGRE over IPSec, VXLAN, VXLAN over IPSec, or VPN with IPSec. |
| Tunnel State | The current operational state of the tunnel. In Use indicates the tunnel is actively carrying traffic. |
| Access Point Name | The name of the AP through which the tunnel is established. Click the AP name to navigate to the AP details page. |
| Access Point MAC Address | The MAC address of the AP. |
| Location | The location (folder/floor) in the Navigator hierarchy where the AP is placed. |
| Tunnel Interface | The Tunnel Interface profile configured in the SSID that defines the tunnel endpoint and parameters. |
| Remote Endpoint | Indicates whether the tunnel is currently connected to the Primary or Secondary remote endpoint. |
| Remote Endpoint IP | The IP address of the remote endpoint to which the AP has established the tunnel. |
| SSIDs | The SSID(s) using this tunnel to carry client traffic. |
| Connected/Disconnected Since | The date and time since the tunnel entered its current state, either continuously connected or last disconnected. |
| LAN Port | The LAN port on the AP associated with this tunnel. |
| Data Received | The total volume of data received through the tunnel. |
| Data Sent | The total volume of data sent through the tunnel. |
Monitoring Standby Tunnels
When you configure a Tunnel Interface profile with a secondary endpoint, that secondary endpoint acts as the standby tunnel. It remains on standby while the primary tunnel is active, and takes over if the primary endpoint becomes unreachable.
When both endpoints are configured, both the primary and secondary tunnels appear as separate rows in the tunnel list. This lets the network administrator confirm that the standby tunnel is healthy and reachable before a fail-over occurs.
- A green primary and an orange secondary indicate a healthy setup. The primary endpoint is active, and the secondary is on standby and reachable.
- A red secondary indicates the standby tunnel is unreachable, and fail-over may not succeed.
Application Traffic
Application Data Usage Over Time widget displays the usage of data of the selected application, over a period of time. The data is displayed for clients using the selected application, on the selected folder or floor.
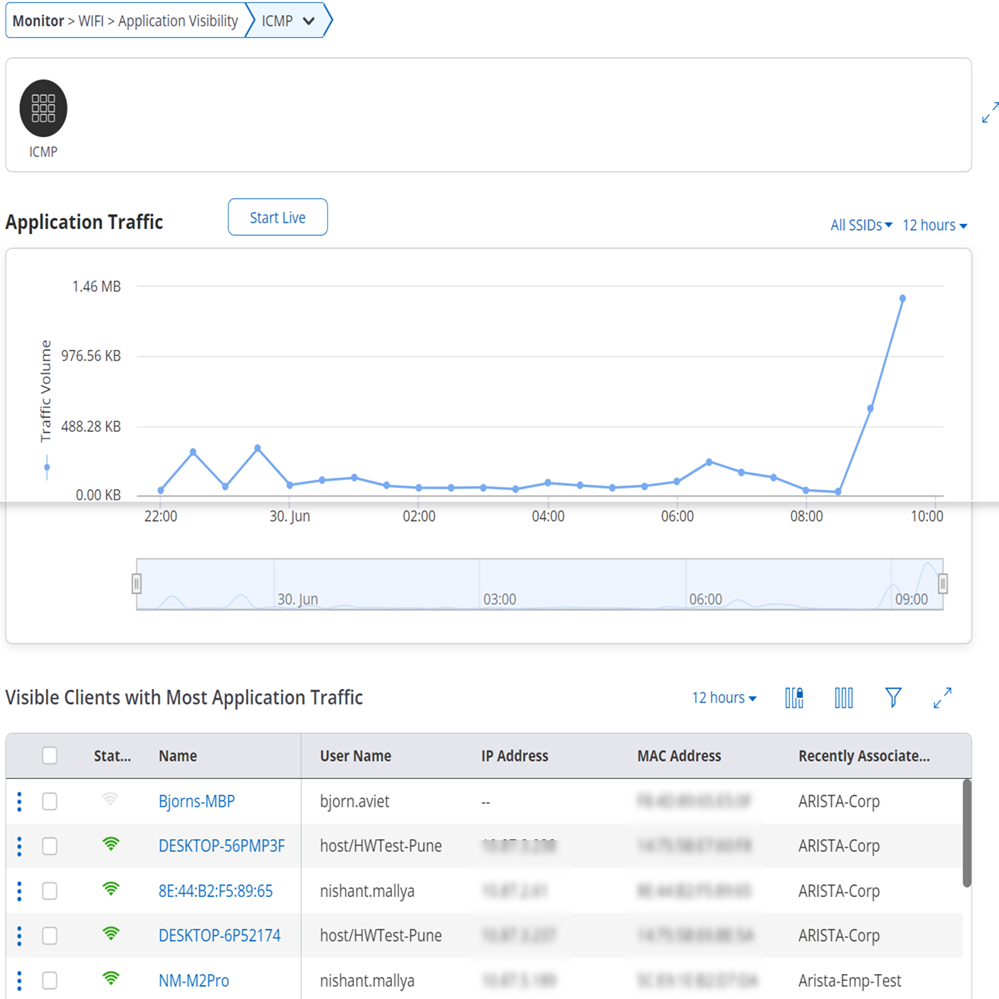
The graph is plotted at a time interval of 15 minutes. If its live data it is plotted every 3 seconds. If you hover the mouse over the graph, you can get a quick view of the timestamp and the data consumption by the selected application, at the given time.
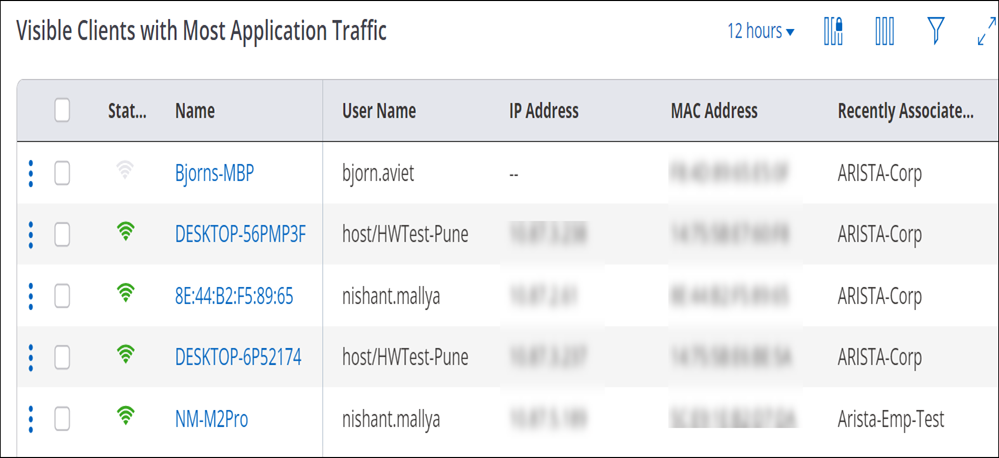
Visible Clients with Most Application Traffic
The Visible Clients with Most Application Traffic widget displays a list of the visible clients with highest usage of the selected application along with the detailed information of the client. The number on the top left corner indicates the total number of clients with the most traffic.
The widget has a provision to view or retrieve data using the filters. To know more about these filters refer Filters on Widgets.
Automated Root Cause Analysis
CV-CUE eliminates the need to manually troubleshoot some commonly occuring network issues. Its powerful Root Cause Analysis (RCA) engine identifies the root causes of network issues for a single client or total clients, and recommends solutions to those problems.
- Low RSSI
- Low data rate
- High retry
Note that root cause analysis is not supported for sticky clients.
- Poor Coverage
- Low RSSI
- Low SNR
- High Interference
- Low Data Rate
- High Retry Rate
- High Contention (BSSID/Clients)
- Sticky Clients
- Client does not support the latest 2.4 GHz, 5 GHz, or 6 GHz protocol
- Band Issues such as client does not support the 5 GHz band, 5 GHz capable client is operating in 2.4 GHz band, No 5 GHz SSID for 5 GHz capable client
- Symptoms and the number of clients that are showing the symptoms at a location.
- The domain knowledge determines the reason because of which an issue has occurred. For example, frequency band issues, too many clients with high uplink traffic, poor coverage, etc. are potential reasons for an issue.
- The system knowledge informs you about the Wi-Fi configuration settings that might have caused the issue. For example: is transmit power set to "Auto"?, is Dynamic Channel Selection enabled?
Root Cause Analysis for a Single Client Vs Total Clients
CV-CUE performs root cause analysis on single clients as well as on the total number of clients facing problems.
For single clients, you do not have to run the Inference Engine. You can view the recommendations from .
For total clients, you have to run the Inference Engine in the Client Health widget and the root cause analysis runs based on the locations. You run it from
Looking for Root Causes
The intelligent view is available for performance issues specific to Client Health widget. The generated view expires after an interval of 60 minutes.
- Go to
- Select a parameter (Low RSSI,Low Data Rate, High Retry) that you want to analyze. For example, let us consider "Low Data Rate".
- Click on the value showing the total number of clients facing low data rate.
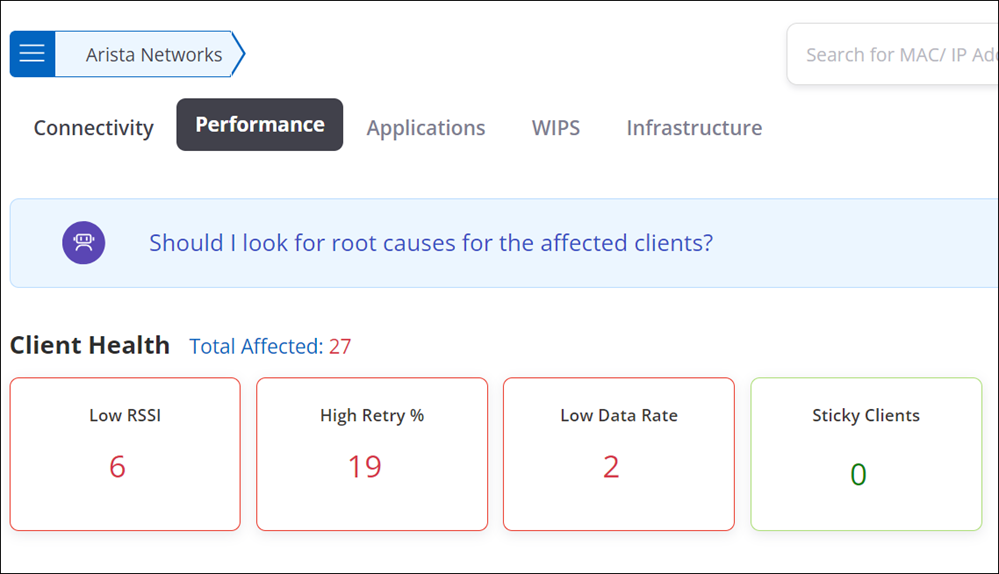
- Click Should I look for root causes? This will start the root cause analysis in the background. You can continue navigating to other parts of CV-CUE while it is generating the intelligent view.
After the background process is completed, a message containing the number of clients for whom the root cause analysis is done appears next to the robot icon . Also, an "Ongoing activity" message box linking to the result of the root cause analysis appears in the lower-right corner of the screen .The link contains the number of clients for which the root cause was found. For example- "Found root causes for 10 out of 20 clients."
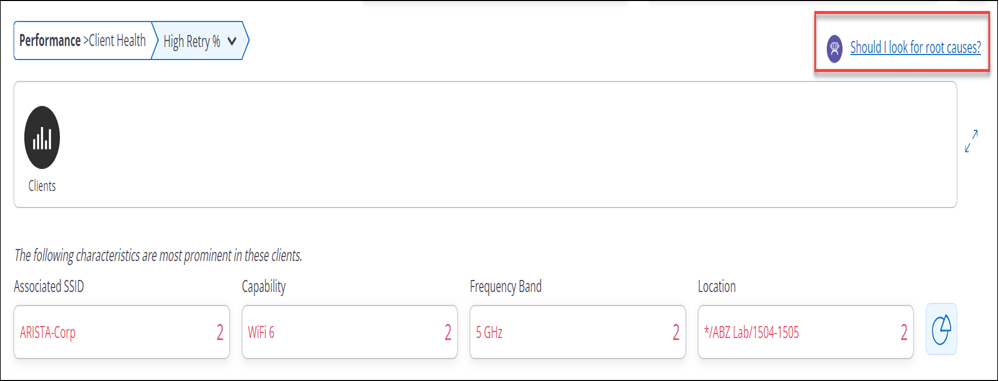
- Click Should I look for root causes? Or click on the link in the Outgoing Activitymessage box to view the result of the root cause analysis.
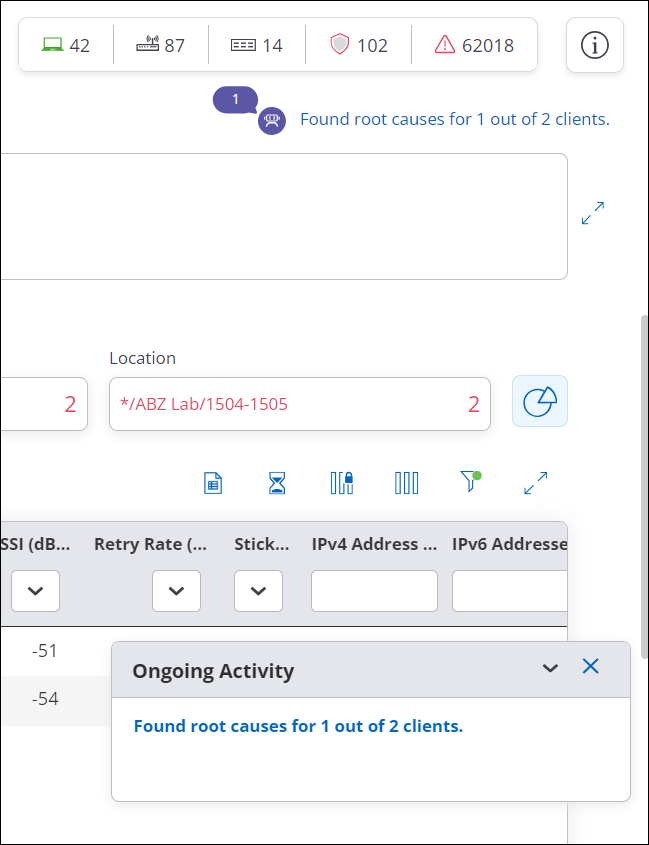
The RCA Engine displays the results of the analysis at one glance.
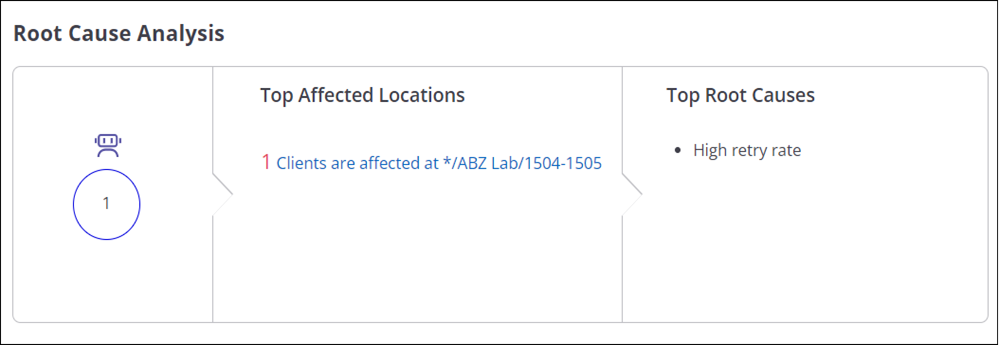
- Click a location to view the list of affected clients.
- To view recommendations, click the bulb icon next to the root cause.
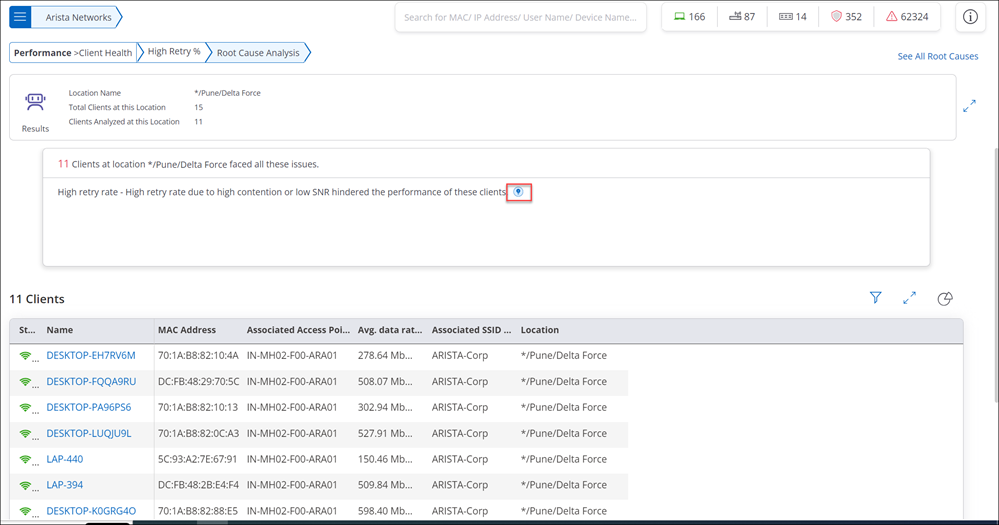
- To go back to the normal view, first close the recommendation panel.
Perform Root Cause Analysis for a Single Client
- Click
- Click the client name from the list.
If the client is facing any issue, you will see the symptom and the reason below the client details.
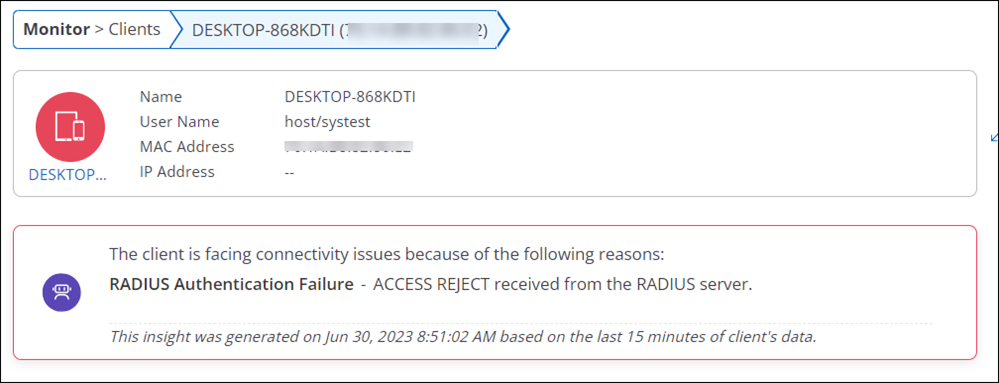
- To view recommendations for the symptom, click the How do I fix this icon (bulb icon) next to the root cause.