Common Operations
This chapter contains the following topics:
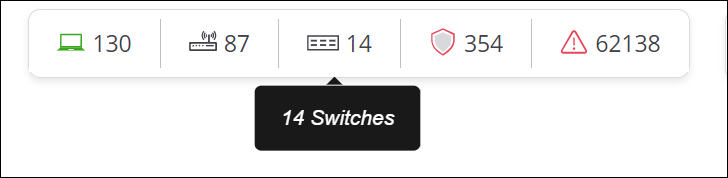
Wi-Fi Network Counters
Wi-Fi network counters provide network administrators with a quick summary of their Wi-Fi network infrastructure for the selected location. The counters are accessible in the top-right corner on the CV-CUE UI and also serve as a shortcut to quickly drill down to more details. The counters provide the following information.
Managed Wi-Fi Devices 
Active and inactive status of managed Wi-Fi devices including Access Points (APs), sensors and network detectors, and if any of the devices are running an outdated firmware version or configuration.
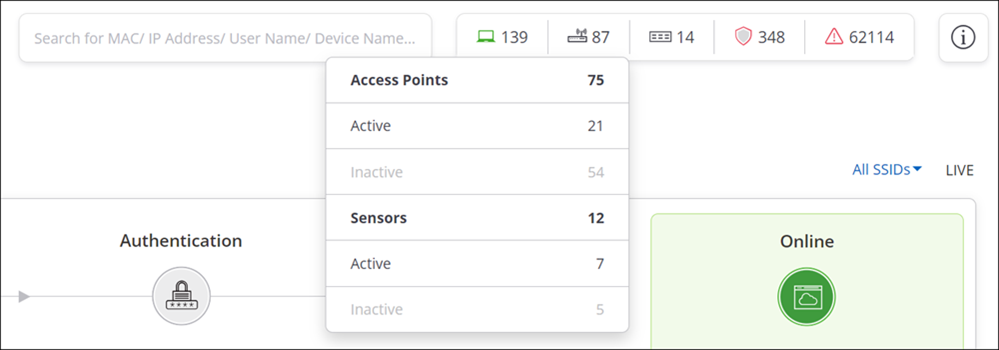
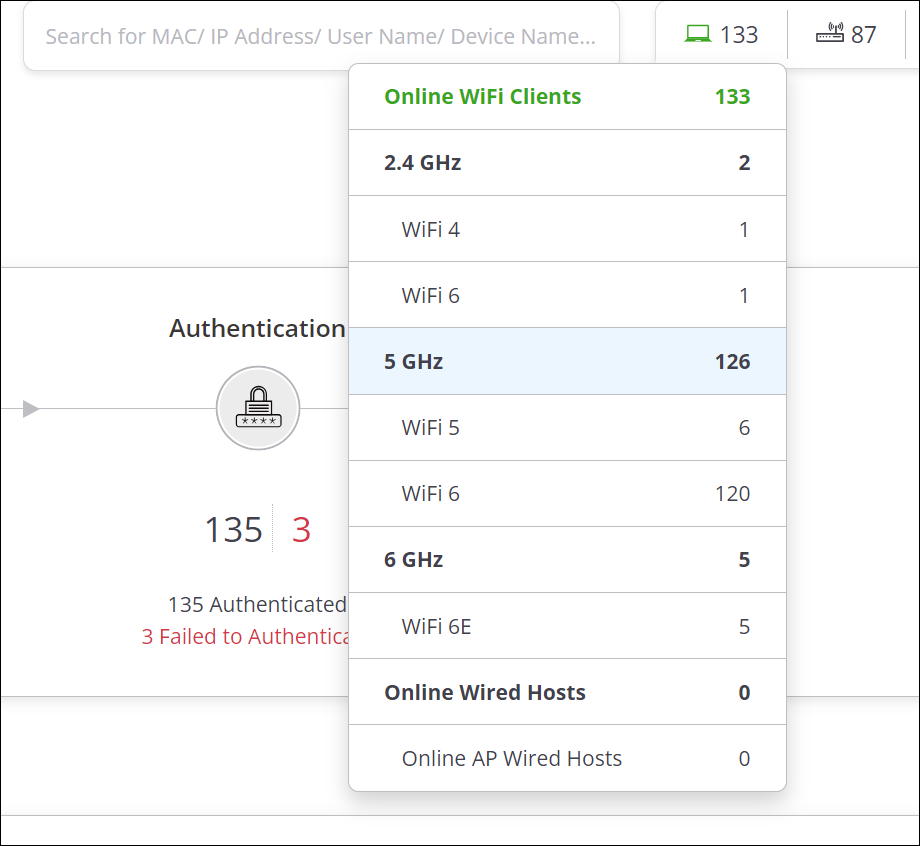
Wi-Fi Clients
Types of clients that are currently connected to the managed Wi-Fi network.
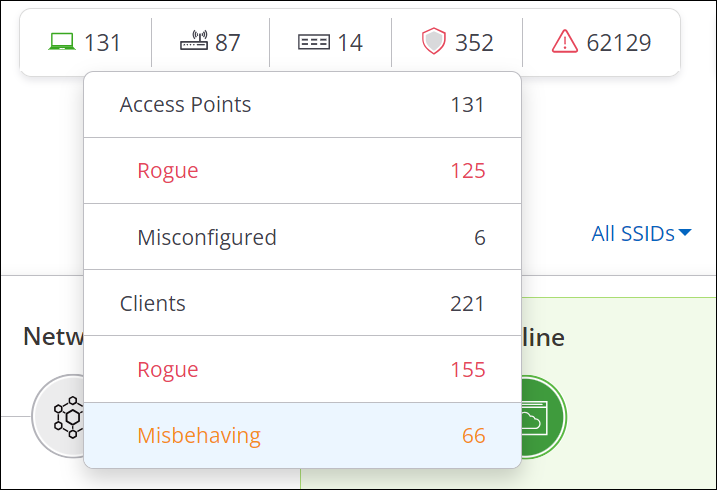
Threat-Posing Devices 
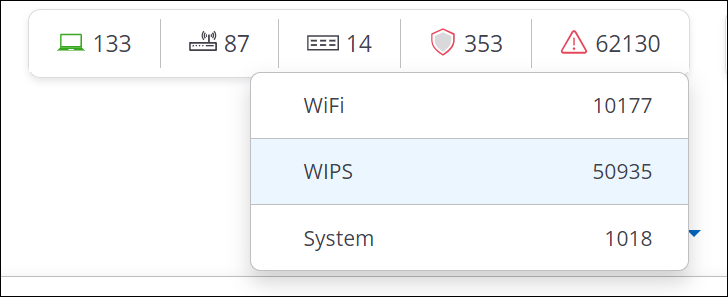
Alerts
Raised alerts related to Wi-Fi performance and security, and system health.
Switches
Total number of switches, active switches, inactive switches, and discovered switches.
Search
Global search helps to find a client, AP, or switches by typing the MAC or IP address, user name, switch name or the device name.
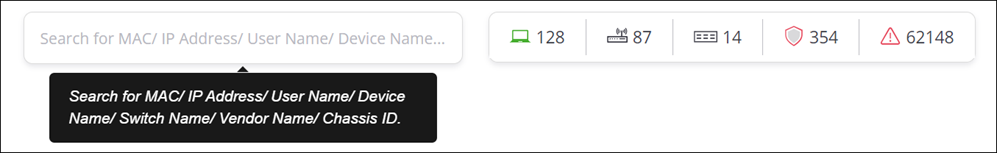
Only those clients/devices that are available on a selected folder or floor can be searched. Therefore, if a client, say LAP-ATN-424, is not connected to an SSID on the selected folder or floor, then the search will not show any results.
When you type the (full or partial) MAC or IP address, User Name, Switch Name, or the device name in the Global Search box, a detailed information of the device is displayed. Refer to Clients, Access Points or Switch section that provide more information on clients and APs.
- Global Search is not case-sensitive.
- The search results are segregated for clients, access points, managed switches and discovered switches. The search result shows the device/client name, irrespective of the search criteria used.
- It lists out the devices/ clients as you type the string or substring. For example, if you type lap, the search lists only the first 10 instances that have lap as part of their name or username along with a See More link. On clicking See More, you are redirected to the page with the complete search results.
- The search result shows the device/client name, irrespective of the search criteria used.
- You can search for clients in all categories:
- Clients currently associated to an Arista AP.
- Clients associated to an Arista AP in the past .
- Clients that are trying to or have tried to connect (but failed) to an Arista AP.
- It does not support pattern-based search with the use of special characters such as * or ?. For example, the Global Search will not list any results if you type la*.
Table-level Operations
CV-CUE provides a set of table level operations for the monitoring tables. These operations are available for the monitoring tables available on the MONITOR tab. Some or all the operations are applicable for the tables. These set of operations help users to filter the data or change the view of the table according to their convenience.
All the operations are available on the right top corner of the table.
- Freeze Columns: Freeze Columns operation allows user to freeze or unfreeze the columns on the table. To know more about this operation refer Freeze Columns.
- Add/Remove Columns: Add/Remove Columns operation is used to add or remove multiple columns. To know more about this operation refer Add/Remove Columns.
- Filter: Filter operation helps user to filter the data. This filtering of data helps user to either sort the data based on certain criteria or search any specific data. Depending on the column on which filter is to be applied, the filtering criteria may vary. You can filter the data by providing the range of values, or can always select the appropriate value from the provided options and many more.
- Full Screen: Selecting the Full Screen operation allows user to view the table in full screen mode. The same operation helps user to exit from full screen mode.
Freeze Columns
A vertical line on the monitoring table divides the table into two sections. The left section contains frozen columns. These columns are locked, making them always visible when scrolling vertically or horizontally in an open document. The right section contains unfrozen columns. These columns are unlocked.
The Freeze Columns operation allows user to freeze or unfreeze these columns. You can freeze a maximum of five columns. For every table there are at least two default columns that are always frozen and can never be unfrozen.
- Click the Freeze Columns icon on the top right corner of the table.
List of all the columns with checkbox adjacent to their names appear.
- Select or unselect the column you prefer to freeze or unfreeze.
Add/Remove Columns
Add/Remove Columns operation adds or removes the columns from the table. By default, all the columns are displayed in the table.
- Click the Add/Remove Columns icon on the top right corner of the table.
List of all the columns with checkbox adjacent to their names appear.
- Select or unselect the column you prefer to add or remove.
Filters
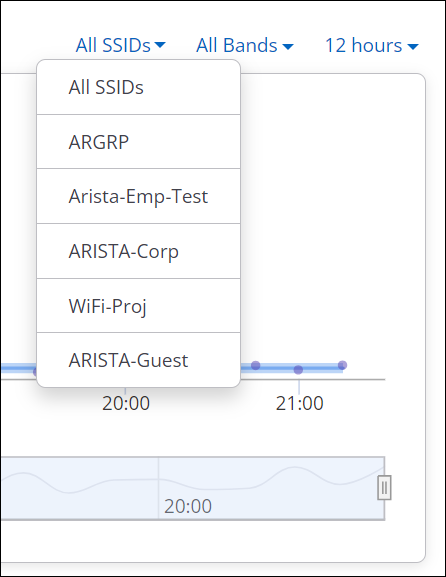
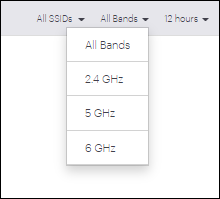
Widgets in CV-CUE allow you to view or retrieve the data using the filters. They are available to the right top corner of the widget.
- SSID Filter
- Frequency Band Filter
- Duration Filter
- Mode of Communication
- Conferencing Apps Filter
- Any Failure
- Any Issue
Note: All the filters may not be available for all the widgets. Their availability may vary for every widget.
SSID Filter
Frequency Band Filter
- 2.4 GHz
- 5 GHz
- 6 GHz
- All Bands
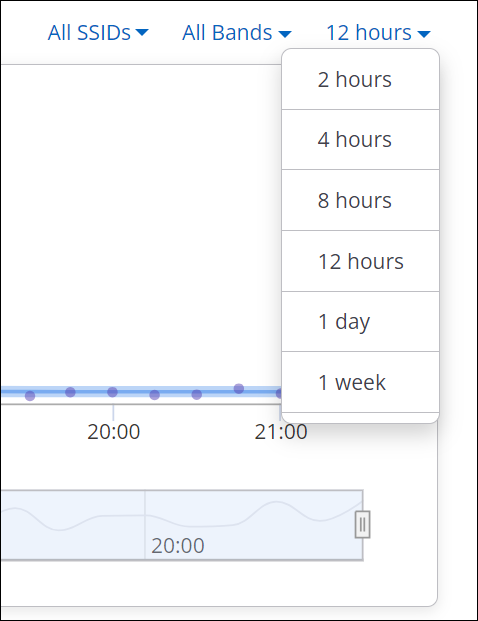
Duration Filter
- 2 hours
- 4 hours
- 8 hours
- 12 hours
- 1 day
- 1 week
- 1 month
Mode of Communication
- Wired and Wireless
- Wired
- Wireless
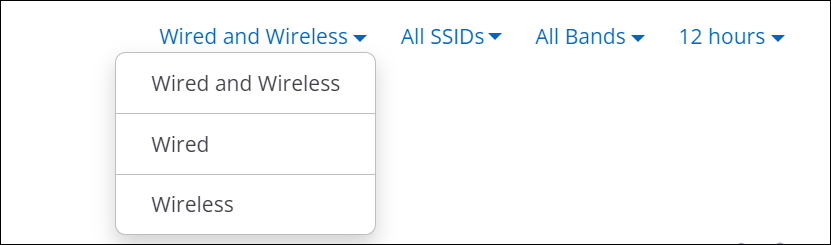
The default value is Wired/Wireless.
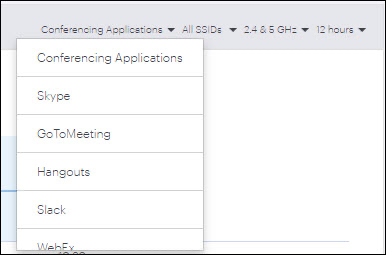
Conferencing Applications Filter
- WebEx
- Skype
- GoToMeeting
- Hangouts
- Slack
- Microsoft Teams
- Zoom
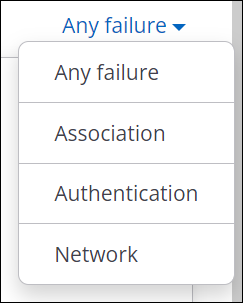
Any Failure
- Any failure
- Association
- Authentication
- Network
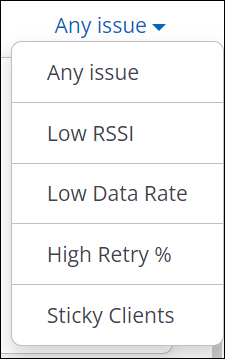
Any Issue
- Any issue
- Low RSSI
- Low Data Rate
- High Retry Percentage
- Sticky Clients
IPv6 Support in UI Fields
The following table lists UI fields that use IP addresses and whether they support only IPv4, or both IPv4 and IPv6.
| UI Element |
Supports IPv4 |
Supports IPv6 |
|
|---|---|---|---|
| Configure Tab | |||
| Tunnel Interface | Primary / Secondary endpoint | Y | Y |
| RADIUS Profile | RADIUS server IP Address | Y | Y |
| Role Profile | Redirect URL (when Redirection is enabled) | Y | N |
| IP/ Hostname under Firewall Rules | Y | N | |
| Device Settings | NTP Server IP/Hostname | Y | Y |
| Syslog server IP/Hostname under Device Access Logs | Y | Y | |
| IP Addresses under Enable SSH IP Allow List | Y | N | |
| Server URL under Analytics Integration with Third-Party Server | Y | Y | |
| SSID | Network tab: IP addresses under NAT Configuration | Y | N |
| Access Control tab: IP/Hostname under Firewall rules | Y | N | |
| Access Control tab: Redirect URL when Redirection is enabled | Y | N | |
| Analytics tab: Server URL when Push Analytics to Third-Party Server is enabled | Y | Y | |
| Captive Portal tab: Websites that users can access before login | Y | N | |
| Troubleshoot Tab | |||
| Client Connectivity Test | URL to test internet access under Portal Authentication Test | Y | N |
| IP Address/Hostname under Custom Application Test | Y | N | |
| System Tab | |||
| SMTP | SMTP Server IP | Y | N |
| SNMP-Alerts | SNMP Trap Destination Server IP/Hostname | Y | N |
| Syslog | Syslog Server IP/Hostname | Y | N |
| WLAN Integration | Aruba Controller IP/Hostname | Y | N |
| Cisco Controller IP/Hostname | Y | N | |