Troubleshooting Wi-Fi
The TROUBLESHOOT view in CV-CUE provides tools that help the network administrators troubleshoot issues in the Wi-Fi network.
Capture Packet Trace for a Client
You can perform the Capture Packet Trace action on a client to intercept a data packet that is crossing or moving over a specific network. The captured packet is stored temporarily for analysis. The packet is inspected to help diagnose and solve network problems
- Go to or. A list of APs seeing the client is displayed.
- Right-click on the name of the AP or select the menu icon (three vertical dots) to view the available actions and select Capture Packet Trace.
- On the Capture tab, enter the following details and click Start
Packet Capture.
A dialog displaying the ongoing progress for the capture packet trace is displayed. Click Stop to forcefully stop the packet capture.Option Description Mode Select the Mode of packet capture: - Access Radio Inline: Captures associated BSSID and client through the access radio.
- Access Radio Promiscuous: Captures all packets through the access radio.
- Multi Function Radio: OTA capture through the multi-function radio.
Duration of Packet Trace It is the time in minutes that specify the time interval for the packet trace capture. The range is from 1 min to 720 min. Streaming Option It specifies the type of packet capture to be used: - Upload to server: It creates a file to capture the packet trace which can be viewed only after the entire packet capture process is complete.
- Wireshark on local machine: The packet trace can be opened during an ongoing capturing process.
Filename Prefix It is mandatory field to specify the prefix for a filename. For example, Packet_wireless_143438.pcap, where: - Packet: is the prefix of the file name.
- _wireless_143438: is the name of the file.
- .pcap: is the file extension which is compatible with Wireshark.
Wireless Settings Select this option to edit advanced wireless settings. Traffic Selection It is the type of traffic that you prefer while troubleshooting. - All packets on the channel: To capture all packets from all clients visible to the troubleshooting AP sensor.
- Only packets for the selected Client <MAC address>: To view only packets from the selected AP.
Packet Types Select the type of packets that you want to capture. Frequency Band and Channel Selection Select the Frequency Band and channel for which you want to troubleshoot. If you want to select a single channel, select the Select Channel option and specify the channel number and Width (channel offset). By default, the protocol and channels are displayed based on the device template applied to the troubleshooting sensor. You can select a different protocol and/or channel, if required. Alternatively, you can select the Rotate on all Channels option, to troubleshoot on all available channels. A dialog displaying the ongoing progress for the capture packet trace is displayed. Click Stop to forcefully stop the packet capture. - After the successful completion of the packet trace, click Download to view the file in Wireshark.
View Packet Trace History for a Client
You can view the Packet Trace History for a selected client. The packet traces captured only during the last 30 minutes are displayed in the history.
- Right-click the client or select the menu icon (three vertical dots) to view the available actions.
- Select Packet Trace History.
- Select the History tab in the Capture Packet Trace window to view the packet capture history.
- Select any Packet Trace to view the following detailed information:
Field Description Filename Filename specifies the name of the captured packet trace. MAC Address MAC Address of the device for which packet trace is captured. Capturing Device MAC Address MAC Address of the device that has captured the packet trace. Start Start time of packet capture. End End time of packet capture. Troubleshooting Mode Mode of troubleshooting. Status Status specifies if the trace is completed or in progress. - Click on the three vertical dots for a packet capture file to view the
available actions:
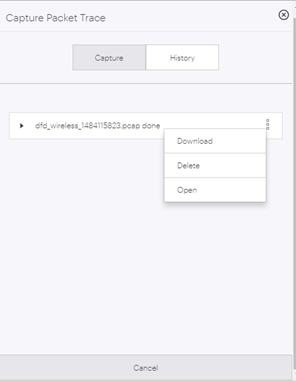
- Choose one of the following actions:
- Download - to download the trace file
- Delete - to delete the trace file
- Open - to open the trace file. You need to access Arista Packets in order to open the trace file. If Arista Packets is not accessible, the Open option is disabled.
Capture Packet Trace for an Access Point
You can troubleshoot Arista devices operating in AP or AP/Sensor mode. The packet is captured and inspected to help diagnose and solve network problems.
- Go to or .
- Right-click on the name of the AP for which you want to capture the packet trace and select Capture Packet Trace.
- On the Capture tab, enter the following details and click Start Packet
Capture.
A dialog displaying the ongoing progress for the capture packet trace is displayed. Click Stop to forcefully stop the packet capture.Option Description Mode Select the Mode of packet capture: - Access Radio Inline: Captures associated BSSID and client through the access radio.
- Access Radio Promiscuous: Captures all packets through the access radio.
- Multi Function Radio: OTA capture through the multi-function radio.
Timeout It is the time in minutes that specify the time interval for the packet trace capture. The range is from 1 min to 720 min. Streaming Option It specifies the type of packet capture to be used: - Upload to server: It creates a file to capture the packet trace which can be viewed only after the entire packet capture process is complete.
- Wireshark on local machine: The packet trace can be opened during an ongoing capturing process.
Filename Prefix It is mandatory field to specify the prefix for a filename. For example, Packet_wireless_143438.pcap, where: - Packet: is the prefix of the file name.
- _wireless_143438: is the name of the file.
- .pcap: is the file extension which is compatible with Wireshark.
Wireless Settings Select this option to edit advanced wireless settings. Traffic Selection It is the type of traffic that you prefer while troubleshooting. - Packets of all BSSIDs on this access point: Captures all the packets for all BSSIDs broadcasted by the selected AP.
- Packets of a single BSSID: Captures the packets for a single BSSID broadcasetd by the selected AP. Select your BSSID from the given drop-down list.
- All packets on the configured channels in Frequency Band and Channel Selection section: Captures all the packets for all the channels defined in the Frequency Band and Channel Selection section.
Protocol and Channel Selection Select the protocols and channel for which you want to troubleshoot. If you want to select a single channel, select the Select Channel option and specify the channel number and Width (channel offset). By default, the protocol and channels are displayed based on the device template applied to the troubleshooting sensor. You can select a different protocol and/or channel, if required. Alternatively, you can select the Rotate on all Channels option, to troubleshoot on all available channels. Wired Settings Select this option to capture packets from wired devices. Interface Select from the available ethernet ports from the list. The default value is eth0. VLAN ID Enter the VLAN Id. ICMP, UDP, DHCP, MDNS, LLMNR, DNS, RADIUS, ARP, TCP Select required protocols from the list. - After the successful completion of the packet trace, click Download to view the file in Wireshark.
View Packet Trace History for an Access Point
You can view the Packet Trace History for a selected AP. The packet traces captured only during the last 30 minutes are displayed in the history.
- Right-click the AP or select the menu icon (three vertical dots) to view the available actions.
- Select Troubleshoot > Packet Trace History.
- Select the History tab in the Capture Packet Trace window to view the packet capture history.
- Select any Packet Trace to view the following detailed information:
Field Description Filename Filename specifies the name of the captured packet trace. MAC Address MAC Address of the device for which packet trace is captured. Capturing Device MAC Address MAC Address of the device that has captured the packet trace. Start Start time of packet capture. End End time of packet capture. Troubleshooting Mode Mode of troubleshooting. Status Status specifies if the trace is completed or in progress. - Click on the three vertical dots for a packet capture file to view the
available actions:
- Choose one of the following actions:
- Download - to download the trace file.
- Delete - to delete the trace file.
- Open - to open the trace file. You need to access Arista Packets in order to open the trace file. If Arista Packets is not accessible, the Open option is disabled.
Live Client Debugging
The Live Client Debugging feature enables you to troubleshoot client activities. You can view live the logs of a client connection.
- Start Live Debugging
- Stop Live Debugging
- Archive the Debugging Log
- Download the Debugging Log
- Delete the Debugging Log
- View Live Client Debugging
Start Live Debugging
You can start the live debugging for one client at a time. However, you can parallelly debug maximum 10 clients on CV-CUE.
- Navigate to or .
- Right-click on the client that you want to debug and select Start Client Live Debugging.
- On the Live Client Debugging page, from the Select Time Durationdrop-down list select the time duration for which the client debugging must be performed.
- (Optional) Select Change Location. Use this option only when you want to track the logs of a client, for a locatiion other than its default location. This is useful when the client is roaming across locations.
- Select Archive Logs or Discard Logs to save or discard the client logs.If you select Archive, the logs are saved on the server after the time-out duration or if you stop the Live Client Debugging session. If you select Discard, the log is discarded, 30 minutes after the live debugging is stopped.
- Click Start to start the live client debugging.
Note:On the Clients page, the name of the client in bold and italics indicates that the Live Client Debugging is in progress.
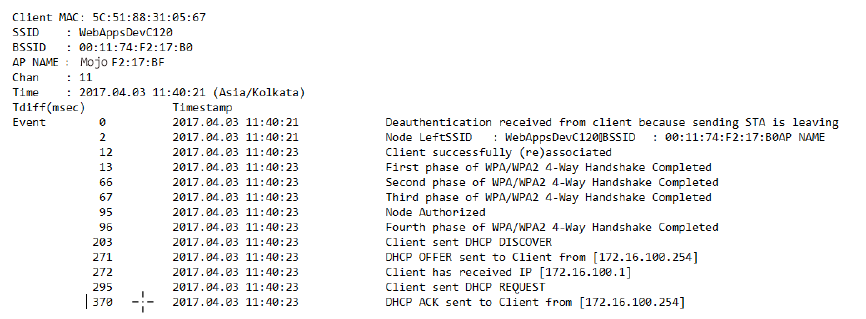
- Client MAC address
- SSID
- BSSID
- Name of the AP
- Channel
- Timestamp of when the log started
- Time diff in milliseconds between 2 consecutive events
- Event
- You can also start Live Client Debugging from the Search the required client and click Start Live Client Debugging hyperlink located at the top-right corner of the page.
- To access the archived client logs, navigate to The name of the log in highlighted in bold italics indicates that the debugging is in progress.
Stop Live Debugging
You can stop a Live Client Debugging, while the debugging is in progress.
- Navigate to the
- Right-click on any such log, and select Stop Live Debugging.
Note: Alternatively, you can stop the debugging, by navigating to or On the Clients page, the clients with live debugging are indicated in bold italics. Right-click the required client (in bold italics) and select Stop Client Debugging. A message is displayed that confirms that the debugging has stopped
View Live Client Debugging
You can view the logs live on the Live Client Debugging page. You can view the live debugging only for those events of the client that are in progress and have not ended.
- Navigate to the A list of logs is displayed. The logs that are still in progress are in bold and italics.
- Right-click any such .log file and select View Client
Debugging. Note: To view the Live Client Debugging, you can also navigate to or . The clients in bold and italics are the clients where live client debugging is in progress. Right-click any such client for which you want to view the live debugging logs and select Live Client Debugging. The events after opening the .log file are seen in the live debugging session. The events that occur while the Live Client Debugging is running in the background are recorded and can be downloaded. To know more about downloading a log file, refer Download Live Client Debugging Logs.
Delete Live Client Debugging Logs
You can delete the Live Client Debugging log files for completed sessions. You cannot delete a log file that is still in progress.
To delete the logs, perform the following tasks:
- Navigate to the
- Right-click on the log that you want to delete and select Delete Live Client Debugging.
- If you want to delete multiple logs, select the logs, right-click and select Delete Live Client Debugging.
Download Live Client Debugging Logs
You can download the logs of a Live Client Debugging session.
To download the logs, perform the following tasks:
- Navigate to the
- Click the log name to download the file in ZIP format. Alternately, right-click the log that you want to download and select Download Live Client Debugging.
- If you want to download multiple logs, select the logs, right click and select Download Live Client Debugging.
Blinking LEDs
Suppose that for troubleshooting purposes you want to physically access an AP that is deployed on a large floor with many APs. To locate this AP, you can use the UI to make the AP LEDs blink.
- Go to or
- Select the AP you want to locate.
- Click the three-dot menu.
- Select and the time interval for which you want the AP LEDs to continue blinking (while you physically locate it). When you click Start LED Blinking, the power, radio, and LAN LEDs of the AP blink one after another (like a moving spot of light on the AP), allowing you to easily locate the AP on the floor.
- Go to the Locations tab and navigate to the floor plan where the AP is placed.
- Select the AP you want to locate.
- Select and the time interval for which you want the AP LEDs to continue blinking.
Audit Logs
Audit Log Types
| Log Type | Description |
|---|---|
| User Access | Logs user action related to user access such as password changes, RADIUS authentication changes, and others |
| All | Includes all log types |
| Devices | Logs user action related to the AP such as AP name changes, AP reboot, AP firmware upgrade, and others |
| Alerts | Logs user action related to alerts such as deleting an alert |
| Global Settings | Logs user action related to global settings such as changes to Google integration, Syslog server, and SNMP settings, and so on |
| Location Based Settings | Logs user action related to location based settings such as SSID settings, which includes firewall, role-based access control, network, and others |
| Location Hierarchy | Logs user action related to the location hierarchy such as adding or deleting a folder or group, floor map related changes, and others |
| Reports | Logs user action related to the location hierarchy such as adding or deleting a folder or group, floor map related changes, and others |
| Start/Stop Functions | Logs user action related to system services such as database, web server, and so on |
| System | Logs user action related to system related operations such as adding or deleting a network, changes in the service module, time zone related changes, and so on |
| Third Party and Others | Includes changes related to third party servers and custom files |
Download Audit Logs
- Click to open the Audit Logs page.
- Select the log type and specify the duration for which you want to download the logs.
- Specify the Sort By value to sort your downloaded logs.
- Click Download to download the logs in the tsv format.
Configure Audit Logs Retention Settings
- Click to open the Audit Logs page.
- Click Audit Logs Retention Policy.
- In the right panel, specify the number of days in the Maintain User Action Logs for last field.
- Save your settings.