Testing and Troubleshooting
The Orchestrator Test and Troubleshoot functionality provides tools to test the status of the Arista services, perform remote Edge actions, and gather debugging information for an Edge.
In the SD-WAN Service of the Enterprise portal, select the Diagnostics tab to access and perform the testing and troubleshooting options.
Starting with the 5.1.0 release, all Troubleshooting and Diagnostics related information for Edges and Gateways is documented and published as a standalone guide titled Arista SD-WAN Troubleshooting Guide.
Run Remote Diagnostics
Arista VeloCloud SD-WAN supports bi-directional communication with the VeloCloud Edge by using WebSockets. A WebSocket is a full-duplex communication protocol over a single TCP connection. WebSockets easily enable communication between a Web browser (or other client applications) and a Web server with much lower overhead than HTTP polling. Remote Diagnostics uses a bi-directional WebSocket connection instead of the live-mode heartbeat mechanism to improve the responsiveness of the Remote Diagnostics in the Arista Edge Cloud Orchestrator.
- A WebSocket connection between a Web browser (Orchestrator UI portal) and an Orchestrator. This connection is responsible for all communications with the Web browser and for setting up the system properties needed for establishing a WebSocket connection.
- Another WebSocket connection between an Orchestrator and an Edge. This connection is persistent and setup on Edge activation for processing heartbeats from the Edge and sending back responses to the Orchestrator.
While establishing WebSocket connections between a Web browser and an Edge, in order to ensure Web security against Distributed Denial-of-Service (DDoS) and Cross site request forgery (CSRF) attacks, the browser origin address that is used to access the Orchestrator UI is validated for incoming requests.
In most Orchestrators, the browser origin address/DNS hostname is the same as the value of the network.public.address system property. To support scenarios where the address used to access the Orchestrator UI from the browser is different from the value of the network.public.address system property, the following system properties are added newly for WebSocket connections:
network.portal.websocket.address- Allows setting an alternate address/DNS hostname to access the UI from a browser if the browser address is not the same as the value ofnetwork.public.addresssystem property. By default, thenetwork.portal.websocket.addresssystem property is not set.session.options.websocket.portal.idle.timeout- Allows setting the total amount of time (in seconds) the browser WebSocket connection is active in an idle state. By default, the browser WebSocket connection is active for 300 seconds in an idle state.
Arista Edge Cloud Orchestrator enables you to run various Remote Diagnostic tests on a selected Edge. To run Remote Diagnostics on an Edge, perform the following steps:
- The Remote Diagnostics page displays the existing Edges.
Figure 1. Remote Diagnostics 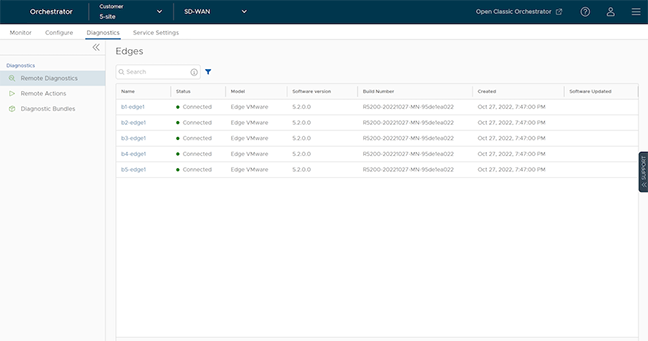
Perform Remote Actions with new Orchestrator UI
You can perform actions like Restarting services, Rebooting, or deactivating an Edge remotely, from the Enterprise portal.
You can perform the remote actions only on Edge that are in Connected state.
To perform the remote actions:
- Select the to open the Remote Actions dialog.
Figure 2. Remote Actions 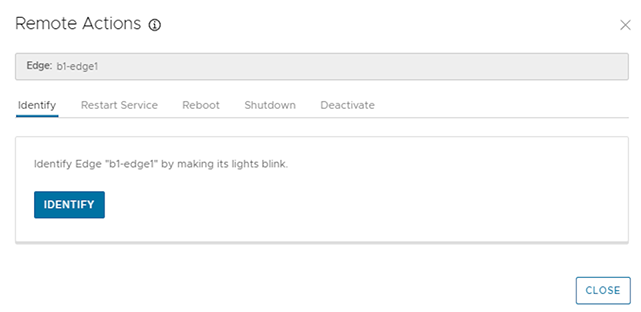
Diagnostic Bundles for Edges with new Orchestrator UI
Diagnostic bundles allow Operator users to collect all the configuration files and log files into a consolidated Zipped file. The data available in the diagnostic bundles can be used for debugging purposes.
To generate and download Diagnostic Bundles using the new Orchestrator UI:
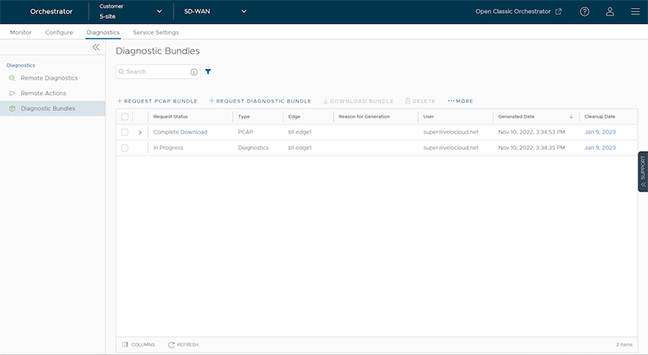
The details are downloaded in a CSV file.
Requesting a Packet Capture Bundle
Packet Capture Bundle collects the packets data of a network. Use these files for analyzing the network characteristics and the data for debugging an Edge device.
To generate a PCAP bundle, use the following steps:
- In Request PCAP Bundle, configure the following:
Figure 4. Requesting a PCAP Bundle 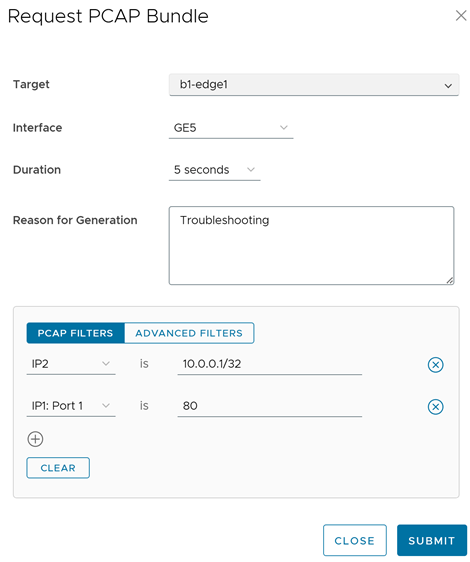
Table 1. PCAP Bundle Option Descriptions Option Description Target Select the target Edge from the list. The packets are collected from the selected Edge. Interface Select an Interface or a VLAN from the list. The packets are collected on the selected Interface. Duration Select the time in seconds. The packets are collected for the selected duration. Reason for Generation Optionally, you can enter your reason for generating the bundle. PCAP Filters Optionally for an Edge, you can define PCAP filters for the generated PCAP data by selecting the following options: - IP1- Enter an IPv4 address, or IPv6 address, or Subnet mask.
- IP2- Enter an IPv4 address, or IPv6 address, or Subnet mask.
- IP1:Port1- Enter a Port ID associated with IP1.
- IP2:Port2- Enter a Port ID associated with IP2.
- Protocol- Select a protocol from the list.
Advanced Filters Optionally for an Edge, you can define free form filters by which you want to control the PCAP data to be generated. The window displays the details of the generated bundle along with the status.
Packet Capture for Edges Configured for High Availability
In Release 5.2.0 and later, a user can request a packet capture for the Standby Edge HA interface, the interface that connects the Standby Edge to the Active Edge.Figure 5. Configuring a Request for a Standby Edge HA Interface 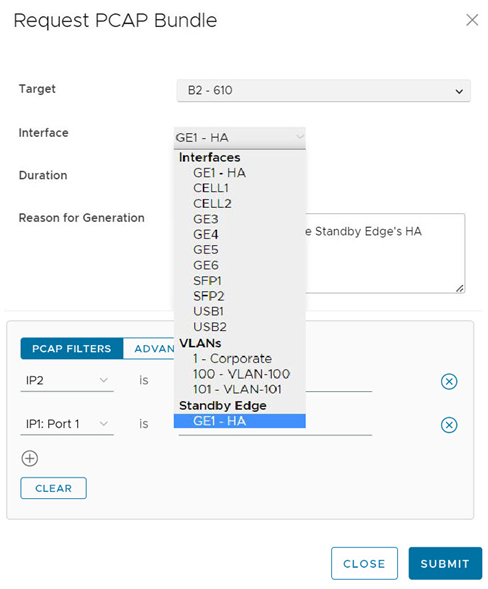
Request Diagnostic Bundle with New Orchestrator UI
A Diagnostic bundle is a collection of configuration files, logs, and related events from a specific Edge.
To generate a Diagnostic bundle:
- In the Request Diagnostic Bundle window, configure the following:
Figure 6. Configuring a Diagnostic Bundle Request 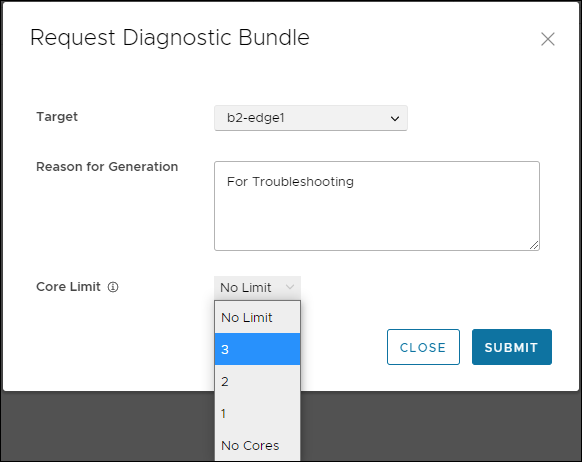
Table 2. Request Diagnostic Bundle Option Descriptions Option Description Target Select the target Edge from the drop-down list. The data is collected from the selected Edge. Reason for Generation Optionally, you can enter your reason for generating the bundle. Core Limit Select a Core Limit value from the drop-down, which is used to reduce the size of the uploaded bundle when the Internet connectivity is experiencing issues. The Diagnostic Bundles window displays the details of the bundle being generated, along with the status.
- In the Diagnostic Bundles window, select the Complete link or select the bundle and select Download Bundle. The bundle is downloaded as a ZIP file.
- For troubleshooting purpose, you can send the downloaded bundle to a support representative for debugging the data.
- To change the cleanup date, select the link to the cleanup date or select the bundle and select .
- In the Update Cleanup Date window, select the date on which the selected bundle should be deleted.
- If you want to retain the bundle, select the Keep Forever option, so that the bundle does not delete automatically.
- To delete a bundle manually, select the bundle and select Delete.