Prometheus Endpoint Support for Infrastructure Metrics
Prometheus is an open source monitoring and alerting toolkit. It collects and stores metrics from different sources in a time-series database. Prometheus offers a powerful query language, which allows users to analyze and visualize the collected data in real-time. With its robust alerting system, Prometheus can also notify users of potential issues which helps with their timely resolution.
Starting with the DMF 8.5.0 release, the Prometheus server can scrape metrics from a DMF (DANZ Monitoring Fabric) deployment. The DMF Controller exposes interface counters, CPU usage, memory usage, sensor states, and disk usage statistics from all the devices including the Controllers from a single Prometheus endpoint.
Deployment
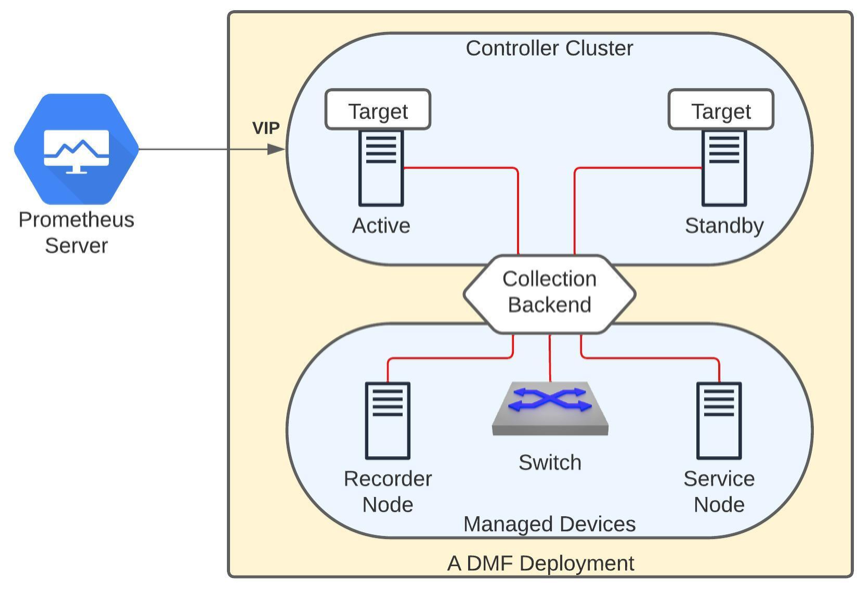
The aforementioned diagram shows a DMF deployment with an active/standby Controller cluster. In this environment, each Controller collects metrics from all the devices it manages as well as from both the Controller nodes. It then exposes them via the telemetry endpoint /api/v1/metrics/prometheus. This is an authenticated endpoint that listens on port 8443 and supports both Prometheus and OpenMetrics exposition formats.
Even though each Controller is capable of serving the telemetry information, it is recommended to use cluster's virtual IP (VIP) in the Prometheus configuration in order to achieve seamless continuity in the event of a Controller failover.
Configuration
No additional configuration is necessary on the DMF Controller to enable the metric collection. However, to allow the Prometheus service to access the new HTTP telemetry endpoint, a user access-token needs to be created. An admin user can choose an existing user or create a dedicated user with correct privileges and generate a token in order for Prometheus to fetch metrics from a fabric. The following sections describe the necessary configurations.
Permission
The group that the user belongs to needs to have sufficient permission to query the Prometheus endpoint. The following table summarizes the behavior.
| Group | Behavior |
|---|---|
admin |
An access-token generated for a user in the admin group will have access to the telemetry endpoint. |
read-only |
An access-token for a user in the read-only group will not have access to the telemetry endpoint. |
| Any custom group | An access-token for a user in a group with TELEMETRY or DEFAULT permission but not with DEFAULT/SENSITIVE permission will have access. |
To set telemetry permission for a custom group, use the following commands:
dmf-controller(config)# group group_name
dmf-controller(config)# permission category:TELEMETRY privilege read-only
dmf-controller(config)# associate user username
Access Token
Generate an access token for the user using the following command.
dmf-controller(config)# user username
dmf-controller(config-user)# access-token descriptive name for the access-token
access-token : ZxyHXL0QyOhDUogT8wjZj7ouSiVtWNB3
Prometheus Service
The following configuration needs to be added to the Prometheus server to fetch metrics from the Controller's /api/v1/metrics/prometheus endpoint periodically.
scrape_configs:
- job_name: <job_name>
scheme: https
authorization:
type: Bearer
credentials: <access-token>
metrics_path: /api/v1/metrics/prometheus
scrape_interval: <interval>
static_configs:
- targets:
- <vip>:8443
tls_config:
insecure_skip_verify: true
The table below depicts the recommended configurations for this feature.
| Configuration | Value |
|---|---|
| Credential | The corresponding access token created on the Controller |
| Scrape Interval | The minimum supported interval is 10s |
| Target | Use the VIP of the DMF Controller cluster |
| TLS | If a self-signed certificate is used on the Controller, add insecure_skip_verify: true |
Refer to the configuration guidelines of the specific Prometheus version you are using in the production.
Limitations
- Every device does not support every metric. Check the Metrics Summary section for more details.
- Software interfaces (for example, loopback, bond, and management) do not report counters for broadcast and unicast packets.
- The reported interface names are the raw physical interface name (e.g.,
et1) rather than the user configured name associated with the role of an interface (e.g.,filter1). - Resetting the interface counter does not have any effect on the counter values reported by the telemetry. The value is monotonically increasing and corresponds to the total count since the device was last powered up. This value only gets reset when the device is rebooted.
Notes
- The configured name of a managed device (e.g., switch, recorder node etc.) on the Controller is used as the value of the
device_namelabel for all the metrics corresponding to it. In the case of a Controller, the configured hostname is used in thedevice_namelabel. Thus, these names are expected to be unique in a specific DMF deployment. - It is possible that no metrics are collected from a device for a short time period. This may happen when the device is rebooting or when the Controllers experience a failover event.
- Prometheus will add additional metrics, e.g.,
scrape_duration_seconds, scrape_samples_post_metric_relabeling,
scrape_samples_scraped
, andscrape_series_added. These metrics do not collect any data from the DMF fabric and can be ignored. - A metric representing a status that can take a fixed set of values is represented as a
StateSetmetric. Each possible state is reported as a separate metric. The current state is reported with value 1 and the other states with value 0. The state itself is reported as a label with the same name as that of the metric. For example,device_psu_oper_statuswill display multiple metrics for the operational status of a PSU (Power Supply Unit). If a PSU,psu1is in the failed state, then the metricdevice_psu_oper_status{name="psu1", device_psu_oper_status="failed"}will report value 1. At the same time, we will see the metric device_psu_oper_status{name="psu1", device_psu_oper_status="ok"}with value 0 for another stateok. - Internally, all the metrics are fetched at 10 sec frequency except the ones associated with the sensors. These are currently collected at every minute.
Troubleshooting
If no metric is collected or no change in the metrics is visible on Prometheus for a few minutes, please follow the following troubleshooting steps:
- The Controller cluster is reachable over its VIP and there is an elected active Controller.
- You can retrieve the telemetry states in Prometheus exposition format using the token you created. Use command
curl -k -H "Authorization: Bearer <token>" https://<vip>:8443/api/v1/metrics/prometheus - The telemetry connection to the devices is active by running
show
telemetry connection
command. Check the Telemetry Collector section of the DANZ Monitoring Fabric User Guide for more details.
Resources
Appendix
Metrics SummaryThe following table shows the details of each metric exposed by the DMF fabric. The supported metric column shows that if a metric is generally supported on the device type. However, some specific platforms or hardware might not report a specific metric.
| Metric | Description | Supported device type | ||||
|---|---|---|---|---|---|---|
| Ctrl | SWL | EOS | SN | RN | ||
| device_cgroup_cpu_percentage | The normalized CPU utilization percentage by a control group | Y | Y | N | Y | Y |
| device_cgroup_memory_bytes | The memory used by a control group in bytes | Y | Y | N | Y | Y |
| device_config_info | The informational metrics of a managed device | N | Y | Y | Y | Y |
| device_cpu_utilization_percentage | The percentage utilization of a CPU on a device of the fabric | Y | Y | Y | Y | Y |
| device_fan_oper_status | The current operational status of a fan | Y | Y | Y | Y | Y |
| device_fan_rpm | The current rate of rotation of a fan | Y | Y | Y | Y | Y |
| device_fan_speed_percentage | The percentage of the max rotation capacity that a fan is currently rotating | N | Y | N | N | N |
| device_interface_in_broadcast_packets_total | The total number of broadcast packets received on the interface of a device | Y | Y | Y | Y | Y |
| device_interface_in_discards_packets_total | The number of discarded inbound packets by the interface of a device even though no errors had been detected | Y | Y | Y | Y | Y |
| device_interface_in_errors_packets_total | The number of inbound packets discarded at the interface of a device for errors | Y | Y | Y | Y | Y |
| device_interface_in_fcs_errors_packets_total | The number of received packets on the interface of a device with erroneous frame check sequence (FCS) | Y | Y | Y | Y | Y |
| device_interface_in_multicast_packets_total | The total number of multicast packets transmitted from the interface of a device | Y | Y | Y | Y | Y |
| device_interface_in_octets_total | The total number of octets received on the interface of a device | Y | Y | Y | Y | Y |
| device_interface_in_packets_total | The total number of packets received on the interface of a device | Y | Y | Y | Y | Y |
| device_interface_in_unicast_packets_total | The total number of unicast packets received on the interface of a device | Y | Y | Y | Y | Y |
| device_interface_operational_status | The operational state of an interface of a device | Y | Y | Y | Y | Y |
| device_interface_out_broadcast_packets_total | The total number of broadcast packets transmitted from the interface of a device | Y | Y | Y | Y | Y |
| device_interface_out_discards_packets_total | The number of discarded outbound packets at the interface of a device even though no errors had been detected. | Y | Y | Y | Y | Y |
| device_interface_out_errors_packets_total | The the number of outbound packets that could not be transmitted by the interface of a device because of errors | Y | Y | Y | Y | Y |
| device_interface_out_multicast_packets_total | The total number of multicast packets transmitted from the interface of a device | Y | Y | Y | Y | Y |
| device_interface_out_octets_total | The total number of octets transmitted from the interface of a device | Y | Y | Y | Y | Y |
| device_interface_out_packets_total | The total number of packets transmitted from the interface of a device | Y | Y | Y | Y | Y |
| device_interface_out_unicast_packets_total | The total number of unicast packets transmitted from the interface of a device | Y | Y | Y | Y | Y |
| device_memory_available_bytes | The current available memory at a device of the fabric | Y | Y | Y | Y | Y |
| device_memory_total_bytes | The total memory of this device | Y | Y | N | Y | Y |
| device_memory_utilized_bytes | The current memory utilization of a device of the fabric | Y | Y | Y | Y | Y |
| device_mount_point_space_available_megabytes | The amount of unused space on the filesystem | Y | Y | N | Y | Y |
| device_mount_point_space_usage_percentage | The used space in percentage | Y | Y | N | Y | Y |
| device_mount_point_space_utilized_megabytes | The amount of space currently in use on the filesystem | Y | Y | N | Y | Y |
| device_mount_point_total_space_megabytes | The total size of the initialized filesystem. | Y | Y | N | Y | Y |
| device_psu_capacity_watts | The maximum power capacity of a power supply | N | N | Y | N | N |
| device_psu_input_current_amps | The input current drawn by a power supply | Y | Y | Y | Y | Y |
| device_psu_input_power_watts | The input power to a power supply | Y | Y | N | Y | Y |
| device_psu_input_voltage_volts | The input voltage to a power supply | Y | Y | Y | Y | Y |
| device_psu_oper_status | The current operational status of a power supply unit | Y | Y | Y | Y | Y |
| device_psu_output_current_amps | The output current supplied by a power supply | N | Y | Y | N | N |
| device_psu_output_power_watts | The output power of a power supply | N | Y | Y | N | N |
| device_psu_output_voltage_volts | The output voltage supplied by a power supply | N | Y | Y | N | N |
| device_thermal_oper_status | The current operational status of a thermal sensor | Y | Y | N | Y | Y |
| device_thermal_temperature_celsius | The current temperature reported by a thermal sensor | Y | Y | Y | Y | Y |
* Ctrl = Controller, SWL = A switch running Switch Light
EOS = A switch running Arista EOS, SN = Service Node, RN = Recorder Node.