Accessing Events
You can access the following events screens:
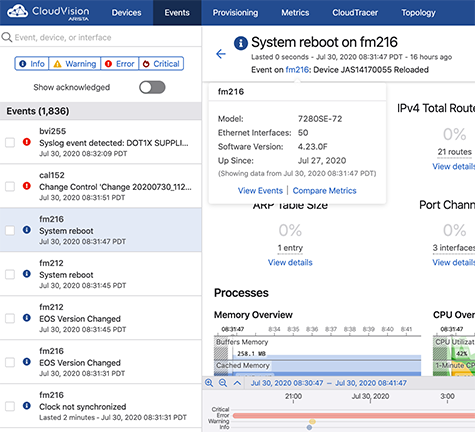
Events Summary Screen
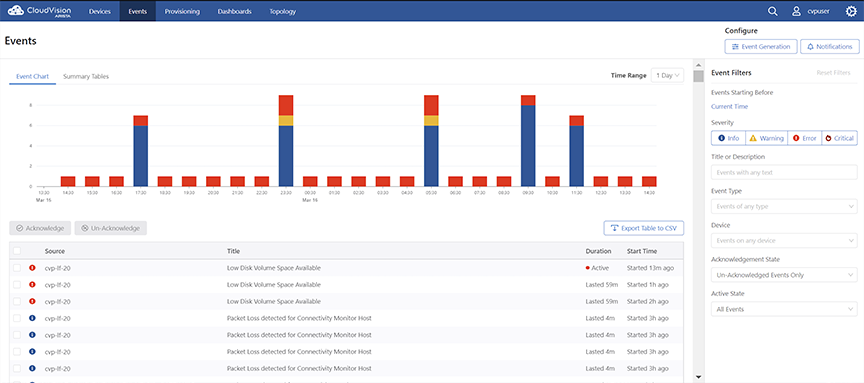
- Click the Event Generation button to configure generating new events. Refer to Configuring Event Generations.
- Click the Notifications button to configure notifications. Refer to Configuring Notifications
- Left Pane
- Event Chart and Summary
Tables tabs
- The Event Chart tab displays the bar
graphs of all events.Note: Hover the cursor over the different segments of the bar graph to view the count of severity events.
- The Summary Tables tab displays
Most Active Devices and
Most Active Event Types in tabular
formats.See the figure below.
Figure 2. Event Summary Screen - Summary Tables 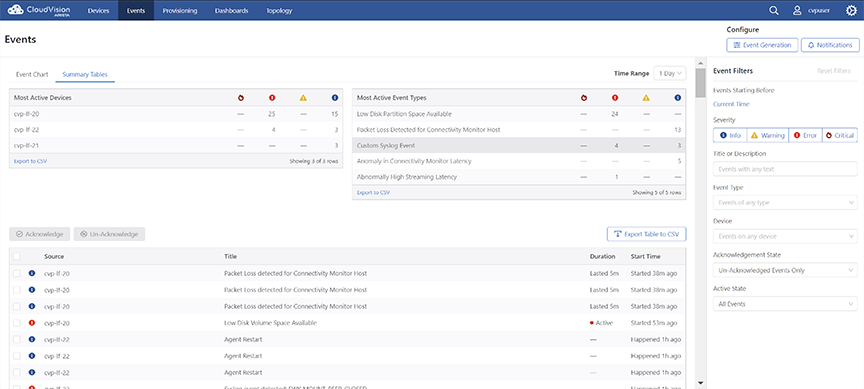 Note: The severity levels include critical, error, warning, and info.
- The Event Chart tab displays the bar
graphs of all events.
- The Time Range dropdown menu to select the time span of events.
- The Acknowledge button to acknowledges selected events.
- The Un-Acknowledge button to renounce selected events.
- A list of all events with selection checkboxes in a tabular format.
- Click the Export Table to CSV button to download the table in csv format to your local drive.
- Event Chart and Summary
Tables tabs
- Right Pane
- The Reset Filters button to clear all filtering options.
- The Current Time date picker to select the event start date.
- Search field based on Title or Description and dropdown menus based on Event Type, Device, Acknowlegement State,and Active State.
- Buttons to perform a search based on severity levels (Info, Warning, Error, and Critical)
Event Details Screen
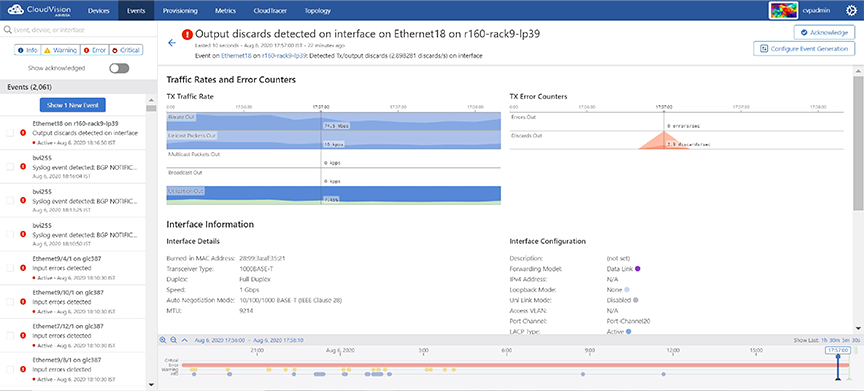
This screen provides the following information and functionalities in the right pane:
- Left arrow to return to the events summary screen
- Click the Event Generation button to configure generating new events. Refer to Configuring Event Generations.
- Click the Notifications button to configure notifications. Refer to Configuring Notifications
- Displays the event description
- Time when event details were captured
- Hover the cursor on the event name. The system displays a popup window with event details.
- Click View Events to view search results with the same event name.
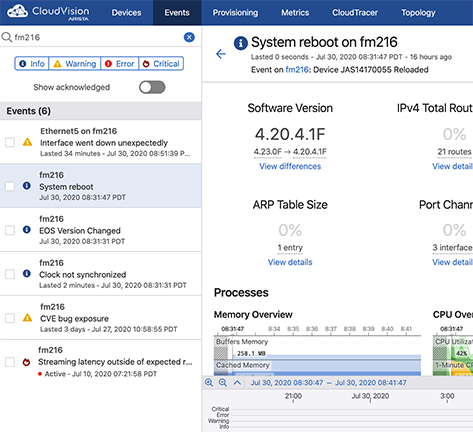
- Click Compare Metrics to navigate to the Explorer tab in Metrics app.
- Hover the cursor on the event name. The system displays a popup window with device details in that location.
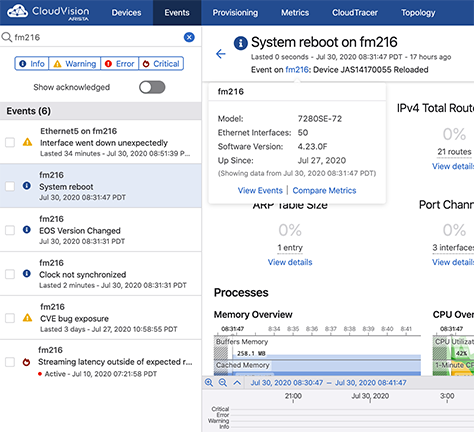
The popup window provides the following options:
- Click View Events to view search results with the same location name.
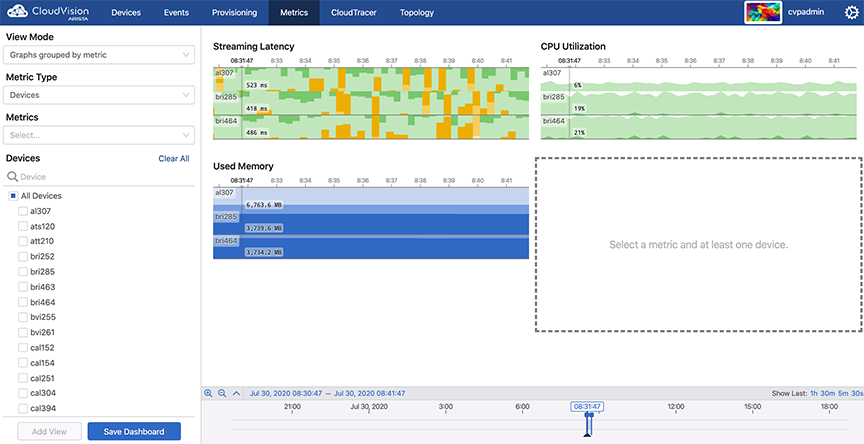
- Click Compare Metrics to navigate to the Explorer tab under Metrics.
- The Acknowledge button to acknowledge the appropriate event.
- The Configure Event Generation button to configure the generation of appropriate event.
- Metric details of the event
- A chronological history of all errors (shown at the bottom of the screen)
Configuring Event Generations
Configure rules and conditions to customize event generation.
Perform the following steps to configure the settings for generating events:
-
Click
Configure Event Generation at the upper right corner of the
Events section. The system displays the
Generation Configuration screen with all configurable events
listed in the left pane.
Figure 8. Generation Configuration Screen 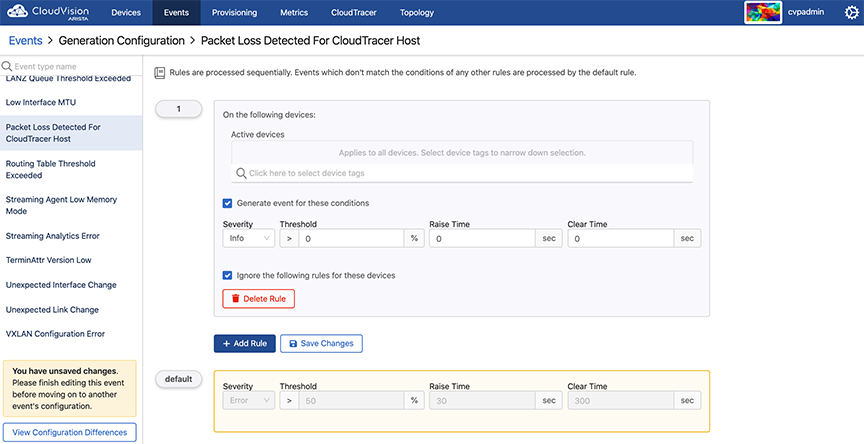 Note: Alternatively, you can go to an event details screen and click Configure Event Generation to configure rules for generating events.
 -
Click
Add Rule in the lower end of right pane. A new
Condition pane is displayed on the screen.
Figure 9. Add Rule Pane in Generation Configuration 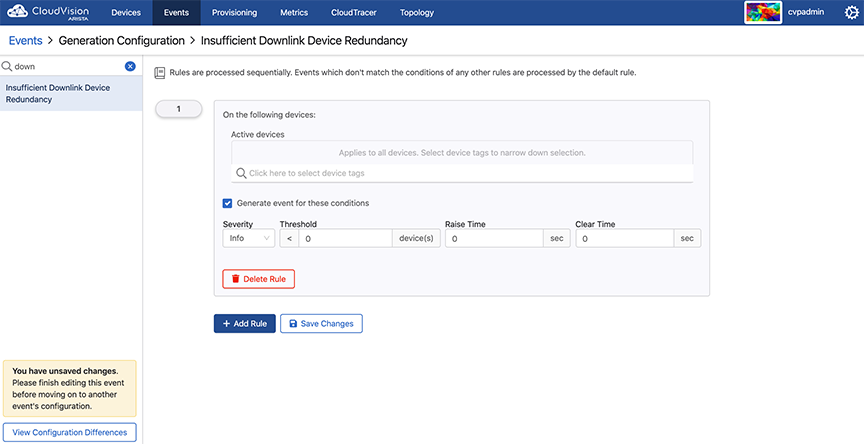
-
In the
Condition pane, click on the search field. The system displays
the list of configured devices tags.
Figure 10. List of Configured Device Tags 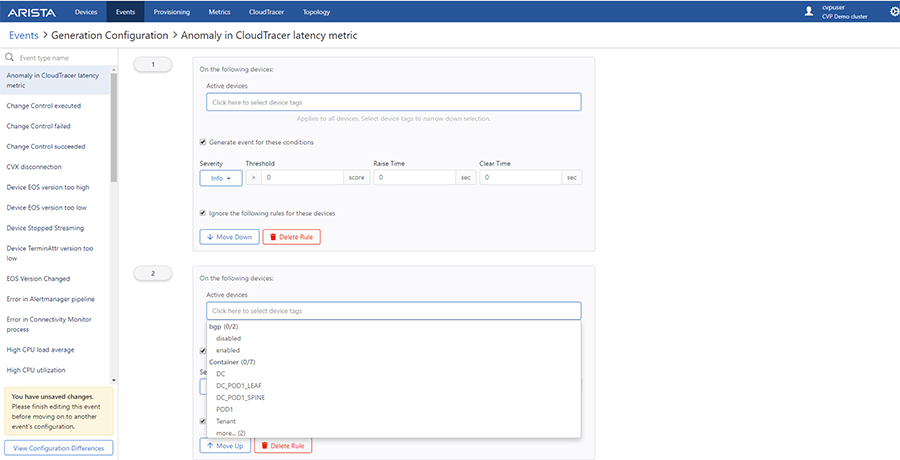 Note: Alternatively, you can type the required device tag in the search field for a quick search.
 -
Click on the Interfaces search field (available only for interface
events).
The system displays the list of configured interface tags..
Figure 11. List of Configured Interface Tags 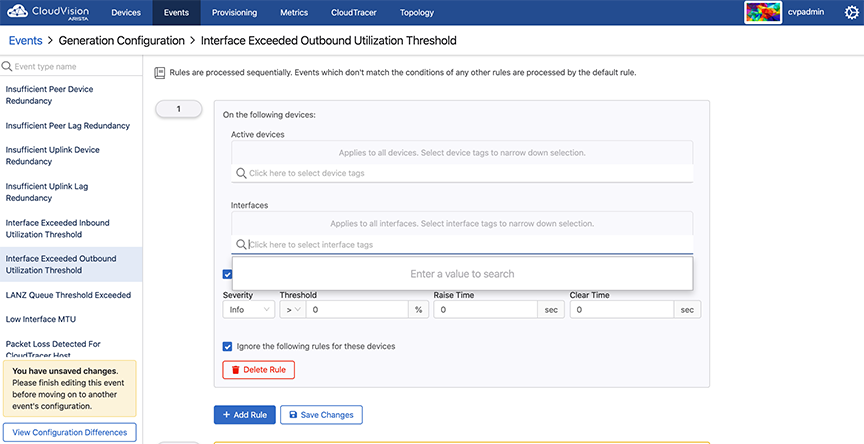
Anomaly in Connectivity MonitorLatency
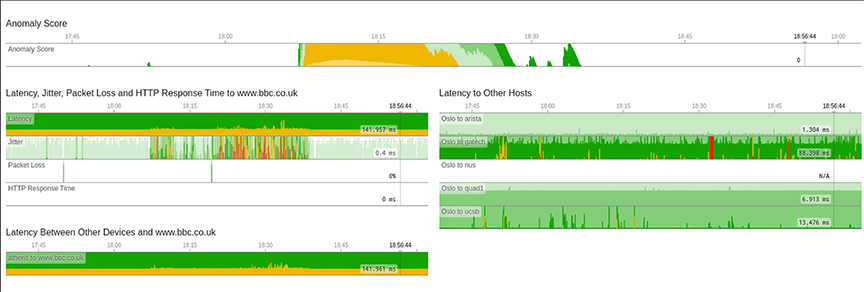
From the Events tab, select Anomaly in Connectivity MonitorLatency to configure event generation for latency events between devices and configured hosts. The events are designed to alert the user when the latency between a device and a configured host is outside of recent historical bounds.
Figure 12 is a sample event view for one of these events between the device with hostname `Oslo` and the cloudtracer host endpoint `www.bbc.co.uk`.
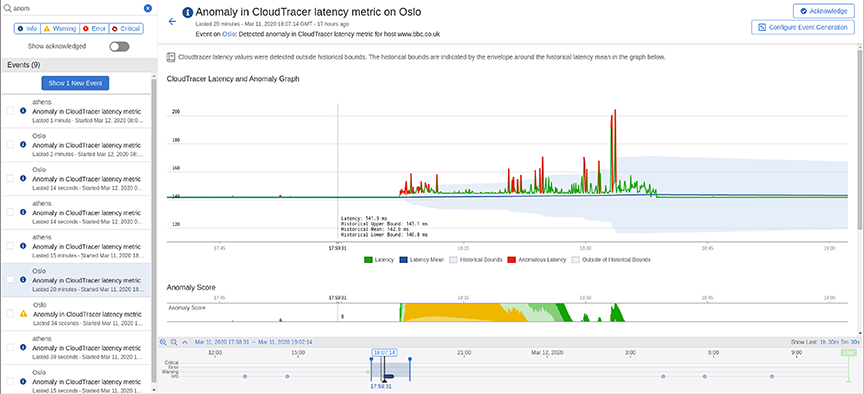
Figure 13 explains various stages of this event.
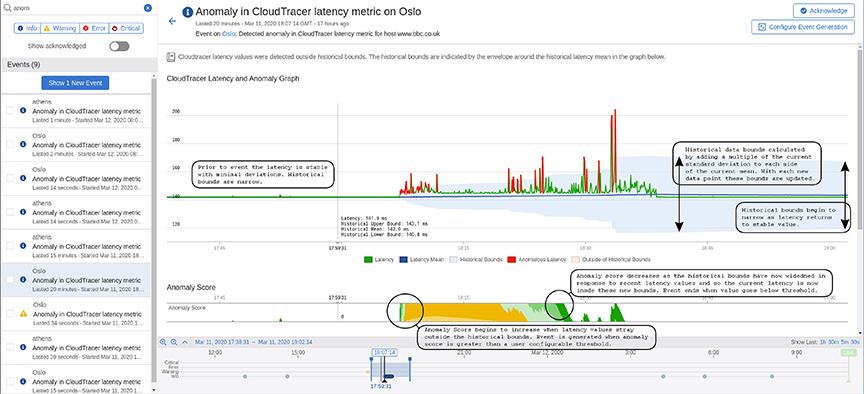
Prior to this event in Figure 13, the latency metric (green line in upper graph) is stable with minimal deviations. The historical bounds (blue shaded region) that determine when the metric is in a normal state has a small range with both the upper and lower bounds near the historical mean (dark blue line). The historical bounds are computed by adding and subtracting a fixed multiple of the current latency standard deviation to the current mean.
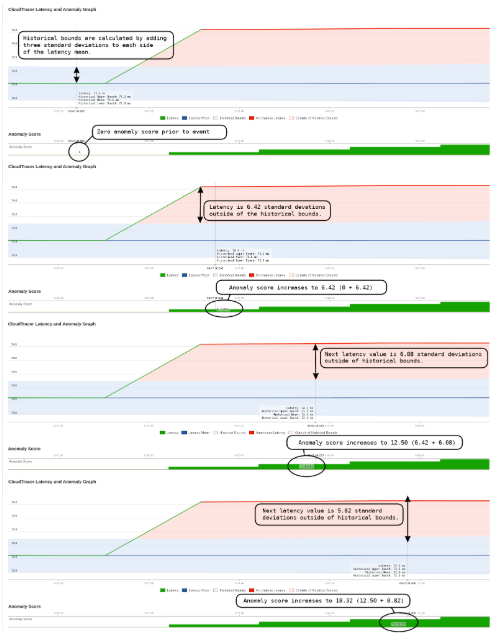
The anomaly score starts to increase from zero when the latency value strays outside of the historical bounds. The latency values that are outside the bounds are highlighted in red. The anomaly score is the total number of standard deviations outside the historical bounds. The anomaly score is the positive cumulative sum of the number of standard deviations outside of the historical bounds. For example, if the bounds are set as 3 standard deviations outside of the mean and we get a value of the latency that is 5 times the standard deviation away from the mean, the anomaly score will increase by 2. If the next latency value was 1.5 times the standard deviation outside of then mean then we would subtract 1.5 from the anomaly score. The anomaly score therefore keeps track of the cumulative deviation of the latency outside of the historical bounds. It is bounded below by zero.
Figure 14 provides a detailed explanation on computing the anomaly score.
The event is generated when the anomaly score exceeds a threshold for a set period of time.
The anomaly score starts to decrease when the latency values are inside the historical bounds. The historical bounds have increased based on recent deviations in latency which makes the system less sensitive than prior to the event. The event ends when the anomaly score is below the threshold for a set period of time.
Figure 15 provides a detailed explanation of the anomaly score decreasing when an event ends.
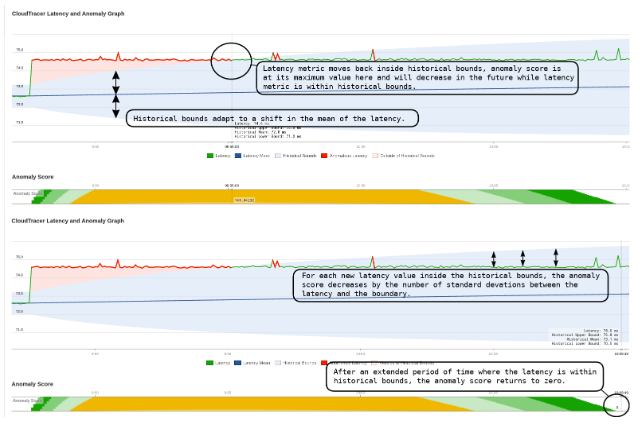
At the end of the time range, historical bounds are narrowing as the latency has now returned to a stable value with minimum deviations. The history needs approximately six hours to have negligible impact on the statistics and bounds.
This screen also provides the following additional metrics of this event (see Figure 16):
-
The other CloudTracer metrics are displayed for this device and host pair
-
The latency metric between other devices and this host
-
The latency metric between this device and other hosts
Custom Syslog Events
The Custom Syslog Event creates syslog message events based on rule conditions. To end all similar active events, you must update the configuration as per the recommended action provided in the EOS System Message Guide.
An EOS System Message Guide is published with every EOS release. In the guide, you can find all the common system messages generated by devices, including the syslog facility, mnemonic, severity, and log message format. To download the guide, click https://www.arista.com/en/support/software-download and look for SysMsgGuide under EOS release Docs.
Perform the following steps to create a rule for generating syslog events:
-
Click Custom Syslog Event.
Figure 17. Custom Syslog Event Screen 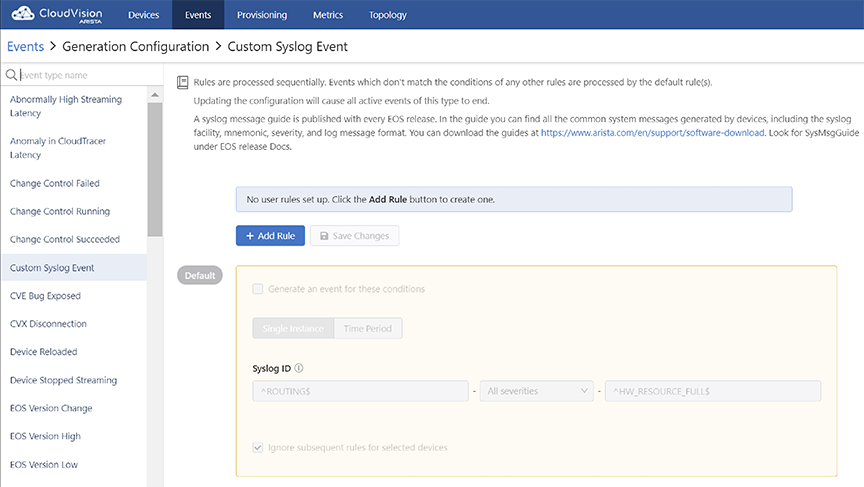
-
Click +Add Rule in the right pane.
A new condition pane is displayed on the screen.
Figure 18. Conditions Pane for the Custom Syslog Event Rule 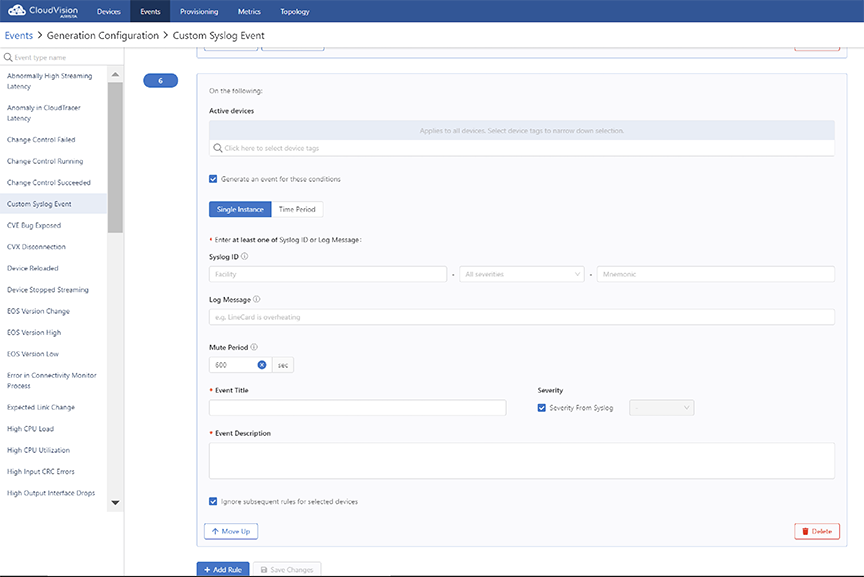
Configuring Single Instance Events
CVP creates a single instance event whenever either the specified syslog ID matches with the device syslog ID or the specified syslog message matches with the device syslog message. See Custom Syslog Events.
Provide the following information in specified fields to configure a single instance event:
- Syslog ID - Provide facility, severity, and mnemonic of a syslog with
regular expressions in the following fields:
- Facility field - Type the facility of syslog in either simple string or regular expression.
- All severities field - Select the severity of the device.Note: If no severity is selected, CVP considers all available severities.
- Mnemonic field - CVP creates a single instance event when the log message specified in this field matches with a device syslog message.
- Log Message field - The log message to match against the device syslog
message.Note: You must mandatorily configure either a syslog ID or a log message.
- Mute Period field - CVP does not create another similar event using this
rule on a given device until the time period specified in this field expires for
the ongoing event. Note: This prevents a large number of events generated for the same device within a short period of time due to a repetitive syslog message.
- Event Title field - Type the event title.
- Severity From Syslog checkbox - Select the checkbox if you prefer CVP to
select the severity of the generated event to be derived from the syslog message
severity.Note: CVP uses the following syslog message severities to event severities:
- [0, 1, 2] - Critical event
- [3] - Error event
- [4] - Warning event
- [5,6,7,...] - Info event
- Severity dropdown menu - Select the preferred severity of the generated event. Severity is configurable only when Severity From Syslog checkbox is not selected.
- Event Description field - Provide the event description.
- Ignore subsequent rules for selected devices checkbox - Select the checkbox to suppress generating events for a specific syslog or override upcoming configurations.
- Move Up / Move Down buttons - Use this button to manage the sequence of configured syslog event rules.
- Delete button - Click to delete the corresponding rule.
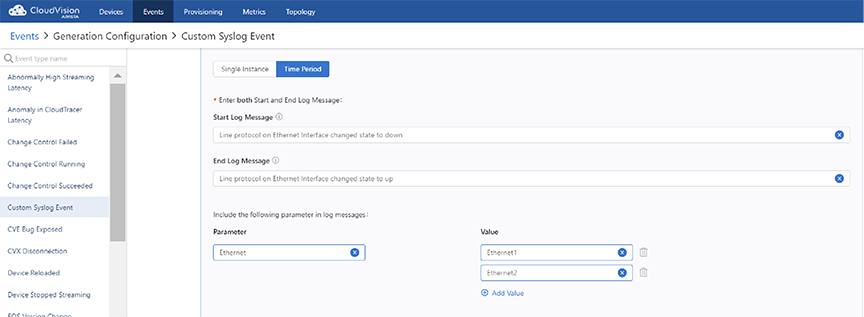
Configuring Time Period Events
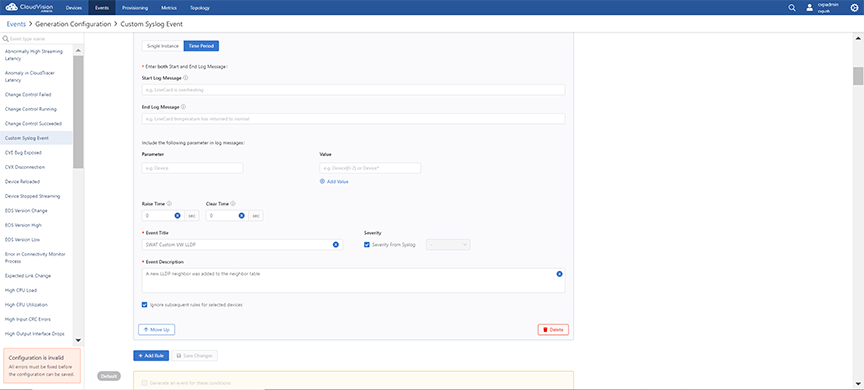
Provide the following information in specified fields to configure a time period event:
- Start Log Message field - CVP starts a time period event when the start
log message specified in this field matches with a device syslog
message.Note: The start log message must be a string without special characters.
- End Log Message field - CVP ends a time period event when the end log
message specified in this field matches with a device syslog message.Note: The end log message must be a string without special characters.
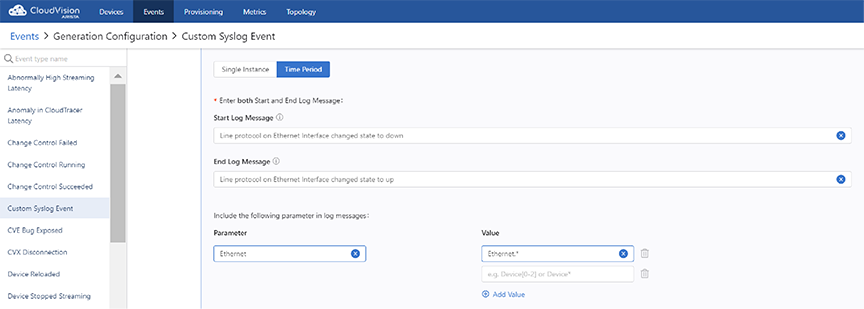
- Parameter field - Type the variable that must be configured in log
messages specified in the Start Log Message and End Log Message fields.
- Value field - Type a variable for the specified parameter in either a simple string or a regular expression.
- Add Value - Click to add another variable for the specified parameter.
In this case, the specified log messages matches with Ethernet1 and Ethernet2 values for either starting or ending an event.
In this case, the specified log messages matches with all ethernet values like Ethernet1, Ethernet1/2, Ethernet1/3, and so on for either starting or ending an event.
- Raise Time field - After a start rule matches, the starting of an event
is delayed for the duration specified in this field. Note: If the end event log message arrives before this delay elapses, the event is not generated. This option is useful in situations where you wish to generate an event only when a syslog condition has persisted for at least some set period of time.
- Clear Time field - After an end rule matches, the ending of the ongoing
event is delayed for the duration specified in this field. Note: If the start event log message arrives before this delay elapses, the event is not ended and will continue as an active event. This option is useful in situations where you wish to generate a long single event which may encompass several start/end conditions being met during a set period of time.
- Event Title field - Type the event title.
- Severity From Syslog checkbox - Select the checkbox if you prefer CVP to
select the severity of the generated event to be derived from the syslog message
severity.Note: CVP uses the following syslog message severities to event severities:
- [0, 1, 2] - Critical event
- [3] - Error event
- [4] - Warning event
- [5,6,7,...] - Info event
- Severity dropdown menu - Select the preferred severity of the generated event. Severity is configurable only when Severity From Syslog checkbox is not selected.
- Event Description field - Provide the event description.
- Ignore subsequent rules for selected devices checkbox - Select the checkbox to suppress generating events for a specific syslog or override upcoming configurations.
- Move Up / Move Down buttons - Use this button to manage the sequence of configured syslog event rules.
- Delete button - Click to delete the corresponding rule.
Rule Labels
Rule Labels are optional conditions in Event Notifications for sending notifications to receiver platforms. Using rule labels allows you to create more complex notification rules in relation to generated events. An event can be generated with a rule label, which is configured and created in Event Generation. That label can be added as a condition to a rule in Event Notifications for sending an alert to a platform receiver.
Creating a Rule Label
A rule label is created in Event Generation, which creates events in CloudVision. The label can be assigned as a condition in a rule for Event Notifications.
-
Add or select a rule in Event Generation.
Figure 22. Add Rule Label 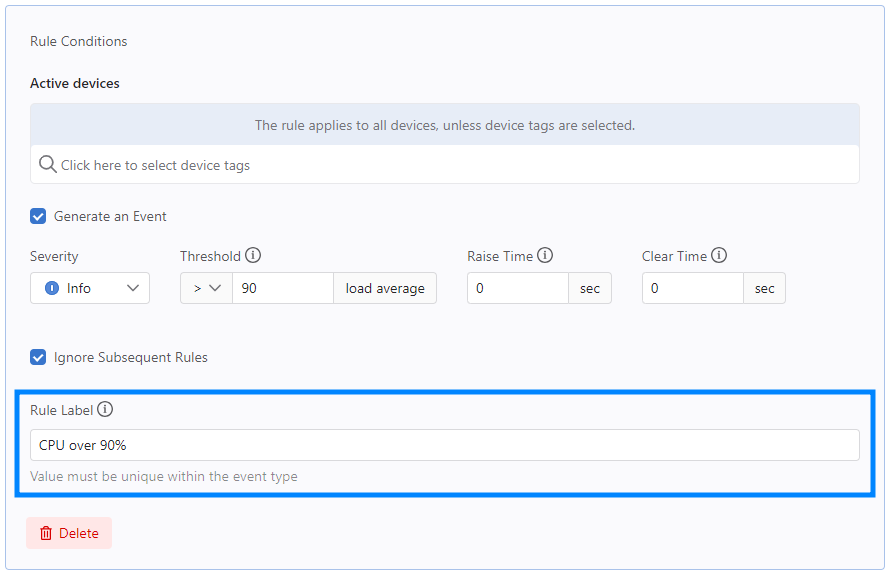
Assigning a Rule Label
You can assign rule labels that have been created in Event Generation to rules in Notifications. When an event is generated with a rule label, notifications will only be sent if the rule label matches the event generated rule label.
The notification rule will only generate an event that has a rule with a label that matches the selected rule label.
-
Add or select a rule in Event Notifications.
Figure 23. Assigning a Rule Label 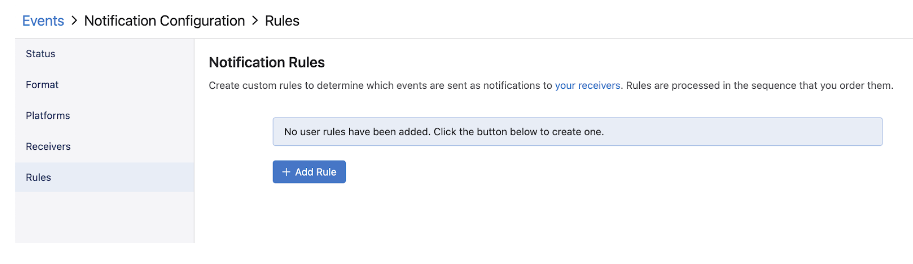
-
Click Rule Labels and select one or more existing rule label.
Figure 24. Notification Rues 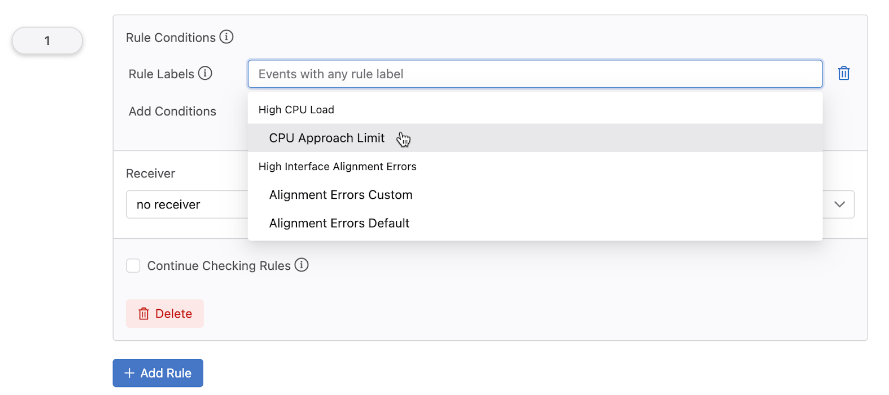
Platform Settings Overrides
When adding a receiver in Event Notifications, you can override existing platform settings in Platforms. This allows you to add default platform settings in Platforms and then use different settings when creating a receiver. You can have multiple settings for the same platform on a per-receiver basis.
Upon completion for the following steps, the receiver will use the override settings instead of the default settings created in Platforms.
-
Add or select an existing receiver.
Figure 25. Add or Select an Existing Receiver 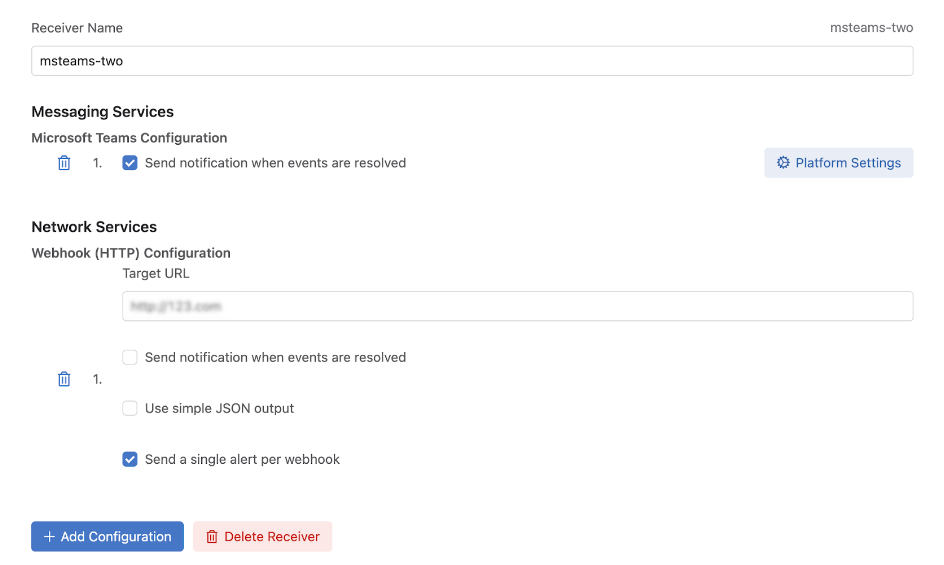
-
Enter custom settings for the selected platform.
Figure 26. Custom Settings for Selected Platform 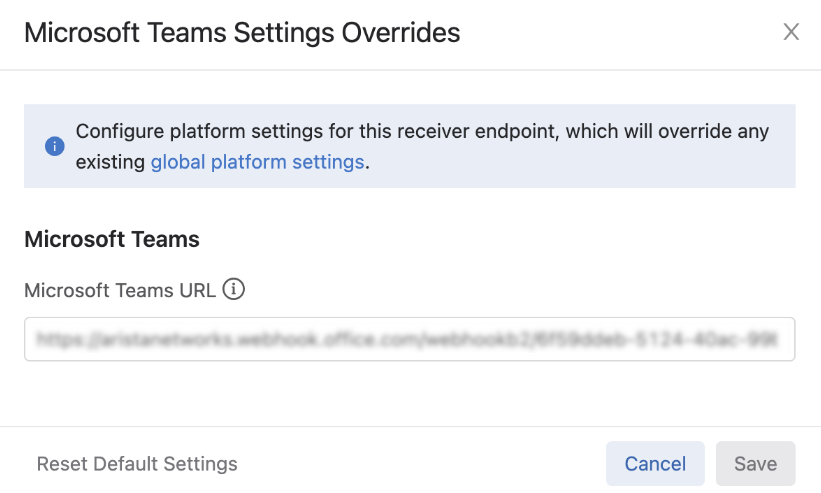
Compliance Events
Events will be generated when a provisioned device’s running configuration or image is out of sync with the designed configuration or image on CloudVision via the system's continuous compliance checker. This can occur when configuration or an image is pushed to a device outside of CloudVision, which prevents CloudVision from being the source of truth for device configuration.
Alerts will continue to be shown in Inventory, Compliance Overview, and Network Provisioning when a device is non-compliant.
Device Running Config Out of Compliance
A Device Running Config Out Of Compliance event is generated when CloudVision detects that a device’s running config is out of sync with its designed config on CloudVision. The event layout will show the running and designed configuration, along with related information about the compliance of the device, including the bug/security advisory exposure of the device.
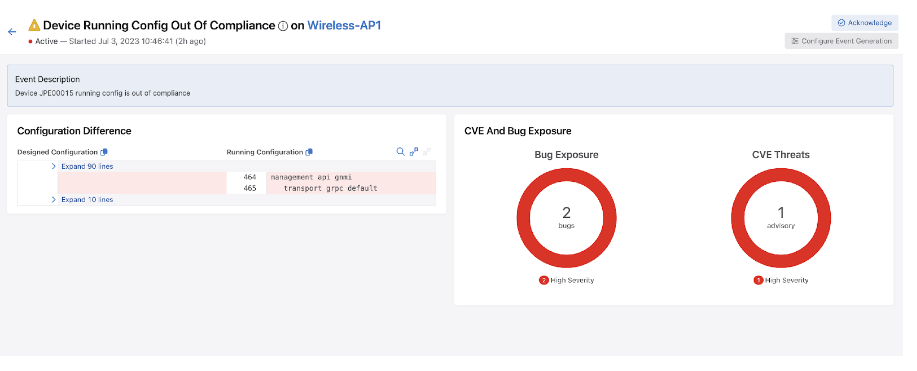
The event has a Warning severity.
Device Designed Config Out of Compliance
A Device Designed Config Out of Compliance event is generated when the designed configuration for a device is out of sync with a device’s running configuration. This occurs when configuration created on CloudVision has not been pushed to a device.
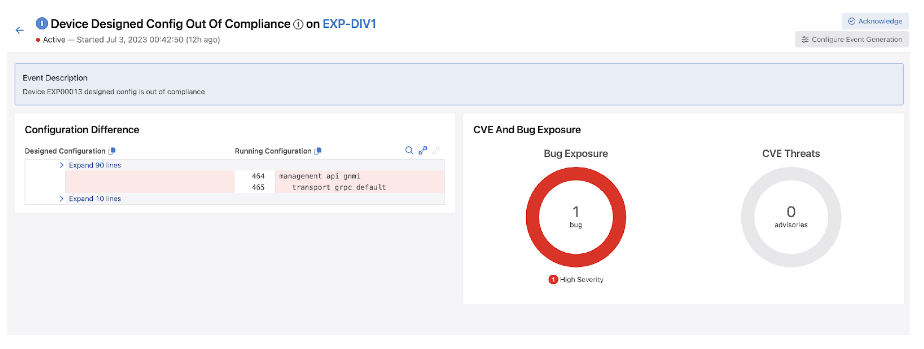
The event has an Info severity.
Device Image Compliance
A Device Image Compliance event is generated when a device’s designed and running image are out of sync. You will need to upgrade the correct image for the device on CloudVision and, if required, push the image to the device.
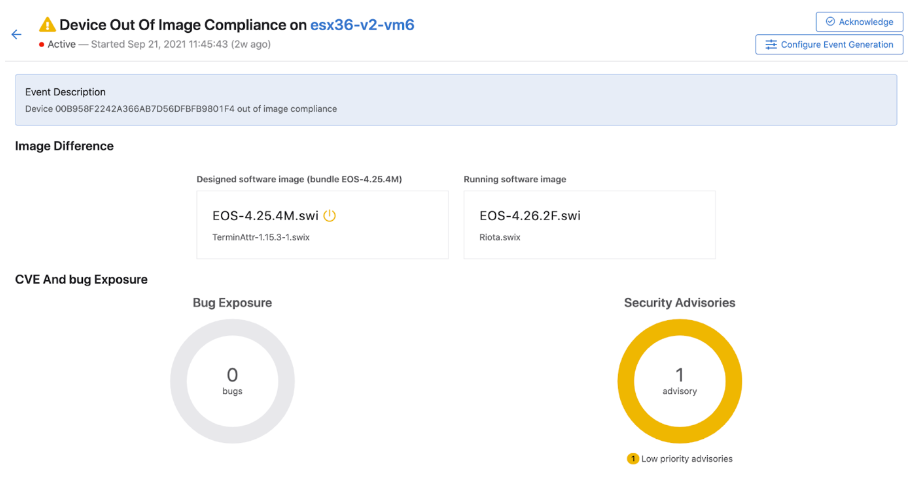
The event has a Warning severity.
Managing Events
Disabling All Events of the Selected Type
Perform the following steps to disable all events of the selected type:
-
Select the
Stop generating events and checking rules checkbox.
The system disables all events of the selected event type.
Figure 30. Disable All Events of the Selected Type 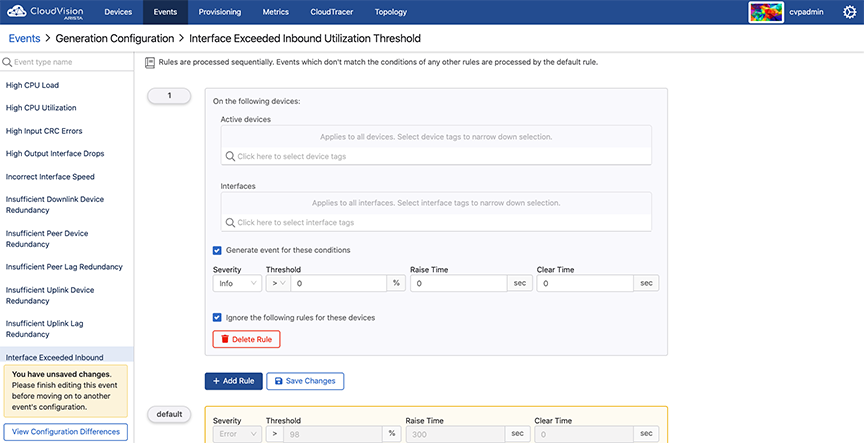
Disabling All Events of the Selected Type with Exception
-
In the appropriate
Conditions pane, select the Stop generating events and
checking rules checkbox. The system creates rule 3.
Note: If you skip steps 5 and 6, the system applies default rules to all device tags except the ones that are defined in rules 1 and 2.
Figure 31. Disable All Events of the Selected Type with Exception .png)
The system disables all events of the selected type except the ones that are defined in rules 1 and 2.
Acknowledging Events
Acknowledging an event confirms that you are aware of the corresponding event and its consequences. By default, acknowledged events are hidden and do not send alerts.
-
Click Acknowledge n in the upper right corner of the side panel.
Note: n represents the count of selected events.The system displays the Acknowledgment Event window.
Figure 32. Acknowledgment Event Pop-Up 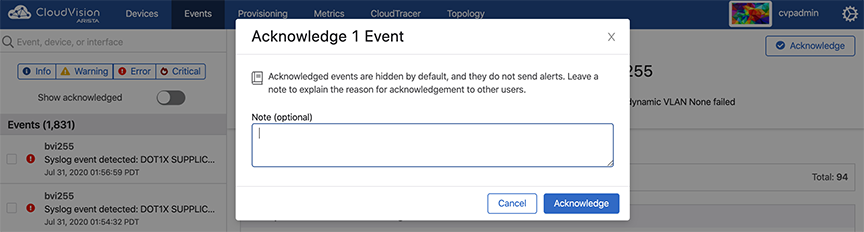
Configuring Notifications
The event alerting system sends notifications for CVP events as they alert operating platforms that you have set up. Once you have customized the topology view for your network, provide the required information to configure the monitoring of notifications.
Perform the following steps to configure event alerts:
Configuring Status
The Status section configures monitoring the health of notification system.
-
Click
Status. The system displays the
Status screen.
Figure 33. Status Screen of Notification Configuration 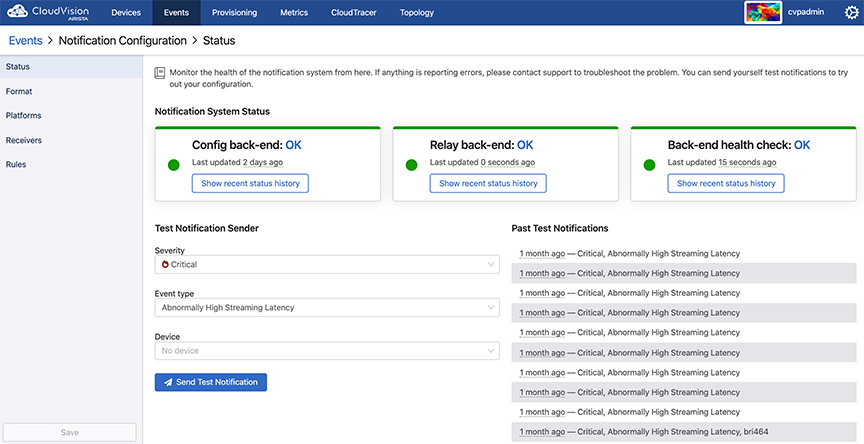
Configuring Platforms
The Platforms section specifies what platforms will receive notifications.
-
Click
Platforms. The system displays the
Platforms screen.
Figure 34. Platforms Screen of Notification Configuration 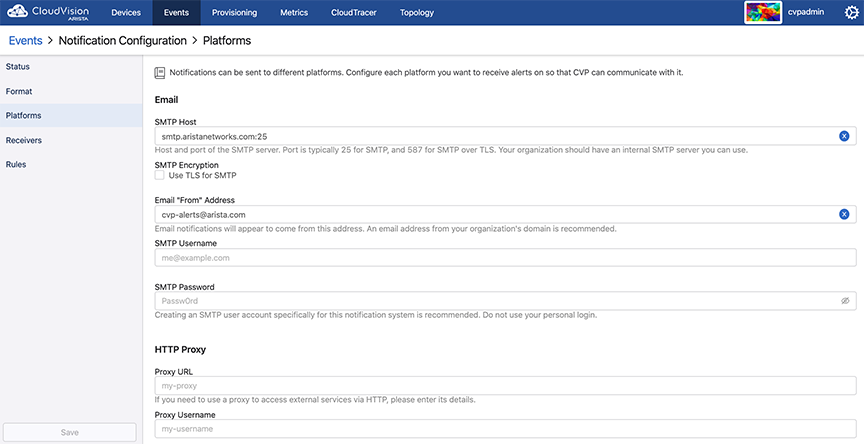
Configuring Receivers
The Receivers section configures a receiver for each preferred team to send notifications and link receivers to notification platforms.
Perform the following steps to add new receivers:-
Click
Receivers. The system displays the Receivers screen.
Figure 35. Receivers Screen of Notification Configuration 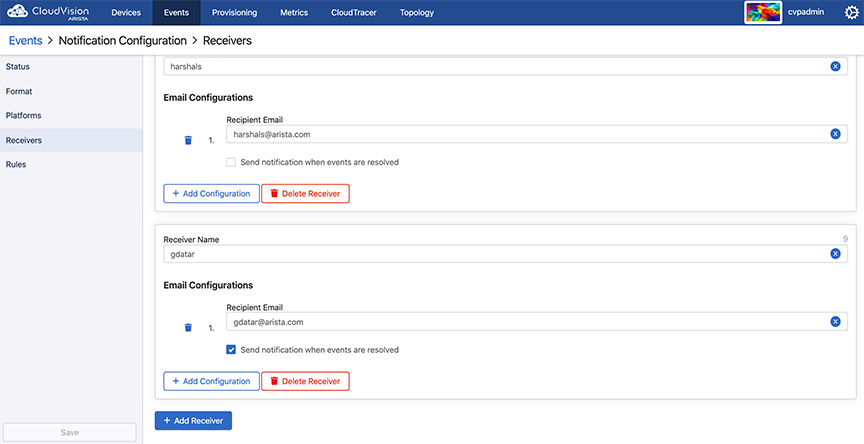
-
Type receiver's name in the
Receiver Name field.
Figure 36. Add Receiver Pane 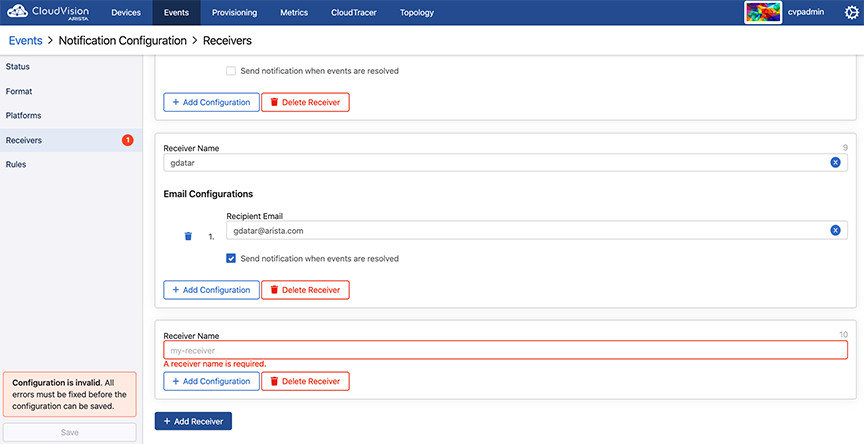
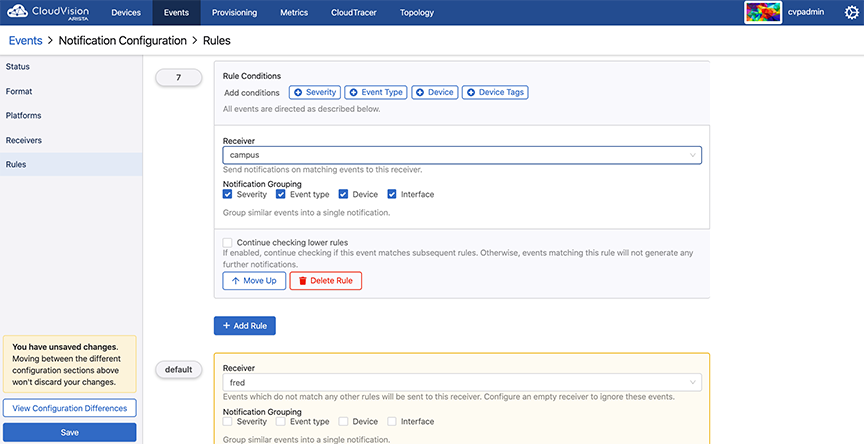
Configuring Rules
The Rules section customizes notifications that are sent to receivers.
Perform the following steps to add a new rule:
-
Click
Rules. The system displays the Rules screen.
Figure 37. Rules Screen of Notification Configuration 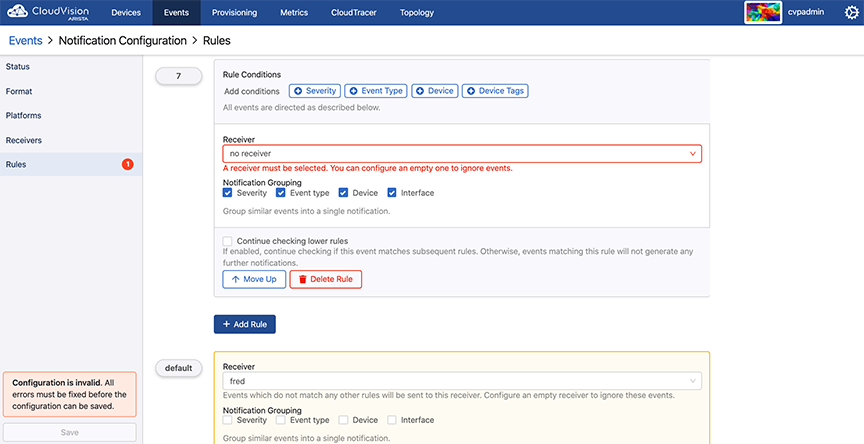
-
Click
Add Rules. A new Rules Conditions pane is displayed on the
screen.
Figure 38. Rule Conditions Pane