Connectivity Monitor andCloudTracer
Accessing the Connectivity Monitor and CloudTracer Screen
To view data metrics, open to the Connectivity Monitor and CloudTracer by selecting the Devices tab and selcting Connectivity Monitor from the left-side menu bar.
This screen is divided into the following two panels:
Right Panel of the CloudTracer Screen
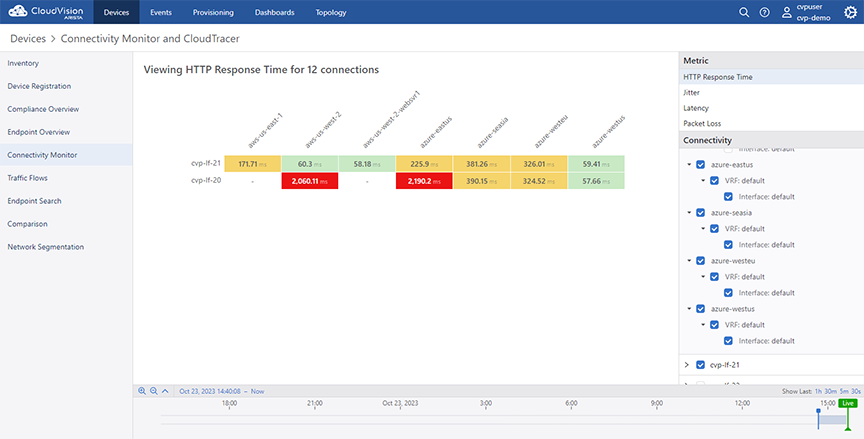
This panel provides the following metric options:
- Metric pane - Click any of the following entities to view the corresponding
current metric for n connections where n is the count of selected devices and
hosts:
- HTTP Response Time
- Jitter
- Latency
- Packet Loss
- Connections pane
- Device or host search string - Type the device or host name for a quick search
- Configured devices - Select the required devices and hosts to view corresponding metrics
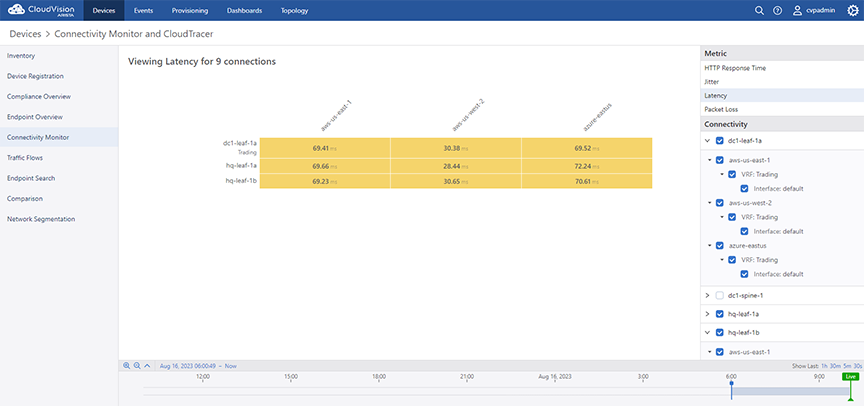
Left Panel of the CloudTracer Screen
This panel displays metrics of selected options in the following ways:
- Current information of the
selected metric type from selected devices and hosts
Note: Metrics are streamed whenever data is gathered on EOS switches. The default interval to query metrics data is five seconds.
- Click on a metric to view detailed information.
- Double click on a metric to view a graph of a selected metric. From the graph you
can select to view:
- Metric History
- Data Table
- Data Paths
- Statistics
- Related Metrics
Connectivity Monitor with VRF Support
Connectivity Monitor with VRF support allows you to configure multiple VRFs for each host and multiple source interfaces within each host on each device.
Viewing Connectivity Monitor with VRF Support
To view Connectivity Monitor with VRF Support, select Connectivity Monitor from the Devices tab.
- Selecting the checkbox next to a VRF name will select all source interfaces on the VRF.
- Selecting the checkbox next to the name of the host will select all VRFs and all source interfaces within each VRF.
- Selecting the checkbox next to the device name will select every host configuration available on the device.
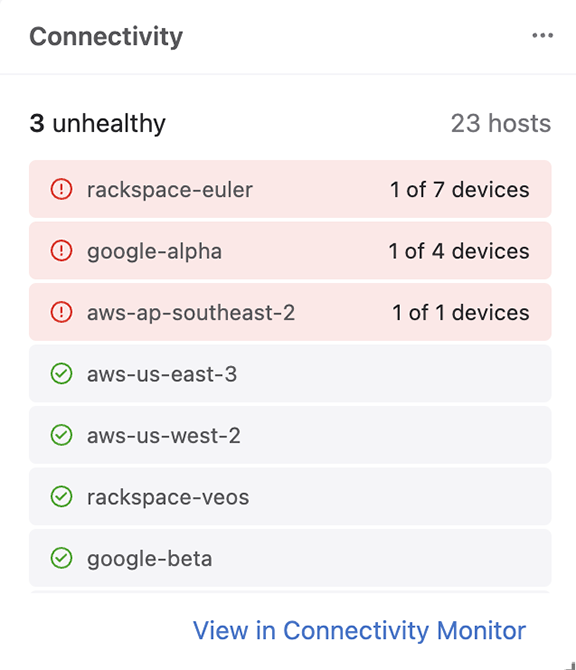
Connectivity Monitor Dashboard
A Connectivity Monitor panel allows you to easily view the health of device connections in Dashboards. The Connectivity Monitor panel displays EOS probes, categorizes connections as either Healthy or Unhealthy, and identifies the number of devices involved. By clicking on an Unhealthy connection, you can view the Connectivity Monitor events related to the connection.
Connectivity Monitor is an EOS agent that tracks connection metrics from an EOS device to any network entity. These metrics are latency, jitter, packet loss, and HTTP response time. Jitter relates to packets rather than bits. Connectivity Monitor must be enabled on devices in order for CloudVision to populate the Connectivity Monitor panel with data. To view the panel, the Campus Features toggle must be enabled in General Settings.
Creating a Connectivity Monitor Dashboard
To create a Connectivity Monitor dashboard panel navigate to Dashboards.
-
Select Summaries from the dropdown.
Figure 4. Select Summaries from the Menu 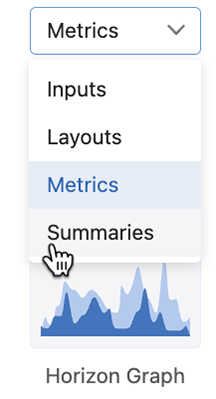
-
Select Connectivity.
Figure 5. Select Connectivity 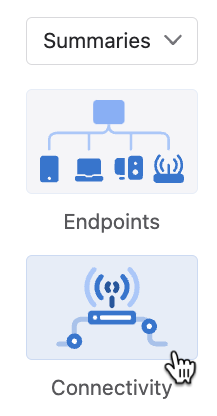
CloudVision will generate a dashboard panel that categorizes connections as either Healthy or Unhealthy and identifies the number of devices involved. By clicking on an Unhealthy connection, you can view the Connectivity Monitor events related to the connection.
Figure 6. Connectivity Monitor Events 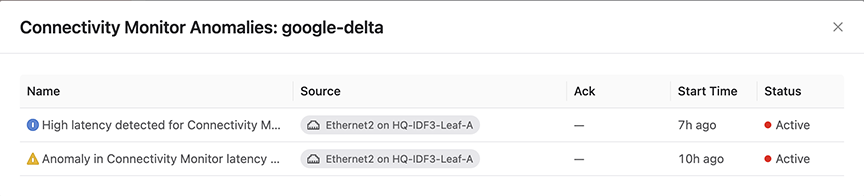
-
Click … Options to make changes to the Connectivity Monitor panel.
Figure 7. Click … Options to make changes 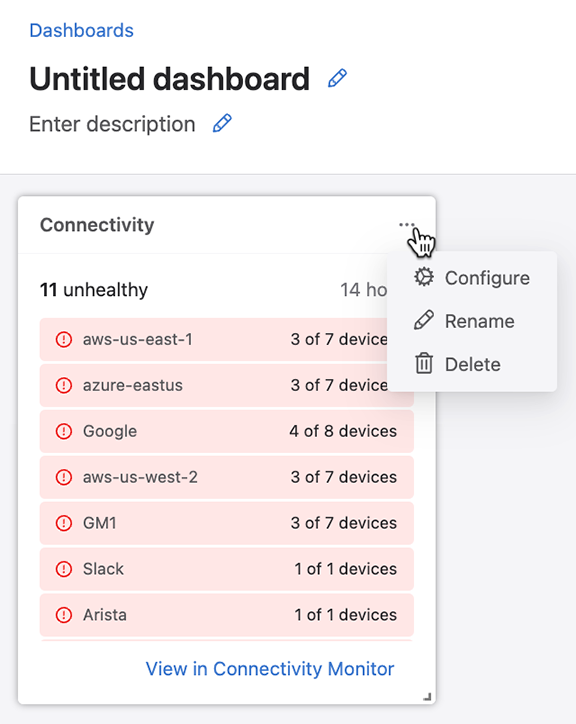
By clicking on the Functionality tab, you can refine the dataset for the panel.
Figure 8. Functionality Tab 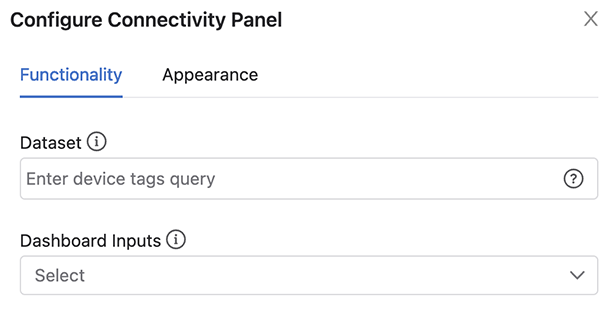
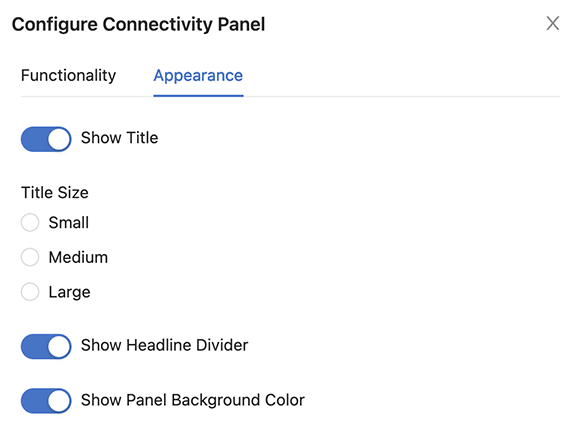
By clicking on the Appearance tab, you can make visual changes to the panel.
Figure 9. Appearance Tab