Main Panel of the Topology Screen
The main panel displays the network topology where devices are grouped into containers according to their connectivity or assigned role in the network.
The icons in the following table represents specified containers:
| Cloud
|
Datacenter
|
Campus
|
| Building
|
Floor
|
Pod
|
| Rack
|
Spine
|


The icons in the following table represents specified devices:
| Switch
|
Wireless Access Point
Note: Blue WAP represents managed devices. Gray WAP represents
unmanaged devices.
|
Management Device Badge
Note: This badge next to a device icon represents a management
device.
|
| Computer
|
Third Party Device
|
Telephone
|


This panel provides the following options for a detailed view:
-
Zoom to fit icon - Click to fit the topology on the screen.
-
Expand containers icon - Click to expand all containers in the topology.
-
Collapse containers icon - Click to collapse all containers in the topology.
- Alternatively, right-click on the main panel to get Expand Network, Expand All,
and Collapse All options.
Figure 1. Right-Click on a Device 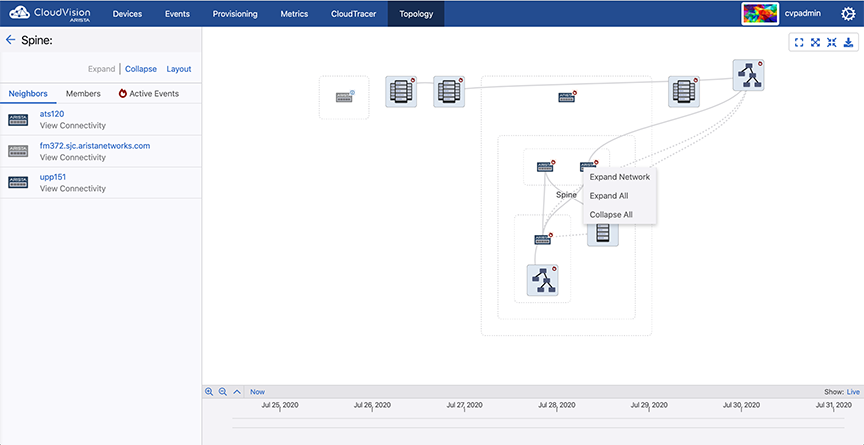 Note: Right-click on a cluster to get cluster specific context menu options.
 - Download icon - Click to open the Export Preview pop-up window. Click Export for
downloading the current topology image to your local drive in either PNG or SVG
formats with selected image resolution.Note: We recommend to select higher resolutions for readable device labels in bigger topologies.
Figure 2. Export Preview Pop-Up Window 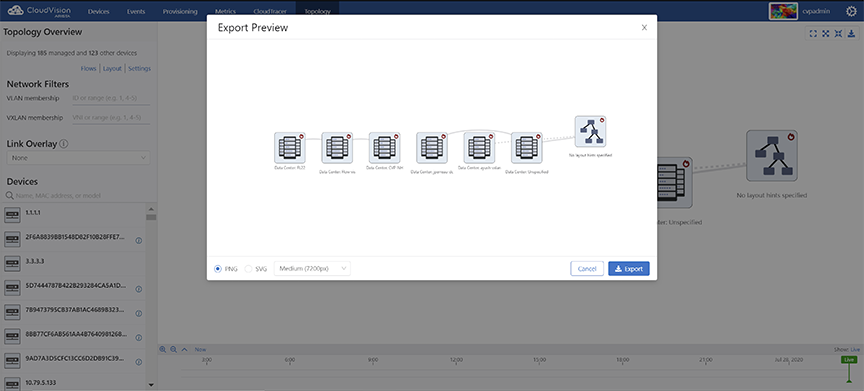
-
Double-click on a container to expand it.
-
To collapse a container, hover the cursor on a dotted rectangular box and click on the displayed hyphen symbol.
Figure 3. Collapse a Container 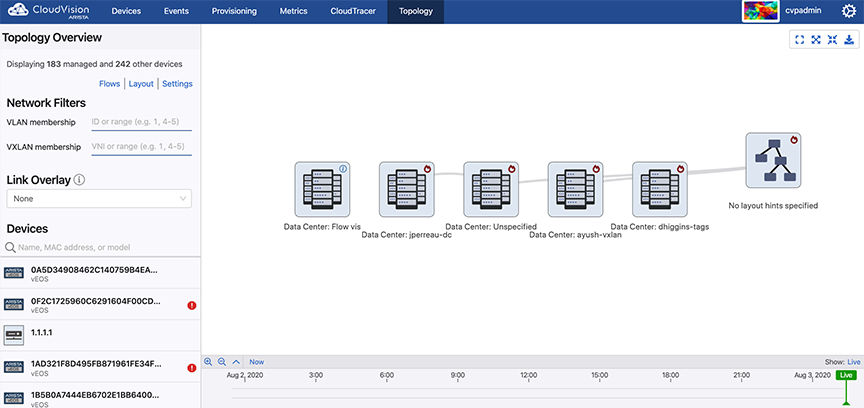
-
Click container component(s) to view corresponding information on the left panel.
-
Selected components are highlighted with dashed frame.
Note: Press and hold the shift key while selecting multiple devices. Press and hold the shift key while dragging to select a region. -
Hover the cursor on a topology component to view the count of corresponding events.
Note: You must enable the option to view events.