Flow Visibility
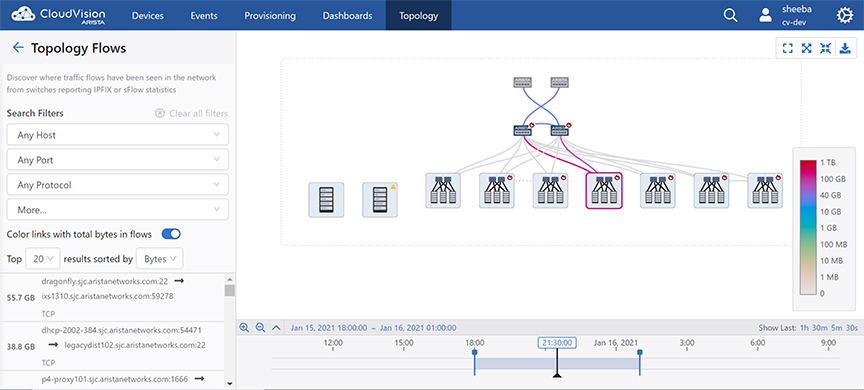
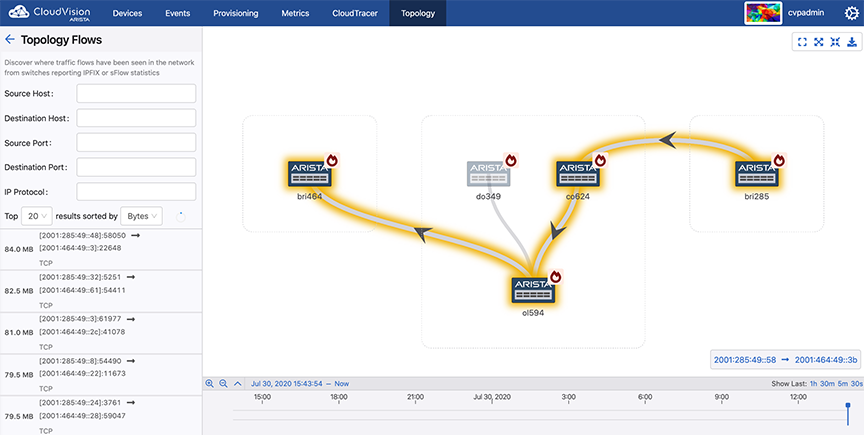
On the Topology Overview pane, click Flows to open the Topology Flows panel. This screen displays traffic flows detected by EOS devices on the network.
- CVP displays traffic flows only when SFLOW or IPFIX are configured on EOS devices.
- For complete flow visibility, flow collectors are required on all devices along the traffic flow path.
The Topology Flows panel provides search filters.
- Data source (Flow Tracking(sFlow or IPFIX) or Inband telemetry
- IP address
- Host
- Port
- Protocol
- VRF
- Latency
- Locality
- The color of the link depends on the corresponding flow metric as displayed on the color chart.
- Hover the cursor on a topology flow to view the flow metric of the corresponding link.
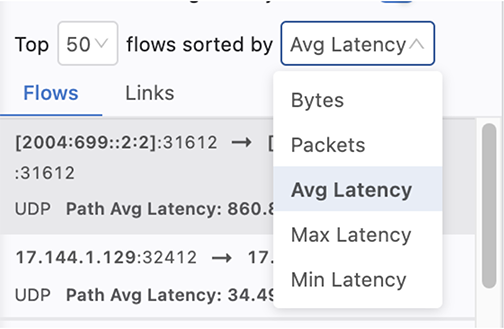
You can limit the count of displayed flows via the options available in the Top menu. Traffic flows sorted by the selected metric (Bytes, Packets, Mean Latency, Max Latency, and Min Latency from the results sorted by menu are displayed on the top of the list.
The listed traffic flows in the side panel displays the five-tuple information. The arrow indicates the direction of traffic flow.
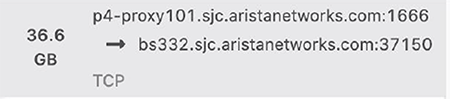
In this example, TCP protocol is used in the traffic flowing from p4-proxy101.sjc.aristanetworks.com via 1666 port to bs332.sjc.aristanetworks.com via 37150 port. 36.6GB of data is flown over the given time window.
Flows are displayed based on the timeline selected at the bottom of the Window. To search previous flows, select an earlier time by either using the timeline's time selector, or by dragging the displayed time window to a different position.
Flow Highlight
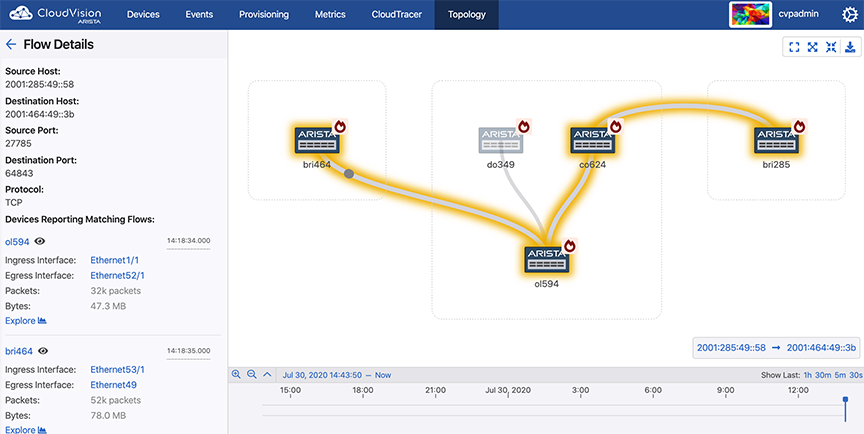
Clicking on a listed traffic flow result highlights the nodes and edges in the graph where the flow has been seen. Animated dots indicate the direction of the traffic flow.
- In environments that capture flow data through sFlow, devices may not capture short-lived or small flows, especially if the selected time window is small.
- This highlight does not guarantee to capture the exact path; it just displays all the devices and links where that flow was seen in the given time window.
The Devices Reporting Matching Flows section displays the five-tuple information and lists devices that reported the flow. Each device entry includes the ingress and egress port-channels, ingress and egress interface, packets, bytes and the timestamp when this flow was seen given the time window.
- Eye icon to magnify the device on the main panel
- Device hostname to view the Device Overview page
- Interface to view the Interface Overview page
- Explore button to view this flow on the Traffic Flows section
Flow Animation
To view traffic flow animation, click Settings on the Topology Overview panel and enable it using the Enable traffic flows animation toggle button.
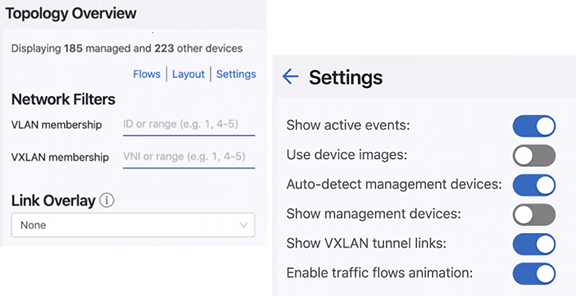
If traffic flow animation is disabled, animated dots are replaced with static arrows indicating the direction of flow.
Links Panel
The Links panel is accessible via clicking the Links tab and displays the topology connections where the top traffic flows have been seen.