Viewing Device Details
From the Inventory screen, you can quickly drill down to view details about a particular device by clicking the device icon. In the tabular view, click the device name to view the corresponding device details.
The screen refreshes to show the device-state data streamed from the device to CVP.
.png)
Device details include the information on overview, system, compliance, environment, switching, routing, and interfaces.
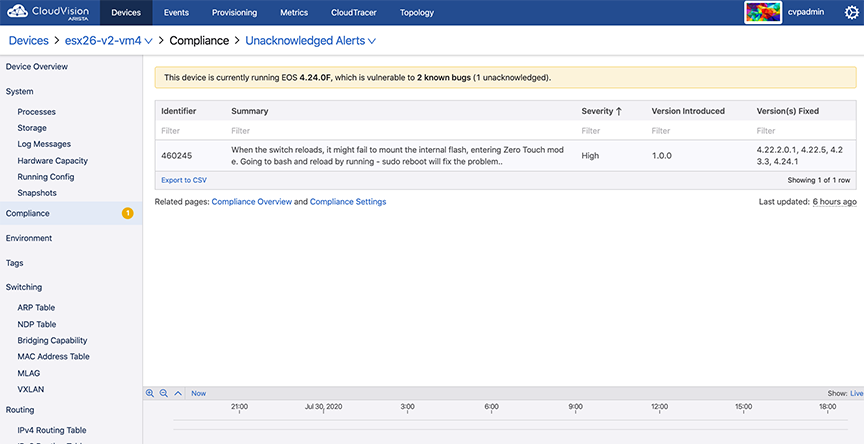
Compliance
The Compliance section provides information on vulnerability to known bugs.
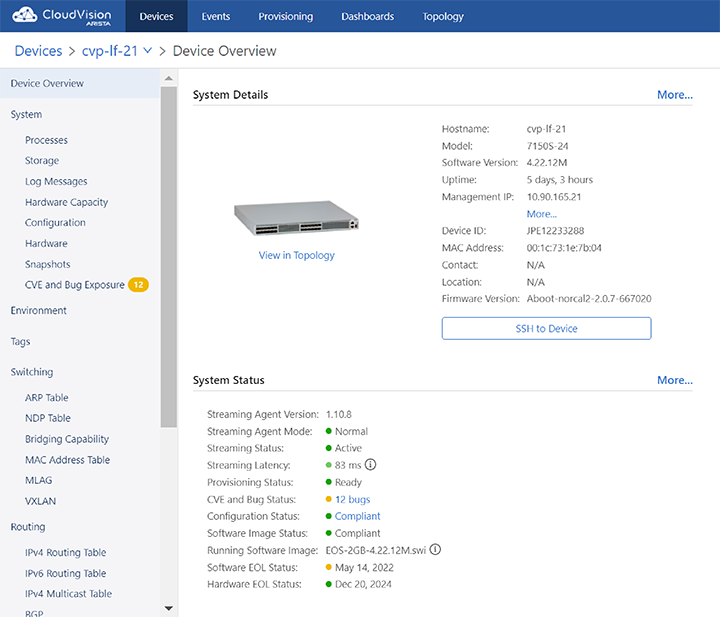
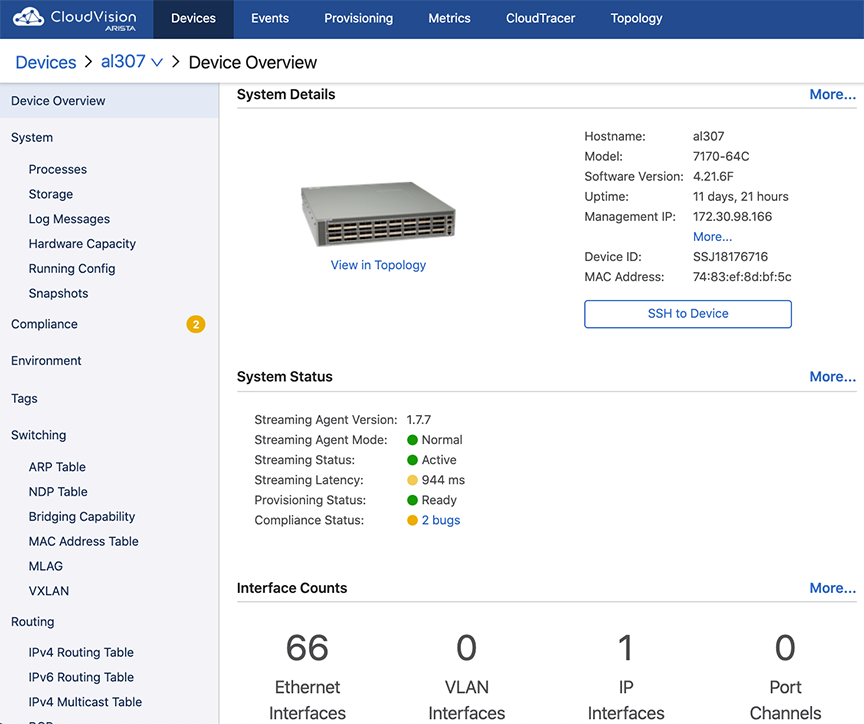
Device Overview
The Device Overview section provides an overview of system details, telemetry status, and interface counts. Click More to reach corresponding sections for detailed information.
The Historical Comparison sub-section provides the information on EOS version, 5-minute CPU load average, MLAG status, IPv4 attached routes, IPV4 learned routes, configured BGP, IPv6 attached routes, IPV6 learned routes, and MAC addresses learned.
The system displays only Device Overview and System information for third-party devices.
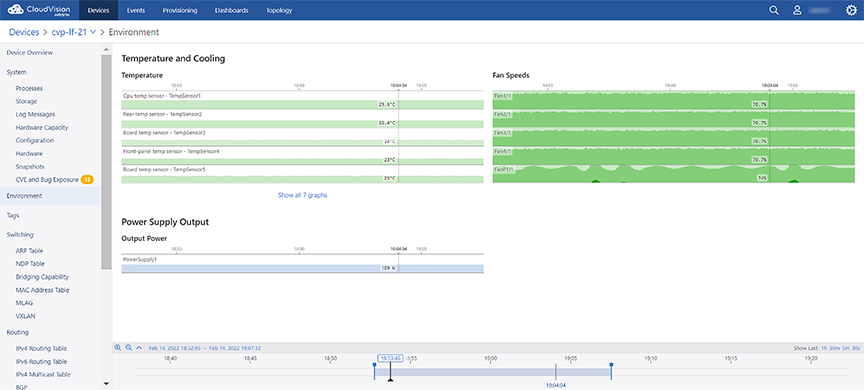
Environment Details
The Environment section provides statistics on temperature, fan speeds, and output power.
Switching Information
The Switching section provides the count of VLANs in which MAC address learning is enabled, count of total VLANs, count of configured VLANs, and detailed information on configured VLANs.
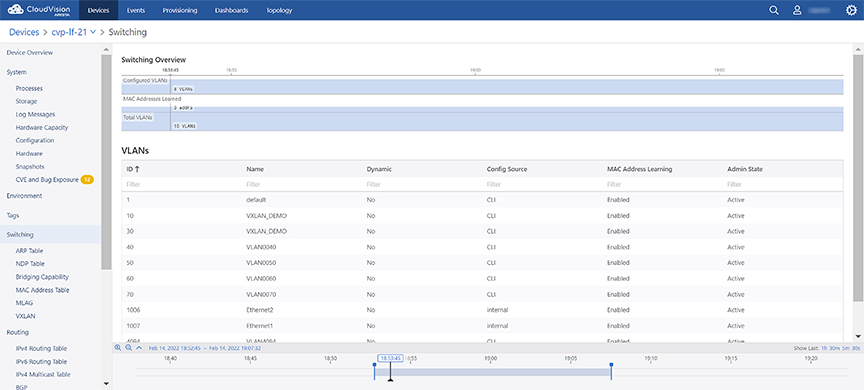
Sub-sections provide switching data like ARP table, NDP table, bridging capability, MAC address table, MLAG, and VXLAN.
Routing Information
The Routing section provides statistics on IPV4 route count by type, IPv6 route count by type, and routing statistics by VRF.
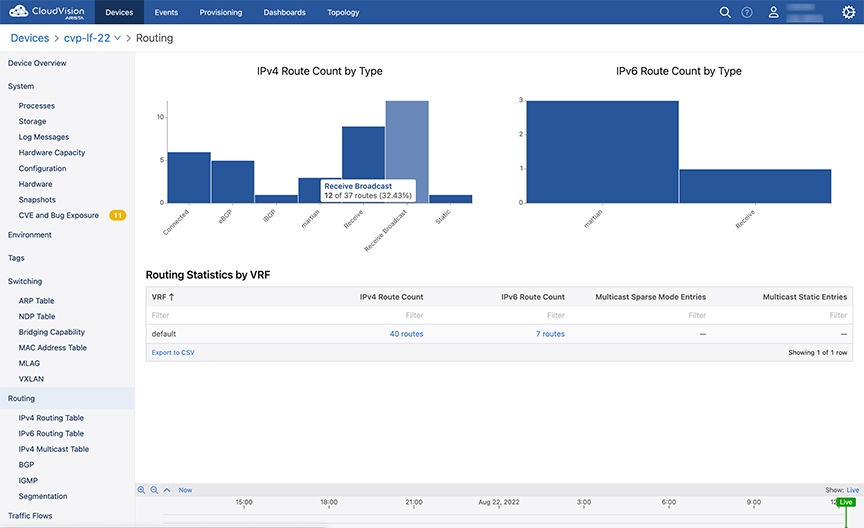
Sub-sections provide routing data like IPv4 and IPv6 routing tables, routing table changes, multicast data like sparse mode PIM and static, and BGP information.
System Information
The System section provides an overview of device details, telemetry status, and PTP status.
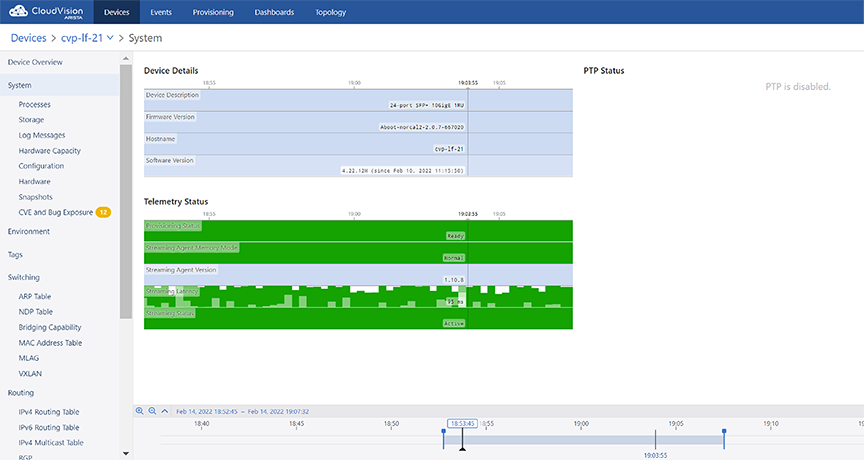
Sub-sections provide information on processes, storage, log messages, hardware capacity, running config, and snapshots.
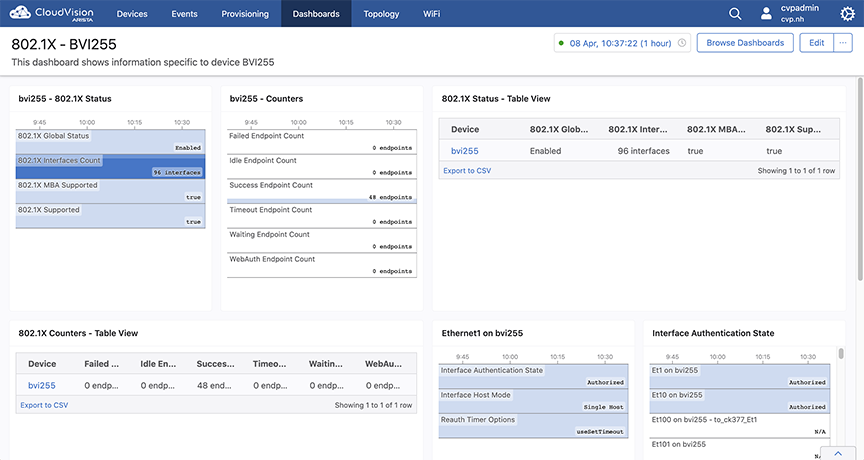
802.1X Metrics
802.1X information shows which endpoints have authenticated, are undergoing authentication, or have failed to authenticate to the network. This information is available to view primarily from the 802.1X page in the Devices application.
Accessing 802.1X Metrics
To access 802.1X Metrics From the Inventory screen in the Devices tab, select a device. In the scrolling menu on the left side of the page, select 801.X. The 801.X Metrics page is displayed.
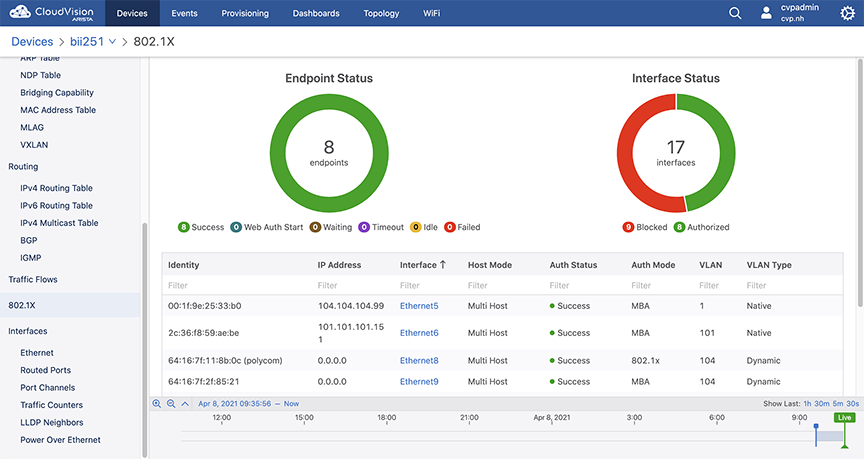
The graphs display the total number of interfaces and the status of each.
- Identity: the MAC address of the endpoint. The username, if provided, is displayed in parenthesis.
- IP Address: the IP address of the endpoint.
- Interface: which interface the endpoint is on. Selecting the interface will display a table showing all of the endpoints on that specific interface.
- Host Mode: the host mode of the endpoint (Single-Host, Multi-Host, Multi-Host Authenticated) with an optional Mac-Based VLAN Assignment. Place the cursor over Mac-Based VLAN Assignment to display the full name.
- Auth Status: the authentication status of the endpoint.
- Auth Mode: how the endpoint is authenticated.
- VLAN: the VLAN the endpoint is on.
- VLAN Type: the type of VLAN being used.
802.1X Dashboard View
802.1X metrics is also available from the Dashboard View. Refer to Dashboards for more information about creating a dashboard.
Viewing Traffic Flows
To view the data on traffic flows, you must enable traffic flow tracking in devices to get data. See Enabling Traffic Flow Tracking.
Enabling Traffic Flow Tracking
Enabling flow tracking on a device allows CloudVision to provide a detailed breakdown of the forwarded network traffic. Traffic flow tracking is enabled through either of the following methods:
Enable sFlow Sampling on a Device
Arista switches provide a single sFlow agent instance that samples ingress traffic from all Ethernet and port channel interfaces.
Run the following commands to enable sFlow sampling on a device:
switch(config)#sflow sample <sampling rate>
switch(config)#sflow polling-interval <polling interval>
switch(config)#sflow destination 127.0.0.1
switch(config)#sflow source-interface <source interface>
switch(config)#sflow run
sFlow monitors a random sample of packets at the configured sampling rate. Reported bandwidth and packet measurements are scaled up using the sampling rate to provide estimates of actual bandwidth usage and packet counts.
Enable Hardware Based IPFIX Flow Tracking
Arista switches also allow exporting flow information using the IPFIX format.
Run the following commands to enable hardware based IPFIX flow tracking:
switch(config)#flow tracking hardware
switch(config)#!
switch(config)#tracker <tracker name>
switch(config)#record export on inactive timeout <inactive timeout>
switch(config)#record export on interval <interval>
switch(config)#record format ipfix standard timestamps counters
switch(config)#!
switch(config)#exporter <exporter name>
switch(config)#collector <loopback interface ip>
switch(config)#local interface <loopback interface>
switch(config)#template interval <interval>
switch(config)#no shutdown
switch(config)#exit
switch(config)#interface <interface>
switch(config)#flow tracker hardware <tracker name>
switch(config)#no shutdown
Accessing the Global Traffic Flows Screen
To view the global traffic flows screen, navigate to Devices > Traffic Flows on the CloudVision portal. This screen displays information about traffic flows captured by all devices on the network with flow monitoring enabled.See the figure below.

Use the following search filters for customised presentation of the traffic flows data:
-
Host filters
-
Source Hosts
- Show autocomplete field - Provide hostnames, IP addresses, or subnets in CIDR notation of the source host that needs to be displayed
- Hide autocomplete field - Provide hostnames, IP addresses, or subnets in CIDR notation of the source host that needs to be concealed
-
Destination Hosts
- Show autocomplete field - Provide hostnames, IP addresses, or subnets in CIDR notation of the destination host that needs to be displayed
- Hide autocomplete field - Provide hostnames, IP addresses, or subnets in CIDR notation of the destination host that needs to be concealed
- Bidirectional checkbox - Select the checkbox to view the traffic
flows between specified hosts.Note: When you select the Bidirectional checkbox, the Source Hosts and Destination Hosts fields change to Hosts and To/From Hosts.
-
-
Port filters
-
Source Ports autocomplete field - Provide port numbers or service names of the source port
-
Destination Ports autocomplete field - Provide port numbers or service names of the destination port
- Show/Hide dropdown - Select either Show or Hide to view or conceal the traffic flow data of specified source and destination ports respectively.
- Bidirectional checkbox - Select the checkbox to view the traffic
flows between specified ports.Note: When you select the Bidirectional checkbox, the Source Ports and Destination Ports fields change to Ports and To/From Ports.
-
-
Protocol filter - Provide IP protocols of the required traffic flow data in the autocomplete field.
Select either Show or Hide to view or conceal the traffic flow data of specified protocols respectively.
-
More filters
-
Locality - Select Public and Private checkboxes to view traffic flows of corresponding networks
- Fragmentation checkbox - Selecting the checkbox displays only flows with fragmented packets
-
-
Clear all filters - Clears all specified filters
- Top dropdown menu - As per your selection, the top n items are displayed for each break down.
- by dropdown menu - Select the required method to measure traffic.
- Click the View in Topology link to see the data from the perspective of the topology flows view.
- The refresh icon provides countdown in seconds for refreshing the traffic flow data. The data in live mode gets updated every 30 seconds.
Charts View
The Charts display option presents the summary of global traffic flows in charts. The traffic flow data is arranged based on the breakdown selected from the dropdown list. See the figure below.
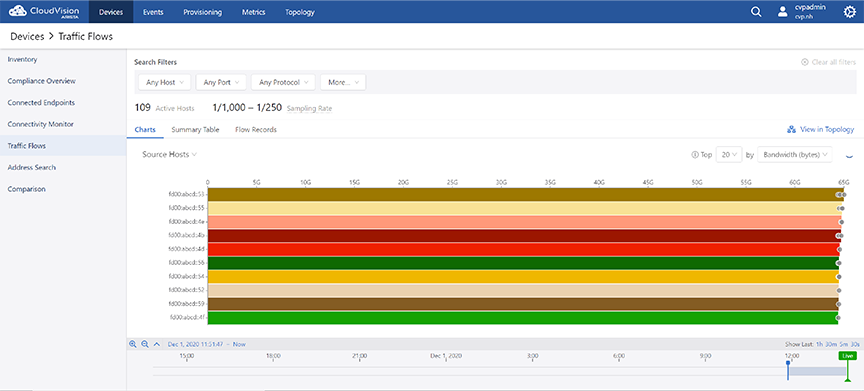
Bar charts represent the device specific traffic flows over the selected time period. The bar length represents the traffic flow of a device with highest usage.
-
Click on a bar in the bar chart in the stacked graph to set the clicked-on item as a filter wherever it is possible. For example, hosts or ports of source and destination.
- Hover the cursor on the dot in a bar to find the observing device.
Summary Table View
The Summary Table display option presents the summary of global traffic flows in a tabular format. See the figure below.
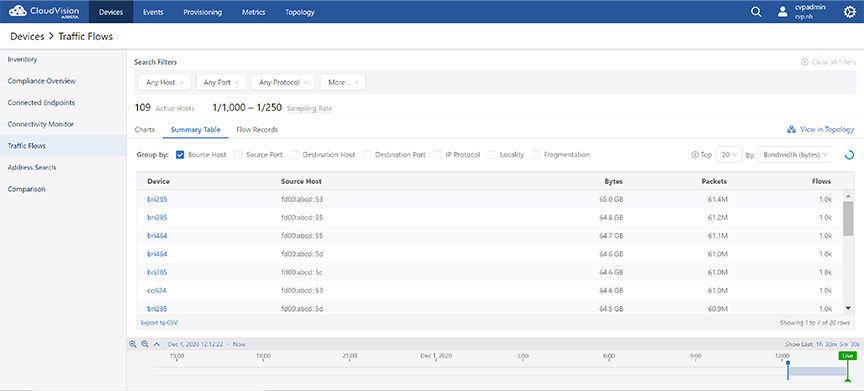
The traffic flow data is grouped based on the selected breakdowns. If multiple options are selected in the Group By field, the table displays a summary of usage statistics that is broken down according to the selected criteria. The summary can be sorted by bytes, packets, or flows in descending order.
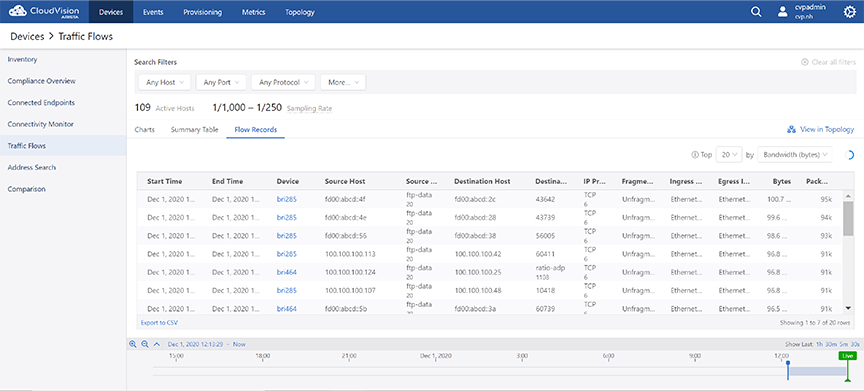
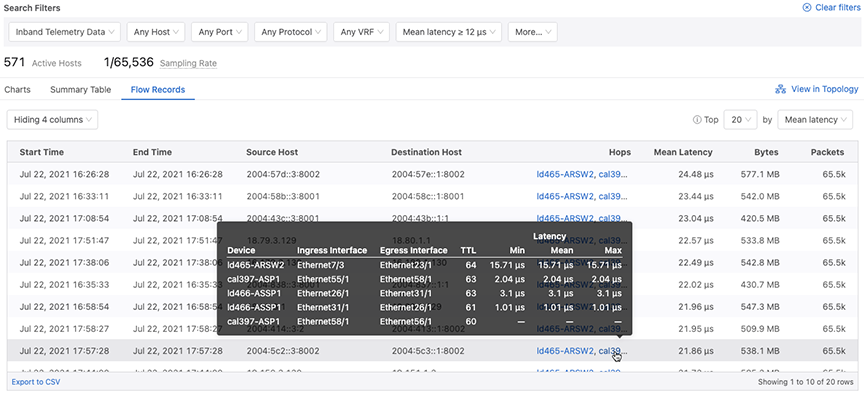
Flow Records View
The Flow Records display option presents the record of all traffic flows in a tabular format. See the figure below.
Accessing the Device Specific Traffic Flows Screen
On the CloudVision portal, navigate to Devices > Inventory > Device_Name > Traffic Flows to view the Traffic Flows screen. See the figure below.
This screen displays the summary of flows, bandwidth, packets, active hosts, and sampling rate. Provide the following details to view custom information of traffic flows:
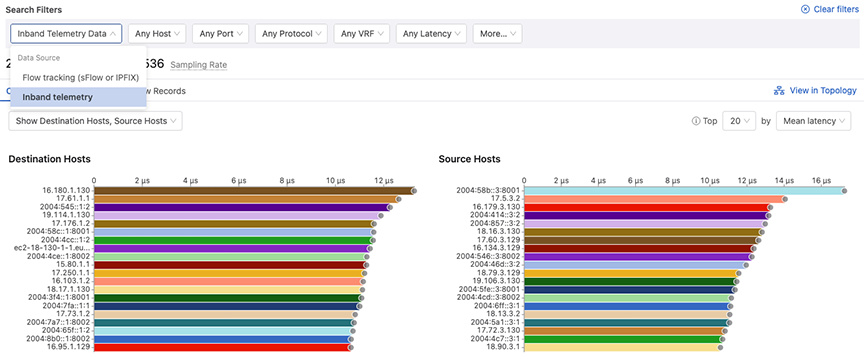
- Inband Telemetry Data
- Flow tracking (sFlow or IPFIX)
- Inband telemetry
-
Host filters
-
Source Hosts
- Show autocomplete field - Provide hostnames, IP addresses, or subnets in CIDR notation of the source host that needs to be displayed
- Hide autocomplete field - Provide hostnames, IP addresses, or subnets in CIDR notation of the source host that needs to be concealed
-
Destination Hosts
- Show autocomplete field - Provide hostnames, IP addresses, or subnets in CIDR notation of the destination host that needs to be displayed
- Hide autocomplete field - Provide hostnames, IP addresses, or subnets in CIDR notation of the destination host that needs to be concealed
-
-
Port filters
-
Source Ports autocomplete field - Provide port numbers or service names of the source port
-
Destination Ports autocomplete field - Provide port numbers or service names of the destination port
- Show/Hide dropdown - Select either Show or Hide to view or conceal the traffic flow data of specified source and destination ports respectively.
-
-
Protocol filter - Provide IP protocols of the required traffic flow data in the autocomplete field.
Select either Show or Hide to view or conceal the traffic flow data of specified protocols respectively
- Interface filters
- Show autocomplete field - Select the interfaces of which the traffic flow needs to be displayed
- Hide autocomplete field - Select the interfaces of which the traffic flow needs to be concealed
-
More filters
-
Locality - Select Public and Private checkboxes to view traffic flows of corresponding networks
- Fragmentation checkbox - Selecting the checkbox displays only flows with fragmented packets
-
-
Clear all filters - Clears all specified filters
- Top dropdown menu - As per your selection, the top n items are displayed for each break down.
- by dropdown menu - Select the required method to measure traffic.
- Click the View in Topology link to see the data from the perspective of the topology flows view.
- The refresh icon provides countdown in seconds for refreshing the traffic flow data. The data in live mode gets updated every 30 seconds.
Charts View
The Charts display option presents the summary of device specific traffic flows in charts. The traffic flow data is arranged based on the breakdown selected from the dropdown list. See the figure below.
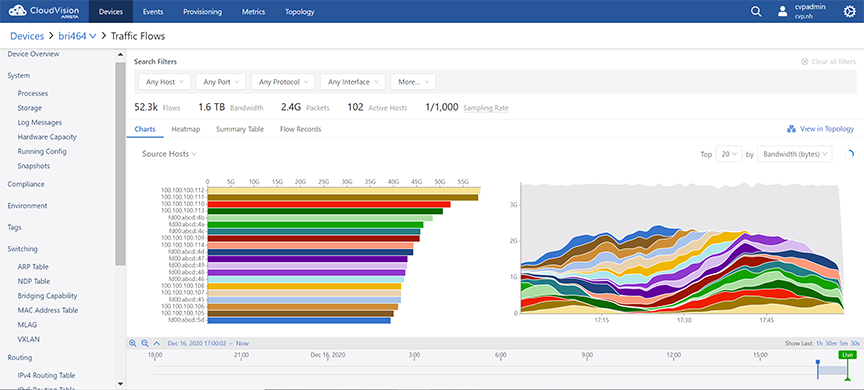
The following information is provided for each break down:
- Bar charts that display the total usage over the time period for
itemsNote: Clicking on a bar in the bar chart or a time series in the stacked graph sets the clicked-on item as a filter wherever it is possible. For example, hosts or ports of source and destination.
- Stacked time series graphs that provide the following information:
- The rate of usage vs. timeNote: This information is provided only when the Sort By option is either Bandwidth (bytes) or Packets.
- The number of flows active vs. timeNote: This information is provided only when the Sort By option is Flow Count.
- The rate of usage vs. time
Charts View
The Charts display option presents the summary of device specific traffic flows in charts. The traffic flow data is arranged based on the breakdown selected from the dropdown list. See the figure below.
The following information is provided for each break down:
- Bar charts that display the total usage over the time period for
itemsNote: Clicking on a bar in the bar chart or a time series in the stacked graph sets the clicked-on item as a filter wherever it is possible. For example, hosts or ports of source and destination.
- Stacked time series graphs that provide the following information:
- The rate of usage vs. timeNote: This information is provided only when the Sort By option is either Bandwidth (bytes) or Packets.
- The number of flows active vs. timeNote: This information is provided only when the Sort By option is Flow Count.
- The rate of usage vs. time
Heatmap View
The Heatmap display option presents the summary of device specific traffic flows in a heatmap. See the figure below.
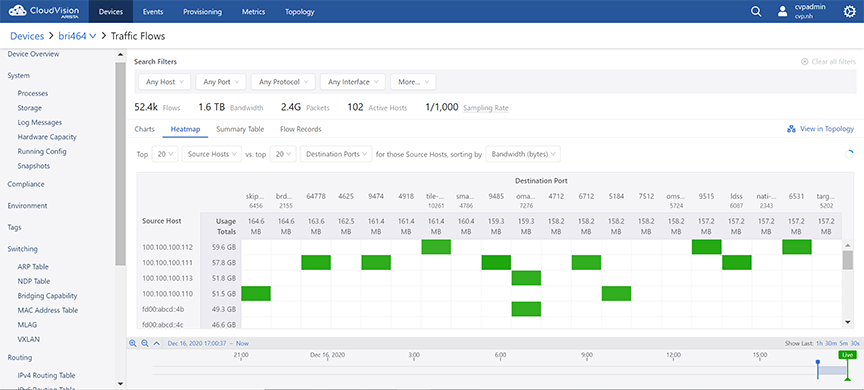
The heatmap plots two breakdowns against each other. For example, the user selects top 20 source hosts vs. top 20 destination hosts. The system displays the top 20 destination hosts that communicated with any of those top 20 source hosts.
Each pairing of source host and destination host is shown as a cell in the grid. Cells are displayed in various shades of green based on their usage. The higher the usage, the darker the green shade.
Summary Table View
The Summary Table display option presents the summary of device specific traffic flows in a table. See the figure below.
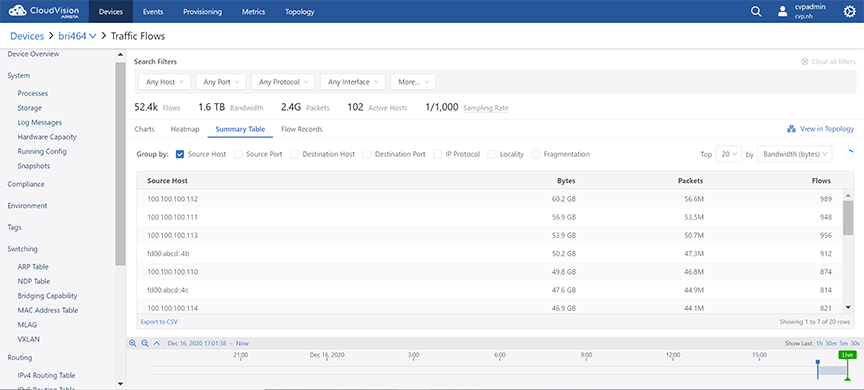
The traffic flow data is grouped based on the selected breakdowns. If multiple options are selected in the Group By field, the table displays a summary of usage statistics that is broken down according to the selected criteria. The summary can be sorted by bytes, packets, or flows in descending order.
Flow Records View
The Flow Records display option presents the record of device specific traffic flows in a tabular format. See the figure below.
When viewing individual flow records, the path of a flow, complete with ingress and egress interfaces, TTLs and latencies for each hop, can be inspected using the Hops column.
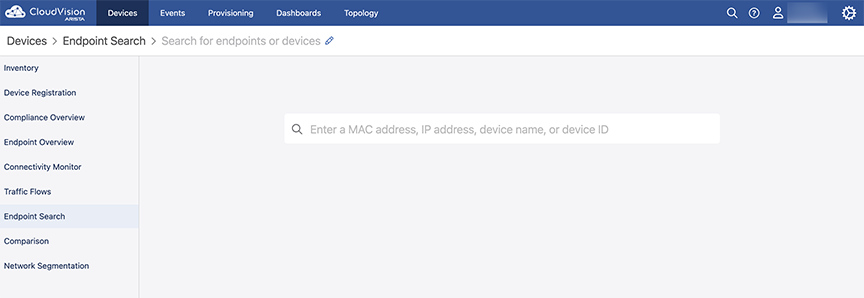
Address Search
Address Search supports searching MAC addresses, IP addresses of all formats,device IDs, and hostnames of inventory devices.
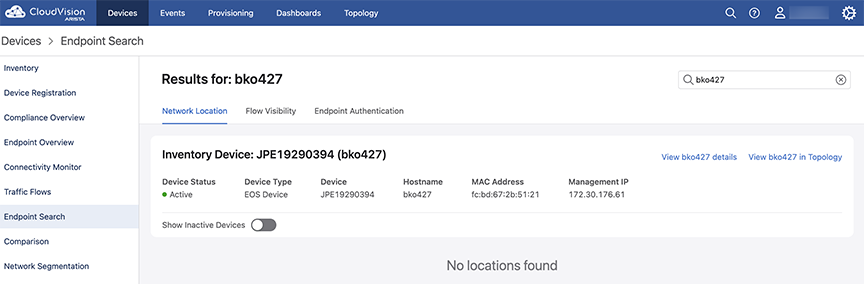
The Address Search page can be found in the primary Devices view on the sidebar. Navigating to it will open the Address Search page.
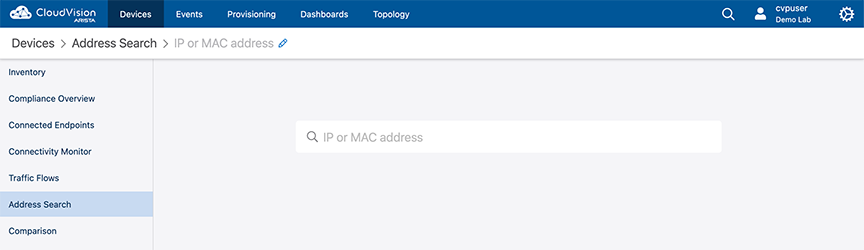
Enter the search information and press Enter to view the search results.
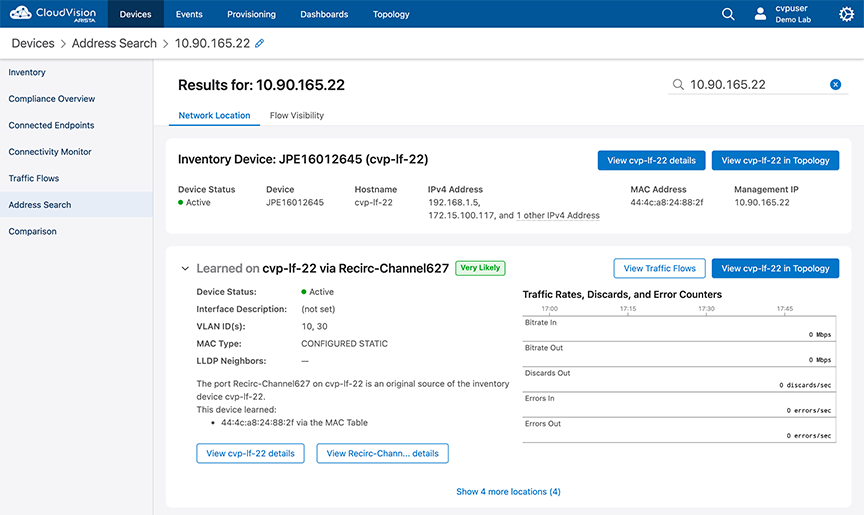
- Network Location is the default view.This view displays detailed information from the MAC, ARP, and LLDP Tables.
- Flow Visibility view displays the traffic that is being sent and received by all IP addresses associated with the search result.
Status of Interfaces
The Interfaces section provides status of Ethernet interfaces, VLAN interfaces, IP interfaces, and port channels.
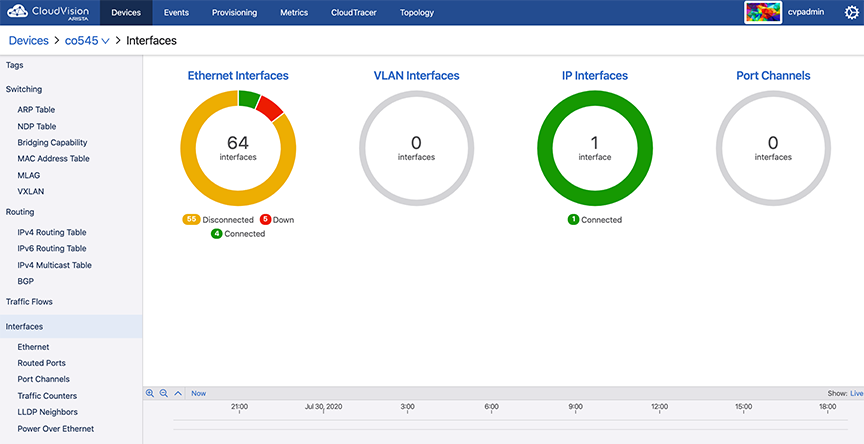
Sub-sections provide detailed information on Ethernet interfaces, routed ports, port channels, traffic counters, LLDP neighbors, and Power Over Ethernet.
Power Over Ethernet
Power Over Ethernet (PoE) is a technology for delivering electrical power along with network data over physical Ethernet connections. Some benefits of PoE are provided below:
- Reduces the need of extension cables and additional outlets
- Provides a reliable power source on difficult terrain
- Prevents data transmission hiccups
- Substantial reductions in space usage, cost, and time
In CloudVision, the Power Over Ethernet screen provides a summary of all interfaces along with information on each interface.
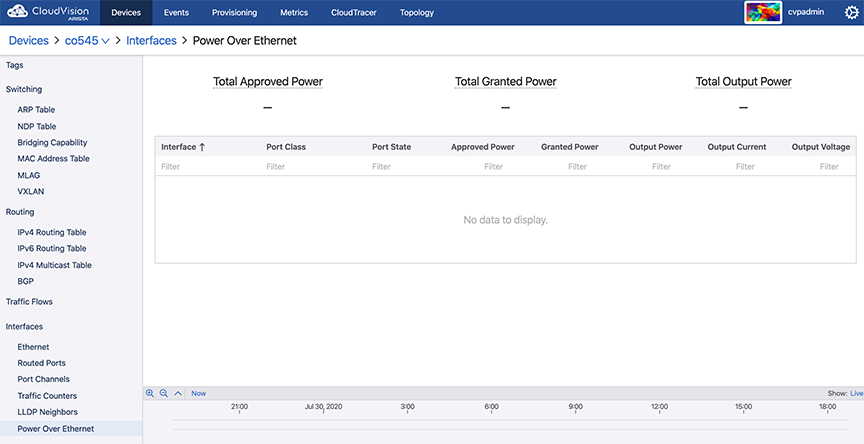
The Power Over Ethernet screen displays the following information:
- Summary of All Interfaces
- Total Approved Power - Sum of the approved maximum power amounts configured for each Ethernet port
- Total Granted Power - Sum of the approved power amounts minus power loss to transmission over Ethernet cables
- Total Output Power - Sum of actual power amounts delivered to each powered Ethernet device
- Information on Individual
Interfaces
- Interface - Interface name
- Port Class - Maximum power in watts (W)
- Port State - Operational status of a PoE device connected to the port
- Approved Power - Configured maximum power output in watts (W) for the interface
- Granted Power - Maximum power available to the device
- Output Power - Power drawn by the device
- Output Current - Current available on the PoE link in milliamps (mA)
- Output Voltage - Voltage available over the PoE link in volts (V)
Viewing 802.1x Details for Endpoint Search
From the 2023.2.0 release onward, you can view additional functionality (Endpoint Authentication tab) when you search for the device details using the Devices > Endpoint Search page from the CloudVision portal. You can view the device details by entering the MAC address, IP address, device name, or device ID in the search window. For example:
Based on the configuration, the device details are displayed, with three tabs: Network Location, Flow Visibility, and Endpoint Authentication. For details on Network Location and Flow Visibility, see the Address Search sections. From the 2023.2.0 release onward, the Endpoint Authentication tab is also visible as in the example here:
The Endpoint Authentication tab displays 802.1x information for the MAC addresses associated with the searched device or endpoint. If there is no 802.1x information for the searched MAC Addresses, a "No data found" page is displayed as here:

If there is 802.1x information associated with the searched MAC address, a card with Operational, AAA, and Quick Links are displayed for that MAC address as in the example here.
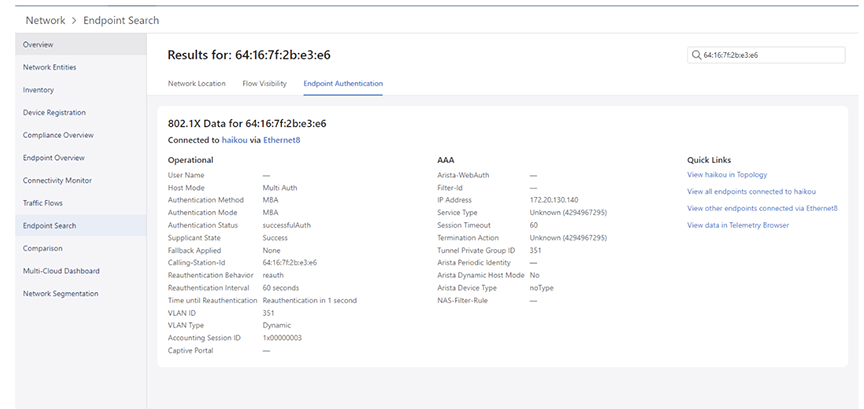
The following 802.1x details are displayed for the searched device or endpoint:
- Operational tab
- User Name
- Authentication Method
- Authentication Mode
- Authentication Status
- Supplicant State
- Fallback Applied
- Calling-Station-Id
- Reauthentication Behavior
- Reauthentication Interval
- Time until Reauthentication
- VLAN ID
- VLAN Type
- Accounting Session ID
- Captive Portal
- AAA tab
- Arista-WebAuth
- Filter-Id
- IP Address
- NAS-Filter-Rule
- Service Type
- Session Timeout
- Termination Action
- Tunnel Private Group ID
- Arista Periodic Identity
- Arista Dynamic Host Mode
- Arista Device Type
- Quick Links tab
- Link to the associated device in Topology
- Link to the Dot1x sections for the associated device
- Link to the Dot1x sections via Ethernet for the associated interface
- Link to the Telemetry Browser to view the additional fields that are not displayed in Endpoint Search